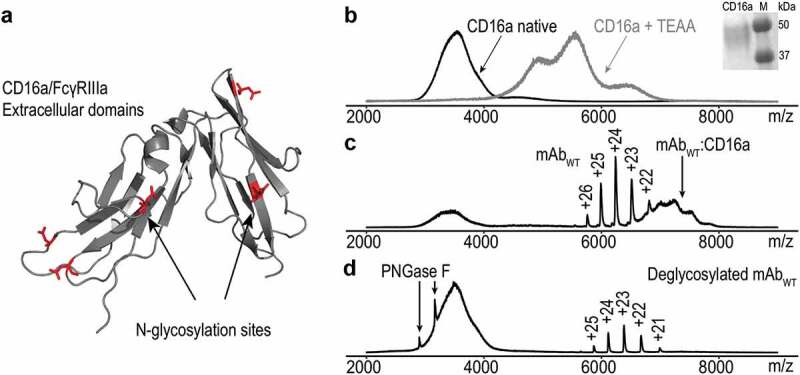
Figure 2.

(a) Ribbon diagram of CD16a/FcγIIIa extracellular domains with 5 potential N-glycosylation sites marked in red (PDB: 1E4 J).27 (b) Native ESI spectra of CD16a in 150 mM ammonium acetate solution, pH 7.4 without/with triethylammonium acetate (black and gray line, respectively). Inset: Evaluation of the MW of CD16 using SDS-PAGE. (c) Attaching CD16a to WT mAb results in a high MW CD16a-WT complex indicated by the black arrow. (d) Deglycosylated WT and CD16a do not form a complex when mixed together in solution. Black arrows show charge states of PNGase F used for deglycosylation procedure.
