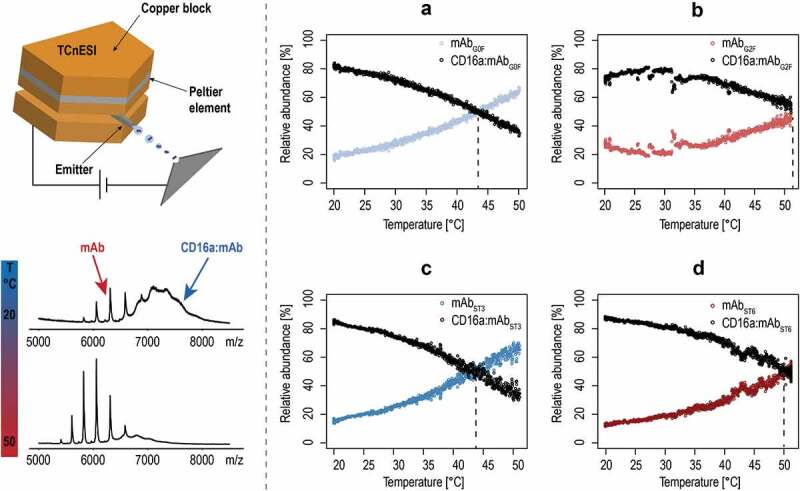
Figure 4.

ESI-MS melting experiments. On the left, the schematic drawing of the TCnESI source with a capillary embedded between two copper blocks is shown. A temperature ramp from 20 to 50°C is applied to the CD16a-mAb complex and release of free mAb is monitored. (a–d) Temperature melting curves of CD16a in complex with different glycovariants. Black dots indicate the relative abundance of the complex, whereas colored dots display the mAb relative abundance as a sum of all individual charge states. Dotted lines indicate the melting points of individual complexes.
