Abstract
Many studies implicate altered cyclic nucleotide signaling in the pathophysiology of major depressive disorder (MDD), bipolar disorder (BPD), and schizophrenia (SCZ). As such, we explored how phosphodiesterases 2A (PDE2A) and 10A (PDE10A)—enzymes that break down cyclic nucleotides—may be altered in brains of these patients. Using autoradiographic in situ hybridization on postmortem brain tissue from the Stanley Foundation Neuropathology Consortium, we measured expression of PDE2 and PDE10 mRNA in multiple brain regions implicated in psychiatric pathophysiology, including cingulate cortex, orbital frontal cortex (OFC), superior temporal gyrus, hippocampus, parahippocampal cortex, amygdala, and the striatum. We also assessed how PDE2A and PDE10A expression changes in these brain regions across development using the Allen Institute for Brain Science Brainspan database. Compared to controls, patients with SCZ, MDD and BPD all showed reduced PDE2A mRNA in the amygdala. In contrast, PDE2A expression changes in frontal cortical regions were only significant in patients with SCZ, while those in caudal entorhinal cortex, hippocampus, and the striatum were most pronounced in patients with BPD. PDE10A expression was only detected in striatum and did not differ by disease group; however, all groups showed significantly less PDE10A mRNA expression in ventral versus dorsal striatum. Across development, PDE2A mRNA increased in these brain regions; whereas, PDE10A mRNA expression decreased in all regions except striatum. Thus, PDE2A mRNA expression changes in both a disorder- and brain region-specific manner, potentially implicating PDE2A as a novel diagnostic and/or patient-selection biomarker or therapeutic target.
Keywords: Allen Institute for Brain Sciences, Brainspan, psychiatric disease, cyclic nucleotide, cGMP, cAMP
1. INTRODUCTION
Major depressive disorder (MDD), bipolar disorder (BPD), and schizophrenia (SCZ) rank among the most debilitating diseases worldwide [1], with overlapping yet distinct symptoms. For example, MDD, BPD, and SCZ are all associated with significant cognitive impairments in psychomotor speed, attention, visual memory, and several domains of executing functioning [2,3]. In contrast, depressive symptoms are a primary component of BPD and MDD but not SCZ; whereas, psychosis is a symptom cluster in the majority of patients with SCZ and BPD but not MDD [4–7]. Genetic and heritability studies suggest the overlapping yet distinct symptomatology of MDD, BPD, and SCZ are likely paralleled at the level of overlapping yet distinct pathophysiology[8]. Symptomatic similarities among these disorders can lead to misdiagnosis and delays in proper treatment[9–11]. Not only does misdiagnosis lead to deficient treatment of these diseases, but so does lack of efficacy (e.g., against cognitive symptoms), treatment-resistance, and intolerable side effects associated with existing medications[12–19]. As such, both disease-specific biomarkers and new therapeutic approaches are needed to improve treatment of these diseases.
Our laboratory focuses on phosphodiesterases, a superfamily of enzymes that break down cAMP and cGMP. A wealth of studies report evidence of altered cyclic nucleotide signaling in MDD, BPD, and SCZ[20–24]. Further, efficacy of currently used medications has been associated with improved cyclic nucleotide signaling[25–28]. This raises the possibility that alterations in PDE function may contribute to disease pathophysiology and represent novel biomarkers or therapeutic targets that could be harnessed in the treatment of these disorders. There are eleven families of PDEs, each with a unique regional distribution in the brain[29,30]. PDE2A and PDE10A have received particular attention in the context of psychiatric disease. PDE2A mRNA is expressed throughout the striatum, hippocampus, amygdala and several cortical regions[29,30], all of which are brain regions implicated in the pathophysiology of MDD, BPD, and/or SCZ. In contrast, PDE10A is greatly enriched in the striatum[29,30]. Both PDE2A and PDE10A inhibitors have been pursued in the clinic due to promising findings in animal models of psychiatric disease, with mixed results (c.f.,[31]). As such, we measured PDE2A and PDE10A mRNA in multiple brain regions of patients with MDD, BPD or SCZ using in situ hybridization to determine if expression of either PDE might change in the context of psychiatric disease. Here we show that PDE2A mRNA, but not PDE10A mRNA, is altered in a disease- and brain region-specific manner.
2. METHODS
2.1. Subjects.
Data were obtained using resources from both the Stanley Foundation and the Allen Institute for Brain Science. Human tissue samples originated from the Stanley Foundation’s Neuropathology Consortium http://www.stanleyresearch.org/brain-research/neuropathology-consortium/ [32,33]. This collection is comprised of tissue samples taken from 15 control subjects, 15 patients with MDD without psychosis, 15 patients with BPD, and 15 patients with schizophrenia. The tissue samples used here were 14 um-thick fresh frozen sections mounted on a 1.5” × 3.0” glass slide.
RNA sequencing data were mined from the 2014 Allen Institute for Brain Science Brainspan Atlas of the Developing Human Brain database, as we previously published[34]. Expression levels across development were assessed for PDE2A (http://www.brainspan.org/rnaseq/searches?exact_match=true&search_term=PDE2A&search_type=gene&page_num=0) and PDE10A (http://www.brainspan.org/rnaseq/searches?exact_match=true&search_term=PDE10A&search_type=gene&page_num=0). We limited analyses to the brain regions that we assessed in the Neuropathology Consortium slides. Methods used for this RNA sequencing study have been previously published [35] and can be found here: http://help.brain-map.org/display/devhumanbrain/Documentation. Based on our previous analysis of PDE9A mRNA expression in these samples [34], we grouped subjects into the following age categories before analyses: prenatal, childhood (2 months-17 years), and adulthood (18–40 years).
2.2. In situ hybridization
Autoradiographic in situ hybridization was carried out as previously described[36]. Slides with 14 μM-thick sections of human superior temporal gyrus, orbitofrontal cortex, inferior temporal region, caudal entorhinal cortex, cingulate, amygdala, hippocampus, and striatum were received from the Stanley Foundation. Slides were stored at −80°. Due to limited capacity of processing resources, only 1 brain region was processed for PDE2A and PDE10A mRNA in a given experiment. Slides including mouse tissue were processed in parallel to verify efficiency of the probe and in situ technique. To obtain this tissue, mice were sacrificed by cervical dislocation, and brains were then frozen in isopentane. Brains were stored at −80° until they were cryosectioned at 20 μM and those sections were thaw mounted on slides and stored again at −80°. Due to the large size and number of the human tissue slides, multiple hybridization trays, slide racks, and film cassettes were required to process all samples for a given brain region. Tissue was processed by experimenters blind to diagnosis; however, a designation of “Group 1”, “Group 2”, “Group 3” and “Group 4” was known in order to ensure all diagnostic groups were equally represented within each hybridization tray, slide rack and film cassette. Slides were brought to room temperature and then were placed in 4% paraformaldehyde (10 minutes). Following this, slides were treated with 0.1 M Triethanolamine/0.9% NaCl (10 minutes). Next, for one minute each, sections were dehydrated through an ethanol series of 50%−80%−90%−100%. Then, sections were defatted in chloroform twice for 5 minutes each and then rehydrated with an ethanol series of 100%−90%−80%−50%-H2O, each for one minute. Following air drying, the slides were placed in hybridization trays. These hybridization trays contained 2X sodium citrate buffer (SSC) in the bottom for moisture. Antisense or sense (negative control) oligonucleotide probes specific to PDE2A (antisense: 5′- AAC TTG CTG AAC CAT GGC CCA TTG ATC TTG TTC AC −3′) or PDE10A (antisense: 5′- CAT ATA TGC ATA TAT ACT GGC TGT TTG AAT TAT GAA TTT A −3′) were labeled with S35-dATPs. 600,000 cpms of probe were added per 100 μL of hybridization buffer (8.4% dextran sulfate/50% formamide/25mM HEPES/1mM EDTA/0.1M DTT/4% salmon sperm/4% poly rA/1X Denhardts solution/0.6M NaCl). 100 μL and 400 μL of labelled hybridization buffer was added to the rodent and human slides, respectively. Each of these slides was covered with a glass coverslip. Slides were incubated overnight in a humid oven R 32° C. Following incubation, slides coverslips were removed with 2X SSC and were washed in 2X SSC twice for 10 minutes each at room temperature, 0.2 SSC twice for 1 hour each at 50° C, and 2X SSC once for 10 minutes again at room temperature. The slides were quickly rinsed in sterile water and 70% EtOH. Slides were opposed to Kodak BioMax MR films for 2 months.
2.3. Densitometry
Densitometry was used to measure the relative optical density (r.o.d.) of selected brain regions and subfields (see Figure S1). Measurements were taken using the Microcomputer Imaging Device (MCID; Imaging Inc., Ontario, Canada). The hippocampal and parahippocampal subfields were defined based on the atlas of Ding et al.[37]. Given the broad expanse of the DG, three samples of the same size were taken and averaged together. Similarly, 2 samples were taken for orbital frontal cortex (OFC) and averaged. Amygdalar nuclei were defined based on the atlas published in Brabec et al.[38]. Background measurements were taken from each slide and were then subtracted from the r.o.d. to account for potential differences in film density. All data were collected by an experimenter blind to group. To account for any non-specific technical differences that might emerge across hybridization trays or wash racks, data originating from a given film were normalized to a reference group on that film (i.e., “Group 4”). Where multiple brain regions fell on the same slide, a reference region was chosen for normalization in order to enable direct comparison of expression between subfields (hippocampus—subiculum; striatum—caudate; amygdala—lateral nucleus). Data were normalized, statistical outliers removed (i.e., data points greater than 2 standard deviations above or below the mean), and then statistically analyzed for group effects (see next) and then were submitted for review to the Stanley Foundation for unblinding and pairing of demographic data.
2.4. Statistical analysis
Data was analyzed using SigmaPlot 11.2. As noted above, statistical outliers more than 2 standard deviations from the mean of its respective group were removed prior to analysis (see Tables 1 and 2). Normalized data were analyzed by parametric statistics when data passed normality (Shapiro-Wilk) and equal variance (Levene’s mean test); otherwise, nonparametric statistics were used. A priori, our primary endpoint of interest with regard to the in situ hybridization data was the effect of diagnosis on PDE expression; however, secondary post hoc analyses were also conducted with regard to the effect of suicide, psychosis, substance abuse, and alcohol abuse given the degree to which these factors differed between the diagnostic groups. The effect of diagnosis on PDE2A mRNA expression was tested using an analysis of variance (ANOVA) and the effect of secondary factors (e.g., death by suicide) was assessed by t-test when a single brain region fell on a slide. When a single slide contained multiple brain regions or subfields (e.g., hippocampus), a repeated measure ANOVA was used when normality and equal variance passed. When inclusion of all nuclei/subfields in a single analysis led to failure of normality and/or equal variance, then individual ANOVAs/ANOVA on Ranks were used to analyze data from each nuclei/subfield separately and a false discovery rate (FDR) correction for multiple comparisons was applied to each P value. Post hoc analyses conducted using Student Newman Keuls following parametric ANOVAs and Dunn’s test following nonparametric analyses. Note, there were too few female subjects included in this dataset to justify a formal multifactorial analysis of diagnosis x sex. We did, however, plot individual data points separating females and males to allow a visual inspection of the data that reveals a striking consistency of effects across sexes. Statistical significance was defined as P ≤ 0.05. Data are plotted as mean ±standard error of the means (SEMs).
Table 1.
Starting number of subjects^ (number outliers removed) per group per brain region sampled in tissue from the Stanley Foundation.
| Region | Control | MDD | BPD | SCZ |
|---|---|---|---|---|
| Cingulate (2A) | 6f,9m(1m) | 6f,9m(0) | 6f,9m(1f) | 6f,9m(1m) |
| OFC (2A) | 6f,9m(1m) | 6f,9m(0) | 6f,9m(1m) | 6f,9m(1m) |
| STG (2A) | 6f,9m(1m) | 6f,9m(1m) | 6f,9m(1f) | 6f,9m(0) |
| DG (2A) | 6f,9m(0) | 5f,6m(0) | 5f,7m(1f) | 5f,8m(0) |
| CA1 (2A) | 6f,9m(0) | 5f,7m(1f) | 5f,7m(0) | 5f,8m(1m) |
| Subiculum (2A) | 6f,9m(1f,1m) | 5f,7m(0) | 5f,7m(1f) | 5f,8m(1m) |
| CEC (2A) | 6f,9m(2f) | 5f,7m(0) | 5f,7m(1f) | 5f,8m(0) |
| ITR (2A) | 6f,9m(1m) | 5f,7m(0) | 5f,7m(1m) | 5f,8m(1m) |
| B (2A) | 6f,9m(1f) | 6f,9m(1f) | 6f,8m(1f) | 5f,9m(1m) |
| AB (2 A) | 4f,6m(0) | 2f,7m(1f) | 2f,7m(1f) | 3f,5m(1m) |
| CO (2 A) | 3f,7m(0) | 4f,6m(1m) | 5f,7m(1f) | 4f,8m(1m) |
| CTA (2A) | 5f,6m(1m) | 5f,6m(0) | 4f,7m(0) | 3f,7m(1m) |
| L (2A) | 6f,9m(0) | 6f,9m(1m) | 6f,8m(1m) | 5f,9m(1) |
| Caudate (2A) | 6f,6m(1m) | 6f,8m(1m) | 4f,9m(1f) | 5f,9m(0) |
| Caudate (10A) | 6f,9m(1m) | 6f,9m(1m) | 4f,9m(1m) | 5f,9m(0) |
| Putamen (2A) | 6f,8m(1f) | 6f,8m(0) | 4f,9m(0) | 4f,9m(1m) |
| Putamen (10A) | 6f,9m(1m) | 6f,9m(2) | 4f,9m(1f) | 5f,9m(0) |
| NAcc (2A) | 6f,9m(0) | 6f,8m(0) | 4f,9m(1f) | 5f,9m(0) |
| NAcc (10A) | 6f,9m(1m) | 6f,9m(1m) | 4f,9m(1f) | 5f,9m(2f) |
Starting number of subjects may be lower than 6f and 9m either because the slide that was sent did not contain the brain region of interest or because that brain region was damaged on the slide.
Starting number of subjects may be lower than 6f and 9m either because the slide that was sent did not contain the brain region of interest or because that brain region was damaged on the slide.
MDD--major depressive disorder, SCZ--schizophrenia, BPD--bipolar disorder, f--female; m--male; OFC--orbital frontal cortex; STG--superior temporal gyrus; DG--dentate gyrus of hippocampus; CEC--caudal entorhinal cortex; ITR--inferior temporal region (A36); B--basal subnucleus of the amygdala; AB--basal accessory subnucleus of the amygdala; CO--corticalis subnucleus of the amygdala; CTA--cortico-amygdalar transition area; NAcc--nucleus accumbens.
Table 2.
Starting # of subjects^ per group per brain region sampled (# outliers removed from PDE2A, #outliers removed from PDE10A) from the Brainspan Database.
| Region | prenatal | child | adult |
|---|---|---|---|
| Cingulate | 15(1,1) | 10(1,0) | 7(0,0) |
| OFC | 14(1,1) | 9(1,0) | 8(1,0) |
| STG | 14(1,1) | 14(1,0) | 8(1,1) |
| Hippocampus | 15(1,1) | 9(0,0) | 8(0,0) |
| ITR | 13(0,1) | 13(0,0) | 8(1,0) |
| Amygdala | 14(1,1) | 12(0,0) | 7(1,1) |
| Striatum | 14(1,1) | 7(0,1) | 7(0,0) |
Starting # of subjects may be lower because data was not avaiable for all subjects for all tissues. Note, information regarding the sex of subjects was not available.
Starting # of subjects may be lower because data was not avaiable for all subjects for all tissues. Note, information regarding the sex of subjects was not available.
OFC--orbital frontal cortex; STG--superior temporal gyrus; ITR--inferior temporal region (A36)
3. RESULTS
3.1. Demographic data suggests subjects were well matched.
As previously reported[39], subjects were relatively well matched in terms of demographics and quality control measures (Table 3). There were no significant differences between diagnostic groups in terms of age, pH of the tissue, or postmortem interval. Each diagnostic group included 6 female subjects and 9 male subjects—although not all brain regions were provided for each subject (Table 1). As would be expected based on the nature of the illnesses being studied herein, death by suicide occurred more frequently in patients with BPD relative to control subjects, and psychosis was more prevalent in patients with either SCZ or BPD relative to control subjects (Table 3). Rates of substance and alcohol abuse also tended to be higher amongst patients with SCZ or BPD relative to control subjects; however, these effects did not reach the level of statistical significance.
Table 3.
Demographic information for subjects (mean ±SEM)
| Control | MDD | SCZ | BPD | ANOVA | |
|---|---|---|---|---|---|
| total number of subjects | 6f,9m | 6f,9m | 6f,9m | 6f,9m | |
| age (mean years ±SEM) | 48.0±2.8 | 46.5±2.4 | 44.5±3.4 | 42.3±3.0 | failed normality, H(3)=1.79, P=0.617 |
| pH (mean ±SEM) | 6.27±0.06 | 6.18±0.05 | 6.16±0.07 | 6.18±0.06 | F(3,56)=0.611, P=0.611 |
| PMI (mean hours ±SEM) | 23.7±2.6 | 27.5±2.8 | 33.7±3.8 | 32.5±4.2 | failed normality, H(3)=4.47, P=0.215 |
| death by suicide | 0 | 3f,4m | 2f,2m | 3f,6m | failed normality, H(3) 13.57, P=0.0036; post hoc BPD vs control, P=0.0286 |
| psychoses | 0 | 0 | 6f,9m | 5f,6m | failed normality, H(3)=47.25, P<0.0001; post hoc SCZ and BPD vs. control, P<0.0001 and P=0.003, respectively |
| past/present substance abuse* | 0 | 1f,2m | 2f,3m | 4f,4m | failed normality, H(3)=8.36, P=0.039; post hoc tests not significant |
| past/present alcohol abuse* | 0f,4m | 2f,3m | 2f,5m | 3f,6m | failed normality, H(3)=7.24, P=0.065 |
substance abuse status was unknown for 1 MDD m, and alcohol abuse status was unknown for 2 BPD f, 1 BPD m, and 1 SCZ f.
substance abuse status was unknown for 1 MDD m, and alcohol abuse status was unknown for 2 BPD f, 1 BPD m, and 1 SCZ f.
MDD--major depressive disorder, SCZ--schizophrenia, BPD--bipolar disorder, f--female, m--male, PMI--post-mortem interval
3.2. PDE2A and PDE10A mRNA expression patterns are relatively well conserved between human and mouse.
PDE2A mRNA expression in human brain paralleled that found in mouse brain, with expression reliably detected in all brain regions except cerebellum (reliable expression operationally defined as signal on antisense slides (AS) and no signal in the sense (S) negative control; Figure 1). PDE10A mRNA expression differed somewhat between human and rodent (Figure 1). In the adult human brain, PDE10A was only detected in striatum. In rodent, PDE10A is most highly expressed in striatum but can also be found in hippocampus and cerebellum (Figure 1)[29].
Figure 1. PDE2A and PDE10A mRNA expression patterns in human and mouse brain.
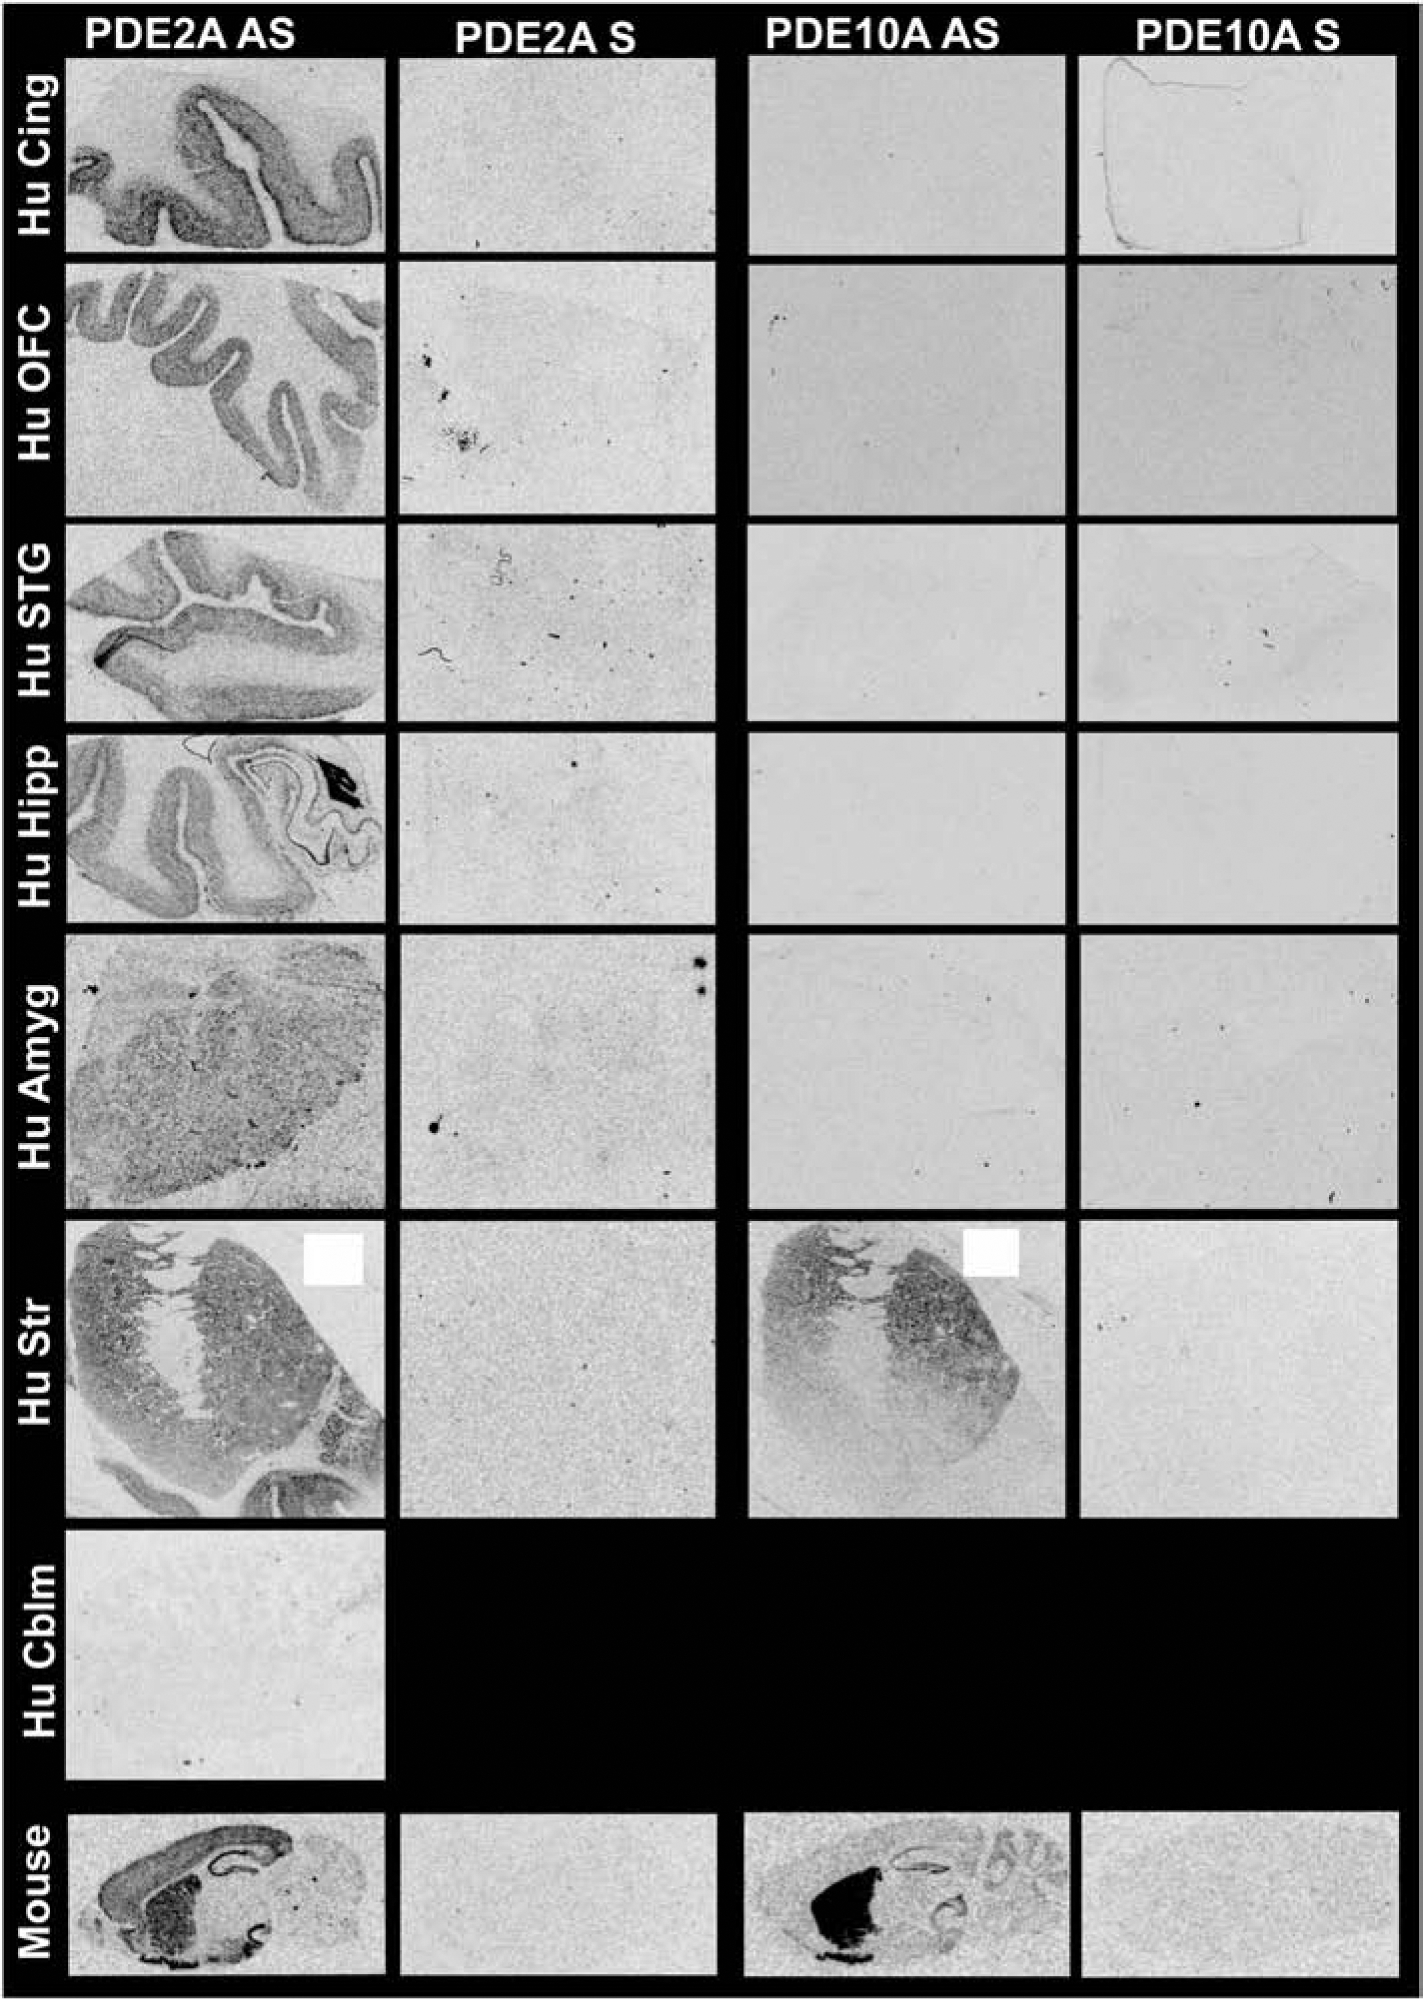
PDE2A and PDE10A mRNA were labeled with S35-labelled oligonucleotide probes that recognizes both human and mouse homologues. Brightness and clarity adjusted for graphical clarity of autoradiographic images.
3.3. PDE2A mRNA expression differed significantly between groups in a brain region-specific manner.
PDE2A mRNA was measured in cingulate cortex, orbitofrontal cortex (OFC), superior temporal gyrus (STG), parahippocampal cortex, hippocampus, amygdala and striatum; whereas, PDE10A mRNA could only be measured in striatum as no PDE10A was detected outside of the striatum in any subject. Patients with schizophrenia expressed significantly less PDE2A mRNA vs. control subjects in cingulate (Figure 2A) and OFC (Figure 2B). In STG, there was no significant effect of group (Figure 2C). With regard to parahippocampal cortices, only patients with BPD expressed significantly less PDE2A mRNA relative to control subjects within caudal entorhinal cortex (Figure 2D).
Figure 2. PDE2A mRNA expression in cortex of male and female patients with MDD, BPD, or SCZ.
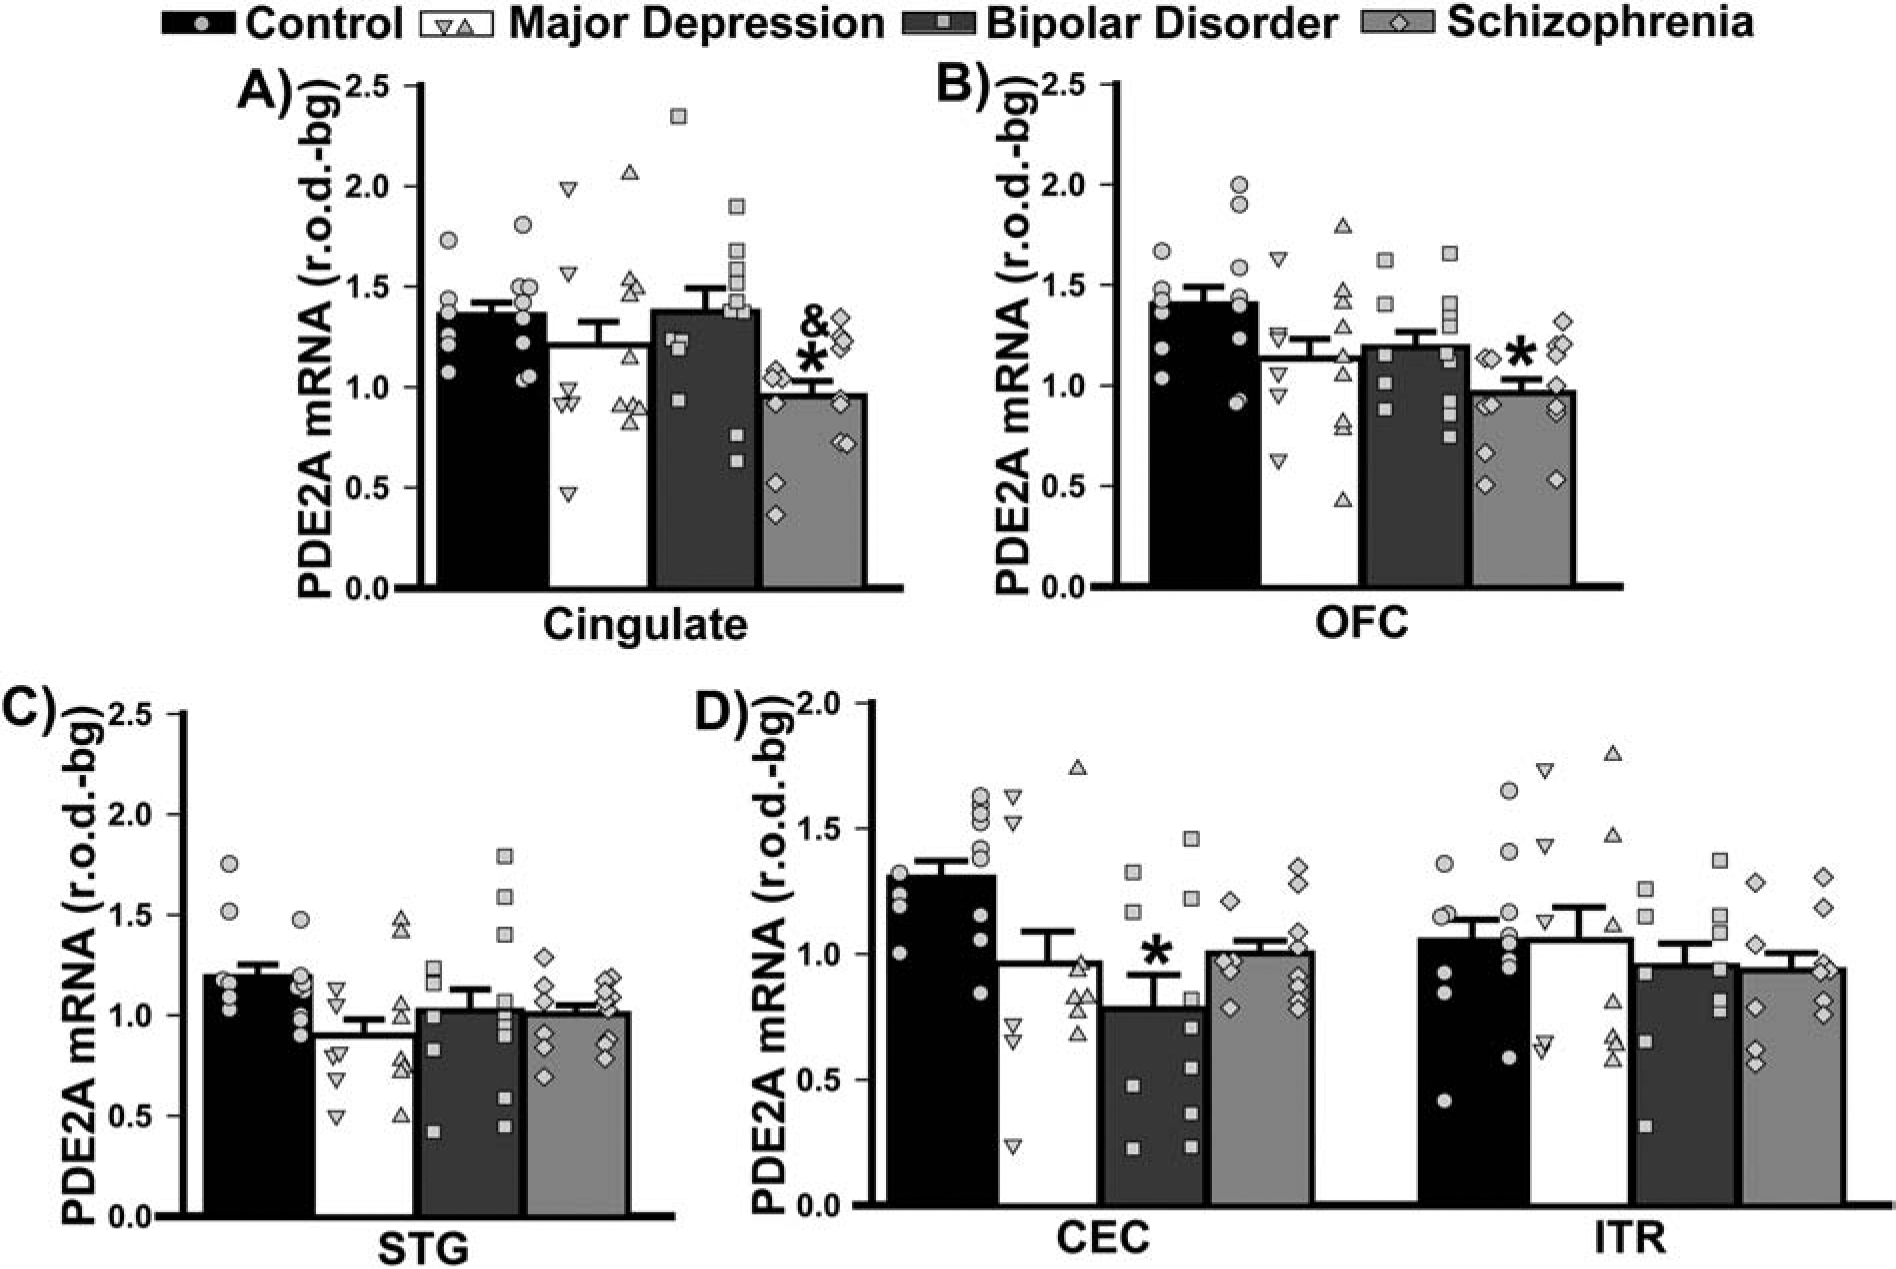
Group averages are plotted as histograms (Data ±SEM) and overlaid with individual data points for each female (in the left column of each histogram bar) and male subject (in the right column). A) In cingulate cortex, patients with SCZ expressed significantly less PDE2A mRNA relative to controls and patients with BPD (F(3,53)=3.89, P=0.014; Post hoc: control vs. SCZ, P=0.015; BPD vs. SCZ, P=0.02. B) In orbitofrontal cortex (OFC), patients with SCZ expressed significantly less mRNA only relative to controls (F(3,53)=4.64, P=0.006; Post hoc: control vs. SCZ, P=0.003; vs. MDD, P=0.066; vs. BPD, P=0.08). C) In the superior temporal gyrus (STG), the effect of diagnosis did not reach the level of statistical significance (failed normality; H(3)=7.52, P=0.057). D) Among parahippocampal cortices, only the caudal entorhinal cortex (CEC) showed an effect of diagnosis (effect of diagnosis x brain region: F(3,42)=3.20, P=0.033), with patients with BPD exhibiting a significant reduction in PDE2A mRNA relative to controls (Post hoc, controls vs. BPD, P=0.013; vs. MDD, P=0.074; vs. SCZ P=0.053). *vs. Control, P=0.015–0.003; &vs. BPD, P=0.02.
Patients with BPD also demonstrated a significant reduction in PDE2A mRNA relative to controls across hippocampal subfields (Figure 3A). In the amygdala, effects on PDE2A mRNA expression were qualitatively similar across the diagnostic groups. In the basal nucleus, patients with MDD, BPD, and SCZ all expressed significantly less PDE2A mRNA relative to controls; whereas, in the basal accessory nucleus, only decreases in patients with MDD and BPD reached statistical significance (Figure 3B).
Figure 3. PDE2A mRNA expression in limbic regions of male and female patients with MDD, BPD, or SCZ.
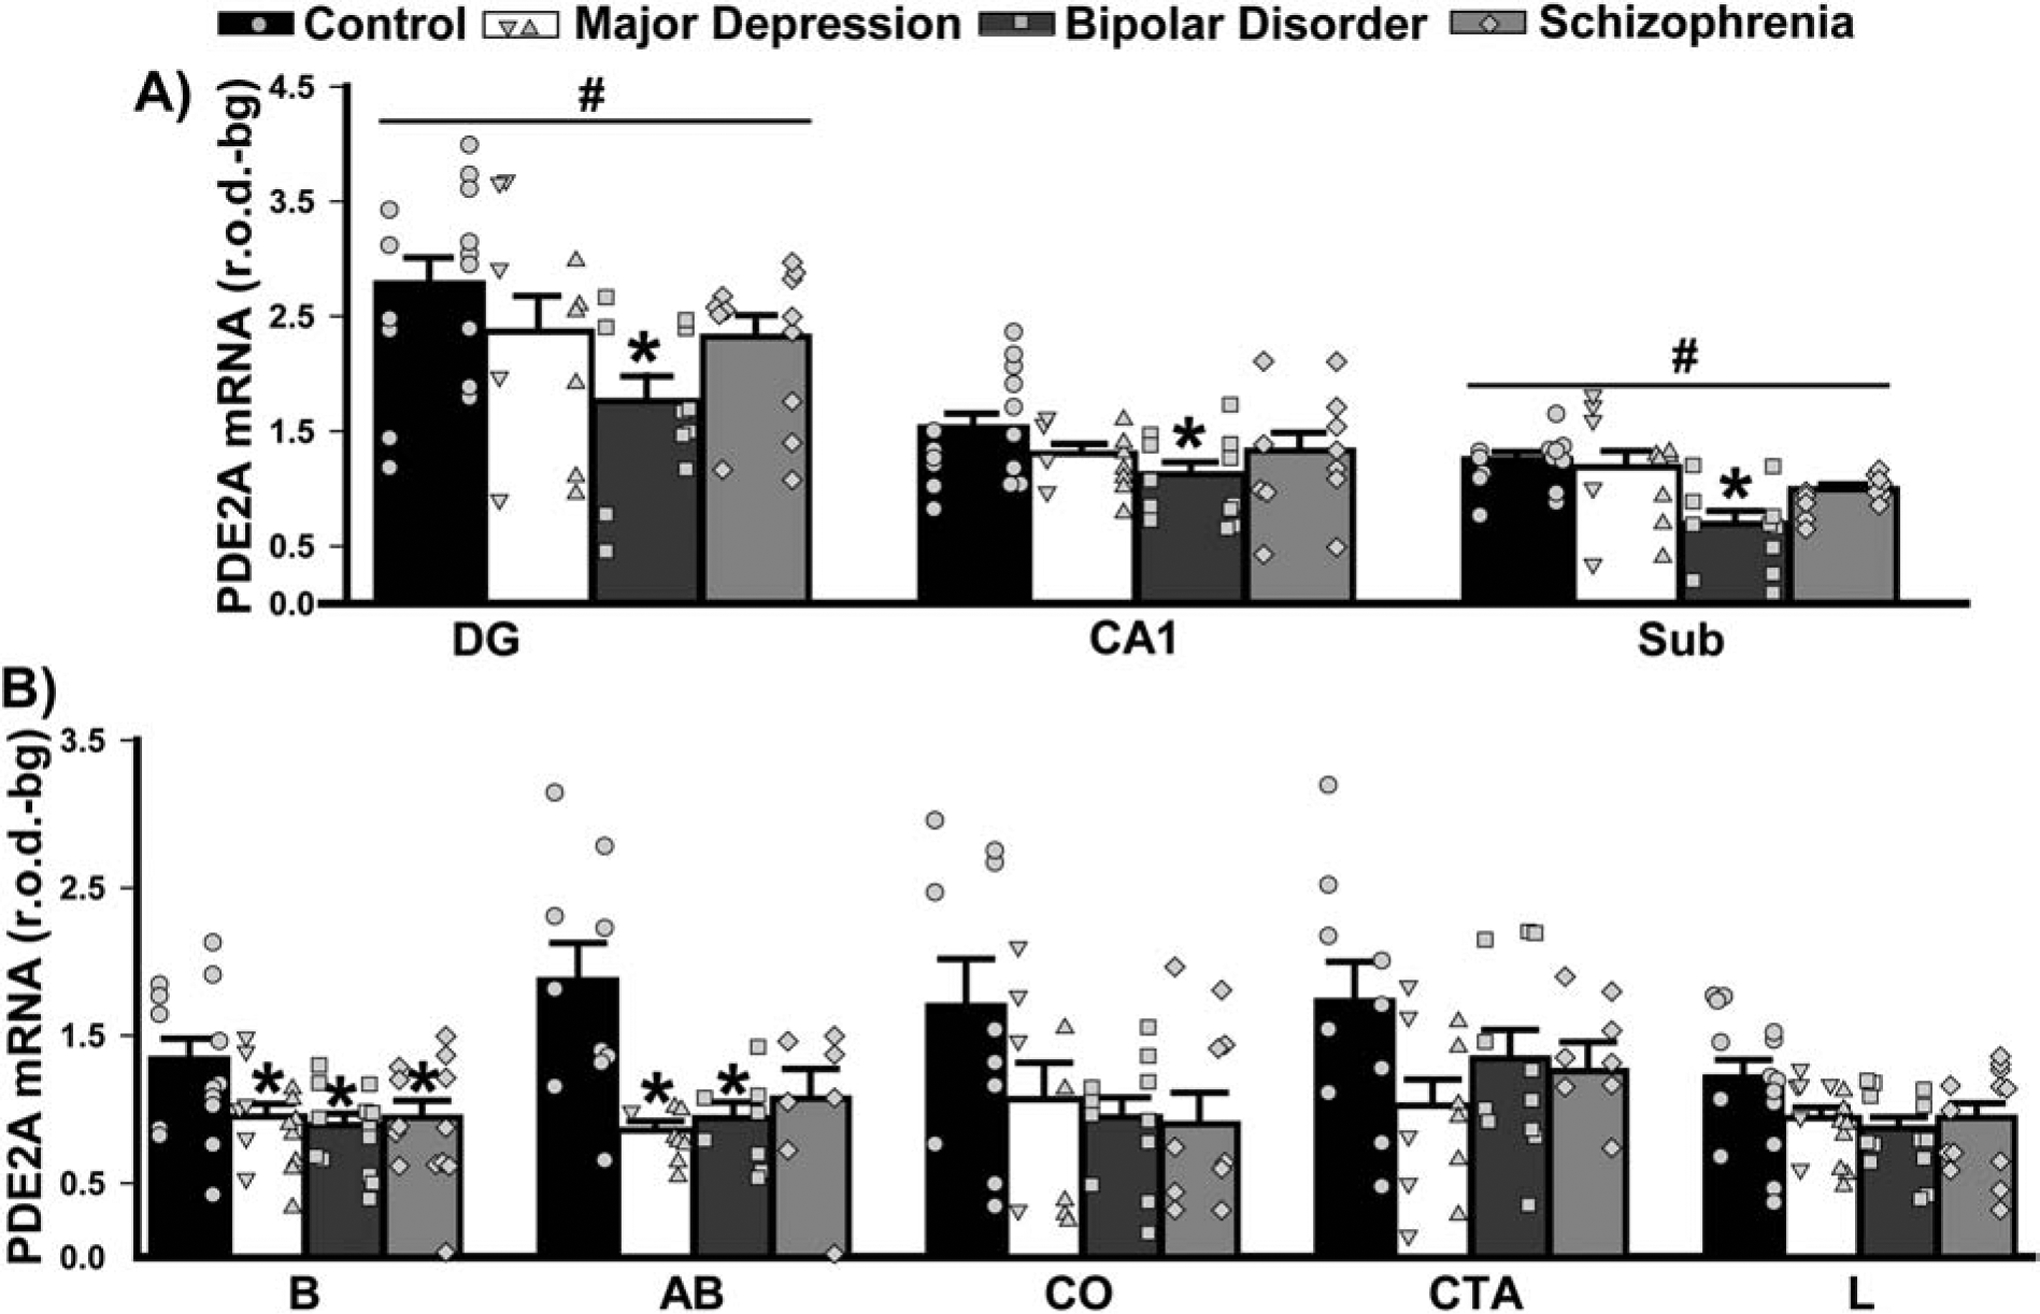
Group averages are plotted as histograms (Data ±SEM) and overlaid with individual data points for each female (in the left column of each histogram bar) and male subject (in the right column). A) In the hippocampus, patients with BPD exhibited significantly reduced expression of PDE2A mRNA across all subfields vs. controls (main effect of diagnosis: F(3,88)=3.82, P=0.015; Post hoc: BPD vs. controls, P=0.01; vs. MDD, P=0.093; vs. SCZ, P=0.077). In addition, across groups, there was significantly increased expression in the dentate gyrus (DG) and significantly reduced expression in the subiculum relative to the other subfields (main effect of region: F(2,88)=130.07, P<0.0001; all other regions vs. DG, P=0.0001; vs. Sub, P=0.0005–0.0001). B) There was also an effect of diagnosis in select nuclei of the amygdala (2 Way RM ANOVA across nuclei failed normality, requiring individual ANOVAs and FDR correction of subsequent P-values). In nucleus basalis (B; F(3,50)=3.80, FDR-P=0.039), all patient groups had significantly reduced PDE2A mRNA expression relative to control subjects (Post hoc: Control vs. MDD, P=0.012; vs. BPD, P=0.024; vs. SCZ, P=0.032). In the basal accessory subnucleus (failed equal variance; H(3)=12.38, FDR-P=0.031), patients also showed reduced expression relative to controls (vs. MDD, P=0.008; vs. BPD, P=0.039). The decreased PDE2A expression noted in other regions did not reach statistical significance, including those in the corticalis nucleus (CO; F(3,37)=2.56, FDR-P=0.091), cortico-amygdalar transition area (CTA; F(3,37)=1.98, P=0.13) and lateral nucleus (L; F(3,51)=2.70, FDRP=0.068). *vs. Control, P=0.039–0.008; #vs. all other regions, P=0.0005–0.0001.
In striatum, both PDE2A and PDE10A mRNA could be measured. The pattern of PDE2A mRNA expression across striatal subregions differed between diagnostic groups. PDE2A mRNA expression was higher in caudate relative to putamen and nucleus accumbens in patients with BPD; whereas, PDE2A mRNA expression was equivalent across striatal subregions in all other groups (Figure 4A). Surprisingly, there were no differences in PDE10A mRNA expression between diagnostic groups, with all groups showing significantly less PDE10A mRNA expression in nucleus accumbens relative to caudate and putamen (Figure 4B).
Figure 4. PDE2A and PDE10A mRNA expression in striatum of male and female patients with MDD, BPD, or SCZ.
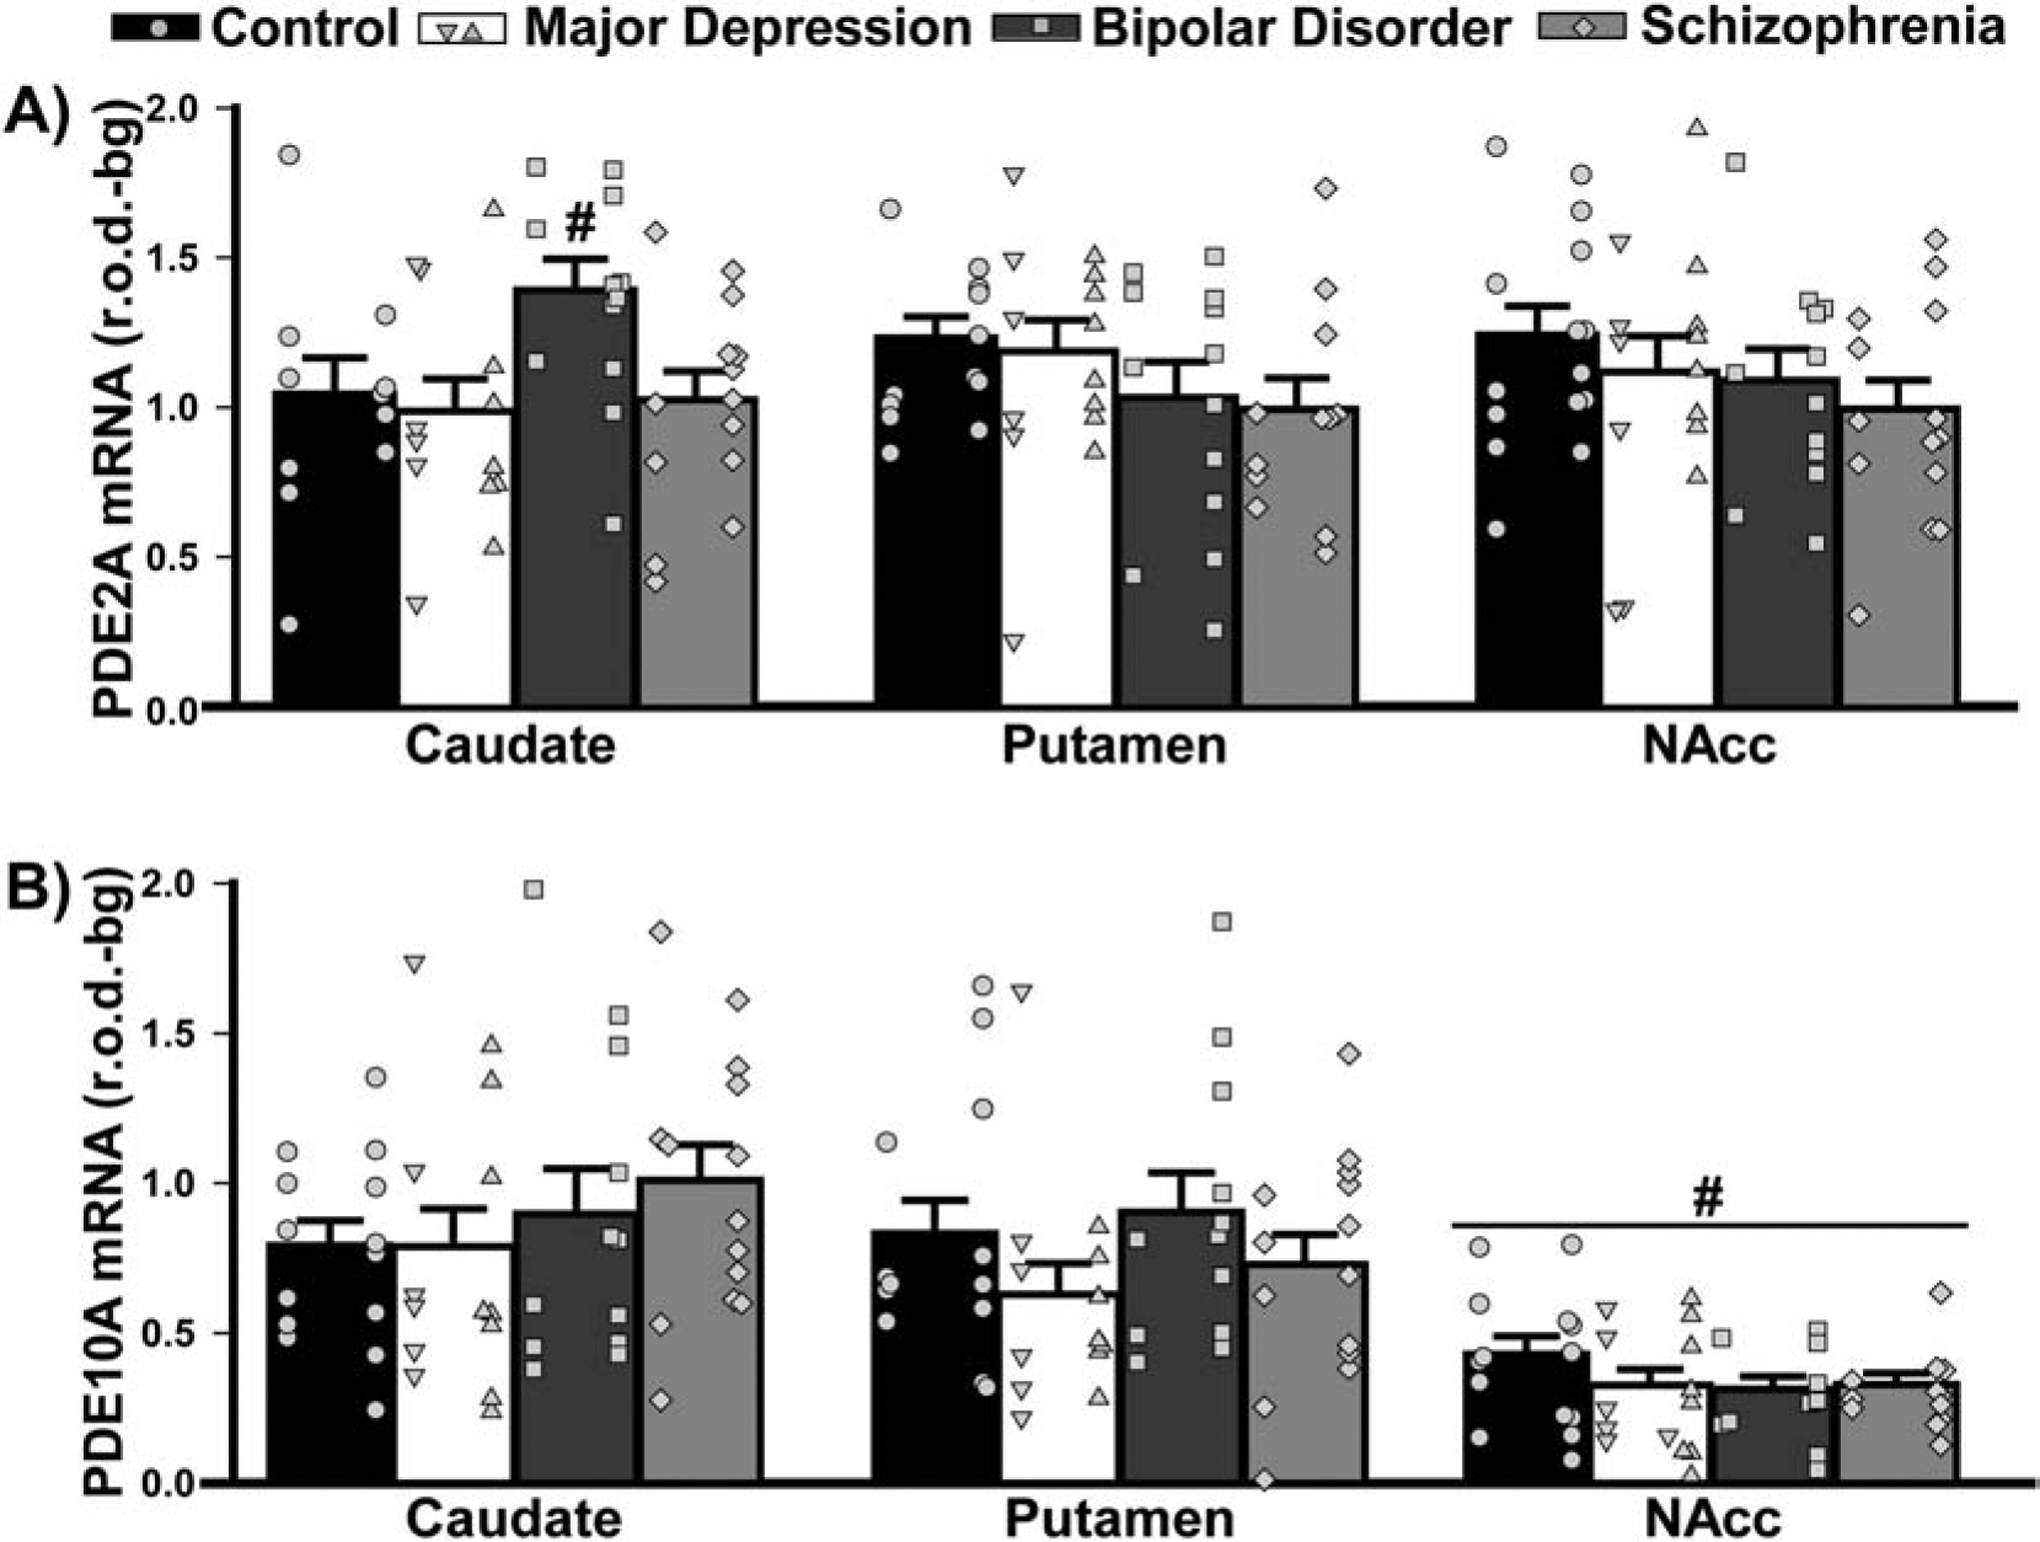
Group averages are plotted as histograms (Data ±SEM) and overlaid with individual data points for each female (in the left column of each histogram bar) and male subject (in the right column). A) In the striatum, patients with BPD exhibited higher PDE2A mRNA expression in caudate relative to putamen and the NAcc, a pattern that was not seen in other groups (effect of diagnosis x brain region: F(6,93)=2.54, P=0.026; Post hoc, BPD caudate vs. BPD putamen, P=0.0055; vs BPD NAcc, P=0.026). B) In the striatum, PDE10A mRNA expression did not change across groups, but all groups expressed significantly less PDE10A mRNA in the NAcc compared to their own caudate and putamen (effect of region: F(2,95)=65.38, P<0.0001; Post hoc: NAcc vs. caudate or putamen, P<0.0001). #vs. all other regions, P=0.026 to <0.0001.
3.4. Comorbid factors.
As noted above, death by suicide and psychoses occurred more frequently among patients relative to controls, particularly in patients with BPD and SCZ (Table 3). Similar effects were also seen for substance and alcohol abuse. As such, a post hoc secondary analysis was conducted to determine if the above-noted disease-related changes in PDE2A mRNA expression might be explained by these specific aspects of the patients’ history. Strikingly, suicide was associated with significantly higher levels of PDE2A mRNA expression in cingulate cortex of males and females relative to death by any other means (Figure 5). This stands in stark contrast to the decreased levels of PDE2A mRNA that were described above in cingulate of patients with SCZ. Suicide was also associated with higher PDE2A mRNA expression in striatum, but only in females. Psychosis, on the other hand, was associated with significantly lower levels of PDE2A mRNA across both parahippocampal cortices and the subiculum relative to no psychoses (Figure 6), which is consistent with the decreased PDE2A mRNA that was noted in these brain regions of patients with BPD. There were no significant effects of substance or alcohol abuse (defined as past and/or present; Figures 7–8) on PDE2A or PDE10A mRNA expression in any brain region (failed equal variance; T(23,30)=729.0, P=0.0537).
Figure 5. Death by suicide does not appear to drive the differential PDE2A mRNA expression that was measured in patients with psychiatric illnesses.
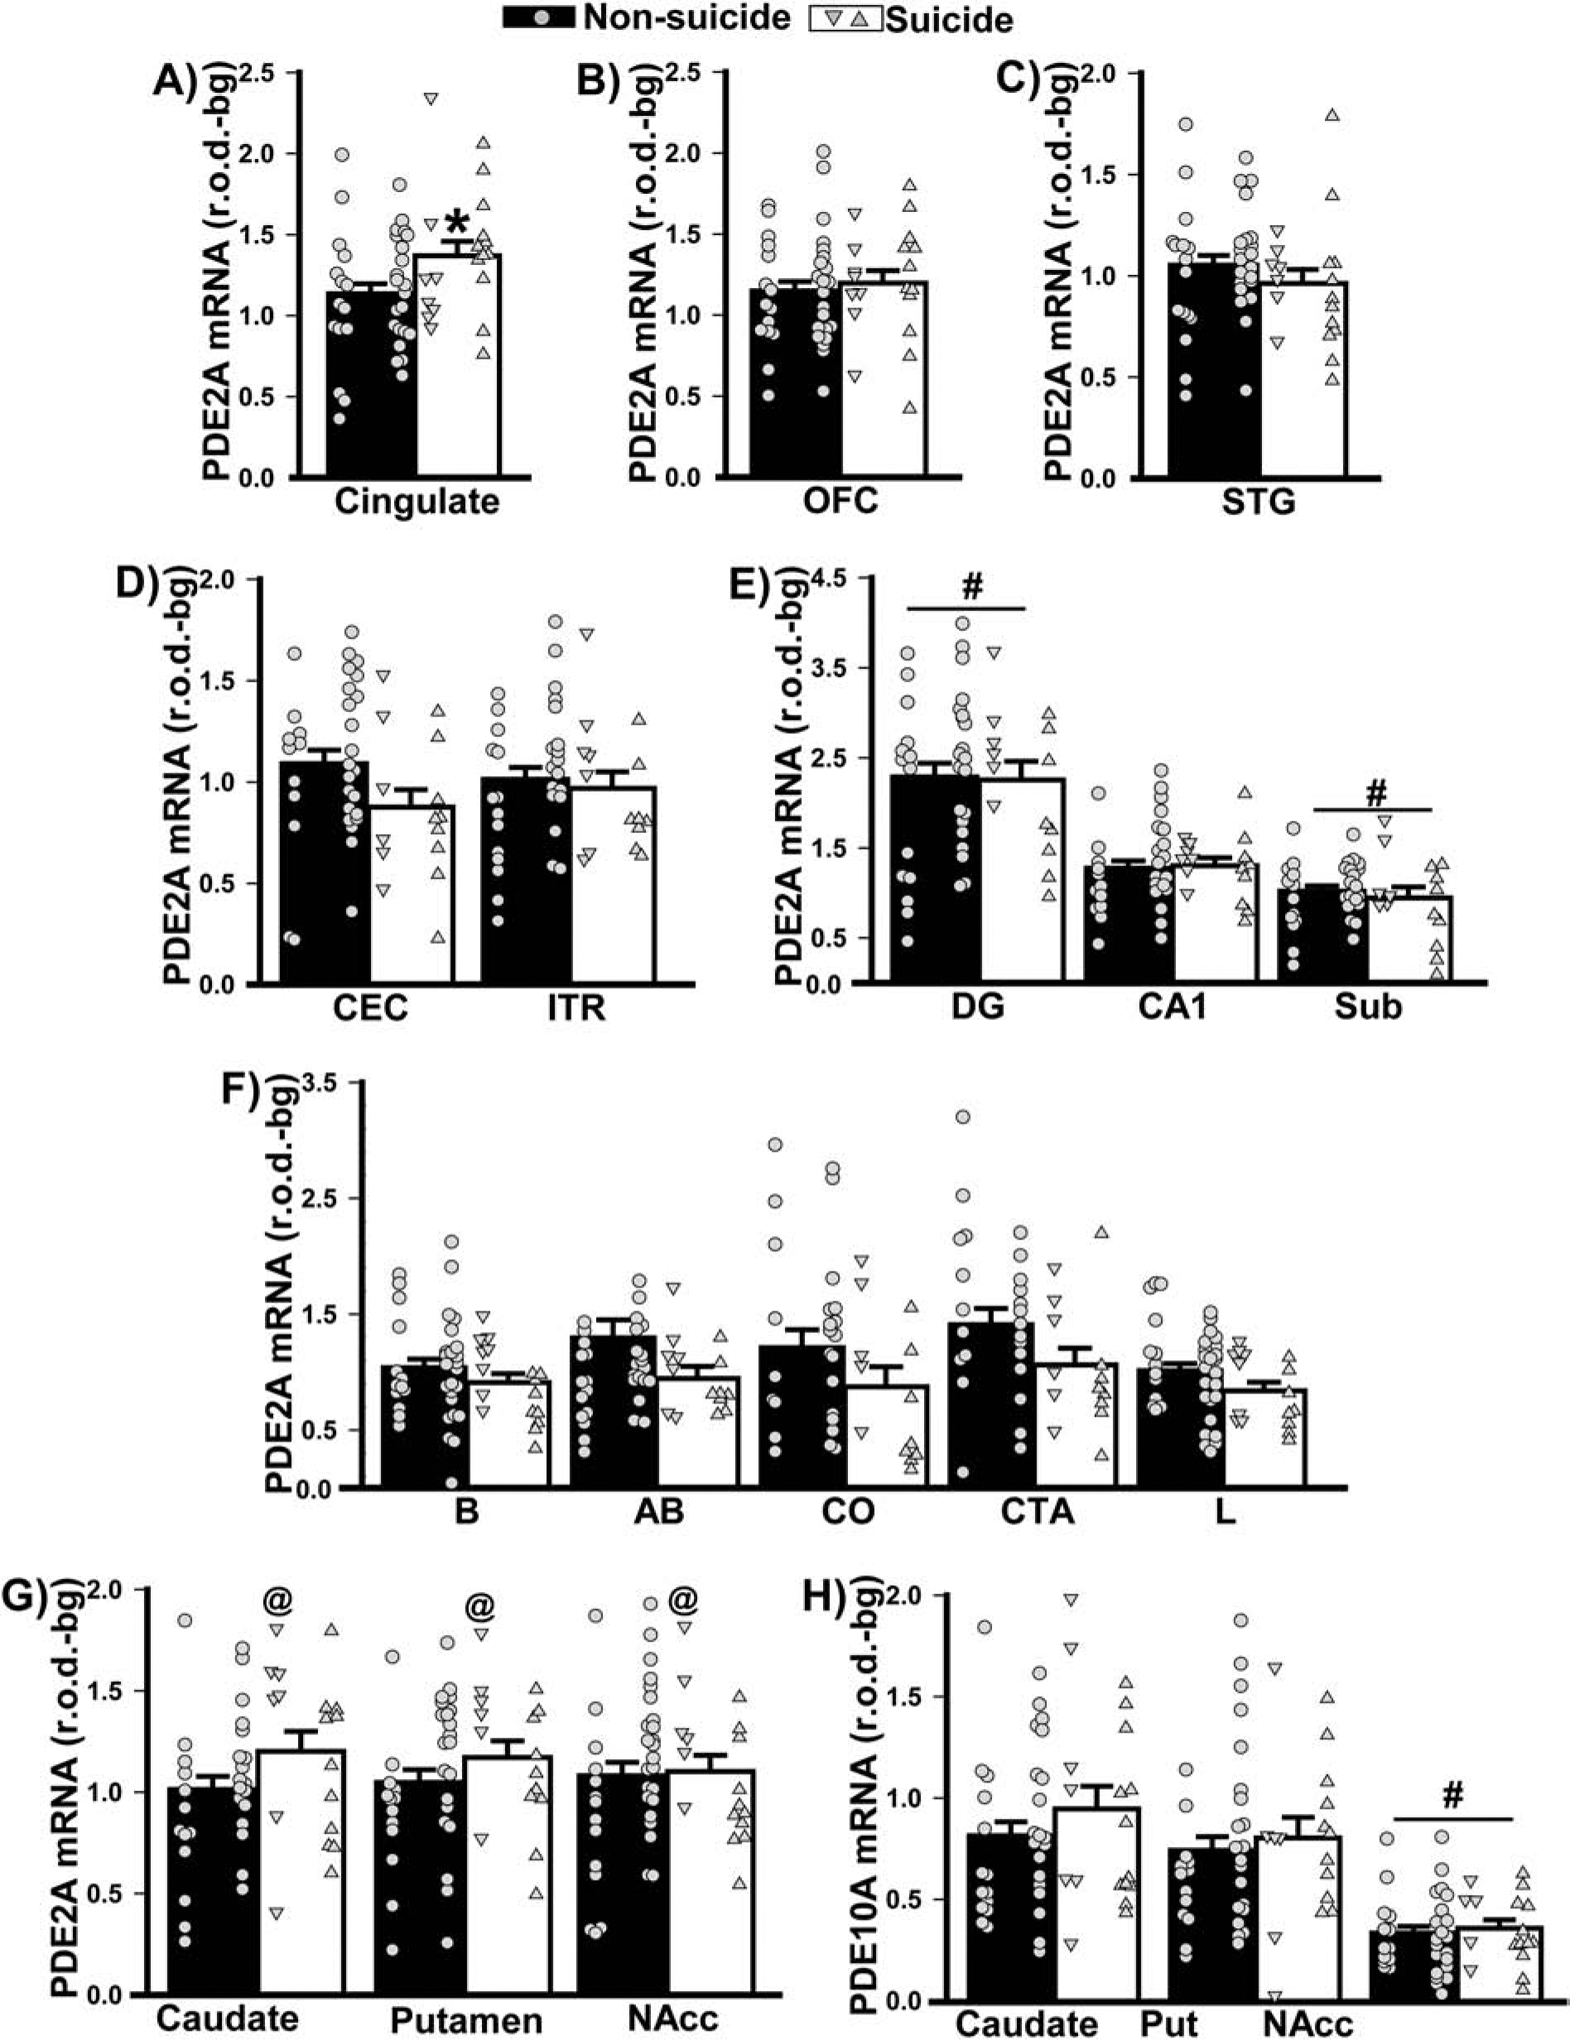
Data shown in Figure 2 were replotted based on mode of death (i.e., suicide versus non-suicide). A) In females (left data points) and males (right data points), death by suicide was associated with increased PDE2A mRNA expression in cingulate cortex (F(1,53)=4.33, P=0.042). No significant effects of mode of death were noted in B) orbitofrontal cortex (OFC), C) superior temporal gyrus (STG), D) parahippocampal cortices (i.e., caudal entorhinal cortex, CEC; inferotemporal region, ITR), E) hippocampus (including dentate gyrus, DG; subiculum, Sub), and F) amygdala (including basal nucleus, B; basal accessory nucleus, AB; corticalis nucleus, CO; cortico-amygdalar transition area, CTA; lateral nucleus, L). G) Across striatal nuclei (Putamen, Put; Nucleus Accumbens, NAcc), females who died by suicide expressed significantly higher PDE2A mRNA relative to females who died by other means (F(3,93)=5.04, P=0.0038; post hoc: Suicide female vs. non-suicide female, P=0.0067). H) In contrast, there was no significant effect of suicide in either males or females on striatal PDE10A mRNA expression. *vs. non-suicide, P=0.042; @vs. non-suicide female, P=0.007; # vs. other regions, P=0.0009–0.0001.
Figure 6. Psychosis cannot wholly account for the PDE2A mRNA expression that were noted in patients with psychiatric illnesses.
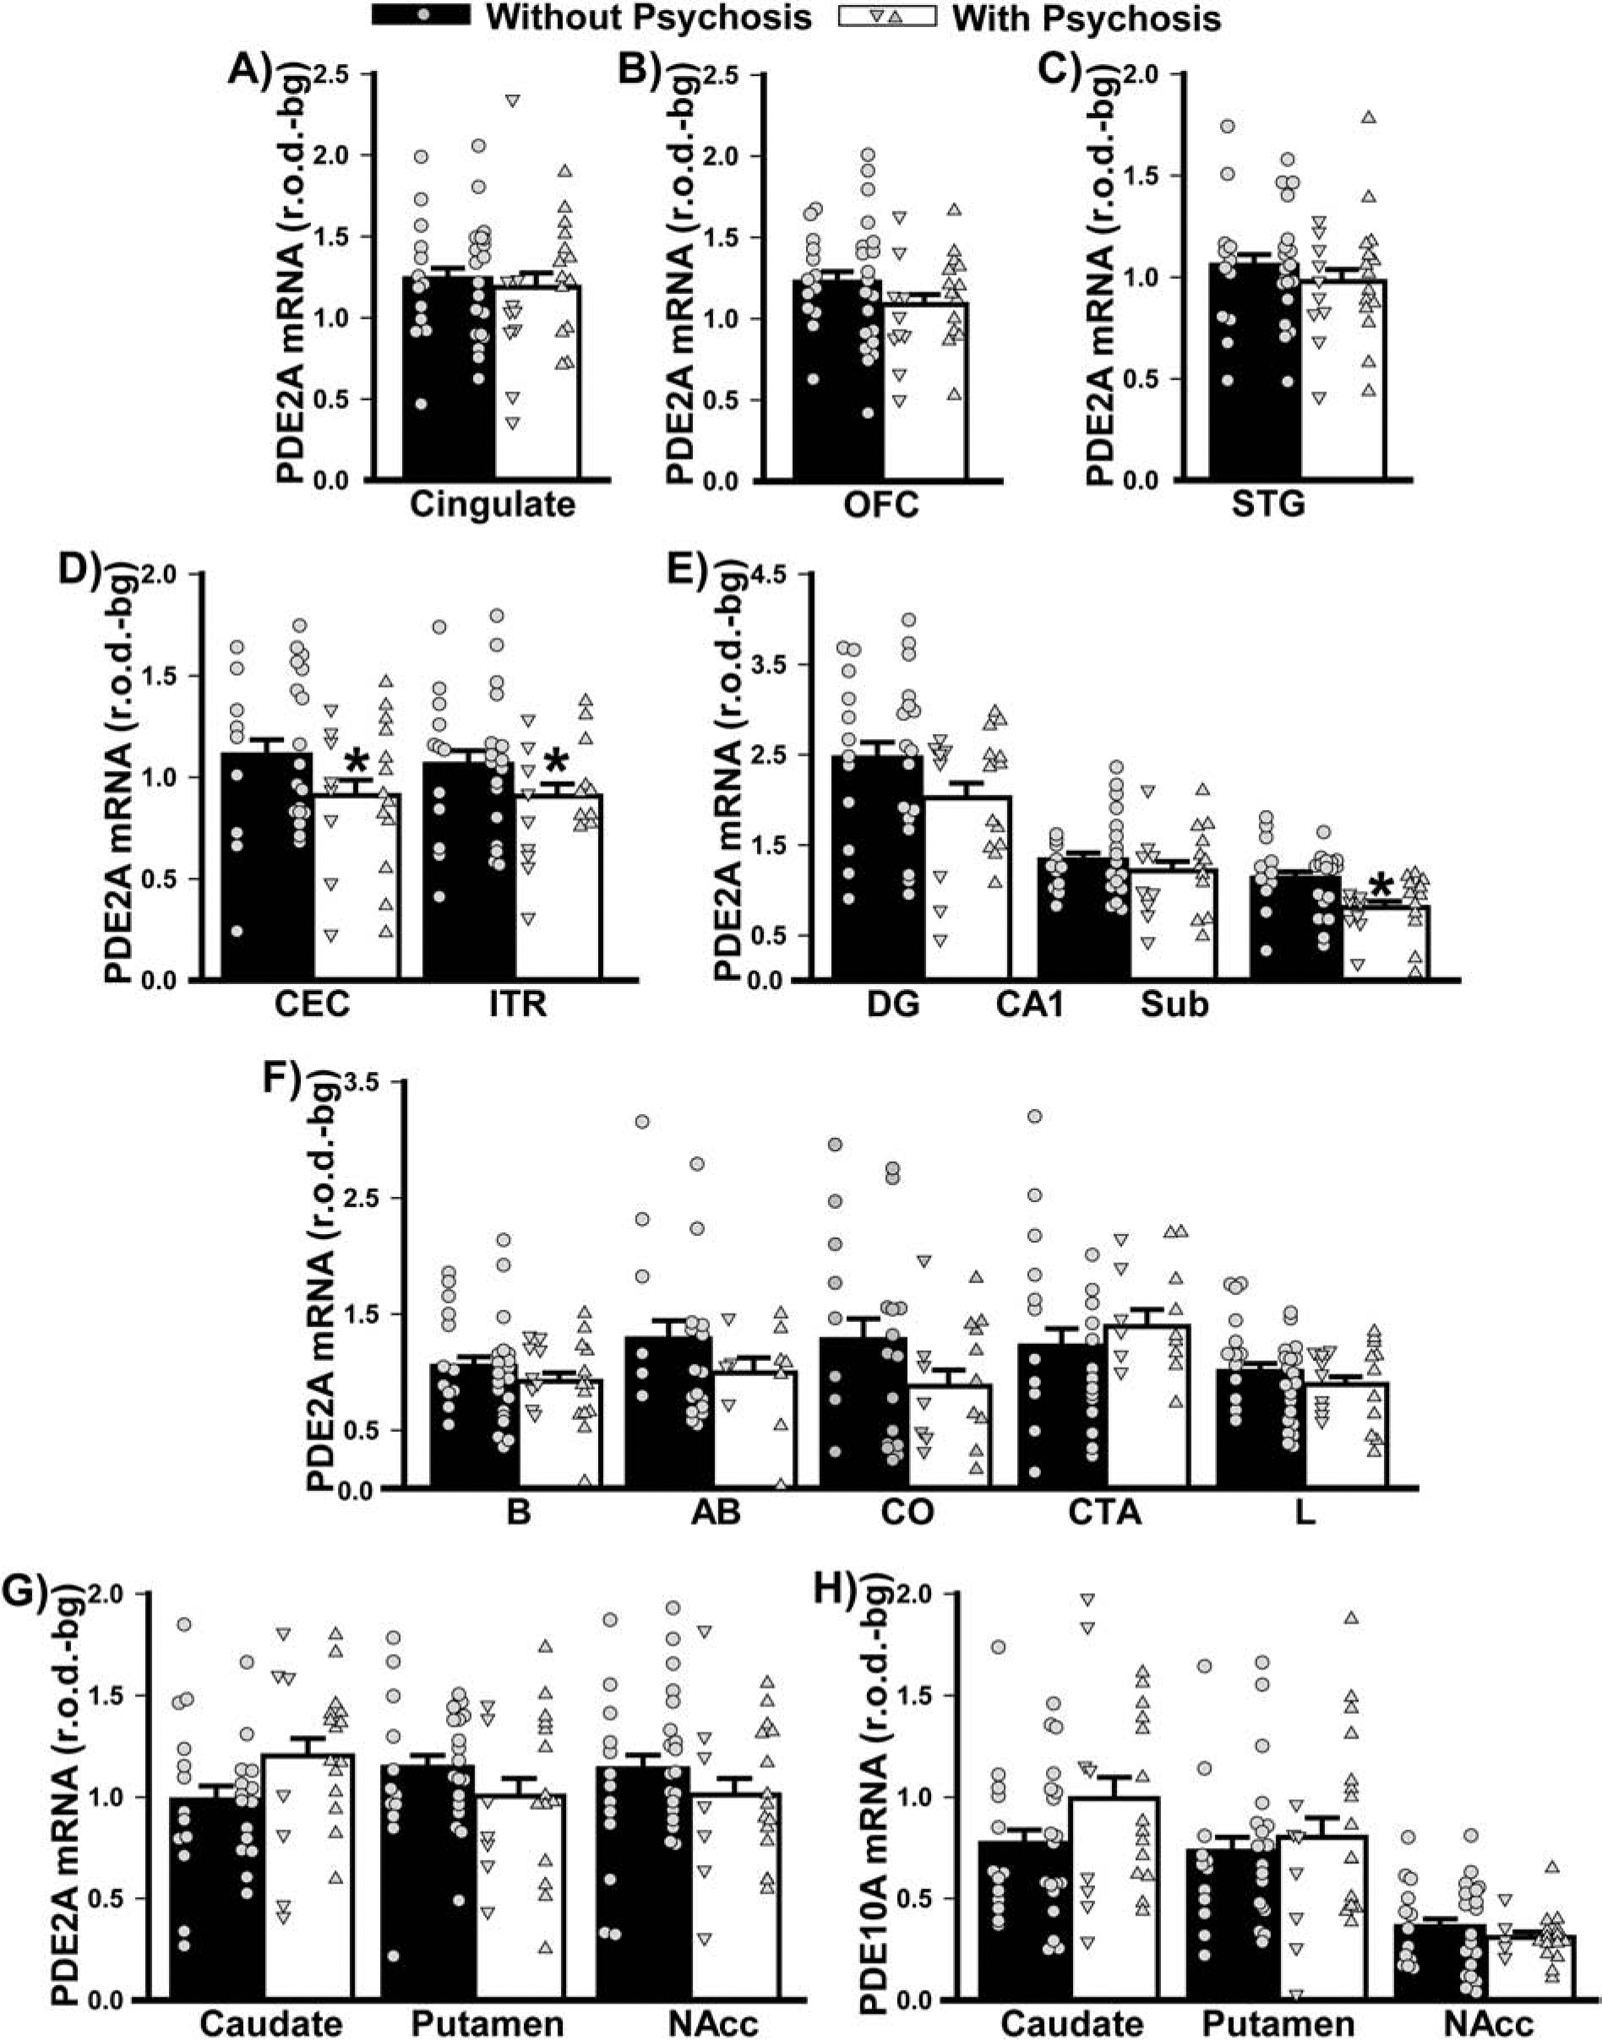
Data shown in Figure 2 were replotted based on history of psychosis. There was no significant difference between individuals with vs. without psychoses in terms of PDE2A mRNA expression in A) cingulate, B) orbitofrontal cortex (OFC), or C) superior temporal gyrus (STG). D) In contrast, individuals with vs. without psychosis expressed significantly lower PDE2A mRNA across the parahippocampal cortical subregions (F(1,44)=04.35, P=0.042) as well as E) subiculum (Sub; failed normality; T(20,28)=337.0, FDRP=0.0043). F) There were no significant effects of psychosis on PDE2A mRNA in the amygdala, G) PDE2A mRNA in the striatum (psychosis x region: F(2,97)=3.92, P=0.023; however, no post hoc tests reached significance), nor H) PDE10A mRNA in the striatum. *vs. without psychosis, P=0.042–0.004.
Figure 7. PDE2A and PDE10A mRNA expression do not change according to history of substance abuse.
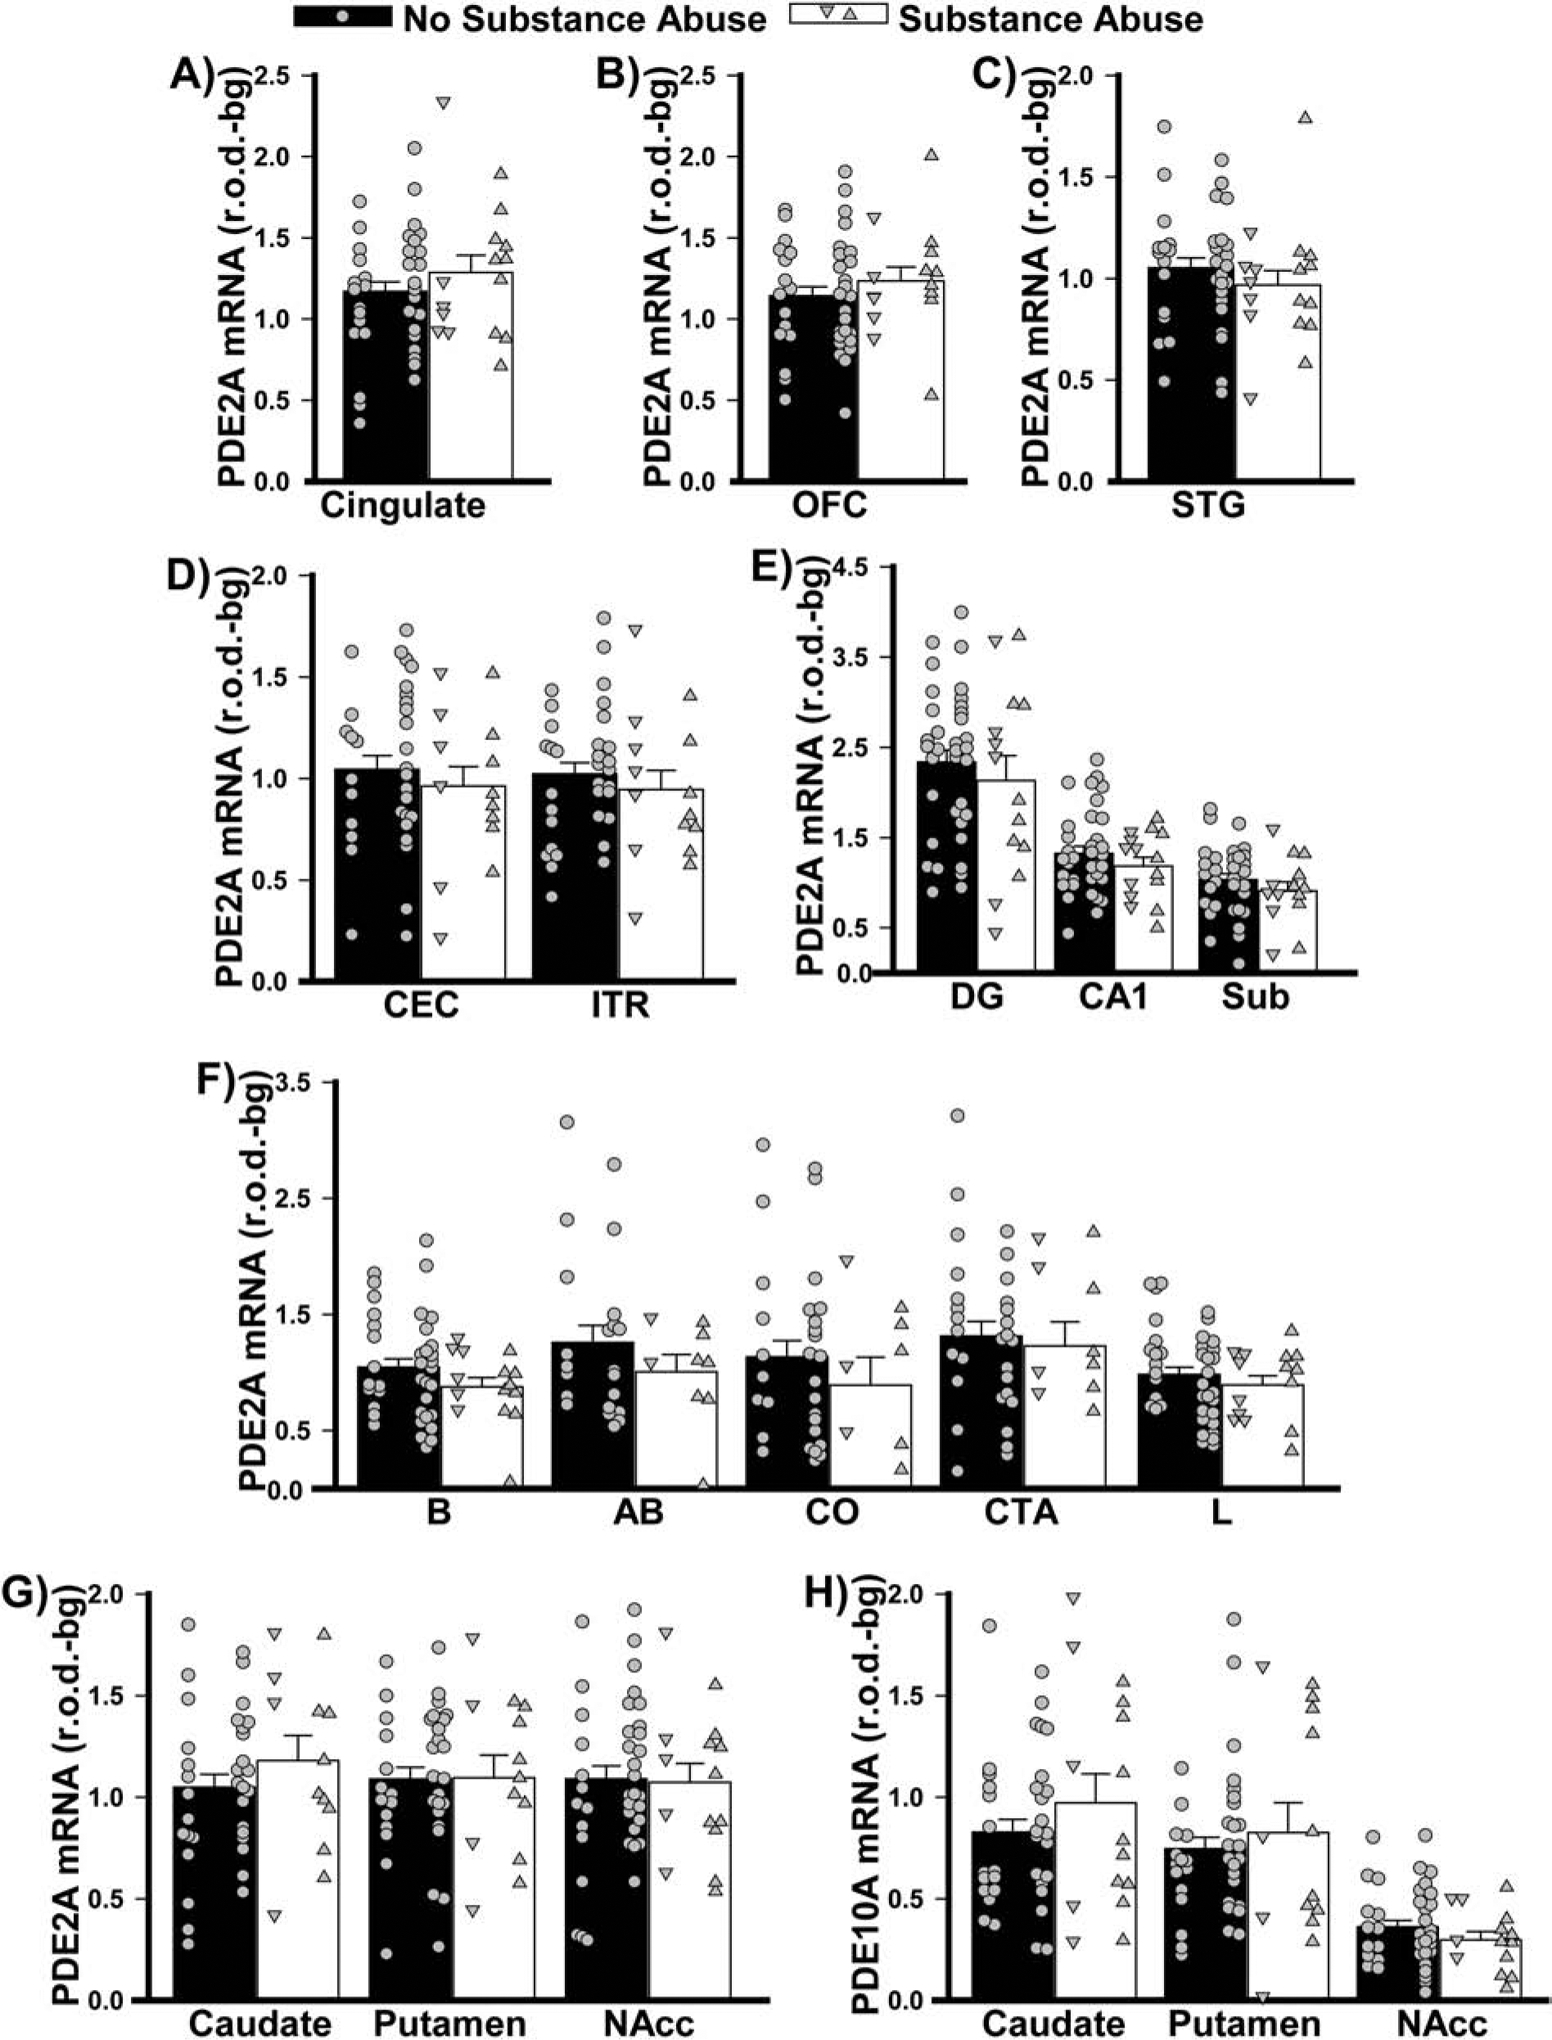
Data from Figure 2 replotted as per the past/present history of substance abuse.
Figure 8. PDE2A and PDE10A mRNA expression do not change according to history of alcohol abuse.
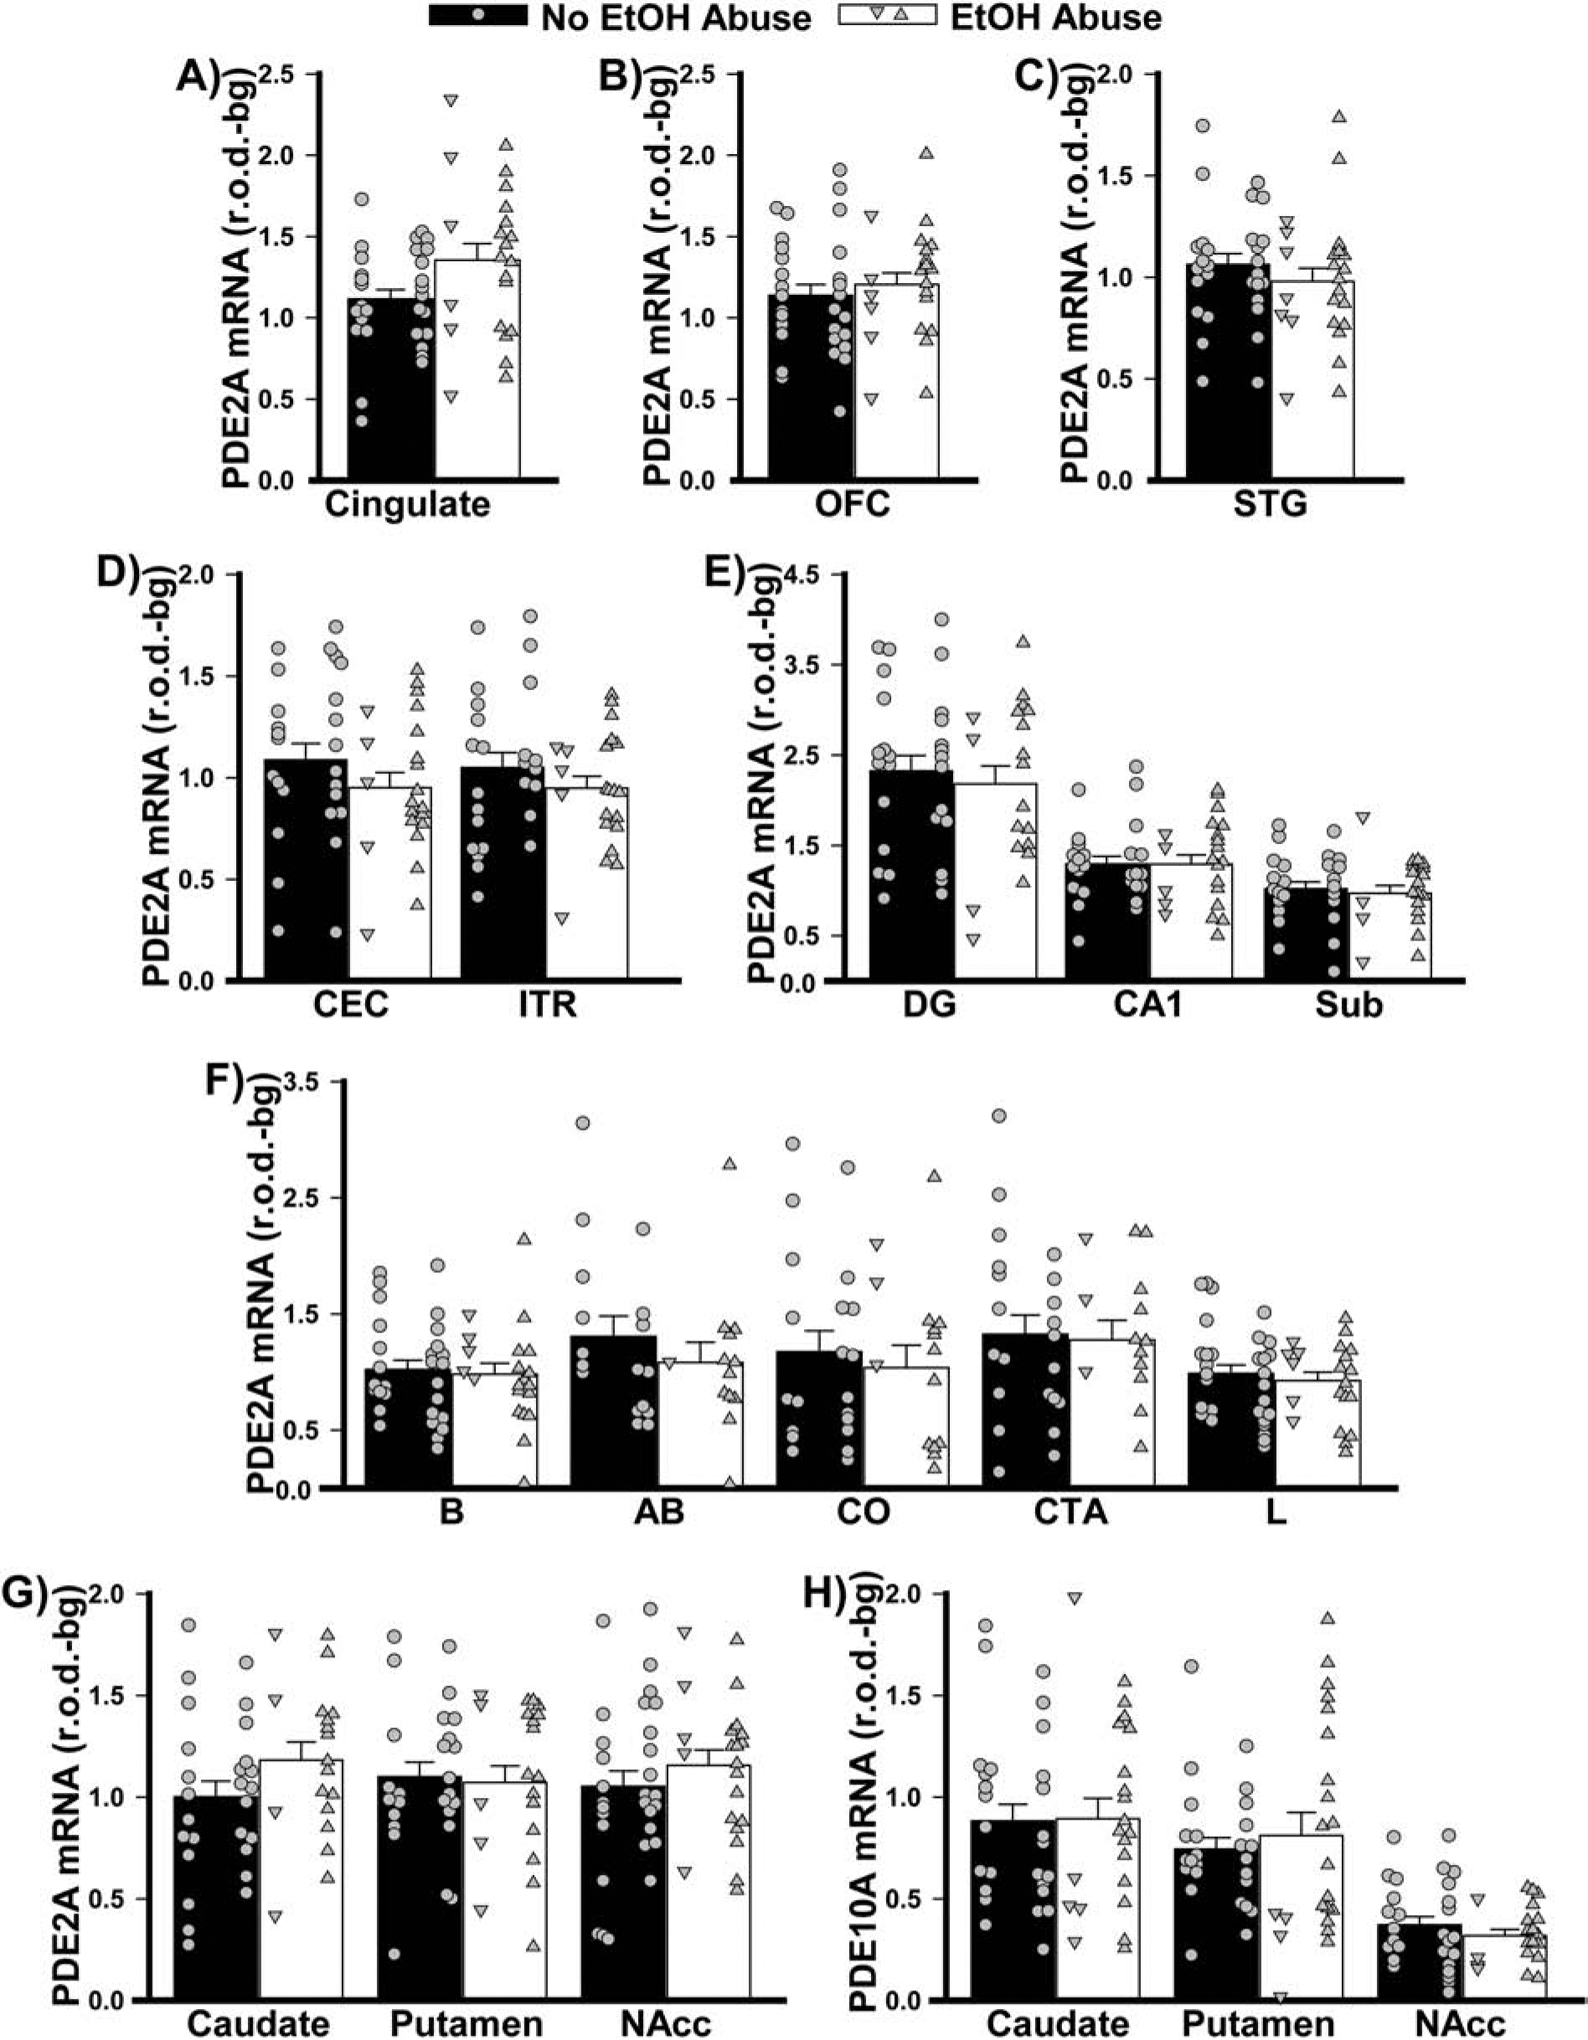
Data from Figure 2 replotted as per the past/present history of alcohol abuse.
3.5. Changes in PDE2A and PDE10A mRNA expression across the lifespan.
Neurodevelopmental deficits are thought to contribute to the etiology of psychiatric illnesses. As such, we mined data from the Allen Institute for Brain Sciences Brainspan database to determine if PDE2A and/or PDE10A mRNA expression may be regulated in an age-dependent manner. Strikingly, across all regions of interest studied here, PDE2A mRNA expression dramatically increased with age while PDE10A mRNA expression decreased in all regions except striatum (where it remained stable; Figure 9). The vast majority of the age-related changes occurred between the prenatal and childhood period, with minimal change between childhood and adulthood, except in the hippocampus.
Figure 9. PDE2A and PDE10A mRNA expression dramatically changes across the lifespan.
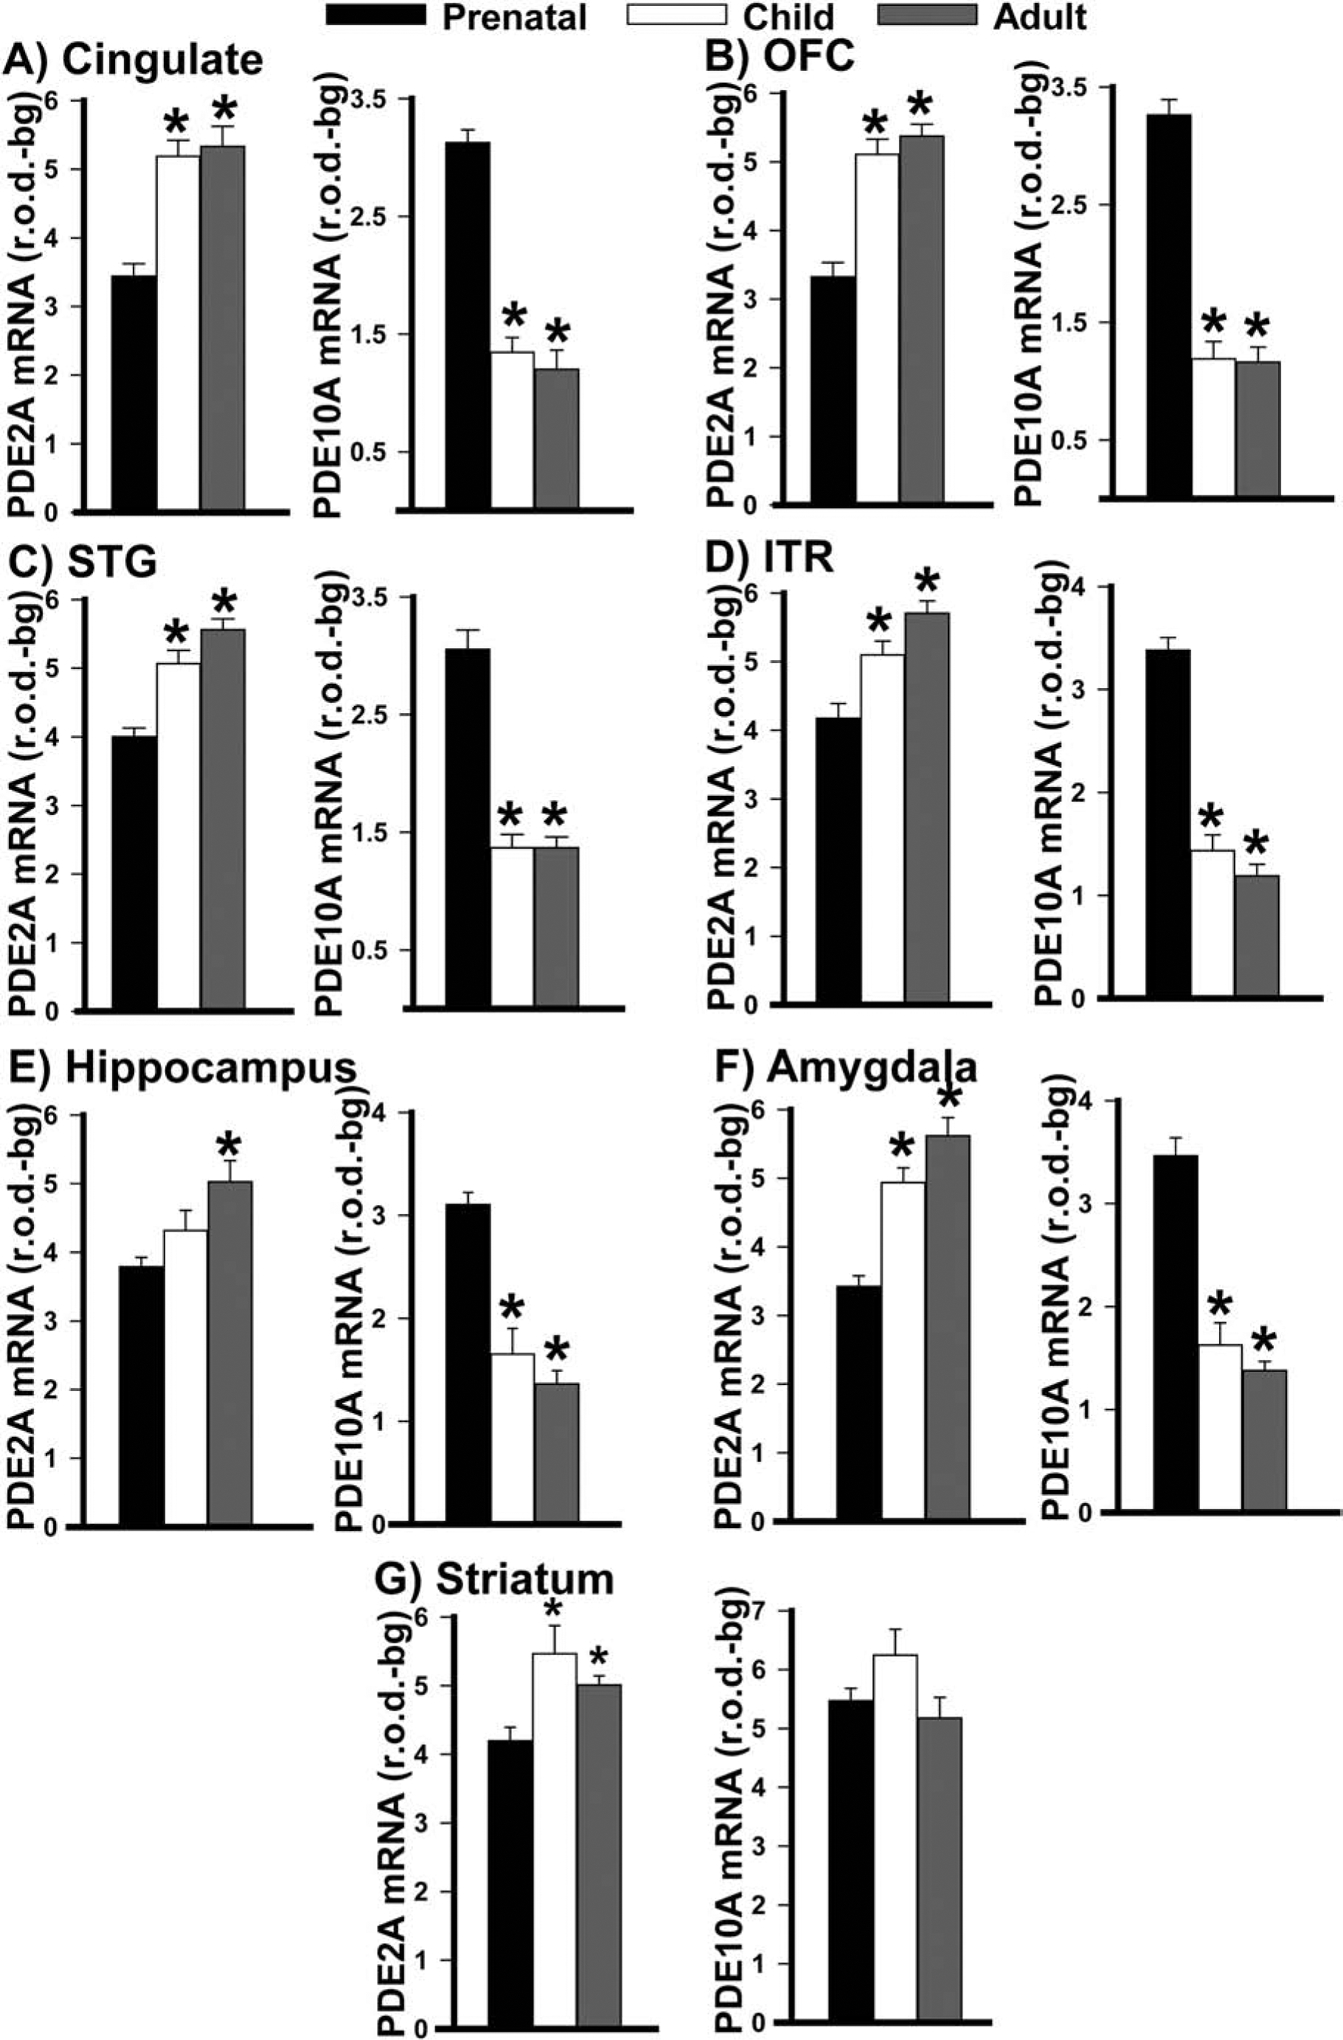
Across the lifespan, PDE2A mRNA expression increased and PDE10A mRNA expression decreased in A) cingulate cortex (PDE2A: F(2,27)=24.100, P=<0.001; PDE10A: F(2,28)=78.950, P=<0.001; post hoc: prenatal vs. child and adult, P<0.001 for each), B) orbital frontal cortex (PDE2A: F(2,26)=30.149, P<0.001; PDE10A: (F(2,27)=84.293, P<0.001; post hoc: prenatal vs. child and adult, P<0.001 for each), C) superior temporal gyrus (PDE2A: F(2,30)=20.986, P<0.001; PDE10A: failed normality, H(2,31)=22.731, P<0.001; Post hoc: prenatal vs. child and adult, P<0.001 for each), D) inferolateral temporal cortex (PDE2A: F(2,29)=12.233, P<0.001; PDE10A: F(2,30)=76.185, P<0.001; post hoc: prenatal vs. child and adult, P<0.002 for each), E) hippocampus (PDE2A: F(2,28)=7.376, P=0.002; PDE10A: failed equal variance, H(2,28)=20.129, P=<0.001; post hoc: prenatal vs. adult, P<0.001 for each, prenatal vs. child, P<0.001 for PDE10A), F) amygdala (PDE2A: failed normality, H(2,28)=20.321, P=<0.001; PDE10A: F(2,28)=35.132, P=<0.001; post hoc: PDE2A, prenatal vs. child, P=0.004; all other comparisons, P<0.001). G) While PDE2A mRNA expression also increases with age in the striatum (F(2,24)=6.921, P=0.004; post hoc: prenatal vs child, P=0.002; prenatal vs adult, P=0.032), there is no significant change in PDE10A expression (F(2,23)=2.536, P=0.101). Note, data were not available for caudal entorhinal cortex nor individual hippocampal nor amygdalar subregions/nuclei. *vs. prenatal, P=0.032 to <0.001.
4. DISCUSSION
In this study, we show that PDE2A mRNA expression is altered in both a brain region- and disorder-dependent manner in the context of MDD, BPD, and SCZ. Alterations in PDE2A mRNA expression within frontal cortical regions are most pronounced in patients with SCZ and those in the hippocampus and striatum are most pronounced in patients with BPD. The effect of psychiatric disease on PDE2A mRNA expression appears to be at least somewhat specific for this PDE family in that PDE10A mRNA expression showed no change. Further, death by suicide, psychoses, nor a past/present history of substance or alcohol abuse can fully account for PDE2A mRNA expression changes noted in patients. Psychiatric diseases are often considered neurodevelopmental disorders. In this context it is interesting to note that PDE2A mRNA expression normally increases across the lifespan in the brain regions of interest explored herein (Figure 9) and that, at least early in development, it is a target of the fragile X mental retardation protein (FMRP)[40]. This raises the interesting possibility that the decreases in PDE2A expression that were measured in the cortex and hippocampus of adult patients are the result of a neurodevelopmental failure to increase PDE2A mRNA across the lifespan. In contrast, PDE10A mRNA decreases across the lifespan, much like PDE9A mRNA[34], in all regions except the striatum. This sheds new light on the fact that PDE10A is so profoundly enriched in the striatum relative to other brain regions in the adult brain (Figure 1). Taken together, these results support a growing literature implicating altered cyclic nucleotide signaling in neuropsychiatric disorders.
BPD is often misdiagnosed as MDD or SCZ, leading to improper treatment and a poorer quality of life[9–11,41,42]. Thus, a diagnostic biomarker capable of differentiating these neuropsychiatric diseases would be of great benefit. Positron emission tomography (PET) ligands targeting PDE10A have been widely used to track disease presentation and progression in patients with schizophrenia, Parkinson’s, or Huntington’s Disease, the latter with highly reproducible results ([43–45]). Such studies have not yet been attempted with PDE2A, but a PDE2A PET ligand has been recently developed and proven safe in humans[31,46,47]. Our study suggests that MDD, BPD, and SCZ are each associated with a unique pattern of PDE2A mRNA expression changes. It remains to be determined whether or not these changes at the mRNA level will be reflected at the level of protein expression and/or catalytic activity. That said, evidence to date argues that PDE2A mRNA and protein expression are highly concordant in the brain [47–50]. As such, a PDE2A PET ligand may prove a novel biomarker that could assist in distinguishing these major psychiatric disorders. The question remains whether PDE2A expression changes noted herein reflect a fundamental pathophysiology or a compensatory change in response to other pathophysiology.
We showed that patients with MDD exhibit reduced PDE2A mRNA expression in the basal and accessory nucleus of the amygdala when compared to controls. Our findings complement reports in the literature showing decreased expression of PDE4 in the cingulate, STG, caudate, and putamen of unmedicated patients with MDD relative to controls[20]. These disease-associated decreases in PDE2A mRNA, which would be expected to increase cAMP and cGMP, may reflect an attempt to compensate for reduced signaling elsewhere in the cAMP and/or cGMP cascades. Briefly, the G-protein Gsα activates adenylyl cyclase to synthesize cAMP (Giα inhibits the cyclase), cAMP activates protein kinase A (PKA), cGMP activates protein kinase G (PKG), then PKA and PKG activate cyclic AMP response binding protein via phosphorylation (pCREB[31,51]). Despite the fact that unmedicated patients with MDD exhibit increased Gsα and decreased Gi2α in the prefrontal cortex, both of which would increase cAMP synthesis[52], they show decreased PKA activity[53]. In the hippocampus, cAMP stimulated-PKA activity is similarly decreased in both medicated and unmedicated suicide subjects with MDD when compared to controls[54]. Decreased CREB and/or pCREB have also been noted in the ITR[55], hippocampus[54], and OFC of unmedicated patients with MDD compared to controls[56]. Together, these studies suggest MDD is associated with reduced output of the cGMP and/or cAMP cascades in multiple brain regions, suggesting the decreases in PDE2A mRNA seen here reflect a compensatory change. Consistent with this suggestion, preclinical studies show that many antidepressants used in the clinic today appear to increase signaling output through the cAMP cascade in multiple brain regions[20,25,26,57] and studies in mice suggest PDE2A inhibitors produce antidepressant-like effects [58,59]. Reductions in PDE2A expression might also imply reduced cross-talk between the cGMP and cAMP cascades since cGMP stimulates the cAMP-hydrolytic activity of the enzyme.
We found a decrease in PDE2A mRNA in the CEC, hippocampus, and amygdala in patients with BPD when compared to controls. In stark contrast, patients with BPD exhibited significantly higher PDE2A mRNA expression in caudate compared to putamen or nucleus accumbens—a pattern that was not observed in the other groups. Other studies have also demonstrated alterations in the cAMP/cGMP cascade that vary by brain region. For example, there is increased Gsα immunoreactivity levels in medicated and unmedicated patients with BPD compared to controls in the prefrontal cortex and STG when compared to controls[60,61] (but see [28]). Also in the STG, there is an increase in forskolin-stimulated cAMP production in medicated and unmedicated patients with BPD relative to controls[61], which may reflect increased expression of adenylyl cyclase or reduced PDE activity. In the ITR of medicated and unmedicated patients with BPD, there is increased basal PKA activity compared to controls, which is accompanied by increased protein—but not mRNA—expression of the RIIβ and Cα PKA subunits[62–64]. Together, these studies might suggest that increased cAMP signaling drives BPD pathology in a number of brain regions. Consistent with this suggestion, multiple studies in rodents have reported that medications used to treat BPD decrease cAMP signaling in several brain regions, including the striatum, hippocampus, and cerebral cortices[65–68]. Further, studies comparing treated to untreated patients with BPD show decreased CREB or pCREB levels with medication use[28,69]. That said, one study found decreased CREB protein levels in the cingulate of both medicated and unmedicated patients with BPD relative to controls[70], and a handful of studies conducted in rodents found that chronic lithium increased cAMP signaling in the hippocampus, cerebral cortices, and frontal cortex when compared to controls[67,68,71]. Together, these results suggest that increased cAMP levels may drive BPD-related pathologies in a number of brain regions while decreased cAMP signaling may contribute in others. Thus, until it is possible to deliver therapeutics in a brain-region specific manner (e.g., using antibody-coupled small molecule inhibitors or activators[31]), a PDE2A-targeted therapeutic is unlikely to fully resolve symptoms associated with BPD and may even exacerbate select symptoms.
We found that patients with SCZ have decreased PDE2 mRNA expression in the cingulate, OFC, and the amygdala when compared to controls. This reduction in PDE2 mRNA would be expected to increase cAMP signaling; however, results are mixed in the literature when examining other steps in the cAMP cascade. For example, there is a decrease in GIα immunoreactivity, with no change to Gsα immunoreactivity, in the STG when compared to controls[23]. This could increase cAMP levels due to decreased inhibition of AC, consistent with the finding of increased [3H]cAMP binding sites in the STG of both medicated and unmedicated patients with SCZ relative to controls[23]. There is also evidence of increased AC levels in the parahippocampus and hippocampus of unmedicated and medicated patients with SCZ when compared to controls[72]. In contrast, decreased CREB mRNA and protein expression were found in cingulate cortex of medicated and unmedicated patients with SCZ relative to controls[70], as were decreased cAMP production[73] and decreased expression of PKA-R subunits in platelets of patients with SCZ (medication free for at least 2 weeks) when compared to controls[74]. It is interesting to speculate, then, that the decreased PDE2A expression we note here in cingulate cortex may be an attempt to compensate for this downregulated cAMP cascade signaling, and that this type of compensatory downregulation of PDE2A was not needed in STG or hippocampus due to the aforementioned compensatory changes impacting AC activity. That said, in the striatum and hippocampus of rodents, typical and atypical antipsychotics have almost opposite effects on the cAMP cascade, with chronic clozapine reducing cAMP signaling and chronic haloperidol increasing it[75,76]. Studies in transgenic mice suggest these haloperidol-induced increases in cAMP are, indeed, key to its therapeutic efficacy[77,78]. This may suggest that decreasing PDE2A levels, and therefore increasing cAMP levels, may help to attenuate symptoms of SCZ. PDE2A inhibitors have been considered for the treatment of SCZ [79,80], though none have reached clinical trials yet[31].
5. CONCLUSION
While this study contributes to our understanding, it also has its limitations. For one, this study only measures the mRNA expression of PDE2A and PDE10A, so it does not give information on the catalytic activity of these enzymes. Second, this study utilized tissue from a relatively small sample set. Therefore, replication of the experiment with an independent cohort is recommended. Another limitation includes the lack of information regarding the symptomatic status of patients at the time of their death, and the uncertainty regarding medication status. For example, it is not clear whether patients with bipolar disorder were in a manic, depressive, or euthymic state. Finally, although the technique employed herein enabled great anatomical specificity, it is low throughput and, thus, limited the number of PDEs we could test at this time. As such, we cannot rule out the possibility that other PDE families might demonstrate similar mRNA expression changes as noted herein for PDE2A. That said, this study provides important insight and lays the foundation for future experiments. For example, it will be of interest to virally manipulate PDE2A expression in a brain-region specific manner in a preclinical species to determine the causal effects of the expression changes described herein. Such an approach may help to determine if these disease-related changes in PDE2A expression reflect a primary pathophysiological change or a compensatory mechanism.
Supplementary Material
ACKNOWLEDGEMENTS
The authors would like to sincerely thank the subjects and their families for donating tissue as well as the Stanley Foundation and Dr. Maree Webster for overseeing this tissue collection. The authors would also like to acknowledge Tyler McKenzie for technical support. This work was funded by start-up funds from the USC School of Medicine (MPK), a Magellan Scholar Award and mini-Grant from the USC Office of the Vice President for Research (RF), and a grant from NIMH (1R01MH101130 to MPK). The content of this manuscript is solely the responsibility of the authors and does not necessarily represent the official views of the National Institutes of Health.
Footnotes
Publisher's Disclaimer: This is a PDF file of an unedited manuscript that has been accepted for publication. As a service to our customers we are providing this early version of the manuscript. The manuscript will undergo copyediting, typesetting, and review of the resulting proof before it is published in its final form. Please note that during the production process errors may be discovered which could affect the content, and all legal disclaimers that apply to the journal pertain.
CONFLICT OF INTEREST STATEMENT: The authors declare no financial conflicts of interest.
REFERENCES
- [1].Mathers C, Boerma T, Ma Fat B: The global burden of disease: 2004 update. World Health Organization, (2008). [Google Scholar]
- [2].Schretlen DJ, Cascella NG, Meyer SM, Kingery LR, Testa SM, Munro CA, Pulver AE, Rivkin P, Rao VA, Diaz-Asper CM, Dickerson FB et al. , Biol Psychiatry, 62 (2007) 179–186. [DOI] [PMC free article] [PubMed] [Google Scholar]
- [3].Lee RS, Hermens DF, Porter MA, Redoblado-Hodge MA, J Affect Disord, 140 (2012) 113–124. [DOI] [PubMed] [Google Scholar]
- [4].Judd LL, Akiskal HS, Schettler PJ, Coryell W, Endicott J, Maser JD, Solomon DA, Leon AC, Keller MB, Arch Gen Psychiatry, 60 (2003) 261–269. [DOI] [PubMed] [Google Scholar]
- [5].Benazzi F, Eur Psychiatry, 14 (1999) 458–461. [DOI] [PubMed] [Google Scholar]
- [6].American psychiatric association: Diagnostic and statistical manual of mental disorders, fifth edition American Psychiatric Association, Arlington, VA: (2013). [Google Scholar]
- [7].Gaudiano BA, Dalrymple KL, Zimmerman M, Depress Anxiety, 26 (2009) 54–64. [DOI] [PMC free article] [PubMed] [Google Scholar]
- [8].Barnett JH, Smoller JW, Neuroscience, 164 (2009) 331–343. [DOI] [PMC free article] [PubMed] [Google Scholar]
- [9].Gonzalez-Pinto A, Gutierrez M, Mosquera F, Ballesteros J, Lopez P, Ezcurra J, Figuerido JL, de Leon J, J Affect Disord, 50 (1998) 41–44. [DOI] [PubMed] [Google Scholar]
- [10].Ghaemi SN, Boiman EE, Goodwin FK, J Clin Psychiatry, 61 (2000) 804–808; quiz 809. [DOI] [PubMed] [Google Scholar]
- [11].Ghaemi SN, Sachs GS, Chiou AM, Pandurangi AK, Goodwin K, J Affect Disord, 52 (1999) 135–144. [DOI] [PubMed] [Google Scholar]
- [12].McKnight RF, Adida M, Budge K, Stockton S, Goodwin GM, Geddes JR, Lancet, 379 (2012) 721–728. [DOI] [PubMed] [Google Scholar]
- [13].Bowden CL, Brugger AM, Swann AC, Calabrese JR, Janicak PG, Petty F, Dilsaver SC, Davis JM, Rush AJ, Small JG, JAMA, 271 (1994) 918–924. [PubMed] [Google Scholar]
- [14].Lieberman JA, Stroup TS, McEvoy JP, Swartz MS, Rosenheck RA, Perkins DO, Keefe RS, Davis SM, Davis CE, Lebowitz BD, Severe J et al. , N Engl J Med, 353 (2005) 1209–1223. [DOI] [PubMed] [Google Scholar]
- [15].Corey-Lisle PK, Nash R, Stang P, Swindle R, Arch Intern Med, 164 (2004) 1197–1204. [DOI] [PubMed] [Google Scholar]
- [16].Allison DB, Mentore JL, Heo M, Chandler LP, Cappelleri JC, Infante MC, Weiden PJ, Am J Psychiatry, 156 (1999) 1686–1696. [DOI] [PubMed] [Google Scholar]
- [17].Rummel-Kluge C, Komossa K, Schwarz S, Hunger H, Schmid F, Kissling W, Davis JM, Leucht S, Schizophr Bull, 38 (2012) 167–177. [DOI] [PMC free article] [PubMed] [Google Scholar]
- [18].Steffens DC, Krishnan KR, Helms MJ, Depress Anxiety, 6 (1997) 10–18. [DOI] [PubMed] [Google Scholar]
- [19].Montejo-González AL, Llorca G, Izquierdo JA, Ledesma A, Bousoño M, Calcedo A, Carrasco JL, Ciudad J, Daniel E, De la Gandara J, Derecho J et al. , J Sex Marital Ther, 23 (1997) 176–194. [DOI] [PubMed] [Google Scholar]
- [20].Fujita M, Richards EM, Niciu MJ, Ionescu DF, Zoghbi SS, Hong J, Telu S, Hines CS, Pike VW, Zarate CA, Innis RB, Mol Psychiatry, 22 (2017) 754–759. [DOI] [PMC free article] [PubMed] [Google Scholar]
- [21].Yuan P, Zhou R, Wang Y, Li X, Li J, Chen G, Guitart X, Manji HK, J Affect Disord, 124 (2010) 164–169. [DOI] [PMC free article] [PubMed] [Google Scholar]
- [22].Rahman S, Li PP, Young LT, Kofman O, Kish SJ, Warsh JJ, J Neurochem, 68 (1997) 297–304. [DOI] [PubMed] [Google Scholar]
- [23].Nishino N, Kitamura N, Hashimoto T, Kajimoto Y, Shirai Y, Murakami N, Nakai T, Komure O, Shirakawa O, Mita T, et al. , Brain Res, 615 (1993) 41–49. [DOI] [PubMed] [Google Scholar]
- [24].Dwivedi Y, Pandey GN, Neuropsychiatr Dis Treat, 4 (2008) 161–176. [DOI] [PMC free article] [PubMed] [Google Scholar]
- [25].Nibuya M, Nestler EJ, Duman RS, J Neurosci, 16 (1996) 2365–2372. [DOI] [PMC free article] [PubMed] [Google Scholar]
- [26].Thome J, Sakai N, Shin K, Steffen C, Zhang YJ, Impey S, Storm D, Duman RS, J Neurosci, 20 (2000) 4030–4036. [DOI] [PMC free article] [PubMed] [Google Scholar]
- [27].Konradi C, Heckers S, Neuroscience, 65 (1995) 1051–1061. [DOI] [PubMed] [Google Scholar]
- [28].Dowlatshahi D, MacQueen GM, Wang JF, Reiach JS, Young LT, J Neurochem, 73 (1999) 1121–1126. [DOI] [PubMed] [Google Scholar]
- [29].Kelly MP, Adamowicz W, Bove S, Hartman AJ, Mariga A, Pathak G, Reinhart V, Romegialli A, Kleiman RJ, Cell Signal, 26 (2014) 383–397. [DOI] [PubMed] [Google Scholar]
- [30].Lakics V, Karran EH, Boess FG, Neuropharmacology, 59 (2010) 367–374. [DOI] [PubMed] [Google Scholar]
- [31].Baillie GS, Tejeda GS, Kelly MP, Nature Reviews Drug Discovery, (2019). [DOI] [PMC free article] [PubMed] [Google Scholar]
- [32].Torrey EF, Webster M, Knable M, Johnston N, Yolken RH, Schizophr Res, 44 (2000) 151–155. [DOI] [PubMed] [Google Scholar]
- [33].Kim S, Webster MJ, Neurosci Bull, 35 (2019) 277–282. [DOI] [PMC free article] [PubMed] [Google Scholar]
- [34].Patel NS, Klett J, Pilarzyk K, Lee DI, Kass D, Menniti FS, Kelly MP, Neurobiol Aging, 65 (2018) 217–234. [DOI] [PMC free article] [PubMed] [Google Scholar]
- [35].Miller JA, Ding SL, Sunkin SM, Smith KA, Ng L, Szafer A, Ebbert A, Riley ZL, Royall JJ, Aiona K, Arnold JM et al. , Nature, 508 (2014) 199–206. [DOI] [PMC free article] [PubMed] [Google Scholar]
- [36].Salpietro V, Perez-Duenas B, Nakashima K, San Antonio-Arce V, Manole A, Efthymiou S, Vandrovcova J, Bettencourt C, Mencacci NE, Klein C, Kelly MP et al. , Mov Disord, 33 (2018) 482–488. [DOI] [PMC free article] [PubMed] [Google Scholar]
- [37].Ding SL, Van Hoesen GW, J Comp Neurol, 523 (2015) 2233–2253. [DOI] [PubMed] [Google Scholar]
- [38].Brabec J, Rulseh A, Hoyt B, Vizek M, Horinek D, Hort J, Petrovicky P: Volumetry of the human amygdala - an anatomical study. In: 182 Psychiatry Research: Neuroimaging, (2010): 67–72. [DOI] [PubMed] [Google Scholar]
- [39].Knable MB, Torrey EF, Webster MJ, Bartko JJ, Brain Res Bull, 55 (2001) 651–659. [DOI] [PubMed] [Google Scholar]
- [40].Maurin T, Melancia F, Jarjat M, Castro L, Costa L, Delhaye S, Khayachi A, Castagnola S, Mota E, Di Giorgio A, Servadio M et al. , Cereb Cortex, 29 (2019) 3241–3252. [DOI] [PubMed] [Google Scholar]
- [41].Awad AG, Rajagopalan K, Bolge SC, McDonnell DD, Prim Care Companion J Clin Psychiatry, 9 (2007) 195–202. [DOI] [PMC free article] [PubMed] [Google Scholar]
- [42].Shen H, Zhang L, Xu C, Zhu J, Chen M, Fang Y, Shanghai Arch Psychiatry, 30 (2018) 93–101. [DOI] [PMC free article] [PubMed] [Google Scholar]
- [43].Russell DS, Jennings DL, Barret O, Tamagnan GD, Carroll VM, Caille F, Alagille D, Morley TJ, Papin C, Seibyl JP, Marek KL, Neurology, 86 (2016) 748–754. [DOI] [PubMed] [Google Scholar]
- [44].Niccolini F, Foltynie T, Reis Marques T, Muhlert N, Tziortzi AC, Searle GE, Natesan S, Kapur S, Rabiner EA, Gunn RN, Piccini P et al. , Brain, 138 (2015) 3003–3015. [DOI] [PubMed] [Google Scholar]
- [45].Marques TR, Natesan S, Niccolini F, Politis M, Gunn RN, Searle GE, Howes O, Rabiner EA, Kapur S, Am J Psychiatry, 173 (2016) 714–721. [DOI] [PubMed] [Google Scholar]
- [46].Chen L, Nabulsi N, Naganawa M, Zasadny K, Skaddan MB, Zhang L, Najafzadeh S, Lin SF, Helal CJ, Boyden TL, Chang C et al. , J Nucl Med, 57 (2016) 1448–1453. [DOI] [PMC free article] [PubMed] [Google Scholar]
- [47].Naganawa M, Waterhouse RN, Nabulsi N, Lin SF, Labaree D, Ropchan J, Tarabar S, DeMartinis N, Ogden A, Banerjee A, Huang Y et al. , J Nucl Med, 57 (2016) 1388–1395. [DOI] [PMC free article] [PubMed] [Google Scholar]
- [48].Stephenson DT, Coskran TM, Kelly MP, Kleiman RJ, Morton D, O’Neill SM, Schmidt CJ, Weinberg RJ, Menniti FS, Neuroscience, 226 (2012) 145–155. [DOI] [PMC free article] [PubMed] [Google Scholar]
- [49].Pathak G, Agostino MJ, Bishara K, Capell WR, Fisher JL, Hegde S, Ibrahim BA, Pilarzyk K, Sabin C, Tuczkewycz T, Wilson S et al. , Mol Psychiatry, 22 (2017) 1714–1724. [DOI] [PMC free article] [PubMed] [Google Scholar]
- [50].Stephenson DT, Coskran TM, Wilhelms MB, Adamowicz WO, O’Donnell MM, Muravnick KB, Menniti FS, Kleiman RJ, Morton D, J Histochem Cytochem, 57 (2009) 933–949. [DOI] [PMC free article] [PubMed] [Google Scholar]
- [51].Kelly MP, Cell Signal, 42 (2018) 281–291. [DOI] [PMC free article] [PubMed] [Google Scholar]
- [52].Dwivedi Y, Rizavi HS, Conley RR, Roberts RC, Tamminga CA, Pandey GN, Neuropsychopharmacology, 27 (2002) 499–517. [DOI] [PubMed] [Google Scholar]
- [53].Shelton RC, Sanders-Bush E, Manier DH, Lewis DA, Neuroscience, 158 (2009) 1406–1415. [DOI] [PMC free article] [PubMed] [Google Scholar]
- [54].Dwivedi Y, Rao JS, Rizavi HS, Kotowski J, Conley RR, Roberts RC, Tamminga CA, Pandey GN, Arch Gen Psychiatry, 60 (2003) 273–282. [DOI] [PubMed] [Google Scholar]
- [55].Dowlatshahi D, MacQueen GM, Wang JF, Young LT, Lancet, 352 (1998) 1754–1755. [DOI] [PubMed] [Google Scholar]
- [56].Yamada S, Yamamoto M, Ozawa H, Riederer P, Saito T, J Neural Transm (Vienna), 110 (2003) 671–680. [DOI] [PubMed] [Google Scholar]
- [57].Tiraboschi E, Tardito D, Kasahara J, Moraschi S, Pruneri P, Gennarelli M, Racagni G, Popoli M, Neuropsychopharmacology, 29 (2004) 1831–1840. [DOI] [PubMed] [Google Scholar]
- [58].Xu Y, Pan J, Chen L, Zhang C, Sun J, Li J, Nguyen L, Nair N, Zhang H, O’Donnell JM, Int J Neuropsychopharmacol, 16 (2013) 835–847. [DOI] [PubMed] [Google Scholar]
- [59].Ding L, Zhang C, Masood A, Li J, Sun J, Nadeem A, Zhang HT, O’ Donnell JM, Xu Y, Behav Brain Res, 268 (2014) 150–158. [DOI] [PMC free article] [PubMed] [Google Scholar]
- [60].Young LT, Li PP, Kish SJ, Siu KP, Warsh JJ, Brain Res, 553 (1991) 323–326. [DOI] [PubMed] [Google Scholar]
- [61].Young LT, Li PP, Kish SJ, Siu KP, Kamble A, Hornykiewicz O, Warsh JJ, J Neurochem, 61 (1993) 890–898. [DOI] [PubMed] [Google Scholar]
- [62].Fields A, Li PP, Kish SJ, Warsh JJ, J Neurochem, 73 (1999) 1704–1710. [DOI] [PubMed] [Google Scholar]
- [63].Chang A, Li PP, Warsh JJ, J Neurochem, 84 (2003) 781–791. [DOI] [PubMed] [Google Scholar]
- [64].Chang A, Li PP, Warsh JJ, Brain Res Mol Brain Res, 116 (2003) 27–37. [DOI] [PubMed] [Google Scholar]
- [65].Jakobsen SN, Wiborg O, Brain Res, 780 (1998) 46–55. [DOI] [PubMed] [Google Scholar]
- [66].Chen G, Pan B, Hawver DB, Wright CB, Potter WZ, Manji HK, J Neurochem, 67 (1996) 2079–2086. [DOI] [PubMed] [Google Scholar]
- [67].Li PP, Young LT, Tam YK, Sibony D, Warsh JJ, Biol Psychiatry, 34 (1993) 162–170. [DOI] [PubMed] [Google Scholar]
- [68].Wiborg O, Krüger T, Jakobsen SN, Pharmacol Toxicol, 84 (1999) 88–93. [DOI] [PubMed] [Google Scholar]
- [69].Young LT, Bezchlibnyk YB, Chen B, Wang JF, MacQueen GM, Biol Psychiatry, 55 (2004) 570–577. [DOI] [PubMed] [Google Scholar]
- [70].Ren X, Rizavi HS, Khan MA, Bhaumik R, Dwivedi Y, Pandey GN, J Affect Disord, 152-154 (2014) 326–333. [DOI] [PMC free article] [PubMed] [Google Scholar]
- [71].Mori S, Tardito D, Dorigo A, Zanardi R, Smeraldi E, Racagni G, Perez J, Neuropsychopharmacology, 19 (1998) 233–240. [DOI] [PubMed] [Google Scholar]
- [72].Kerwin RW, Beats BC, Neurosci Lett, 118 (1990) 164–168. [DOI] [PubMed] [Google Scholar]
- [73].Kafka MS, van Kammen DP, Bunney WE Jr., Am J Psychiatry, 136 (1979) 685–687. [DOI] [PubMed] [Google Scholar]
- [74].Tardito D, Tura GB, Bocchio L, Bignotti S, Pioli R, Racagni G, Perez J, Neuropsychopharmacology, 23 (2000) 216–219. [DOI] [PubMed] [Google Scholar]
- [75].Dwivedi Y, Rizavi HS, Pandey GN, J Pharmacol Exp Ther, 301 (2002) 197–209. [DOI] [PubMed] [Google Scholar]
- [76].Pozzi L, Håkansson K, Usiello A, Borgkvist A, Lindskog M, Greengard P, Fisone G, J Neurochem, 86 (2003) 451–459. [DOI] [PubMed] [Google Scholar]
- [77].Kelly MP, Stein JM, Vecsey CG, Favilla C, Yang X, Bizily SF, Esposito MF, Wand G, Kanes SJ, Abel T, Mol Psychiatry, 14 (2009) 398–415, 347. [DOI] [PMC free article] [PubMed] [Google Scholar]
- [78].Kelly MP, Isiegas C, Cheung YF, Tokarczyk J, Yang X, Esposito MF, Rapoport DA, Fabian SA, Siegel SJ, Wand G, Houslay MD et al. , Neuropsychopharmacology, 32 (2007) 577–588. [DOI] [PMC free article] [PubMed] [Google Scholar]
- [79].Mikami S, Kawasaki M, Ikeda S, Negoro N, Nakamura S, Nomura I, Ashizawa T, Kokubo H, Hoffman ID, Zou H, Oki H et al. , Chem Pharm Bull (Tokyo), 65 (2017) 1058–1077. [DOI] [PubMed] [Google Scholar]
- [80].Mikami S, Nakamura S, Ashizawa T, Nomura I, Kawasaki M, Sasaki S, Oki H, Kokubo H, Hoffman ID, Zou H, Uchiyama N et al. , J Med Chem, 60 (2017) 7677–7702. [DOI] [PubMed] [Google Scholar]
Associated Data
This section collects any data citations, data availability statements, or supplementary materials included in this article.


