Abstract
Background
The NLRP3 inflammasome activation plays an important role in the development of NASH and fibrogenesis. However, the mechanisms involved in NLRP3 activation in hepatic stellate cells (HSCs) have been unclear. The aim of this study was to investigate the mechanism of NLRP3 activation in HSCs and the role of NLPR3 inflammasome activation in HSCs on the development of nonalcoholic steatohepatitis (NASH) to fibrosis.
Methods
Primary HSCs isolated from SD rats were incubated with palmitic acid and/or LPS, respectively. For in vivo animal experiment, 4-week-old SD rats were fed with high fat diet (HF-diet) for 12 weeks, SD rats were sacrificed at 0, 4, 8 and 12 w. In another group of animal experiment, 4-week-old SD rats were fed with HF-diet and a NLRP3 inhibitor (intraperitoneal injection of NLRP3 inhibitor glybenclamide 5 mg/kg, injected every 3 days) for 12 weeks. Liver tissue and serum were harvested. RT-PCR, WB, ELISA, immunofluorescence and immunohistochemistry were performed to assess the NLRP3 inflammasome activation and signal molecules.
Results
Palmitic acid stimulated NLPR3 inflammasome activation and fibrotic phenotype change in primary HSCs, LPS sensitizes the response of HSCs to palmitic acid. TLR4-NF-κB signal pathway was involved in NLRP3 inflammasome activation in palmitic acid-exposed HSCs and HF diet-induced NASH. It is evident that administration of NLRP3 inhibitor reduced the development of NASH to liver fibrosis in the NASH rat model.
Conclusions
Palmitic acid stimulates NLRP3 inflammasome activation through the TLR4-NF-κB signal pathway in HSCs. NLRP3 inflammasome activation in HSCs exacerbates the development of NASH to liver fibrosis.
Keywords: Inflammasome, NLRP3, hepatic stellate cell (HSC), non-alcoholic hepatosteatosis
Introduction
Nonalcoholic fatty liver disease (NAFLD) is a major cause resulting in chronic liver diseases, which encompassed a wide histopathological spectrum ranging from steatosis alone, nonalcoholic steatohepatitis (NASH) to liver fibrosis (1). NASH is a progressive disease and can progress to liver fibrosis, cirrhosis and end-stage liver disease. Excessive fatty acid accumulation in liver accounted for hepatocellular injury and death, and further inflammation stimuli and immune repose and caused fibrogenesis (2,3). In the complex paradigm, the activation of hepatic stellate cells (HSCs) is the key of fibrosis development, due to HSCs activation resulting in the deposition of excessive extracellular matrix and the formation of scar tissue (3,4).
NLRP3 inflammasomes are multi-protein complexes which express in hepatic parenchymal and nonparenchymal cells (5,6). NLRP3 inflammasome is inactive in cells at normal situation. When cells are subjected to danger signals, NLRP3 inflammasome is activated and interacts with pro-caspase 1 and apoptosis-associated speck-like CARD-domain containing protein (ASC) and the serine protease caspase 1. Activation of NLRP3 inflammasome leads to the cleavage and activation of pro-caspase 1, which further promotes the maturation of proinflammatory cytokines such as interleukin (IL)-1β, IL-18 and results in proinflammatory responses (7).
Multiple studies have shown inflammasome activation plays an important role on various liver diseases including the progression of NASH and fibrogenesis (6,8,9). A recent study highlighted NLRP3 inflammasome may trigger HSC activation and promote fibrosis development (10). However, the mechanisms involved in NLRP3 activation in HSCs remain unclear. The aim of this study was to investigate the mechanism on NLRP3 inflammasome activation in HSCs and the role of NLPR3 inflammasome activation in HSCs on the development of NASH to fibrosis.
Methods
Experimental animals
The animal experiments were approved by the Animal Ethics Committee of Shanghai Jiao Tong University. Four-week-old male Sprague Dawley (SD) rats were maintained at a humidity under 12 h light/dark cycles. NASH-related liver fibrosis in rats was produced by high fat diet (HF)-feeding (D12492, Research Diets) for 12 weeks. Controls were fed with a standard rodent chow. Rats were euthanized, and liver tissue and plasma were collected after 4, 8 and 12 weeks, respectively.
NLRP3 inhibitor treatment
In the second experiment, 4-week-old male SD rats were randomly divided into the experiment group and the control group, SD rats were fed with a HF diet. The experiment group received an intraperitoneal (i.p.) injection of NLRP3 inhibitor (glybenclamide), 5 mg/kg body weight for once every 3 days, while the control group received i.p. injection of the same dose of saline only. All the rats were euthanized after 12 weeks. Plasma and liver tissue were collected.
Cell culture and treatment
Primary HSCs were isolated from SD rats as described previously (11). HSCs were seed in a 6-well plate with Dulbecco’s modified Eagle’s medium (DMEM; HyClone, Logan, UT, USA) and 20% fetal bovine serum (FBS; Gibco, Carlsbad, CA, USA), supplemented with 1% (v/v) penicillin-streptomycin at 37 °C in 5% CO2 incubator for 48 h. Then, primary HSCs were exposed to palmitic acid (PA) (Sigma, St. Louis, MO, USA) at 200 µm with or without treatment with LPS (1 µg/mL) for 6 h after serum-starving. Cells and culture supernatant were harvested for further experiments.
Cell viability
HSCs vitality was detected by cell counting kit-8 (CCK-8) (CK04-05, DOJINDO, Japan). HSCs vitality was measured after treatment 0, 24, 48 and 72 h, respectively. The procedure was performed according to the manufacturer’s instructions. The optical density (OD) value was then measured at 450 nm wavelength using a microplate reader (Multiskan, Thermo, USA).
Invasion assay
To assess HSCs migration, 24-well Matrigel transwell chamber was used. The cells were placed into the chamber at a density of 2×10⁴ cell per well, 500 µL DMEM medium was added to the outer chamber and incubated in 37 °C for 24 h, then removed and cells were fixed with 5% glutaradehyde at 4 °C. After washing with PBS buffer, cells were stained with 0.1% crystal violet (Solite, Beijing, China) and were counted.
Caspase 1 activity assay
Caspase 1 activity in HSCs was determined with a colorimetric assay (R&D System, USA).
RNA isolation and RT-PCR assay
Total RNA was extracted from HSCs after treatment using TRIzol reagent (Invitorgen, Carlsbad, California, USA) according to the manufacturer’s protocols. cDNA was synthesized from 1 μg of total RNA using SuperScriptIII reverse transcriptase and random primers (Invitrogen, Carlsbad, CA, USA). qRT-PCR was performed according to instructions with the Power SYBR Green PCR Master Mix (Applied Biosystems, Foster City, CA, USA). The relative gene expression was normalized to β-actin. All primers sequences in the study were shown in Table 1.
Table 1. Sequences of primers for quantitative real-time PCR.
| Gene name | Forward primer sequence (5'-3') | Reverse primer sequence (5'-3') |
|---|---|---|
| Rat | ||
| NLRP3 | TCTGTTCATTGGCTGCGGAT | TAGCCGCAAAGAACTCCTGG |
| IL-1β | TTGAGTCTGCACAGTTCCCC | TCCTGGGGAAGGCATTAGGA |
| IL-18 | CAGAAGCTGGGGTTGGTGAA | CCCATGTCTCCAAGGGCATT |
| Caspase 1 | GGAGCTTCAGTCAGGTCCAT | CTTGAGGGAACCACTCGGTC |
| aSMA | GGAGATGGCGTGACTCACAA | CGCTCAGCAGTAGTCACGAA |
| Collagen I | CCCAGCGGTGGTTATGACTT | TCGATCCAGTACTCTCCGCT |
| TGFβ | AGGGCTACCATGCCAACTTC | CCACGTAGTAGACGATGGGC |
| CTGF | CTTCCCGAGAAGGGTCAAGC | TCTTCCAGTCGGTAGGCAGC |
| Fibronectin | GGATCCCCTCCCAGAGAAGT | GGGTGTGGAAGGGTAACCAG |
| TIMP1 | GCCTCTGGCATCCTCTTGTT | AGCGTCGAATCCTTTGAGCA |
| Bax | TGGCGATGAACTGGACAACA | TAGAAAAGGGCAACCACCCG |
| Caspase 3 | GCTGGACTGCGGTATTGAGA | TAGTAACCGGGTGCGGTAGA |
| β-actin | GAACCCTAAGGCCAACCGTG | AACCGCTCATTGCCGATAGT |
Western blot analysis
Total proteins were extracted from liver tissue by RIPA lysis buffer (Ruian BioTechnology, Shanghai). The concentration of protein was measured using a BCA protein assay kit (Pierce Biotechnology, Rockford, USA) according to the manufacturer’s protocols. Forty mg protein was loaded and subjected to dodecyl sulphate-polyacrylamide gel (SDS-PAGE) electrophoresis, and then transferred onto polyvinylidene fluoride (PVDF) membranes (Millipore, Bedford, MA, USA). The membranes were immunoblotted with the indicated antibodies and imaged using an ECL detection system (Tanon, Shanghai, China). NLRP3 (1:500); αSMA (1:500); Collagen I (1:500); p-IκB (1:500); p-NF-κB p65 (1:500); IL-1β (1:500); NF-κB p65 (1:500) were purchased from Biosynthesis Biotechnology Inc. (Beijing, China); NF-κB p50 (1:500) and TLR4 (1:500) were purchased from Abcam (Cambridge, MA, USA), anti-IκB (1:1,000); anti-caspase 1 (1:1,000); β-actin (1:2,000) were purchased from Santa Cruz Biotechnology (Santa Cruz, CA, USA).
Immunofluorescent staining
After treatment, HSCs were washed three times with PBS and fixed in 4% paraformaldehyde solution for 30 min, blocked in 5% BSA for one hour, and then incubated with primary/secondary antibodies, then cells were incubated with 4',6-diamidino-2-phenylindole (DAPI) for 5 min. Images were obtained under a fluorescence microscopy system (IX5, Olympus, Japan).
Enzyme-linked immunosorbent assay (ELISA) and Biochemical analysis
IL-1β and IL-18 levels in cell culture supernatants or sera or liver tissue were determined by ELISA kits (Elabscience, Wuhan, China) according to the manufacturer’s instructions.
Alanine aminotransferase (ALT), aspartate aminotransferase (AST), total triglyceride and cholesterol levels were determined using commercial kits according to the manufacturers’ protocols (Nanjing Jiancheng Bioengineering Institute).
Construction of expression vectors
The lentivirus vector NLRP3 ShRNA (LV452_pL-NLRP3-shRNA-3300) from Nuobai Biological Technology Co., Ltd. (Shanghai, China) was used to suppress NLRP3 expression. Transfection efficacy was assessed by western blotting. After 48 h of transfection, cells were treated in the medium containing PA and/or LPS.
Assessment of liver pathology and immunohistochemistry
Liver samples were fixed in 10% phosphate-buffered (PBS) formalin and paraffin embedded for pathological assessment. The liver sections were stained with haematoxylin and eosin (H&E) and picro-sirius red and immunohistochemistry following the routine protocols as described, respectively (12,13). Antibodies were as below: NLRP3, IL1b, caspase 1 (Abcam, Cambridge, MA, USA).
Statistical analysis
Statistical analysis was performed using SPSS 19.0 software (SPSS Inc., Chicago, USA). Results are described as mean ± standard error. Student t-test was used to analyze the comparisons between two groups. Two-way ANOVA was used for the comparison of more than two groups. P<0.05 was considered statistically significant.
Results
PA directly induced NLRP3 inflammasome activation in primary HSCs and LPS sensitized effect of palmitic acid on HSCs
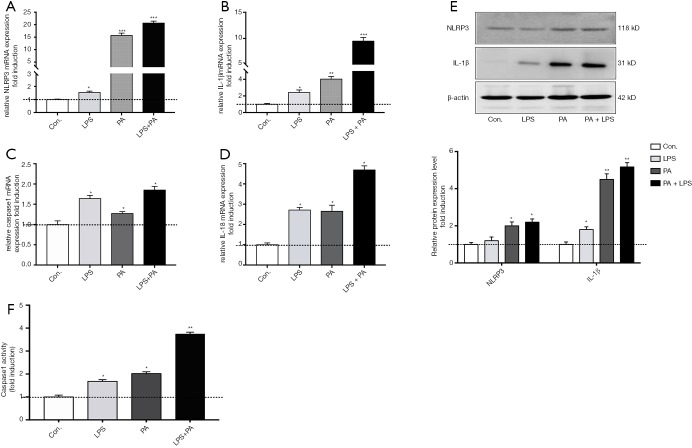
NLRP3 inflammasome activation is associated with liver fibrosis. To determine whether palmate acid directly induced NLRP3 inflammasome activation in HSCs, primary HSCs isolating from SD rats were exposed to PA (200 µm), LPS (1 µg/mL) or both for 12 h, As shown in Figure 1, palmitic acid or LPS alone significantly upregulated NLRP3, IL-1β, caspase 1 and IL-18 gene expression in primary HSCs (P<0.05). In order to further confirm that the NLRP3 inflammasome was activated in HSCs, the protein expression of NLRP3/IL-1β and caspase 1 activity were respectively determined. Increased NLRP3 and IL-1β protein in HSCs and caspase 1 activity were observed in PA and/or LPS-exposed HSCs (P<0.05, Figure 1E,F). Significantly higher gene and protein level of NLRP3 and IL-1β were observed in HSCs subjected to PA plus LPS in comparison with HSCs exposed to the PA or LPS alone (P<0.01, Figure 1A,B,C,D). These data indicate a direct role for palmitic acid in NLRP3 inflammasome activation in primary HSCs, and LPS sensitizes the effect of PA on HSCs.
Figure 1.
PA activates NLRP3 inflammasome in primary HSCs and LPS sensitizes HSCs to PA. Primary HSCs (day 2) were exposed to PA (200 µM) with or without LPS (1 µg/mL) for 12 h. (A,B,C,D) Gene expression of NLRP3, IL-1β, caspase 1 and IL-18 were determined by qPCR. (E) IL-1β and NLRP3 protein expression level was determined by western blot and relative expression level was assessed by densitometric analysis; (F) caspase 1 activity was determined. Results are presented as mean ± standard error. *, P<0.05, **, P<0.01 and ***, P<0.001 compared with control (untreated).
PA promoted HSCs activation, proliferation, migration and attenuated its apoptosis
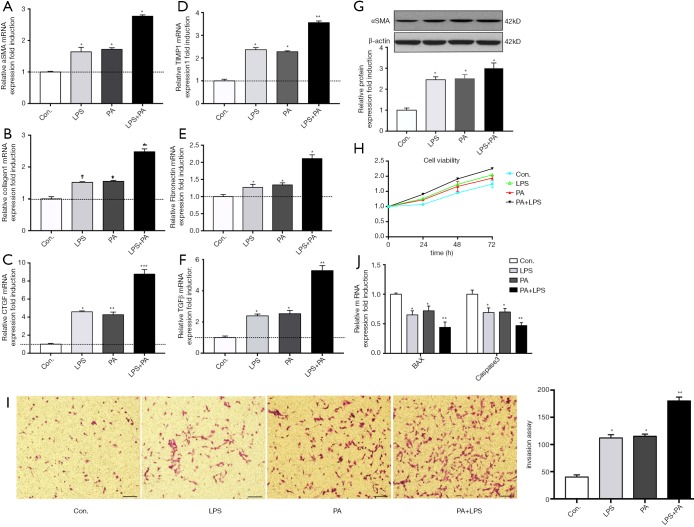
We next determined the role of PA in HSCs phenotype and fibrotic markers. As shown in Figure 2, PA significantly increased the gene expression level of HSCs activation, such as aSMA, Collagen I, CTGF, TIMP1, Fibronectin and TGFβ (Figure 2A,B,C,D,E,F) compared to controls. HSCs activation was further confirmed by increased aSMA protein expression after exposure to PA (Figure 2G). In addition, PA enhanced HSCs proliferation (Figure 2H) and migration (Figure 2I), in contrast, attenuated HSCs apoptosis (Figure 2J). LPS sensitized these effects of PA on HSCs. These results indicate that PA was able to stimulate HSC fibrotic phenotype change.
Figure 2.
PA promotes HSCs activation, proliferation, migration and decreases its apoptosis through NLRP3 inflammasome activation. Primary HSCs (day 2) were exposed to PA (200 µM) with or without LPS (1 µg/mL) for 12 h. (A-F) Gene expression levels of fibrotic makers (aSMA, Collagen 1, CTGF, TIMP1, TGFβ and fibronectin) were determined; (G) protein level of aSMA and Collagen 1 was determined and relative expression level was evaluated by densitometric analysis; (H) HSCs cell viability over time was determined using CCK8 kit; (I) the migration was evaluated by invasion assay as described in methods; (J) HSCs apoptosis was evaluated by mRNA expression of Bax and caspase 3. Results are presented as mean ± standard error. *, P<0.05, **, P<0.01 and ***, P<0.001 compared with control (untreated). scale bar =100 µm.
NF-kB-NLRP3 signaling was involved in PA-induced HSCs phenotype change
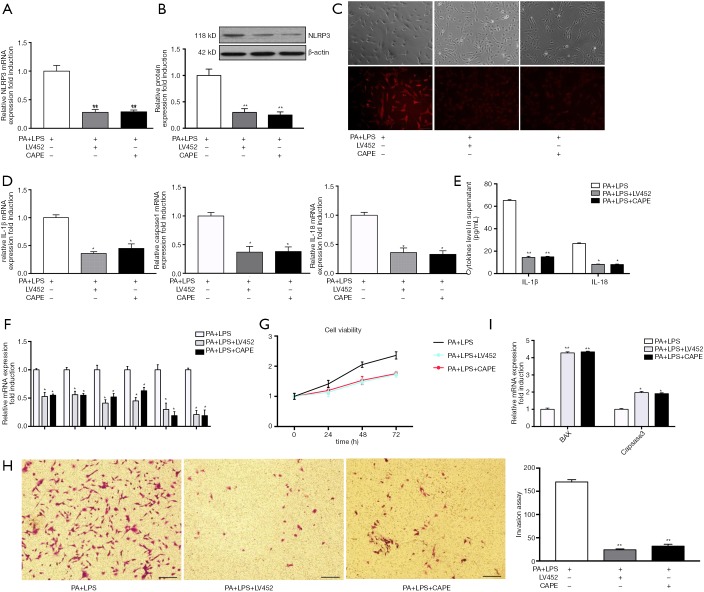
As shown in Figure 1, the gene and protein expression of NLRP3 inflammasome was upregulated in PA-treated HSCs. Therefore, in order to further determine whether PA-induced HSCs phenotype change is through NLRP3 inflammasome activation cascade, HSCs were transfected with lentivirus vector containing NLRP3 shRNA (LV452_pL-NLRP3-shRNA-3300) for 48 h then exposed to PA and LPS for 12 h. The results showed that LV452 significantly downregulated gene and protein of NLRP3 expression comparison with HSCs-exposed to PA and LPS (P<0.01, Figure 3A,B). Immunofluorescent staining of NLRP3 confirmed the result (Figure 3C). Moreover, decreased casapase1, IL-1β, IL-18 mRNA (Figure 3D) expression was observed in LV452 transfected HSCs. And the levels of mature IL-1β and IL-18 were decreased in the supernatant of HSCs after transfection with LV452 comparison with HSC-exposed to PA and LPS (P<0.01 for IL-1β, P<0.05 for IL-18, Figure 3E). These results indicated LV452 may effectively inhibit NLRP3 expression. In addition, LV452 transfection suppressed the expression of fibrotic genes in HSCs (P<0.05, Figure 3F) and decreased HSCs proliferation in time-dependent manner (Figure 3G) and decreased HSCs migration (Figure 3H), increased apoptosis gene expression in HSCs (Figure 3I). Thus, these results indicate PA-elicited NLRP3 inflammasome activation is involved in HSCs phenotype change.
Figure 3.
NF-kB-NLRP3 signaling involves in PA-induced HSCs phenotype change. Serum-starved HSCs (day 2) were transfected with lentivirus vector containing NLRP3 shRNA (LV452_pL-NLRP3-shRNA-3300) for 48 h or were pre-incubated with NF-kB inhibitor CAPE (1 µm/mL) for 2 h then exposed to PA (200 µm) combined with LPS (1 µg/mL) for 12 h. (A,B) Gene and protein NLRP3 relative expression level was evaluated by PCR and densitometric analysis, respectively; (C) cells were observed under fluorescence and optical microscope. (D) Gene expression of IL-1β, Caspase 1 and IL-18 were determined by qPCR. (E) IL-1β and IL-18 level in cell supernatant were detected by ELISA; HSCs phenotype was evaluated by assessing fibrotic markers (F), HSCs proliferation (G), migration (H) and apoptosis (I) as described in Methods. Results are presented as mean ± standard error. *, P<0.05, **, P<0.01 compared with control (untreated). (C) Magnification ×200; (H) 100 µm.
It has been shown that NF-κB signaling is involved in NLRP3 inflammasome activation (14). Therefore, in order to determine whether PA-elicited NLRP3 inflammasome activation is through NF-κB signaling, NF-κB inhibitor caffeic acid phenethyl ester (CAPE) (1 µm/mL) was used to pretreat HSC for 2 h before being exposed to PA and LPS. The results showed that CAPE had similar effect on NLRP3 inflammation activation and fibrotic phenotype changes in HSC with LV452 (Figure 3). Taken together, these results showed that NF-κB-NLRP3 signaling was involved in PA-induced HSCs phenotype change.
PA triggered TLR4-NF-κB signaling pathway activation
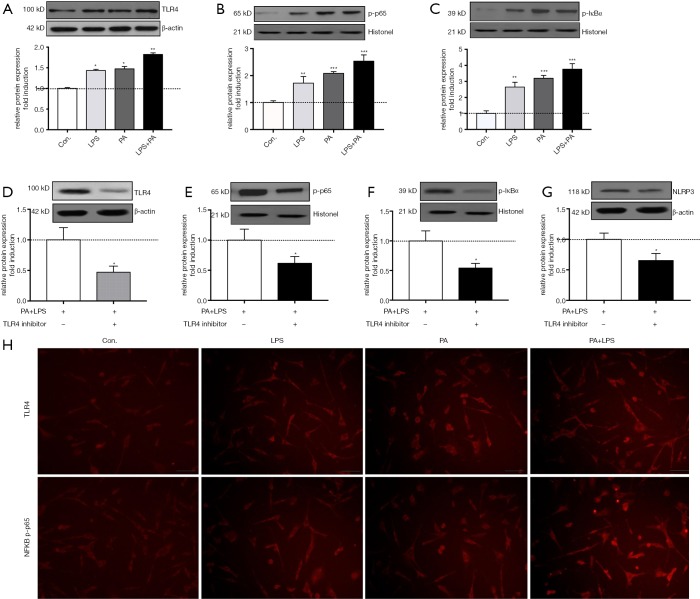
To investigate the mechanism of PA-elicited NLRP3 inflammasome activation, we determined related protein expression of TLR4-NF-κB signaling pathway. It is shown in Figure 4A,B,C that TLR4, phosphor-p65 and IκBa protein level were significantly upregulated in PA, LPS and PA + LPS-treated HSCs (P<0.01), immunofluorescent staining of TLR4 and NF-κB in HSCs confirmed TLR4-NFkB signaling upregulation (Figure 4H). In order to further confirm whether TLR4-NF-κB signaling pathway plays an important role in PA-induced NLRP3 inflammasome activation, TAK242 (1 µM/mL) was used to inhibit the activity of TLR4, as expected, TAK242 reduced the protein expression of NLRP3, IL-1β, TLR4, p-p65 and p-IκBa in PA + LPS-exposed HSCs (Figure 4). These findings suggested PA triggered NLRP3 inflammasome activation through the TLR4-NF-κB signaling pathway.
Figure 4.
PA triggered TLR4-NF-kB signaling pathway activation. Serum-starved HSCs (day 2) were exposed to PA (200 µm) with or without LPS (1 µg/mL) for 12 h. (A-C) Protein level of TLR4, phpsphorylated-p65 and IKBa was determined and relative expression level was evaluated by densitometric analysis. Serum-starved HSCs (day 2) were pre-incubated with TLR4 inhibitor TAK242 (1 µm/mL) for 2 h then exposed to PA (200 µm) combined with/without LPS (1 µg/mL) for 12 h, (D-G) protein level of TLR4, phpsphorylated-p65 and IKBa was determined and relative expression level was evaluated by densitometric analysis. (H) Immunofluorescent staining for TLR4 and NF-κB phosphorylated-p65 (magnification, ×200). Results are presented as mean ± standard error. *, P<0.05, **, P<0.01 and ***, P<0.001 compared with control (untreated).
NLRP3 inflammasome activation augmented the development of NASH to fibrosis in HF diet-fed rats
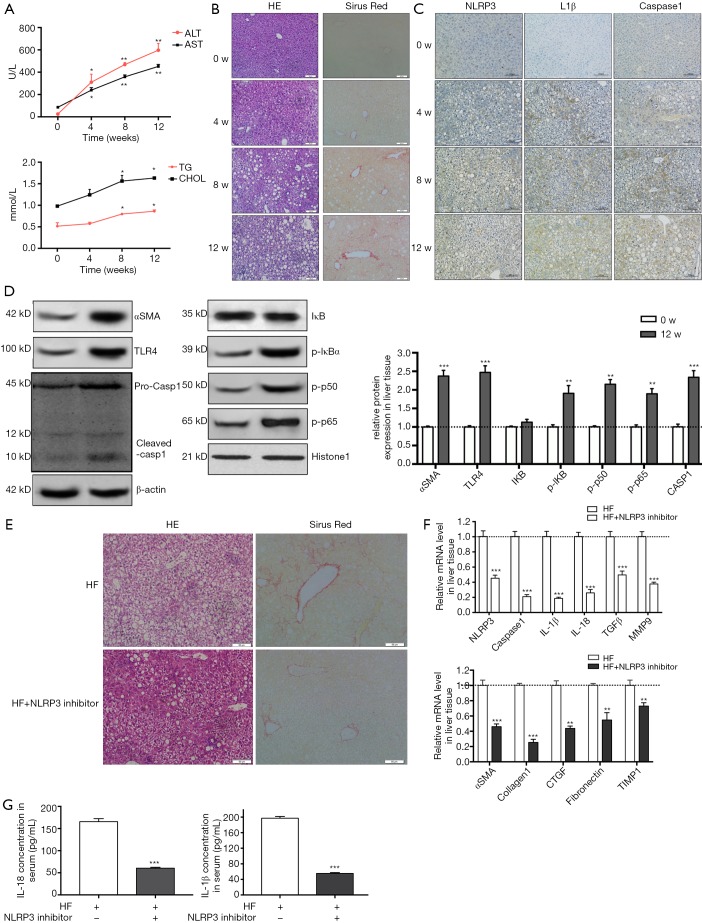
HF-diet feeding significantly increased the levels of ALT/AST and cholesterol and triglycerides (P<0.01, Figure 5A). HE staining in livers of HF diet-fed rats showed markedly increased fat deposition over time compared with the livers of normal diet-fed rats (Figure 5B). As observed in the liver section of sirus red staining, the extent of fibrosis was significantly increased over time in HF diet-induced NASH model (Figure 5B). Similarly, immunohistochemical staining showed enhanced expression of NLRP3, ILβ and caspase 1 (Figure 5C). Increased protein expression of aSMA, TLR4 and NF-κB signal pathway were observed in HF diet-induced NASH model (Figure 5D). These data suggested that HF diet elicited NLRP3 inflammasome activation and NASH-related fibrosis. These findings were ratified the results of in vitro study. Next, to further validate the effect of NLRP3 inflammasome on the progression of NASH to liver fibrosis, NLRP3 inhibitor was used to blockade the NLRP3 activation. As shown in Figure 5, NLRP3 inhibitor attenuated fat and collagen deposition (Figure 5E), downregulated mRNA expression of NLRP3, caspase, IL-1β, TGFβ and MMP9 (Figure 5F), decreased aSMA, Collagen I, CTGF, Fibronectin and TIMP1 mRNA expression (Figure 5G). Moreover, the serum levels of mature IL-1β and IL-18 were decreased in NLRP3 inhibitor group. These results suggested that NRLP3 inflammasome activation augmented the progression of NASH to liver fibrosis in HF diet-fed rats.
Figure 5.
NLRP3 inflammasome activation by TLR4-NFkB signalling pathway augments the development of NASH to fibrosis in HF-fed rats. Four weeks old SD rats were fed either an HF diet or normal chow for 12 weeks. Rats were euthanized, liver and blood were harvested at different time points (0, 4, 8 and 12 w). (A) The serum transaminase and triglycerides and cholesterol levels were evaluated. (B) HE and Sirus red staining in liver sections showed increased fat and collagen deposition at 4, 8 and 12 w. (C) Immunohistochemistry of NLRP3, IL-1β and caspase 1 at different time points. (D) aSMA, TLR4, NF-κB and caspase 1 protein expression in liver tissue from normal diet group and HF diet group. (E) In another experiment group, rats were fed with HF diet and meanwhile received either an intraperitoneal injection of NLRP3 inhibitor or saline, 5 mg/kg body weight for once every 3 days. After 12 w, rats were euthanized, liver and blood were harvested. (E) HE and sirus red staining in liver sections showed reduced fat and collagen deposition at the administration of NLRP3 inhibitor group. (F) mRNA levels of NLRP3, caspase 1, IL-1β, IL-18, TGFb, MMP9 and fibrotic makers were determined by RT-PCR. (G) IL-1β and IL-18 level in serum were measured. Results are presented as mean ± standard error. *, P<0.05, **, P<0.01 and ***, P<0.001 compared with control (untreated). Scale bar: (B) 50 µm, (C) 100 µm, (E) 50 µm.
Discussion
Accumulating evidences have demonstrated inflammasome activation plays a central role in various liver diseases including NASH and liver fibrosis (6,10,15,16). Previous studies also have reported that NLRP3 inflammasome activation in HSCs augmented the development of liver fibrosis (16-18). However, the mechanisms of NLRP3 inflammasome activation in HSCs remain unclear in NASH and liver fibrosis. This study elucidates the molecular mechanism that palmate acid induced NLRP3 inflammasome activation in HSCs and the role in the progression of NASH to fibrosis.
Fat accumulation increased fatty acid in the liver initial the pathogenesis of NASH (19,20). Both circulating saturated fatty acid such as PAs and endotoxins (LPS) has been implicated in triggering inflammation and contributing to liver injury (8,21,22). There are a few studies showing that palmate acid could activate NLRP3 inflammasome in different cell types in liver (6,8,10,16). However, it is contradictory that the effect of PAs on HSCs at different concentrations (23-25), thereby, after comparing the effects at various doses on HSCs, we confirmed PAs with a concentration of 200 µm/mL and LPS with 1 µg/mL for all in vitro experiments.
In the present study, we found that palmate acid upregulated NLRP3 inflammasome gene and protein expression in rat primary HSCs. We also observed that palmate acid increased caspase 1 activity in HSCs. These data confirm that palmate acid, acting as DAMPs, may directly induce NLRP3 inflammasome activation in HSCs. In addition, we found that LPS induced sensitization to palmitic acid-induced inflammasome activation in HSCs. These results are consistent with previous studies (21,24). HSCs play a central role in the pathogenesis of liver fibrosis (26). It has been shown that NLRP3 expression is increased in liver fibrosis (5). Accumulating evidence has shown that NLRP3 inflammasome activation and downstream effectors are involved in liver injury and the development of fibrosis (6,27,28). Our results demonstrated that palmate acid induced-NLRP3 activation stimulated HSCs activation and upregulated fibrotic markers (aSMA, TIMP1, Collagen I, Fibronectin, CTGF and TGFβ). Moreover, NLRP3 inflammasome activation enhanced HSC proliferation and migration but attenuated HSC apoptosis. In in vitro experiments, the inhibition of NLRP3 activation by LV452 reversed the HSC phenotype changes, which further confirmed that NLRP3 inflammasome activation were responsible for palmate acid-induced HSC activation. Similarly, as shown by in vivo data, HF-diet feeding rats presented elevated NLRP3/IL-1β/capase 1/aSMA expression in liver, with extensive fatty deposition and liver fibrosis in a time-dependent manner. Consistent with these results, the administration of NLRP3 inhibitor attenuated fatty deposition and fibrosis in liver, and significantly decreased NLRP3 and downstream effector gene and (casapse 1/IL-1β/IL-18) and fibrotic markers (aSma/collagen I/CTGF/Fibronectin/TIMP1) expression. In brief, NLRP3 activation in HSCs is a key player in progression of NASH to fibrosis.
These data in vivo further ratified the results of studies in vitro. The mechanisms by which NLRP3 activation modulates HSCs functions have been reported (10,16,24). It has been shown that palmate acid can trigger HSC activation, however, the exact mechanisms of NLRP3 activation in HSCs need to be further clarified. In this study, we investigated the mechanisms about how palmate acid induced NLRP3 inflammation activation in HSCs. Inflammasome activation is resulted by two signals via Toll-like receptors (TLRs) activation by endogenous or exogenous danger signals (29). Herein, we observed that TLR4 and NF-κB signal molecular (p-p65 and p-IκBa) expression was significantly upregulated in palmate acid-exposed HSCs, TLR4 inhibitor reversed palmate acid-induced TLR4 and NF-κB activity and attenuated palmate acid-mediated NLRP3 activation. In addition, we demonstrated NF-κB inhibitor CAPE reversed NLRP3 inflammasome activation and HSC phenotype changes. Taken together, palmate acid-mediated TLR4 activation is necessary for inducing NLRP3 inflammasome activation in HSCs, and NF-κB is an important downstream effector that promotes the effect. Similarly, in in vivo study, TLR4 and p-p65/p-p50/p-IκBa protein expression are significantly upregulated in liver after 12-week HF-diet feeding. Taken together, we postulate that the TLR4-NF-κB-NLRP3 inflammasome pathway drives palmate acid-induced HSC function changes.
In conclusion, this study provides new insights into the mechanism on palmate acid-induced NLRP3 activation in HSCs. This could provide implications for the development of novel drugs for NASH and related fibrosis.
Acknowledgments
Funding: This study was supported by the National Natural Science Foundation of China (Nos. 81500437, 81470904); Wang Baoen liver fibrosis fund (No. 0703N15006).
Ethical Statement: The authors are accountable for all aspects of the work in ensuring that questions related to the accuracy or integrity of any part of the work are appropriately investigated and resolved. The animal experiments were approved by the Animal Ethics Committee of Shanghai Jiao Tong University.
Footnotes
Conflicts of Interest: The authors have no conflicts of interest to declare.
References
- 1.Michelotti GA, Machado MV, Diehl AM. NAFLD, NASH and liver cancer. Nat Rev Gastroenterol Hepatol 2013;10:656-65. 10.1038/nrgastro.2013.183 [DOI] [PubMed] [Google Scholar]
- 2.Malaguarnera M, Di Rosa M, Nicoletti F, et al. Molecular mechanisms involved in NAFLD progression. J Mol Med (Berl) 2009;87:679-95. 10.1007/s00109-009-0464-1 [DOI] [PubMed] [Google Scholar]
- 3.De Minicis S, Svegliati-Baroni G. Fibrogenesis in nonalcoholic steatohepatitis. Expert Rev Gastroenterol Hepatol 2011;5:179-87. 10.1586/egh.11.28 [DOI] [PubMed] [Google Scholar]
- 4.Mederacke I, Hsu CC, Troeger JS, et al. Fate tracing reveals hepatic stellate cells as dominant contributors to liver fibrosis independent of its aetiology. Nat Commun 2013;4:2823. 10.1038/ncomms3823 [DOI] [PMC free article] [PubMed] [Google Scholar]
- 5.Boaru SG, Borkham-Kamphorst E, Tihaa L, et al. Expression analysis of inflammasomes in experimental models of inflammatory and fibrotic liver disease. J Inflamm (Lond) 2012;9:49. 10.1186/1476-9255-9-49 [DOI] [PMC free article] [PubMed] [Google Scholar]
- 6.Wree A, Eguchi A, McGeough MD, et al. NLRP3 inflammasome activation results in hepatocyte pyroptosis, liver inflammation, and fibrosis in mice. Hepatology 2014;59:898-910. 10.1002/hep.26592 [DOI] [PMC free article] [PubMed] [Google Scholar]
- 7.Takeuchi O, Akira S. Pattern recognition receptors and inflammation. Cell 2010;140:805-20. 10.1016/j.cell.2010.01.022 [DOI] [PubMed] [Google Scholar]
- 8.Csak T, Ganz M, Pespisa J, et al. Fatty acid and endotoxin activate inflammasomes in mouse hepatocytes that release danger signals to stimulate immune cells. Hepatology 2011;54:133-44. 10.1002/hep.24341 [DOI] [PMC free article] [PubMed] [Google Scholar]
- 9.Henao-Mejia J, Elinav E, Jin C, et al. Inflammasome-mediated dysbiosis regulates progression of NAFLD and obesity. Nature 2012;482:179-85. 10.1038/nature10809 [DOI] [PMC free article] [PubMed] [Google Scholar]
- 10.Inzaugarat ME, Johnson CD, Holtmann TM, et al. NLR Family Pyrin Domain-Containing 3 Inflammasome Activation in Hepatic Stellate Cells Induces Liver Fibrosis in Mice. Hepatology 2019;69:845-59. 10.1002/hep.30252 [DOI] [PMC free article] [PubMed] [Google Scholar]
- 11.Dong Z, Su L, Esmaili S, et al. Adiponectin attenuates liver fibrosis by inducing nitric oxide production of hepatic stellate cells. J Mol Med (Berl) 2015;93:1327-39. 10.1007/s00109-015-1313-z [DOI] [PubMed] [Google Scholar]
- 12.Esposito I, Kleeff J, Abiatari I, et al. Overexpression of cellular inhibitor of apoptosis protein 2 is an early event in the progression of pancreatic cancer. J Clin Pathol 2007;60:885-95. 10.1136/jcp.2006.038257 [DOI] [PMC free article] [PubMed] [Google Scholar]
- 13.Michalski CW, Shi X, Reiser C, et al. Neurokinin-2 receptor levels correlate with intensity, frequency, and duration of pain in chronic pancreatitis. Ann Surg 2007;246:786-93. 10.1097/SLA.0b013e318070d56e [DOI] [PubMed] [Google Scholar]
- 14.Lorenz G, Darisipudi MN, Anders HJ. Canonical and non-canonical effects of the NLRP3 inflammasome in kidney inflammation and fibrosis. Nephrol Dial Transplant 2014;29:41-8. 10.1093/ndt/gft332 [DOI] [PubMed] [Google Scholar]
- 15.Alegre F, Pelegrin P, Feldstein AE. Inflammasomes in Liver Fibrosis. Semin Liver Dis 2017;37:119-27. 10.1055/s-0037-1601350 [DOI] [PubMed] [Google Scholar]
- 16.Wree A, McGeough MD, Inzaugarat ME, et al. NLRP3 inflammasome driven liver injury and fibrosis: Roles of IL-17 and TNF in mice. Hepatology 2018;67:736-49. 10.1002/hep.29523 [DOI] [PMC free article] [PubMed] [Google Scholar]
- 17.Artlett CM, Thacker JD. Molecular activation of the NLRP3 Inflammasome in fibrosis: common threads linking divergent fibrogenic diseases. Antioxid Redox Signal 2015;22:1162-75. 10.1089/ars.2014.6148 [DOI] [PubMed] [Google Scholar]
- 18.Gieling RG, Wallace K, Han YP. Interleukin-1 participates in the progression from liver injury to fibrosis. Am J Physiol Gastrointest Liver Physiol 2009;296:G1324-31. 10.1152/ajpgi.90564.2008 [DOI] [PMC free article] [PubMed] [Google Scholar]
- 19.Day CP, James OF. Steatohepatitis: a tale of two "hits"? Gastroenterology 1998;114:842-5. 10.1016/S0016-5085(98)70599-2 [DOI] [PubMed] [Google Scholar]
- 20.Tilg H, Moschen AR. Evolution of inflammation in nonalcoholic fatty liver disease: the multiple parallel hits hypothesis. Hepatology 2010;52:1836-46. 10.1002/hep.24001 [DOI] [PubMed] [Google Scholar]
- 21.Szabo G, Velayudham A, Romics L, Jr, et al. Modulation of non-alcoholic steatohepatitis by pattern recognition receptors in mice: the role of toll-like receptors 2 and 4. Alcohol Clin Exp Res 2005;29:140S-145S. 10.1097/01.alc.0000189287.83544.33 [DOI] [PubMed] [Google Scholar]
- 22.Tiniakos DG, Vos MB, Brunt EM. Nonalcoholic fatty liver disease: pathology and pathogenesis. Annu Rev Pathol 2010;5:145-71. 10.1146/annurev-pathol-121808-102132 [DOI] [PubMed] [Google Scholar]
- 23.Abergel A, Sapin V, Dif N, et al. Growth arrest and decrease of alpha-SMA and type I collagen expression by palmitic acid in the rat hepatic stellate cell line PAV-1. Dig Dis Sci 2006;51:986-95. 10.1007/s10620-005-9031-y [DOI] [PubMed] [Google Scholar]
- 24.Duan NN, Liu XJ, Wu J. Palmitic acid elicits hepatic stellate cell activation through inflammasomes and hedgehog signaling. Life Sci 2017;176:42-53. 10.1016/j.lfs.2017.03.012 [DOI] [PubMed] [Google Scholar]
- 25.El Taghdouini A, Najimi M, Sancho-Bru P, et al. In vitro reversion of activated primary human hepatic stellate cells. Fibrogenesis Tissue Repair 2015;8:14. 10.1186/s13069-015-0031-z [DOI] [PMC free article] [PubMed] [Google Scholar]
- 26.Puche JE, Saiman Y, Friedman SL. Hepatic stellate cells and liver fibrosis. Compr Physiol 2013;3:1473-92. 10.1002/cphy.c120035 [DOI] [PubMed] [Google Scholar]
- 27.Dixon LJ, Berk M, Thapaliya S, et al. Caspase-1-mediated regulation of fibrogenesis in diet-induced steatohepatitis. Lab Invest 2012;92:713-23. 10.1038/labinvest.2012.45 [DOI] [PMC free article] [PubMed] [Google Scholar]
- 28.Kamari Y, Shaish A, Vax E, et al. Lack of interleukin-1alpha or interleukin-1beta inhibits transformation of steatosis to steatohepatitis and liver fibrosis in hypercholesterolemic mice. J Hepatol 2011;55:1086-94. 10.1016/j.jhep.2011.01.048 [DOI] [PMC free article] [PubMed] [Google Scholar]
- 29.Yu HB, Finlay BB. The caspase-1 inflammasome: a pilot of innate immune responses. Cell Host Microbe 2008;4:198-208. 10.1016/j.chom.2008.08.007 [DOI] [PubMed] [Google Scholar]


