Abstract
Background
Ovarian cancer is a frequently-occurring reproductive system malignancy in females, which leads to an annual of over 100 thousand deaths worldwide.
Methods
The electronic databases, including GEPIA, ONCOMINE, Metascape, and Kaplan-Meier Plotter, were used to examine both survival and transcriptional data regarding the cell division cycle associated (CDCA) gene family among ovarian cancer patients.
Results
All CDCA genes expression levels were up-regulated in ovarian cancer tissues relative to those in non-carcinoma ovarian counterparts. Besides, CDCA5/7 expression levels were related to the late tumor stage. In addition, the Kaplan-Meier Plotter database was employed to carry out survival analysis, which suggested that ovarian cancer patients with increased CDCA2/3/5/7 expression levels had poor overall survival (OS) (P<0.05). Moreover, ovarian cancer patients that had up-regulated mRNA expression levels of CDCA2/5/8 had markedly reduced progression-free survival (PFS) (P<0.05); and up-regulated CDCA4 expression showed remarkable association with reduced post-progression survival (PPS) (P<0.05). Additionally, the following processes were affected by CDCA genes alterations, including R-HAS-2500257: resolution of sister chromatid cohesion; GO:0051301: cell division; CORUM: 1118: Chromosomal passenger complex (CPC, including CDCA8, INCENP, AURKB and BIRC5); CORUM: 127: NDC80 kinetochore complex; M129: PID PLK1 pathway; and GO: 0007080: mitotic metaphase plate congression, all of which were subjected to marked regulation since the alterations affected CDCA genes.
Conclusions
Up-regulated CDCA gene expression in ovarian cancer tissues probably played a crucial part in the occurrence of ovarian cancer. The up-regulated CDCA2/3/5/7 expression levels were used as the potential prognostic markers to improve the poor ovarian cancer survival and prognostic accuracy. Moreover, CDCA genes probably exerted their functions in tumorigenesis through the PLK1 pathway.
Keywords: Ovarian cancer, cell division cycle associated (CDCA), prognosis
Introduction
Ovarian cancer is a frequently-occurring reproductive system malignancy in females, which is estimated to cause an annual of over 100 thousand deaths worldwide (1). Disappointedly, more than 70% patients with ovarian cancer are diagnosed at the advanced stage due to the lack of efficient diagnostic method and early typical clinical symptom (2). Although treatments (such as surgery and targeted therapeutics) have been improved, they cannot achieve satisfactory progression-free survival (PFS) among patients with ovarian cancer; besides, the subsequent treatment for relapsed ovarian cancer is still encountered with great challenges (3). Additionally, the 5-year survival of ovarian cancer patients is only about 46.5% (4). Consequently, it is necessary to examine the underlying mechanisms regarding ovarian cancer tumorigenesis as well as progression and to identify the related tumor biomarkers that have high specificity and sensitivity. Nowadays, several molecular tests have been utilized prior to treatment for the risk screening of ovarian cancer, including BRCA1/2 mutations, microsatellite instability, and homologous recombination pathway genes. In addition, bevacizumab and Olaparib have been recommended by the National Comprehensive Cancer Network (NCCN) guideline for the treatment of ovarian cancer (5). All in all, BRCA1/2 mutations are not only used as the targets of agents like Olaparib (6), Rucaparib (7), and Niraparib (8), but also act as the high risk factors, which contribute to early screening (9-13). In patients with high risk factors (like BRCA mutation, family history), and cancer antigen 125 (CA-125), ultrasound is adopted to identify patients with ovarian cancer (14). More efforts should be made to search for more beneficial genes to predict cancer occurrence or targeted therapy. There are 8 members in the CDCA protein family, namely, CDCA1-8. Cell division plays an important role in the life process. It has been suggested in numerous studies that any dysregulation in the process of cell division may lead to malignancy (15-17). CDCA1 is known to be a member of a highly conserved Ndc80 complex that plays a crucial role in spindle checkpoint signaling (18). CDCA2 plays a role in modulating response of DNA injury within cell cycle, which is achieved through binding onto protein phosphatase 1 γ (PP1γ) (19,20). CDCA3 functions to modulate the progression of cell cycle, and the expression level is regulated via protein degradation and transcription at G1 phase in cell cycle (21). Moreover, CDCA4 can regulate the cell cycle, which is related to transition of G1/S phase (22) and regulates the expression of p53 (23). CDCA5 serves as a primary regulatory factor for the sister-chromatid separation and cohesion (24). CDCA6, also named as CBX2, is a gene whose protein product forms part of the PRC1, a multi-protein complex that modifies histones (25). In the undifferentiated hematopoietic populations, CDCA7 can be triggered in the precursors of hematopoietic stem cells within murine embryo, which can be maintained afterwards. Besides, CDCA8 plays an essential role in regulating mitosis (26).
Nowadays, several studies on using some CDCA family genes as the prognostic factors have raised our attentions (27-29). However, there is little systematical analysis on the role of CDCA gene family in patients with ovarian cancer. The current research aimed to systematically evaluate the association of CDCA genes expression with ovarian cancer survival. Typically, the mRNA expression of CDCA genes was detected in both normal and ovarian cancer tissues. Then, the significance of all CDCA family members in predicting the prognosis for ovarian cancer was analyzed based on the Kaplan–Meier plotter database, and later the gene–gene interaction network was constructed for CDCA genes to examine the underlying mechanisms of action. This study explored the CDCA genes clinical value, so as to provide a certain theoretical foundation for making early diagnosis, prognosis evaluation, and specific treatment for ovarian cancer.
Methods
Each dataset used in this study was searched based on the published literature. The clinical tumor samples were collected during the first surgery, the normal specimens belonged to the same patients, and the threshold used to define low and high expression was 50% median. Additionally, the included literature datasets (TCGA datasets and GEO datasets) used for calculating Kaplan-Meier survival in Kaplan-Meier Plotter (www.Kmplot.com) are shown in Table S1.
Table S1. Databases using for Kaplan Meier analysis for CDCA 2-5, 7, 8 in Kaplan Meier Plotter.
| Dataset | Age | Stage | Grade | For drawing Kaplan-Meier plot (OS) | For drawing Kaplan-Meier plot (PFS) | For drawing Kaplan-Meier plot (PPS) |
|---|---|---|---|---|---|---|
| GSE 9891 | – | Stage I: 24 (8.4%); stage II: 18 (6.3%); stage III: 217 (76.2%); stage IV: 22 (7.7%); unknown: 4 (1.4%) | Grade I: 20 (7.0%); grade II: 99 (34.7%); grade III: 161 (56.5%); unknown: 5 (1.8%) | CDCA2-5, CDCA7-8 | CDCA2-5, CDCA7-8 | CDCA2-5, CDCA7-8 |
| GSE 3149 | – | – | – | CDCA4, CDCA8 | – | – |
| GSE 14764 | Mean: 57; range: 36-81 | Stage I: 8 (1.0%); stage II: 1 (1.3%); stage III: 69 (86.2%); stage IV: 2 (2.5%) | Grade I: 3 (3.8%); grade II: 23 (28.7%); grade III: 54 (67.5%) | CDCA4, CDCA8 | CDCA4, CDCA8 | CDCA4, CDCA8 |
| GSE 15622 | – | – | – | CDCA4, CDCA8 | CDCA4, CDCA8 | CDCA4, CDCA8 |
| GSE 18520 | 61.9±12.7 | Stage III–IV: 53 (100%) | Grade III: 53 (100%) | CDCA2-5, CDCA7-8 | – | – |
| GSE 23554 | – | Stage III–IV: 28 (100%) | Grade I: 2 (7.1%); grade II: 8 (28.6%); grade III: 18 (64.3%) | CDCA4, CDCA8 | – | – |
| GSE 19829 | 63.61±10.51 | Stage II: 2 (4.3%); stage III: 22 (81.4%) Stage IV 4 (14.3%) |
Grade III: 28 (100%) | CDCA2-5, CDCA7-8 | – | – |
| GSE 26712 | – | Stage III–IV: 153 (100%) | Grade III: 153 (100%) | CDCA4, CDCA8 | CDCA4, CDCA8 | – |
| GSE 27651 | – | – | Grade I: 21 (48.8%); grade III: 22 (51.2%) | CDCA2-5, CDCA7-8 | – | – |
| GSE 26193 | – | Stage I: 20 (19.8%); stage II: 11 (10.9%); stage III: 59 (58.4%); stage IV: 11 (10.9%) | Grade I: 7 (6.9%); grade II: 33 (32.7%); grade III: 67 (66.3%) | CDCA2-5, CDCA7-8 | CDCA2-5, CDCA7-8 | CDCA2-5, CDCA7-8 |
| GSE 30161 | 62.57±10.51 | Stage III: 53 (91.4%); stage IV: 5 (8.6%) | Grade I: 2 (3.4%); grade II: 19 (32.8%); grade III: 33 (56.9%); unknown: 4 (6.9%) | CDCA2-5, CDCA7-8 | CDCA2-5, CDCA7-8 | CDCA2-5, CDCA7-8 |
| GSE 63885 | – | Stage II: 1 (1.4%); stage III: 59 (84.3%); stage IV: 10 (14.3%) | Grade II: 8 (11.4%); grade III: 44 (62.9%); grade IV: 18 (25.7%) | CDCA2-5, CDCA7-8 | CDCA2-5, CDCA7-8 | CDCA2-5, CDCA7-8 |
| GSE 51373 | – | Stage II: 5 (18.5%); stage III: 19 (70.4%); stage IV: 3 (11.1%) | / | CDCA2-5, CDCA7-8 | CDCA2-5, CDCA7-8 | – |
| TCGA | 59.74±11.52 | – | Grade I: 6 (1.0%); grade II: 69 (11.8%); grade III: 495 (84.3%); grade IV: 1 (0.2%); unknown: 16 (2.7%) | CDCA4, CDCA8 | CDCA4, CDCA8 | CDCA4, CDCA8 |
OS, overall survival; PFS, progress-free survival; PPS, post-progress survival.
ONCOMINE analyses
The transcription levels of CDCA genes among various cancer types were examined based on the online cancer microarray database, namely, the ONCOMINE gene expression array dataset (www.oncomine.org/). Moreover, CDCAs mRNA expression was compared between the clinical tumor samples and normal specimens. The P value was generated by Students’ t-test, and the threshold fold-change and P value were set at 2 and 0.01, respectively.
The Gene Expression Profiling Interactive Analysis (GEPIA) dataset
GEPIA, the newly designed interactive web server, was used to analyze RNA sequencing materials based on the GTEx and TCGA projects by the use of the normalized processing pipeline. Typically, GEPIA allows to offer the differential expression analyses on normal and tumor tissues, as well as the access to profiling of cancer type and pathological stage, analysis of patient survival, detection of similar gene, as well as dimensionality reduction and correlation analyses.
Database Kaplan-Meier plotter
Kaplan-Meier Plotter (www.Kmplot.com), the online database, was used to assess the prognostic significance of the mRNA expression levels of CDCA genes. For analyzing the ovarian cancer patient overall survival (OS), PFS, as well as the post progression survival (PPS), all specimens were divided as 2 groups according to the 50% median expression level (namely, low and high expression).
The baseline clinical data of included literature datasets in Kaplan-Meier Plotter for analyzing were collected, and then these data were included to perform bioinformatic Cox regression analysis for OS by R software (version 3.6.1). Later, the Kaplan-Meier survival plot was used for evaluation on the basis of hazard ratio (HR) and the corresponding 95% confidence intervals (CI), as well as the log-rank P value. The Kaplan-Meier plots were obtained through the CDCAs JetSet best probe set alone, where the number at risk was suggested under the major plot.
Bioinformatic analyses and functional enrichment
The online database metascape (http://metascape.org) has integrated more than 40 bioinformatic knowledge bases, which enables to extract rich annotations, identify the enriched pathways, and construct the protein-protein interaction (PPI) (30) network based on the lists of protein and gene identifiers. The CDCA genes were analyzed using the Kyoto Encyclopedia of Genes and Genomes (KEGG) and Gene Ontology (GO) approaches of Metascape, so as to search for those linked genes with the highest alteration frequency.
Results
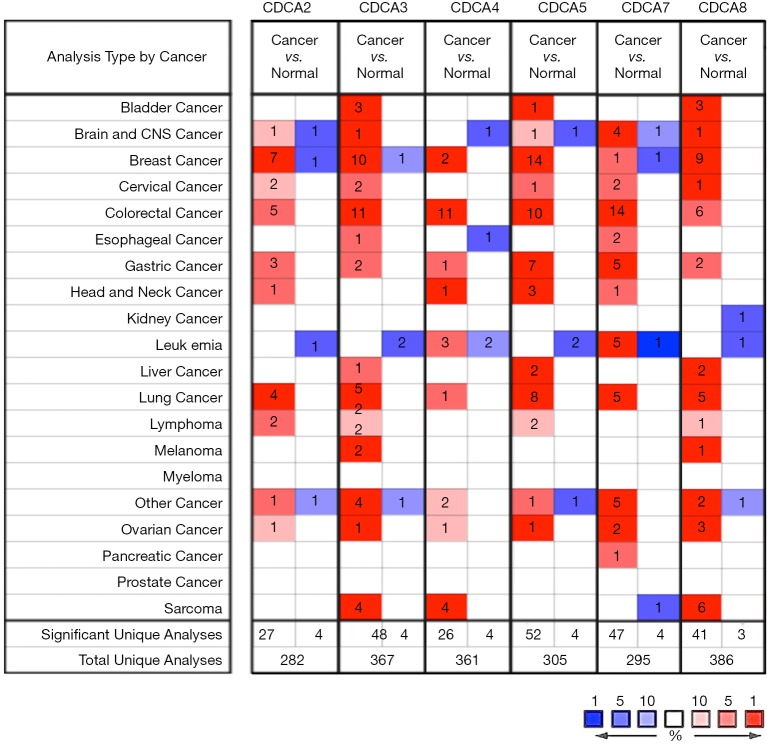
Six CDCA factors are identified within the mammalian cells. In this study, the ONCOMINE databases were used to compare the CDCA gene transcriptional data between tumor tissues and normal specimens (Figure 1). According to our findings, CDCA2/3/4/5/7/8 expression remarkably increased among ovarian cancer patients derived from many databases. For CDCA2, the result from Yoshihara’s dataset showed that the fold change was 26.877 (31). TCGA dataset showed a fold change of 4.847 in CDCA3. In addition, TCGA dataset demonstrated that the fold change was 2.213 in CDCA4. For CDCA5, Yoshihara’s dataset revealed a fold change of 12.508 (31). For CDCA7, the results by Lu’s database suggested that the fold change was 2.646 (32), which were 8.261 as suggested by Yoshihara’s dataset (31). For CDCA8, Yoshihara’s dataset showed a fold change of 20.335, which was 3.705 in TCGA dataset and 2.036 as suggested by the Bonome’s dataset (33) (Table 1).
Figure 1.
CDCAs expression at the transcription level among various cancer types (the ONCOMINE). (Color red means high expression level in cancer sample, and color blue means low expression level in cancer sample).
Table 1. Remarkable CDCA expression changes at transcription level between ovarian cancer tissues and the non-carcinoma counterparts (Oncomine Database).
| CDCA genes | Type of ovarian cancer versus normal lung tissue | Fold change | P value | t-test | Source and/or reference |
|---|---|---|---|---|---|
| CDCA2 | Ovarian serous adenocarcinoma | 26.877 | 1.07E-5 | 9.218 | Yoshihara (31) |
| CDCA3 | Ovarian serous cystadenocarcinoma | 4.847 | 1.30E-9 | 21.227 | TCGA |
| CDCA4 | Ovarian serous cystadenocarcinoma | 2.213 | 6.40E-6 | 9.679 | TCGA |
| CDCA5 | Ovarian serous adenocarcinoma | 12.508 | 5.84E-13 | 15.754 | Yoshihara (31) |
| CDCA7 | Ovarian endometrioid adenocarcinoma | 2.646 | 9.25E-5 | 6.009 | Lu (32) |
| Ovarian serous adenocarcinoma | 8.261 | 3.76E-6 | 6.923 | Yoshihara (31) | |
| CDCA8 | Ovarian serous adenocarcinoma | 20.335 | 3.63E-12 | 15.126 | Yoshihara (31) |
| Ovarian serous cystadenocarcinoma | 3.705 | 5.44E-7 | 13.126 | TCGA | |
| Ovarian carcinoma | 2.036 | 6.46E-9 | 12.078 | Bonome (33) |
Associations of CDCAs mRNA expression with clinicopathological variables in ovarian cancer patients
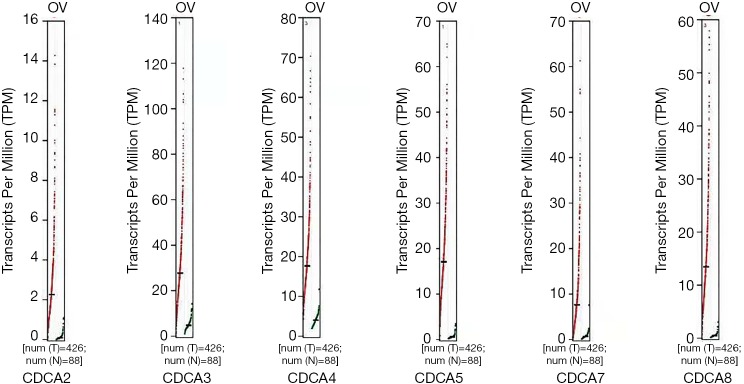
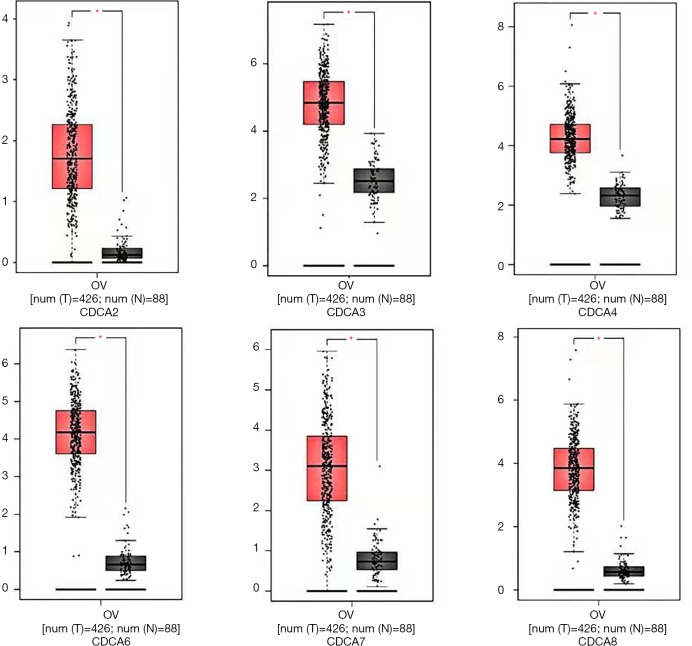
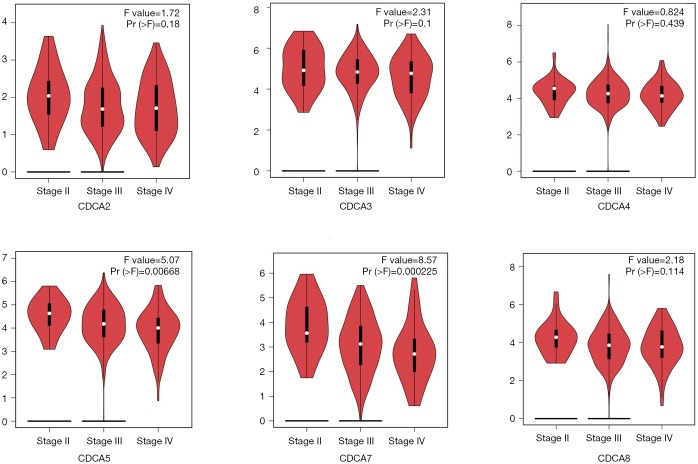
The GEPIA dataset (http://gepia.cancer-pku.cn/) was performed to compare CDCAs mRNA expression in ovarian cancer tissues with that in normal ovarian tissues. According to our findings, the CDCA2/3/4/5/7/8 expression levels (tumor sample: n=426 vs. normal sample: n=88) were up-regulated within ovarian cancer tissues relative to those within normal tissues. (Figures 2,3) Also, the association between CDCA genes expression and the ovarian cancer stage was analyzed. There were significant differences in the expression levels of all CDCA genes (Figure 4).
Figure 2.
CDCAs expression within ovarian cancer (GEPIA).
Figure 3.
CDCAs expression within ovarian cancer showed as boxplot (GEPIA). *P<0.05.
Figure 4.
Relationship of CDCAs levels with cancer classification among patients with ovarian cancer (GEPIA).
Relationship between elevated CDCA 2/3/4/5/7/8 mRNA expression and dismal prognosis for ovarian cancer cases
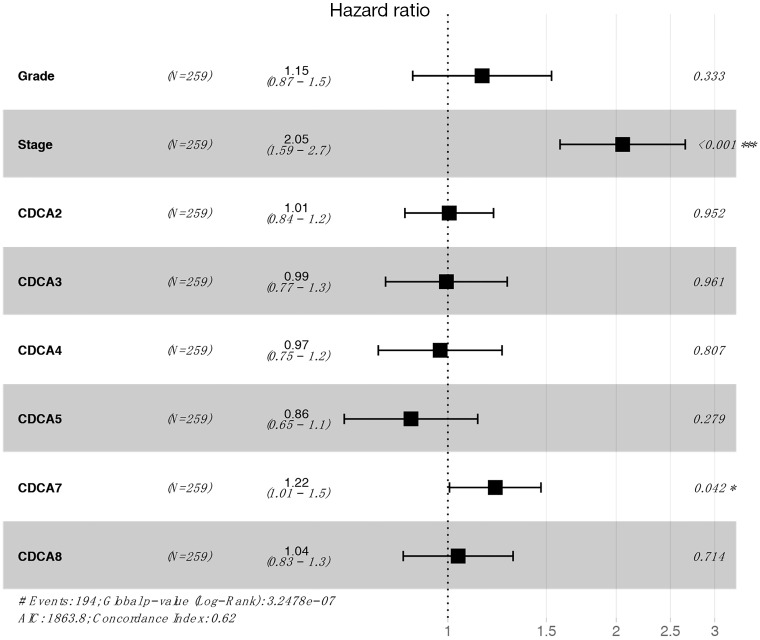
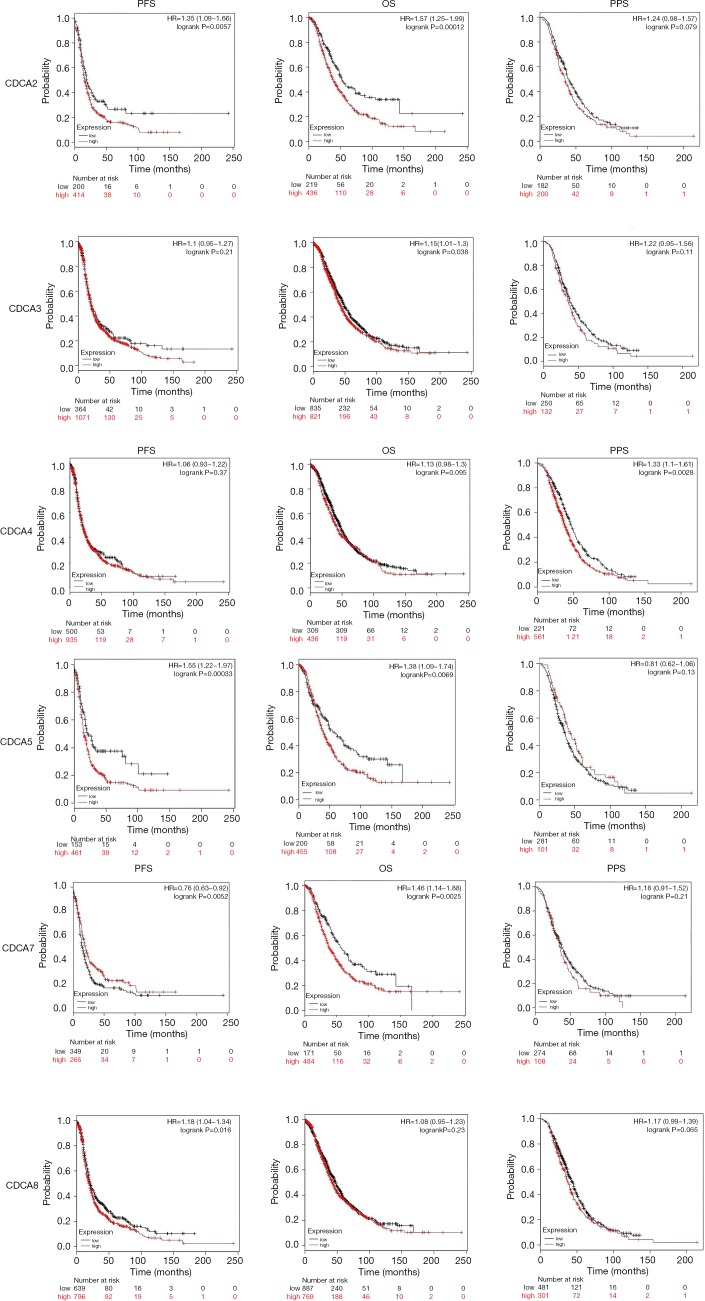
The Kaplan-Meier Plotter (www.Kmplot.com) was utilized to examine the relationship between CDCAs mRNA expression and ovarian cancer patients’ survival by the use of the public datasets. The clinical baseline data of datasets included in Kaplan-Meier Plotter for analysis are displayed in Table S1. The multivariate analysis (using GSE 18920, GSE 26193, GSE 30161, GSE 63888) indicated that stage and CDCA7 were the independent risk factors (Table S2, Figure S1). Based on the long-rank test and Kaplan-Meier curve analyses, it was found that the elevated CDCA2/3/5/7 expression levels showed significant relationships with poorer patient OS. Ovarian cancer patients that had up-regulated CDCA2/5/8 mRNA expression levels had lower PFS, and the increased CDCA4 was only significantly associated with the lower PPS (Figure 5).
Table S2. Univariate and Multivariate analysis of risk factors for overall survival.
| Factors | Univariate analysis | Multivariate analysis | |||
|---|---|---|---|---|---|
| HR (95% CI) | P value | HR (95% CI) | P value | ||
| Grade | 1.46 (1.15–1.85) | 0.002 | 0.333 | ||
| Stage | 1.963 (1.548–2.490) | 2.70E–08 | 2.054 (1.587–2.658) | 4.4E-08 | |
| CDCA2 | 1.089 (1.013–1.172) | 0.021 | 0.952 | ||
| CDCA3 | 1.078 (1.011–1.148) | 0.021 | 0.961 | ||
| CDCA4 | 1.094 (1.014–1.181) | 0.021 | 0.807 | ||
| CDCA5 | 1.076 (1.010–1.147) | 0.024 | 0.279 | ||
| CDCA7 | 1.075 (1.002–1.153) | 0.044 | 1.215 (1.007–1.467) | 0.042 | |
| CDCA8 | 1.062 (1.001–1.127) | 0.045 | 0.714 | ||
GSE 18920, GSE 26193, GSE 30161, GSE 63888 were used for analysis.
Figure S1.
The multivariate analysis for risk factors and CDCA family genes.
Figure 5.
Significance of CDCAs mRNA expression in predicting the prognosis for patients with ovarian cancer (Kaplan-Meier plotter).
Predicted functions and Pathway enrichment analyses and predicted functions of CDCA genes among ovarian cancer cases
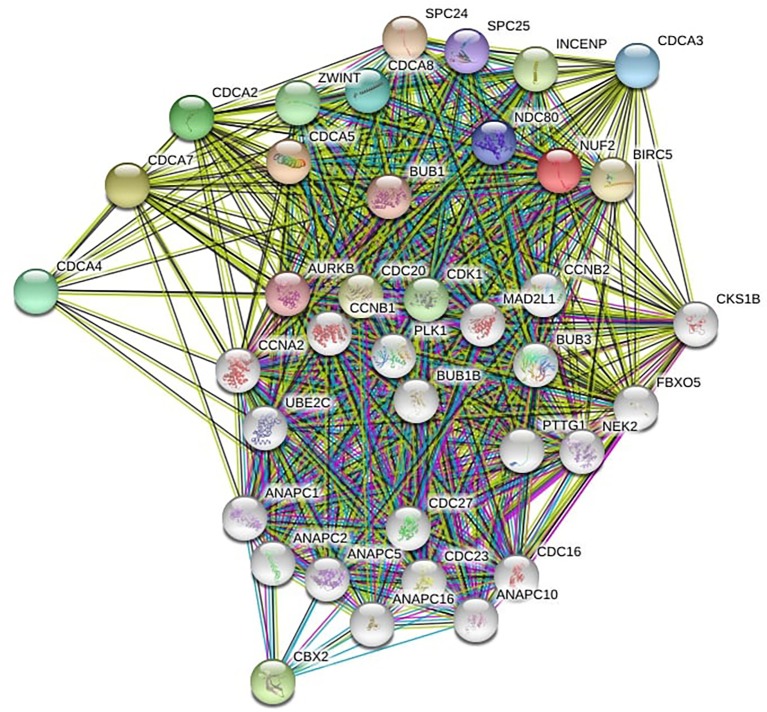
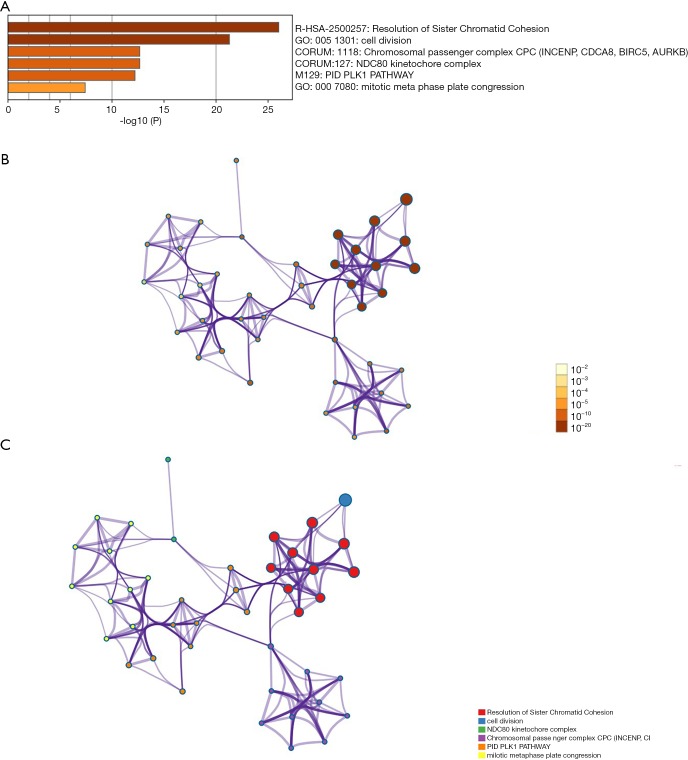
Genes showing co-expression with the CDCA gene family were examined using the String and the Functional protein association networks. According to the results, CDCA gene expression showed positive correlation with the up-regulated levels of the genes shown below: CDCA2, NUF2, CDCA4, CDCA3, CDCA, CDCA5, CDCA8, CDCA7, CDC20, AURKB, CBX2, CDK1, ZWINT, BUB1, NDC80, SPC24, SPC25, BIRC5, and INCENP (Figure 6). Then, the lists of all the CDCA genes expressed, together with linked genes displaying the highest alteration frequency, were compiled before they were analyzed by the KEGG and GO approaches in Metascape (Figure 7). Our results suggested that the processes below were subjected to the influence of CDCA gene alterations: R-HAS-2500257: resolution of sister chromatid cohesion; GO:0051301: cell division; CORUM: 1118: Chromosomal passenger complex (CPC, including CDCA8, INCENP, AURKB and BIRC5); CORUM: 127: NDC80 kinetochore complex; M129: PID PLK1 pathway; and GO: 0007080: mitotic metaphase plate congression.
Figure 6.
CDCA genes co-expression among ovarian cancer patients (String).
Figure 7.
Functions of CDCA genes as well as those showing significant association with CDCA genes alterations. (A) Heatmap of the Gene Ontology (GO) and Kyoto Encyclopedia of Genes and Genomes (KEGG) enriched terms colored by P values. (B) Network of GO and KEGG enriched terms colored by P values. (C) Network of GO and KEGG enriched terms colored by clusters.
Discussion
The guideline recommended treatments, namely, intravenous carboplatin/paclitaxel, or combined intravenous/intraperitoneal paclitaxel/cisplatin, may lead to complications like leukopenia, infection, renal toxicity, and neurotoxicity (34,35). Nowadays, BRCA1/2 mutations have been tested for potential therapeutics, which result in less adverse effects. Therefore, in our opinion, CDCA genes probably could act as the effective therapeutics, which exert similar functions as BRCA1/BRCA2. Our findings suggested that CDCA genes expression levels in cancer patients were different from those in normal people. It is difficult to carry out early screening among patients with ovarian cancer, as suggested by our results discussing the different CDCA genes expression levels at different stages, but stage 1 ovarian cancer data are lacking.
CDCA2 can regulate H3 (the primary mitotic histone) phosphorylation depending on PP1 (36). Our results suggested that CDCA2 expression levels in ovarian cancer tissues were up-regulated compared with those in non-carcinoma counterparts. Additionally, the CDCA2 expression level was not correlated with cancer classification among ovarian cancer patients. The up-regulated CDCA2 expression level showed a significant correlation with dismal OS and PFS among ovarian cancer patients.
CDCA3 over-expression may be potentially related to the G1 arrest in the cell cycle, which serves as the crucial cell division checkpoint, leading to the cascade reactions that potentially result in cancer development. CDCA3 is suggested to be the possible breast cancer target. CDCA3 plays a role in triggering several types of cancer [such as liver cancer (37), as well as oral squamous cell cancer (38)]. It was found in this study that, CDCA3 expression level was up-regulated in human ovarian cancer tissues compared with that in the non-carcinoma counterparts, whereas such expression showed no association with cancer classification among ovarian cancer patients. Commonly, the high CDCA3 expression level showed a significant correlation with dismal OS for all ovarian cancer cases.
CDCA4 is one of the TRIP-Br transcription co-factor family members, which is demonstrated to play an important part in adjusting transcription factor (TF) activities, including p53 and E2F1 (22,39). It is important to determine specific target gene expression profiles in certain breast cancer subtypes, so as to develop the novel treatments. According to our results, CDCA4 expression level was higher in human ovarian cancer tissues compared with that in non-carcinoma counterparts, and its expression level showed no correlation with cancer classification among ovarian cancer patients. Commonly, the up-regulated CDCA4 expression level showed significant correlation with the dismal PPS among all ovarian cancer patients.
As one of the oncogenes, the over-expression of CDCA5 is detected in a variety of cancer types (40-42). CDCA5 exerts an important part for DNA repairs, as well as sister-chromatid cohesion and separation. The over-expression of CDCA5 has been shown to be related to the dismal prognosis of lung carcinoma (24). In addition, the over-expression of CDCA5 is associated with the malfunction of G1-S transition in bladder urothelial cancer (40). As found in this study, CDCA5 expression level increased in human ovarian cancer tissues compared with that in the non-carcinoma tissues, and such expression showed an association with cancer classification for ovarian cancer patients. Obviously, the high CDCA5 expression level displayed distinct correlation with dismal PFS and OS among ovarian cancer cases.
In this study, CDCA7 expression level was found to be up-regulated in human ovarian cancer tissues relative to that in the non-carcinoma counterparts, and such expression showed a correlation with cancer classification among ovarian cancer patients. Obviously, the high CDCA7 expression level showed significant correlation with dismal OS for ovarian cancer patients.
CDCA8, which is also referred to as the Borealin/Dasra B, has been identified to be one of the chromosomal passenger complex (CPC) members, and it plays an indispensable role in genomic transmission in the process of cell division (43). CDCA8, which can act as a cell mitosis regulator, is demonstrated to show association with lung carcinoma after being subjected to phosphorylation at 4 sites (44). According to the previous meta-analysis, the over-expression of CDCA8 is related to the low survival of breast cancer patients (45). This study revealed that CDCA8 expression level was up-regulated in human ovarian cancer tissues compared with that in non-carcinoma counterparts, and such expression showed no correlation with cancer classification among ovarian cancer patients. Obviously, the increased CDCA8 expression level displayed significant correlation with the poor PFS among ovarian cancer patients.
Besides, KEGG and GO analyses were also carried out in this study to find the correlations between CDCA genes expression levels as well as linked genes of the highest alteration frequency and the prognosis for ovarian cancer. According to our results, attention should be paid to some pathways, which include: R-HAS-2500257: resolution of sister chromatid cohesion; GO: 0051301: cell division; CORUM: 1118: Chromosomal passenger complex (CPC, including CDCA8, INCENP, AURKB, and BIRC5); CORUM: 127: NDC80 kinetochore complex; M129: PID PLK1 pathway; GO: 0007080: mitotic metaphase plate congression. As a primary regulator of mitotic cell division and the DNA damage response, Polo-like kinase 1 (Plk1) is recognized as a new feasible biomarker in this area (46). PLK1 pathway has been revealed to exert certain function in patients with advanced solid malignancies (47), human hepatocellular carcinoma (HCC) (48,49), and glioma (50).
Certain limitations should be noted in this study. Ovarian cancer is associated with different histological subtypes, such as serous and endometrioid (51-54), which may generate different effects in gene targeted therapy. Consequently, there is still a long way to go for this finding.
The current research systemically examines CDCA genes expression levels and its prognostic significance within ovarian cancer, which sheds more light on the complexity and heterogeneity of ovarian cancer biological properties at the molecular level. This study suggests that up-regulation of CDCA genes expression levels in ovarian cancer tissues probably takes a crucial role in ovarian cancer oncogenesis. Besides, the high CDCA2/3/5/7 expression levels may serve as the potential prognostic markers of the poor survival and prognostic accuracy of ovarian cancer. Moreover, CDCA genes probably exert their functions in tumorigenesis through the PLK1 pathway.
Acknowledgments
Funding: This work was supported by the funds from the Medical Research Fund of Guangdong Province (No. A2018237).
Ethical Statement: The authors are accountable for all aspects of the work in ensuring that questions related to the accuracy or integrity of any part of the work are appropriately investigated and resolved.
Footnotes
Conflicts of Interest: The authors have no conflicts of interest to declare.
References
- 1.Bray F, Ferlay J, Soerjomataram I, et al. Global cancer statistics 2018: GLOBOCAN estimates of incidence and mortality worldwide for 36 cancers in 185 countries. CA Cancer J Clin 2018;68:394-424. 10.3322/caac.21492 [DOI] [PubMed] [Google Scholar]
- 2.Cortez AJ, Tudrej P, Kujawa KA, et al. Advances in ovarian cancer therapy. Cancer Chemother Pharmacol 2018;81:17-38. 10.1007/s00280-017-3501-8 [DOI] [PMC free article] [PubMed] [Google Scholar]
- 3.Lheureux S, Gourley C, Vergote I, et al. Epithelial ovarian cancer. Lancet 2019;393:1240-53. 10.1016/S0140-6736(18)32552-2 [DOI] [PubMed] [Google Scholar]
- 4.Jelovac D, Armstrong DK. Recent progress in the diagnosis and treatment of ovarian cancer. CA Cancer J Clin 2011;61:183-203. 10.3322/caac.20113 [DOI] [PMC free article] [PubMed] [Google Scholar]
- 5.Armstrong DK, Alvarez RD, Bakkum-Gamez JN, et al. NCCN Guidelines Insights: Ovarian Cancer, Version 1.2019. J Natl Compr Canc Netw 2019;17:896-909. 10.6004/jnccn.2019.0039 [DOI] [PubMed] [Google Scholar]
- 6.Pujade-Lauraine E, Ledermann JA, Selle F, et al. Olaparib tablets as maintenance therapy in patients with platinum-sensitive, relapsed ovarian cancer and a BRCA1/2 mutation (SOLO2/ENGOT-Ov21): a double-blind, randomised, placebo-controlled, phase 3 trial. Lancet Oncol 2017;18:1274-84. 10.1016/S1470-2045(17)30469-2 [DOI] [PubMed] [Google Scholar]
- 7.Kristeleit R, Shapiro GI, Burris HA, et al. A Phase I-II Study of the Oral PARP Inhibitor Rucaparib in Patients with Germline BRCA1/2-Mutated Ovarian Carcinoma or Other Solid Tumors. Clin Cancer Res 2017;23:4095-106. 10.1158/1078-0432.CCR-16-2796 [DOI] [PubMed] [Google Scholar]
- 8.Mirza MR, Monk BJ, Herrstedt J, et al. Niraparib Maintenance Therapy in Plati-num-Sensitive, Recurrent Ovarian Cancer. N Engl J Med 2016;375:2154-64. 10.1056/NEJMoa1611310 [DOI] [PubMed] [Google Scholar]
- 9.Finch A, Beiner M, Lubinski J, et al. Salpingo-oophorectomy and the risk of ovarian, fallopian tube, and peritoneal cancers in women with a BRCA1 or BRCA2 Mutation. JAMA 2006;296:185-92. 10.1001/jama.296.2.185 [DOI] [PubMed] [Google Scholar]
- 10.Marchetti C, De Felice F, Palaia I, et al. Risk-reducing salpingo-oophorectomy: a me-ta-analysis on impact on ovarian cancer risk and all cause mortality in BRCA 1 and BRCA 2 mutation carriers. BMC Womens Health 2014;14:150. 10.1186/s12905-014-0150-5 [DOI] [PMC free article] [PubMed] [Google Scholar]
- 11.Reitsma W, de Bock GH, Oosterwijk JC, et al. Support of the 'fallopian tube hypothesis' in a prospective series of risk-reducing salpingo-oophorectomy specimens. Eur J Cancer 2013;49:132-41. 10.1016/j.ejca.2012.07.021 [DOI] [PubMed] [Google Scholar]
- 12.Domchek SM, Friebel TM, Singer CF, et al. Association of risk-reducing surgery in BRCA1 or BRCA2 mutation carriers with cancer risk and mortality. JAMA 2010;304:967-75. 10.1001/jama.2010.1237 [DOI] [PMC free article] [PubMed] [Google Scholar]
- 13.Rebbeck TR, Kauff ND, Domchek SM. Meta-analysis of risk reduction estimates associ-ated with risk-reducing salpingo-oophorectomy in BRCA1 or BRCA2 mutation carriers. J Natl Cancer Inst 2009;101:80-7. 10.1093/jnci/djn442 [DOI] [PMC free article] [PubMed] [Google Scholar]
- 14.Smith RA, Manassaram-Baptiste D, Brooks D, et al. Cancer screening in the United States, 2015: a review of current American cancer society guidelines and current issues in cancer screening. CA Cancer J Clin 2015;65:30-54. 10.3322/caac.21261 [DOI] [PubMed] [Google Scholar]
- 15.Preston-Martin S, Pike MC, Ross RK, et al. Increased cell division as a cause of human cancer. Cancer Res 1990;50:7415-21. [PubMed] [Google Scholar]
- 16.Vader G, Lens SM. The Aurora kinase family in cell division and cancer. Biochim Biophys Acta 2008;1786:60-72. [DOI] [PubMed] [Google Scholar]
- 17.Collins I, Garrett MD. Targeting the cell division cycle in cancer: CDK and cell cycle checkpoint kinase inhibitors. Curr Opin Pharmacol 2005;5:366-73. 10.1016/j.coph.2005.04.009 [DOI] [PubMed] [Google Scholar]
- 18.Hayama S, Daigo Y, Kato T, et al. Activation of CDCA1-KNTC2, members of centromere protein complex, involved in pulmonary carcinogenesis. Cancer Res 2006;66:10339-48. 10.1158/0008-5472.CAN-06-2137 [DOI] [PubMed] [Google Scholar]
- 19.Peng A, Lewellyn AL, Schiemann WP, et al. Repo-man controls a protein phosphatase 1-dependent threshold for DNA damage checkpoint activation. Curr Biol 2010;20:387-96. 10.1016/j.cub.2010.01.020 [DOI] [PMC free article] [PubMed] [Google Scholar]
- 20.Vagnarelli P. Repo-man at the intersection of chromatin remodelling, DNA repair, nu-clear envelope organization, and cancer progression. Adv Exp Med Biol 2014;773:401-14. 10.1007/978-1-4899-8032-8_18 [DOI] [PubMed] [Google Scholar]
- 21.Yoshida K. Cell-cycle-dependent regulation of the human and mouse Tome-1 pro-moters. FEBS Lett 2005;579:1488-92. 10.1016/j.febslet.2005.01.055 [DOI] [PubMed] [Google Scholar]
- 22.Hayashi R, Goto Y, Ikeda R, et al. CDCA4 is an E2F transcription factor family-induced nuclear factor that regulates E2F-dependent transcriptional activation and cell prolifera-tion. J Biol Chem 2006;281:35633-48. 10.1074/jbc.M603800200 [DOI] [PubMed] [Google Scholar]
- 23.Tategu M, Nakagawa H, Hayashi R, et al. Transcriptional co-factor CDCA4 participates in the regulation of JUN oncogene expression. Biochimie 2008;90:1515-22. 10.1016/j.biochi.2008.05.014 [DOI] [PubMed] [Google Scholar]
- 24.Nguyen MH, Koinuma J, Ueda K, et al. Phosphorylation and activation of cell division cycle associated 5 by mitogen-activated protein kinase play a crucial role in human lung carcinogenesis. Cancer Res 2010;70:5337-47. 10.1158/0008-5472.CAN-09-4372 [DOI] [PubMed] [Google Scholar]
- 25.Piqué DG, Montagna C, Greally JM, et al. A novel approach to modelling transcriptional heterogeneity identifies the oncogene candidate CBX2 in invasive breast carcinoma. Br J Cancer 2019;120:746-53. 10.1038/s41416-019-0387-8 [DOI] [PMC free article] [PubMed] [Google Scholar]
- 26.Higuchi T, Uhlmann F. Cell cycle: passenger acrobatics. Nature 2003;426:780-1. 10.1038/426780a [DOI] [PubMed] [Google Scholar]
- 27.Liu J, Meng H, Li S, et al. Identification of Potential Biomarkers in Association With Pro-gression and Prognosis in Epithelial Ovarian Cancer by Integrated Bioinformatics Anal-ysis. Front Genet 2019;10:1031. 10.3389/fgene.2019.01031 [DOI] [PMC free article] [PubMed] [Google Scholar]
- 28.Itzel T, Scholz P, Maass T, et al. Translating bioinformatics in oncology: guilt-by-profiling analysis and identification of KIF18B and CDCA3 as novel driver genes in carcinogenesis. Bioinformatics 2015;31:216-24. 10.1093/bioinformatics/btu586 [DOI] [PMC free article] [PubMed] [Google Scholar]
- 29.Kaneko N, Miura K, Gu Z, et al. siRNA-mediated knockdown against CDCA1 and KNTC2, both frequently overexpressed in colorectal and gastric cancers, suppresses cell prolif-eration and induces apoptosis. Biochem Biophys Res Commun 2009;390:1235-40. 10.1016/j.bbrc.2009.10.127 [DOI] [PubMed] [Google Scholar]
- 30.Sawyer E, Roylance R, Petridis C, et al. Genetic predisposition to in situ and invasive lobular carcinoma of the breast. PLoS Genet 2014;10:e1004285. 10.1371/journal.pgen.1004285 [DOI] [PMC free article] [PubMed] [Google Scholar]
- 31.Yoshihara K, Tajima A, Komata D, et al. Gene expression profiling of advanced-stage serous ovarian cancers distinguishes novel subclasses and implicates ZEB2 in tumor progression and prognosis. Cancer Sci 2009;100:1421-8. 10.1111/j.1349-7006.2009.01204.x [DOI] [PMC free article] [PubMed] [Google Scholar]
- 32.Lu KH, Patterson AP, Wang L, et al. Selection of potential markers for epithelial ovarian cancer with gene expression arrays and recursive descent partition analysis. Clin Cancer Res 2004;10:3291-300. 10.1158/1078-0432.CCR-03-0409 [DOI] [PubMed] [Google Scholar]
- 33.Bonome T, Levine DA, Shih J, et al. A gene signature predicting for survival in subop-timally debulked patients with ovarian cancer. Cancer Res 2008;68:5478-86. 10.1158/0008-5472.CAN-07-6595 [DOI] [PMC free article] [PubMed] [Google Scholar]
- 34.Wright JD, Hou JY, Burke WM, et al. Utilization and Toxicity of Alternative Delivery Methods of Adjuvant Chemotherapy for Ovarian Cancer. Obstet Gynecol 2016;127:985-91. 10.1097/AOG.0000000000001436 [DOI] [PMC free article] [PubMed] [Google Scholar]
- 35.Markman M. Management of ovarian cancer. An impressive history of improvement in survival and quality of life. Oncology (Williston Park) 2006;20:347-354; discussion 354, 357-348, 364 passim. [PubMed]
- 36.Qian J, Lesage B, Beullens M, et al. PP1/Repo-man dephosphorylates mitotic histone H3 at T3 and regulates chromosomal aurora B targeting. Curr Biol 2011;21:766-73. 10.1016/j.cub.2011.03.047 [DOI] [PubMed] [Google Scholar]
- 37.Hu Q, Fu J, Luo B, et al. OY-TES-1 may regulate the malignant behavior of liver cancer via NANOG, CD9, CCND2 and CDCA3: a bioinformatic analysis combine with RNAi and oligonucleotide microarray. Oncol Rep 2015;33:1965-75. 10.3892/or.2015.3792 [DOI] [PubMed] [Google Scholar]
- 38.Uchida F, Uzawa K, Kasamatsu A, et al. Overexpression of cell cycle regulator CDCA3 promotes oral cancer progression by enhancing cell proliferation with prevention of G1 phase arrest. BMC Cancer 2012;12:321. 10.1186/1471-2407-12-321 [DOI] [PMC free article] [PubMed] [Google Scholar]
- 39.Watanabe-Fukunaga R, Iida S, Shimizu Y, et al. SEI family of nuclear factors regulates p53-dependent transcriptional activation. Genes Cells 2005;10:851-60. 10.1111/j.1365-2443.2005.00881.x [DOI] [PubMed] [Google Scholar]
- 40.Chang IW, Lin VC, He HL, et al. CDCA5 overexpression is an indicator of poor prognosis in patients with urothelial carcinomas of the upper urinary tract and urinary bladder. Am J Transl Res 2015;7:710-22. [PMC free article] [PubMed] [Google Scholar]
- 41.Cheng WY, Ou Yang TH, Anastassiou D. Development of a prognostic model for breast cancer survival in an open challenge environment. Sci Transl Med 2013;5:181ra50. 10.1126/scitranslmed.3005974 [DOI] [PubMed] [Google Scholar]
- 42.Ho DW, Kai AK, Ng IO. TCGA whole-transcriptome sequencing data reveals significantly dysregulated genes and signaling pathways in hepatocellular carcinoma. Front Med 2015;9:322-30. 10.1007/s11684-015-0408-9 [DOI] [PubMed] [Google Scholar]
- 43.Dai C, Miao CX, Xu XM, et al. Transcriptional activation of human CDCA8 gene regulated by transcription factor NF-Y in embryonic stem cells and cancer cells. J Biol Chem 2015;290:22423-34. 10.1074/jbc.M115.642710 [DOI] [PMC free article] [PubMed] [Google Scholar]
- 44.Hayama S, Daigo Y, Yamabuki T, et al. Phosphorylation and activation of cell division cycle associated 8 by aurora kinase B plays a significant role in human lung carcino-genesis. Cancer Res 2007;67:4113-22. 10.1158/0008-5472.CAN-06-4705 [DOI] [PubMed] [Google Scholar]
- 45.Jiao DC, Lu ZD, Qiao JH, et al. Expression of CDCA8 correlates closely with FOXM1 in breast cancer: public microarray data analysis and immunohistochemical study. Neoplasma 2015;62:464-9. 10.4149/neo_2015_055 [DOI] [PubMed] [Google Scholar]
- 46.Van den Bossche J, Deben C, Op de Beeck K, et al. Towards Prognostic Profiling of Non-Small Cell Lung Cancer: New Perspectives on the Relevance of Polo-Like Kinase 1 Expression, the TP53 Mutation Status and Hypoxia. J Cancer 2017;8:1441-52. 10.7150/jca.18455 [DOI] [PMC free article] [PubMed] [Google Scholar]
- 47.Bowles DW, Diamond JR, Lam ET, et al. Phase I study of oral rigosertib (ON 01910.Na), a dual inhibitor of the PI3K and Plk1 pathways, in adult patients with advanced solid ma-lignancies. Clin Cancer Res 2014;20:1656-65. 10.1158/1078-0432.CCR-13-2506 [DOI] [PMC free article] [PubMed] [Google Scholar]
- 48.Deng H, Jiang Q, Yang Y, et al. Intravenous liposomal delivery of the short hairpin RNAs against Plk1 controls the growth of established human hepatocellular carcinoma. Cancer Biol Ther 2011;11:401-9. 10.4161/cbt.11.4.14178 [DOI] [PubMed] [Google Scholar]
- 49.Li R, Jiang X, Zhang Y, et al. Cyclin B2 Overexpression in Human Hepatocellular Carci-noma is Associated with Poor Prognosis. Arch Med Res 2019;50:10-7. 10.1016/j.arcmed.2019.03.003 [DOI] [PubMed] [Google Scholar]
- 50.Zhang R, Wei RL, Du W, et al. Long noncoding RNA ENST00000413528 sponges mi-croRNA-593-5p to modulate human glioma growth via polo-like kinase 1. CNS Neurosci Ther 2019;25:842-54. [DOI] [PMC free article] [PubMed] [Google Scholar]
- 51.Prat J. New insights into ovarian cancer pathology. Ann Oncol 2012;23 Suppl 10:x111-117. 10.1093/annonc/mds300 [DOI] [PubMed] [Google Scholar]
- 52.McCluggage WG. Morphological subtypes of ovarian carcinoma: a review with emphasis on new developments and pathogenesis. Pathology 2011;43:420-32. 10.1097/PAT.0b013e328348a6e7 [DOI] [PubMed] [Google Scholar]
- 53.Köbel M, Kalloger SE, Huntsman DG, et al. Differences in tumor type in low-stage versus high-stage ovarian carcinomas. Int J Gynecol Pathol 2010;29:203-11. 10.1097/PGP.0b013e3181c042b6 [DOI] [PubMed] [Google Scholar]
- 54.Seidman JD, Horkayne-Szakaly I, Haiba M, et al. The histologic type and stage distribu-tion of ovarian carcinomas of surface epithelial origin. Int J Gynecol Pathol 2004;23:41-4. 10.1097/01.pgp.0000101080.35393.16 [DOI] [PubMed] [Google Scholar]


