

Abstract
Background
Cerebral palsy (CP) is "a group of permanent disorders of the development of movement and posture causing activity limitation(s) that are attributed to non‐progressive disturbance that occurred in the developing fetal or infant brain" (Rosenbaum 2007, p.9). The spastic motor type is the most common form of CP. Therapeutic management may include splinting/casting, passive stretching, facilitation of posture/movement, spasticity‐reducing medication and surgery. Botulinum toxin‐A (BoNT‐A) is now used as an adjunct to these techniques in an attempt to reduce spasticity, improve range of movement and function.
Objectives
To assess the effectiveness of injections of BoNT‐A or BoNT‐A and occupational therapy in the treatment of the upper limb in children with CP.
Search methods
We searched the Cochrane Controlled Trials Register/CENTRAL (The Cochrane Library, Issue 3, 2008), MEDLINE (1966 to August Week 1 2008), EMBASE (1980 to 2008 Week 28) and CINAHL (1982 to August Week 1 2008).
Selection criteria
All randomised controlled trials (RCTs) comparing BoNT‐A injection or BoNT‐A injection and occupational therapy in the upper limb(s) with other types of treatment (including no treatment or placebo) in children with CP.
Data collection and analysis
Two authors using standardised forms extracted the data independently. Each trial was assessed for internal validity and rated for quality using the PEDro scale. Data were extracted and entered into RevMan 5.0.15.
Main results
Ten trials met the inclusion criteria. PEDro quality ratings ranged from 6/10 to 10/10. Concentration of BoNT‐A ranged from 50U/1.0ml to 200U/1.0ml saline with doses of 0.5U to 16U/kg body weight and total doses of 220 to 410 Units (Botox®).
A combination of BoNT‐A and occupational therapy is more effective than occupational therapy alone in reducing impairment, improving activity level outcomes and goal achievement, but not for improving quality of life or perceived self‐competence. When compared with placebo or no treatment, there is moderate evidence that BoNT‐A alone is not effective.
Authors' conclusions
This systematic review found high level evidence supporting the use of BoNT‐A as an adjunct to managing the upper limb in children with spastic CP. BoNT‐A should not be used in isolation but should be accompanied by planned occupational therapy.
Further research is essential to identify children most likely to respond to BoNT‐A injections, monitor longitudinal outcomes, determine timing and effect of repeated injections and the most effective dosage, dilution and volume schedules. The most effective adjunct therapies including frequency and intensity of delivery also requires investigation.
Keywords: Adolescent; Child; Child, Preschool; Humans; Infant; Infant, Newborn; Arm; Botulinum Toxins, Type A; Botulinum Toxins, Type A/therapeutic use; Cerebral Palsy; Cerebral Palsy/drug therapy; Chemotherapy, Adjuvant; Injections, Intramuscular; Muscle Spasticity; Muscle Spasticity/drug therapy; Neuromuscular Agents; Neuromuscular Agents/therapeutic use; Randomized Controlled Trials as Topic
Plain language summary
There is high level evidence to support the safety and effectiveness of Botulinum toxin ‐A (BoNT‐A) as an adjunct to managing the upper limb in children with cerebral palsy.
When injected into muscles BoNT‐A reduces muscle tightness. When used in conjunction with occupational therapy, the aim of BoNT‐A injections in the arms and hands is to improve movement and function in treated limbs. This review demonstrated improvements on a range of measures with the combined treatment. In the absence of significant side effects, injection of BoNT‐A has been identified as a safe and effective treatment for upper limb spasticity when used in combination with occupational therapy in children with cerebral palsy.
Summary of findings
Summary of findings for the main comparison. BoNT‐A compared to Placebo/no treatment for children with cerebral palsy.
| BoNT‐A compared to Placebo/no treatment for children with cerebral palsy | ||||||
| Patient or population: children with cerebral palsy Settings: outpatient, community Intervention: BoNT‐A Comparison: Placebo/no treatment | ||||||
| Outcomes | Illustrative comparative risks* (95% CI) | Relative effect (95% CI) | No of Participants (studies) | Quality of the evidence (GRADE) | Comments | |
| Assumed risk | Corresponding risk | |||||
| Placebo/no treatment | BoNT‐A | |||||
| Elbow flexor spasticity modified Tardieu scale. Scale from: 0 to 180. Follow‐up: 3 months | The mean elbow flexor spasticity in the control groups was ‐14.87 degrees1 | The mean Elbow flexor spasticity in the intervention groups was 9.55 lower (25.93 lower to 6.83 higher) | 34 (1 study) | ⊕⊕⊕⊝ moderate2 | ||
| Wrist flexor spasticity modified Tardieu scale. Scale from: 0 to 90. Follow‐up: 3 months | The mean wrist flexor spasticity in the control groups was 0.33 degrees1 | The mean Wrist flexor spasticity in the intervention groups was 9.01 lower (32.74 lower to 14.72 higher) | 34 (1 study) | ⊕⊕⊕⊝ moderate2 | ||
| Quality of movement (18 mths ‐ 8yrs) Quality of Upper Extremity Skills Test. Scale from: 0 to 100. Follow‐up: 3 months | The mean quality of movement (18 mths ‐ 8yrs) in the control groups was ‐5.6 points1 | The mean Quality of movement (18 mths ‐ 8yrs) in the intervention groups was 8.6 higher (8.47 lower to 25.67 higher) | 13 (1 study) | ⊕⊕⊕⊝ moderate2 | ||
| Quality of movement (5 yrs ‐ 15yrs) The Melbourne Assessment. Scale from: 0 to 100. Follow‐up: mean 3 weeks | The mean quality of movement (5 yrs ‐ 15yrs) in the control groups was 2.7 points | The mean Quality of movement (5 yrs ‐ 15yrs) in the intervention groups was 2.8 lower (8.29 lower to 2.69 higher) | 21 (1 study) | ⊕⊕⊕⊝ moderate2 | ||
| Goal attainment Goal Attainment Scaling3. Scale from: 20 to 80. Follow‐up: 3 months | The mean goal attainment in the control groups was 12.87 points | The mean Goal attainment in the intervention groups was 9.24 higher (0.92 to 17.56 higher) | 32 (1 study) | ⊕⊕⊕⊝ moderate2 | ||
| Occupational performance ‐ performance Canadian Occupational Performance Measure. Scale from: 0 to 10. Follow‐up: 3 months | The mean occupational performance ‐ performance in the control groups was 1.2 points1 | The mean Occupational performance ‐ performance in the intervention groups was 1.1 higher (0.19 to 2.01 higher) | 34 (1 study) | ⊕⊕⊕⊕ high | ||
| Occuptional performance ‐ satisfaction Canadian Occupational Performance Measure. Scale from: 0 to 10. Follow‐up: 3 months | The mean occuptional performance ‐ satisfaction in the control groups was 1.4 points1 | The mean Occuptional performance ‐ satisfaction in the intervention groups was 1.4 higher (0.22 to 2.58 higher) | 34 (1 study) | ⊕⊕⊕⊕ high | ||
| *The basis for the assumed risk (e.g. the median control group risk across studies) is provided in footnotes. The corresponding risk (and its 95% confidence interval) is based on the assumed risk in the comparison group and the relative effect of the intervention (and its 95% CI). CI: Confidence interval; | ||||||
| GRADE Working Group grades of evidence High quality: Further research is very unlikely to change our confidence in the estimate of effect. Moderate quality: Further research is likely to have an important impact on our confidence in the estimate of effect and may change the estimate. Low quality: Further research is very likely to have an important impact on our confidence in the estimate of effect and is likely to change the estimate. Very low quality: We are very uncertain about the estimate. | ||||||
1 Change from baseline. 2 95% CI includes no effect and the lower confidence limit crosses an effect size of 0.5 in either direction. 3 Scale range depends on number of goals scaled.
Summary of findings 2. BoNT‐A/OT compared to OT only for children with cerebral palsy.
| BoNT‐A/OT compared to OT only for children with cerebral palsy | ||||||
| Patient or population: children with cerebral palsy Settings: outpatient, community Intervention: BoNT‐A/OT Comparison: OT only | ||||||
| Outcomes | Illustrative comparative risks* (95% CI) | Relative effect (95% CI) | No of Participants (studies) | Quality of the evidence (GRADE) | Comments | |
| Assumed risk | Corresponding risk | |||||
| OT only | BoNT‐A/OT | |||||
| Elbow flexor spasticity modified Tardieu scale. Scale from: 0 to 180. Follow‐up: 3 months | The mean elbow flexor spasticity in the control groups was 1.93 degrees1 | The mean Elbow flexor spasticity in the intervention groups was 27.43 lower (43.09 to 11.77 lower) | 36 (1 study) | ⊕⊕⊕⊕ high | ||
| Wrist flexor spasticity modified Tardieu scale. Scale from: 0 to 90. Follow‐up: 3 months | The mean wrist flexor spasticity in the control groups was ‐5.94 degrees1 | The mean Wrist flexor spasticity in the intervention groups was 21.81 lower (33.65 to 9.97 lower) | 36 (1 study) | ⊕⊕⊕⊕ high | ||
| Quality of movement (18 mths ‐ 8yrs) Quality of Upper Extremity Skills Test. Scale from: 0 to 100. Follow‐up: 3 months | The mean quality of movement (18 mths ‐ 8yrs) ranged across control groups from 2.81 to 4.4 points1 | The mean Quality of movement (18 mths ‐ 8yrs) in the intervention groups was 9.19 higher (4.84 to 13.54 higher) | 84 (3 studies) | ⊕⊕⊕⊕ high | ||
| Quality of movement (5 yrs ‐ 15yrs) The Melbourne Assessment. Scale from: 0 to 100. Follow‐up: 3 months | The mean quality of movement (5 yrs ‐ 15yrs) ranged across control groups from 0.16 to 3.6 points1 | The mean Quality of movement (5 yrs ‐ 15yrs) in the intervention groups was 4.46 higher (0.77 lower to 9.69 higher) | 69 (3 studies) | ⊕⊕⊕⊕ high | ||
| Goal attainment Goal Attainment Scaling2. Scale from: 20 to 80. Follow‐up: 3 months | The mean goal attainment ranged across control groups from 8.91 to 22.18 points1 | The mean Goal attainment in the intervention groups was 8.52 higher (4.42 to 12.62 higher) | 152 (4 studies) | ⊕⊕⊕⊕ high | ||
| Occupational performance ‐ performance Canadian Occupational Performance Measure. Scale from: 0 to 10. Follow‐up: 3 months | The mean occupational performance ‐ performance ranged across control groups from 1.14 to 4.09 points1 | The mean Occupational performance ‐ performance in the intervention groups was 0.77 higher (0.23 to 1.31 higher) | 109 (3 studies) | ⊕⊕⊕⊕ high | ||
| Occupational performance ‐ satisfaction Canadian Occupational Performance Measure. Scale from: 0 to 100. Follow‐up: mean 3 months | The mean occupational performance ‐ satisfaction ranged across control groups from 1.2 to 4.04 points1 | The mean Occupational performance ‐ satisfaction in the intervention groups was 0.81 higher (0.17 to 1.46 higher) | 109 (3 studies) | ⊕⊕⊕⊕ high | ||
| *The basis for the assumed risk (e.g. the median control group risk across studies) is provided in footnotes. The corresponding risk (and its 95% confidence interval) is based on the assumed risk in the comparison group and the relative effect of the intervention (and its 95% CI). CI: Confidence interval; | ||||||
| GRADE Working Group grades of evidence High quality: Further research is very unlikely to change our confidence in the estimate of effect. Moderate quality: Further research is likely to have an important impact on our confidence in the estimate of effect and may change the estimate. Low quality: Further research is very likely to have an important impact on our confidence in the estimate of effect and is likely to change the estimate. Very low quality: We are very uncertain about the estimate. | ||||||
1 Change from baseline. 2 Scale range depends on number of goals scaled.
Summary of findings 3. BoNT‐A/OT compared to BoNT‐A only for children with cerebral palsy.
| BoNT‐A/OT compared to BoNT‐A only for children with cerebral palsy | ||||||
| Patient or population: patients with children with cerebral palsy Settings: outpatient, community Intervention: BoNT‐A/OT Comparison: BoNT‐A only | ||||||
| Outcomes | Illustrative comparative risks* (95% CI) | Relative effect (95% CI) | No of Participants (studies) | Quality of the evidence (GRADE) | Comments | |
| Assumed risk | Corresponding risk | |||||
| BoNT‐A only | BoNT‐A/OT | |||||
| Elbow flexors spasticity modified Tardieu scale. Scale from: 0 to 180. Follow‐up: 3 months | The mean elbow flexors spasticity in the control groups was ‐24.42 degrees1 | The mean Elbow flexors spasticity in the intervention groups was 1.08 lower (21.59 lower to 19.43 higher) | 39 (1 study) | ⊕⊕⊕⊝ moderate2 | ||
| Wrist flexor spasticity modified Tardieu scale. Scale from: 0 to 90. Follow‐up: 3 months | The mean wrist flexor spasticity in the control groups was ‐8.68 degrees1 | The mean Wrist flexor spasticity in the intervention groups was 19.07 lower (35.02 to 3.12 lower) | 39 (1 study) | ⊕⊕⊕⊕ high | ||
| Quality of movement (18 mths ‐ 8yrs) Quality of Upper Extremity Skills Test. Scale from: 0 to 100. Follow‐up: 3 months | The mean quality of movement (18 mths ‐ 8yrs) in the control groups was 3 points1 | The mean Quality of movement (18 mths ‐ 8yrs) in the intervention groups was 7.4 higher (8.45 lower to 23.25 higher) | 14 (1 study) | ⊕⊕⊕⊝ moderate2 | ||
| Quality of movement (5 yrs ‐ 15yrs) The Melbourne Assessment. Scale from: 0 to 100. Follow‐up: 3 months | The mean quality of movement (5 yrs ‐ 15yrs) in the control groups was ‐0.1 points1 | The mean Quality of movement (5 yrs ‐ 15yrs) in the intervention groups was 5.3 higher (0.95 to 9.65 higher) | 22 (1 study) | ⊕⊕⊕⊕ high | ||
| Goal attainment Goal Attainment Scaling3. Scale from: 20 to 80. Follow‐up: 3 months | The mean goal attainment in the control groups was 22.11 points1 | The mean Goal attainment in the intervention groups was 8.69 higher (0.48 to 16.9 higher) | 39 (1 study) | ⊕⊕⊕⊕ high | ||
| Occupational performance ‐ performance Canadian Occupational Performance Measure. Scale from: 0 to 10. Follow‐up: 3 months | The mean occupational performance ‐ performance in the control groups was 2.3 points1 | The mean Occupational performance ‐ performance in the intervention groups was 0.6 higher (0.44 lower to 1.64 higher) | 39 (1 study) | ⊕⊕⊕⊝ moderate2 | ||
| Occupational performance ‐ satisfaction Canadian Occupational Performance Measure. Scale from: 0 to 10. Follow‐up: 3 months | The mean occupational performance ‐ satisfaction in the control groups was 2.8 points1 | The mean Occupational performance ‐ satisfaction in the intervention groups was 0.7 higher (0.71 lower to 2.11 higher) | 39 (1 study) | ⊕⊕⊕⊝ moderate2 | ||
| *The basis for the assumed risk (e.g. the median control group risk across studies) is provided in footnotes. The corresponding risk (and its 95% confidence interval) is based on the assumed risk in the comparison group and the relative effect of the intervention (and its 95% CI). CI: Confidence interval; | ||||||
| GRADE Working Group grades of evidence High quality: Further research is very unlikely to change our confidence in the estimate of effect. Moderate quality: Further research is likely to have an important impact on our confidence in the estimate of effect and may change the estimate. Low quality: Further research is very likely to have an important impact on our confidence in the estimate of effect and is likely to change the estimate. Very low quality: We are very uncertain about the estimate. | ||||||
1 Change from baseline. 2 95% CI includes no effect and the lower confidence limit crosses an effect size of 0.5 in either direction. 3 Scale range depends on number of goals scaled.
Summary of findings 4. BoNT‐A/OT compared to Placebo/no treatment for children with cerebral palsy.
| BoNT‐A/OT compared to Placebo/no treatment for children with cerebral palsy | ||||||
| Patient or population: children with cerebral palsy Settings: outpatient, community Intervention: BoNT‐A/OT Comparison: Placebo/no treatment | ||||||
| Outcomes | Illustrative comparative risks* (95% CI) | Relative effect (95% CI) | No of Participants (studies) | Quality of the evidence (GRADE) | Comments | |
| Assumed risk | Corresponding risk | |||||
| Placebo/no treatment | BoNT‐A/OT | |||||
| Elbow flexor spasticity modified Tardieu scale. Scale from: 0 to 100. Follow‐up: 3 months | The mean elbow flexor spasticity in the control groups was ‐14.87 degrees1 | The mean Elbow flexor spasticity in the intervention groups was 10.63 lower (26.4 lower to 5.14 higher) | 35 (1 study) | ⊕⊕⊕⊝ moderate2 | ||
| Wrist flexor spasticity modified Tardieu scale. Scale from: 0 to 90. Follow‐up: 3 months | The mean wrist flexor spasticity in the control groups was 0.33 degrees1 | The mean Wrist flexor spasticity in the intervention groups was 28.08 lower (48.71 to 7.45 lower) | 35 (1 study) | ⊕⊕⊕⊕ high | ||
| Quality of movement (18 mths ‐ 8yrs) Quality of Upper Extremity Skills Test. Scale from: 0 to 100. Follow‐up: 3 months | The mean quality of movement (18 mths ‐ 8yrs) in the control groups was ‐5.6 points1 | The mean Quality of movement (18 mths ‐ 8yrs) in the intervention groups was 16 higher (0.5 to 31.5 higher) | 13 (1 study) | ⊕⊕⊕⊝ moderate2 | ||
| Quality of movement (5 yrs ‐ 15yrs) The Melbourne Assessment. Scale from: 0 to 100. Follow‐up: 3 months | The mean quality of movement (5 yrs ‐ 15yrs) in the control groups was 2.7 points1 | The mean Quality of movement (5 yrs ‐ 15yrs) in the intervention groups was 2.5 higher (2.6 lower to 7.6 higher) | 19 (1 study) | ⊕⊕⊕⊝ moderate2 | ||
| Goal attainment Goal Attainment Scaling3. Scale from: 20 to 80. Follow‐up: 3 months | The mean goal attainment in the control groups was 12.87 points1 | The mean Goal attainment in the intervention groups was 17.93 higher (10.17 to 25.69 higher) | 33 (1 study) | ⊕⊕⊕⊕ high | ||
| Occupational performance ‐ performance Canadian Occupational Performance Measure. Scale from: 0 to 10. Follow‐up: 3 months | The mean occupational performance ‐ performance in the control groups was 1.2 points1 | The mean Occupational performance ‐ performance in the intervention groups was 1.7 higher (0.7 to 2.7 higher) | 35 (1 study) | ⊕⊕⊕⊕ high | ||
| Occupational performance ‐ satisfaction Canadian Occupational Performance Measure. Scale from: 0 to 10. Follow‐up: 3 months | The mean occupational performance ‐ satisfaction in the control groups was 1.4 points1 | The mean Occupational performance ‐ satisfaction in the intervention groups was 2.1 higher (0.83 to 3.37 higher) | 35 (1 study) | ⊕⊕⊕⊕ high | ||
| *The basis for the assumed risk (e.g. the median control group risk across studies) is provided in footnotes. The corresponding risk (and its 95% confidence interval) is based on the assumed risk in the comparison group and the relative effect of the intervention (and its 95% CI). CI: Confidence interval; | ||||||
| GRADE Working Group grades of evidence High quality: Further research is very unlikely to change our confidence in the estimate of effect. Moderate quality: Further research is likely to have an important impact on our confidence in the estimate of effect and may change the estimate. Low quality: Further research is very likely to have an important impact on our confidence in the estimate of effect and is likely to change the estimate. Very low quality: We are very uncertain about the estimate. | ||||||
1 Change from baseline. 2 95% CI includes no effect and the lower confidence limit crosses an effect size of 0.5 in either direction. 3 Scale range depends on number of goals scaled.
Summary of findings 5. BoNT‐A only compared to OT only for children with cerebral palsy.
| BoNT‐A only compared to OT only for children with cerebral palsy | ||||||
| Patient or population: children with cerebral palsy Settings: outpatient, community Intervention: BoNT‐A only Comparison: OT only | ||||||
| Outcomes | Illustrative comparative risks* (95% CI) | Relative effect (95% CI) | No of Participants (studies) | Quality of the evidence (GRADE) | Comments | |
| Assumed risk | Corresponding risk | |||||
| OT only | BoNT‐A only | |||||
| Elbow flexor spasticity modified Tardieu scale. Scale from: 0 to 180. Follow‐up: 3 months | The mean elbow flexor spasticity in the control groups was 1.94 degrees1 | The mean Elbow flexor spasticity in the intervention groups was 26.36 lower (42.63 to 10.09 lower) | 35 (1 study) | ⊕⊕⊕⊕ high | ||
| Wrist flexor spasticity modified Tardieu scale. Scale from: 0 to 90. Follow‐up: 3 months | The mean wrist flexor spasticity in the control groups was ‐5.94 degrees1 | The mean Wrist flexor spasticity in the intervention groups was 2.74 lower (19.41 lower to 13.93 higher) | 35 (1 study) | ⊕⊕⊕⊝ moderate2 | ||
| Quality of movement (18 mths ‐ 8yrs) QUEST. Scale from: 0 to 100. Follow‐up: 3 months | The mean quality of movement (18 mths ‐ 8yrs) in the control groups was 4.4 points1 | The mean Quality of movement (18 mths ‐ 8yrs) in the intervention groups was 1.4 lower (20.95 lower to 18.15 higher) | 13 (1 study) | ⊕⊕⊕⊝ moderate2 | ||
| Quality of movement (5 yrs ‐ 15yrs) The Melbourne Assessment. Scale from: 0 to 100. Follow‐up: 3 months | The mean quality of movement (5 yrs ‐ 15yrs) in the control groups was 3.6 points1 | The mean Quality of movement (5 yrs ‐ 15yrs) in the intervention groups was 3.7 lower (10.15 lower to 2.75 higher) | 21 (1 study) | ⊕⊕⊕⊝ moderate2 | ||
| Goal attainment Goal attainment scaling3. Scale from: 20 to 80. Follow‐up: 3 months | The mean goal attainment in the control groups was 22.18 points1 | The mean Goal attainment in the intervention groups was 0.07 lower (8.05 lower to 7.91 higher) | 36 (1 study) | ⊕⊕⊕⊝ moderate2 | ||
| Occupational performance ‐ performance Canadian Occupational Performance Measure. Scale from: 0 to 10. Follow‐up: 3 months | The mean occupational performance ‐ performance in the control groups was 2.1 points1 | The mean Occupational performance ‐ performance in the intervention groups was 0.2 higher (0.85 lower to 1.25 higher) | 36 (1 study) | ⊕⊕⊕⊝ moderate2 | ||
| Occupational performance ‐ satisfaction Canadian Occupational Performance Measure. Scale from: 0 to 10. Follow‐up: 3 months | The mean occupational performance ‐ satisfaction in the control groups was 2.5 points1 | The mean Occupational performance ‐ satisfaction in the intervention groups was 0.3 higher (1.01 lower to 1.61 higher) | 36 (1 study) | ⊕⊕⊕⊝ moderate2 | ||
| *The basis for the assumed risk (e.g. the median control group risk across studies) is provided in footnotes. The corresponding risk (and its 95% confidence interval) is based on the assumed risk in the comparison group and the relative effect of the intervention (and its 95% CI). CI: Confidence interval; | ||||||
| GRADE Working Group grades of evidence High quality: Further research is very unlikely to change our confidence in the estimate of effect. Moderate quality: Further research is likely to have an important impact on our confidence in the estimate of effect and may change the estimate. Low quality: Further research is very likely to have an important impact on our confidence in the estimate of effect and is likely to change the estimate. Very low quality: We are very uncertain about the estimate. | ||||||
1 Change from baseline. 2 95% CI includes no effect and the lower confidence limit crosses an effect size of 0.5 in either direction. 3 Scale range depends on number of goals scaled.
Summary of findings 6. High dose BoNT‐A compared to Low dose BoNT‐A in children with cerebral palsy.
| High dose BoNT‐A compared to Low dose BoNT‐A in children with cerebral palsy | ||||||
| Patient or population: children with cerebral palsy Settings: outpatient, community Intervention: High dose BoNT‐A Comparison: Low dose BoNT‐A | ||||||
| Outcomes | Illustrative comparative risks* (95% CI) | Relative effect (95% CI) | No of Participants (studies) | Quality of the evidence (GRADE) | Comments | |
| Assumed risk | Corresponding risk | |||||
| Low dose BoNT‐A | High dose BoNT‐A | |||||
| Elbow flexor spasticity | The mean Elbow flexor spasticity in the intervention groups was 0 higher (0 to 0 higher) | 0 (01) | See comment | |||
| Wrist flexor spasticity | The mean Wrist flexor spasticity in the intervention groups was 0 higher (0 to 0 higher) | 0 (01) | See comment | |||
| Quality of movement (18 mths ‐ 8yrs) Quality of Upper Extremity Skills Test. Scale from: 0 to 100. Follow‐up: 3 months | The mean quality of movement (18 mths ‐ 8yrs) in the control groups was 5.58 points2 | The mean Quality of movement (18 mths ‐ 8yrs) in the intervention groups was 1.75 higher (6.67 lower to 10.17 higher) | 39 (1 study) | ⊕⊕⊕⊝ moderate3 | ||
| Goal attainment | The mean Goal attainment in the intervention groups was 0 higher (0 to 0 higher) | 0 (01) | See comment | |||
| Quality of movement (5 yrs to 15 yrs) | The mean Quality of movement (5 yrs to 15 yrs) in the intervention groups was 0 higher (0 to 0 higher) | 0 (01) | See comment | |||
| Occupational performance ‐ performance | The mean Occupational performance ‐ performance in the intervention groups was 0 higher (0 to 0 higher) | 0 (01) | See comment | |||
| Occupational performance ‐ satisfaction | The mean Occupational performance ‐ satisfaction in the intervention groups was 0 higher (0 to 0 higher) | 0 (01) | See comment | |||
| *The basis for the assumed risk (e.g. the median control group risk across studies) is provided in footnotes. The corresponding risk (and its 95% confidence interval) is based on the assumed risk in the comparison group and the relative effect of the intervention (and its 95% CI). CI: Confidence interval; | ||||||
| GRADE Working Group grades of evidence High quality: Further research is very unlikely to change our confidence in the estimate of effect. Moderate quality: Further research is likely to have an important impact on our confidence in the estimate of effect and may change the estimate. Low quality: Further research is very likely to have an important impact on our confidence in the estimate of effect and is likely to change the estimate. Very low quality: We are very uncertain about the estimate. | ||||||
1 Data not available 2 Change from baseline. 3 95% CI includes no effect and the lower confidence limit crosses an effect size of 0.5 in either direction.
Background
Cerebral palsy is "a group of permanent disorders of the development of movement and posture causing activity limitation(s) that are attributed to non‐progressive disturbance that occurred in the developing fetal or infant brain" (Rosenbaum 2007, p.9). Cerebral palsy affects more than 2 children per 1000 live births worldwide and is the most common cause of physical disability in childhood (Blair 2006; SCPE 2000; Stanley 2000). Although the brain lesions are static, the movement disorders that arise in cerebral palsy are not unchanging and are characterised by atypical muscle tone, posture, and movement (Rang 1990). Cerebral palsy can also be accompanied by cognitive, psychiatric, sensory and seizure disorders (Bax 2005). The spastic motor type is the most common type of cerebral palsy, comprising about 80% of all reported cases (Graham 2000). Spasticity is a motor disorder characterised by a velocity‐dependent increase in tonic stretch reflexes (muscle tone) with exaggerated tendon jerks (phasic stretch reflex) resulting from hyperexcitability of the stretch reflex (Lance 1980). Muscle tone is the sensation of resistance that is encountered as a joint is passively moved through a range of motion (Lance and McLeod 1981). Spasticity and abnormal muscle tone contribute to both the impairment of function and reduced longitudinal muscle growth in children with cerebral palsy (Dunne 1995).
Conventional therapeutic management of upper limb spasticity in children with cerebral palsy has involved splinting/casting, passive stretching, the facilitation of posture and movement (e.g. occupational therapy and physiotherapy), spasticity‐reducing medication and surgery (Hoare 2004). Botulinum toxin A (BoNT‐A) is now used as an adjunct to these therapeutic techniques as a means of reducing muscle tone and spasticity, and improving range of movement and function.
BoNT‐A is a powerful neuromuscular paralysing agent that is produced by the anaerobic bacterium Clostridium botulinum (NIHCDCS 1991). BoNT‐A acts at the neuromuscular junction by inhibiting the release of the neurotransmitter acetylcholine. Injection of BoNT‐A into selected muscles produces dose‐dependent chemical denervation resulting in reduced muscle activity. The pharmacological effects of BoNT‐A are temporary as sprouting of new nerve terminals from the treated nerves leads to reinnervation. The function of the original terminal is eventually restored leading to the recovery of the affected muscles (dePaiva 1999). The period of clinically useful relaxation appears to be 12‐16 weeks (Graham 2000).
The aim of treatment with BoNT‐A is to produce a selective reduction in muscle spasticity using the smallest possible dose of BoNT‐A. The reduction in spasticity and muscle tone is intended to provide an opportunity to optimise the effects of splinting and casting used for increasing muscle length, enhance motor ability and functional skills and delay the need for surgery (Hoare and Russo 2009).
The earlier version of this review concluded, on the basis of two Randomised Controlled Trials (RCTs), that there was insufficient evidence to support the use of BoNT‐A in the management of the upper limb(s) of children with cerebral palsy (Wasiak 2004). Wasiak and colleagues recommended that further research incorporating rigorous RCT methodology be completed to investigate the effects of BoNT‐A more fully. In particular, there was no clear evidence that BoNT‐A reduced muscle tone and spasticity in the upper limb of children with cerebral palsy. Nor was there evidence that a reduction of muscle tone and spasticity contributed to improved performance of the arm(s) in daily activities or enhanced participation.
Since Wasiak and colleagues (2004) review, use of BoNT‐A has become routine clinical practice in many paediatric treatment centres worldwide and the evidence base has expanded. For example, in Australia injection of BoNTA (Botox® only) is now an approved and government funded intervention for moderate to severe spasticity of the upper limbs of children with cerebral palsy, two to 17 years of age inclusive (Medicare Australia 2009). This updated review evaluates the existing RCT evidence on the use of BoNT‐A in the upper limb of children with cerebral palsy. We aimed to determine the effectiveness of BoNT‐A injections on a range of pre‐defined outcomes consistent with the International Classification of Functioning, Disability, and Health (ICF) (WHO 2001) and to examine the safety of using BoNT‐A in this group of children.
The information contained in this review may be used by clinicians and policy‐makers to determine the use of BoNT‐A injections as an adjunct to the management of the upper limb in children with cerebral palsy and to guide future research to ensure that the evaluation of BoNT‐A as an adjunctive treatment is comprehensive and targeted.
Objectives
To assess the effectiveness of intramuscular injections of BoNT‐A or intramuscular injections of BoNT‐A and occupational therapy in the treatment of the upper limb in children with CP.
Methods
Criteria for considering studies for this review
Types of studies
All RCTs comparing BoNT‐A injection or BoNT‐A injection and occupational therapy in the upper limb(s) with other types of treatment (including no treatment or placebo) in children with cerebral palsy.
Types of participants
Children and youth between 0 and 19 years of age requiring treatment for upper limb spasticity and hypertonia secondary to cerebral palsy.
Types of interventions
Comparison of intra‐muscular BoNT‐A injections or BoNT‐A injection and occupational therapy of any dosage into any muscle group of the upper limb compared with placebo, no treatment or other interventions.
Types of outcome measures
From the studies reviewed, the following outcome measures were identified by the review authors as potential measures of effectiveness of BoNT‐A injections or BoNT‐A injection and occupational therapy in children with cerebral palsy. We have classified the measures using the ICF (WHO 2001) according to the domains they assessed. We acknowledge that some of the measures include items that assess change across multiple domains of the ICF (for example the Canadian Occupational Performance Measure and Goal Attainment Scaling).
Body functions and body structures (changes in physiological systems or in anatomical structures) Difficulties in this domain are referred to as impairments.
Grip and pinch strength (measured using a dynamometer or pinch gauge).
Spasticity (Tardieu scale or modified Tardieu scale (MTS)).
Muscle tone (Ashworth scale, modified Ashworth scale (MAS), wrist resonance frequency).
Active range of motion (AROM, plus components of Quality of Upper Extremity Skills Test (QUEST) or The Melbourne Assessment of Unilateral Upper Limb Function (The Melbourne Assessment)).
Passive range of motion (PROM).
Sensation (two‐point discrimination, Semmes‐Weinstein monofilament test).
Quality of movement (QUEST, The Melbourne Assessment).
Activity (execution of a task or action by an individual) Difficulties in these areas are referred to as activity limitations.
Bimanual performance (Assisting Hand Assessment (AHA)).
Quality of movement (components of QUEST, The Melbourne Assessment).
Occupational Performance (Assessment of Motor and Process Skills (AMPS))
Individual goal identification, rating and scaling (Canadian Occupational Performance Measure (COPM), Goal Attainment Scaling (GAS)).
Fine motor skills (Peabody Developmental Motor Scale ‐ Fine Motor (PDMS‐FM)).
Activities of Daily Living Skills (Pediatric Evaluation of Disability Inventory (PEDI), Functional Independence Measure for Children (WeeFIM)).
Participation (involvement in a life situation) Difficulties in these areas are referred to as participation restrictions.
None identified in the studies reviewed.
Outcomes independent of ICF domains
Health related quality of life and self perceived competence
Child Health Questionnaire (CHQ).
Pediatric Quality of Life (PedsQL).
The Self Perception Profile for Children.
The Pictorial Scale of Perceived Competence and Social Acceptance for Young Children.
Search methods for identification of studies
The following terms were used to search the Cochrane Controlled Trials Register/CENTRAL (The Cochrane Library, Issue 3, 2008), MEDLINE (1966 to August Week 1 2008), EMBASE (1980 to 2008 Week 28) and CINAHL (1982 to August Week 1 2008). In addition, reference lists of articles and conference abstracts were examined. No language restrictions applied. The following search strategy was modified for each of the databases.
MEDLINE (Ovid)
1.Botulinum toxins/ 2.Botulinum toxin type a/ 3.Botulin$.tw 4.Botox.tw 5.Dysport.tw 6.Or/1‐5 7.Muscle spasticity/ 8.Spastic$. tw 9.Cerebral Palsy 10.Cerebral pals$.tw 11.Hemiplegia/ 12.Quadriplegia/ 13.Hemiplegi$.tw 14.Monoplegi$.tw 15.Triplegi$. tw 16.Quadriplegi$. tw 17.Or/7‐16 18.6 and 17.
Data collection and analysis
Selection of trials: Two reviewers (BH, MW) independently reviewed titles and abstracts of articles retrieved using the aforementioned search strategy. Trials that clearly failed to meet the inclusion criteria were not reviewed further. Those that could not be excluded were retrieved and reviewed in full‐text by the two reviewers. In all instances, differences of opinion were resolved by discussion. Those that met criteria were retrieved and reviewed in detail.
Quality of trials:
Two reviewers (BH, MW) independently assessed the methodological quality of the included trials using the PEDro scale (Maher 2003) with discrepancies resolved by discussion (Table 7). A point is given for each of the following (maximum score = 10): random allocation; allocation concealment; prognostic similarity at baseline; subject blinding; therapist blinding; assessor blinding; greater than 85% follow up of one key outcome; intention to treat analysis; between group statistical comparison of at least one key outcome, and reporting of point estimates and measures of variability of at least one key outcome.
1. Methodological quality ‐ PEDro scale.
| Scale Item | Corry | Fehlings | Boyd | Greaves | Speth | Lowe | Russo | Wallen | Kawamurra | Koman |
| 1) Subjects were randomly allocated to groups | Yes | Yes | Yes | Yes | Yes | Yes | Yes | Yes | Yes | Yes |
| 2) Allocation was concealed | Yes | No | Yes | Yes | Yes | Yes | Yes | Yes | Yes | Yes |
| 3) The groups were similar at baseline regarding the most important prognostic indicators | No | Yes | Yes | Yes | Yes | Yes | Yes | Yes | Yes | Yes |
| 4) There was blinding of all subjects | Yes | No | No | No | No | No | No | No | Yes | Yes |
| 5) There was blinding of all therapists who administered the therapy | No | No | Yes | No | No | No | Yes | No | Yes | Yes |
| 6) There was blinding of all assessors who measure at least one key outcome | Yes | Yes | Yes | No | Yes | Yes | Yes | Yes | Yes | Yes |
| 7) Measures of at least one key outcome were obtained from more than 85% of the subjects initially allocated to groups | Yes | Yes | Yes | Yes | Yes | Yes | Yes | Yes | Yes | Yes |
| 8) All subjects for whom outcome measures were available received the treatment or control condition as allocated or, where this was not the case, data for at least one key outcome was analysed by "intention to treat" | Yes | No | Yes | Yes | Yes | Yes | Yes | Yes | No | Yes |
| 9) The results of between‐group statistical comparisons are reported for at least one key outcome | Yes | Yes | Yes | Yes | Yes | Yes | Yes | Yes | Yes | Yes |
| 10) The study provides both point measures and measures of variability for at least one key outcome | Yes | Yes | Yes | Yes | Yes | Yes | Yes | Yes | Yes | Yes |
| Total Score | 8/10 | 6/10 | 9/10 | 7/10 | 8/10 | 8/10 | 9/10 | 8/10 | 9/10 | 10/10 |
| Internal Validity | 6/8 | 4/8 | 7/8 | 5/8 | 7/8 | 6/8 | 7/8 | 6/8 | 7/8 | 8/8 |
| Statistical Reporting Score | 2/2 | 2/2 | 2/2 | 2/2 | 2/2 | 2/2 | 2/2 | 2/2 | 2/2 | 2/2 |
When data were entered into RevMan 5.0.15 software, allocation concealment was classified as adequate (A), unclear (B), inadequate (C), or was not used (D), as another criterion to assess validity. Additional information was requested from the authors of trials to clarify missing information related to the methodology.
Data extraction: Two reviewers (BH, MW) independently extracted data from the trials using a paper pro forma. Disagreements were resolved by discussion. Additional data were sought from all authors of included papers to allow analyses on an intention‐to‐treat basis. This included mean change scores and standard deviation of the mean change for each outcome.
Analysis: We followed the Cochrane Handbook preferred method for handling continuous variables (Deeks 2005) and as advised by the Movement Disorders Review Group. This involved contacting all primary authors to obtain mean change scores and the standard deviation of the mean difference, as opposed to comparing means and standard deviations at specific time points. This approach controls for differences in baseline performance which is a critical issue for research including small sample sizes and heterogeneous populations such as children with cerebral palsy. When appropriate data were available from valid and reliable measures, data from individual studies were entered into RevMan 5.0.15 to obtain confidence intervals and to have available when further studies are published. Pooled effects were calculated using a fixed effect model across trials using the same outcome in similar populations. The Corry 1997 trial reported median change and range data precluding it from meta‐analysis as the desired mean change date were unable to be provided.
Where possible, muscle tone measured using either the Ashworth (Speth 2005; Lowe 2006; Corry 1997) or modified Ashworth scales (Greaves 2004Russo 2007; Wallen 2007; Fehlings 2000) were analysed using the method for ordinal response categories described by Whitehead 1994. Beta coefficients were pre‐calculated using Stata 10.0 SE (College Station, TX) using a generic inverse variance method and entered into RevMan 5.0.15.
Primary information from Boyd 2004 was not made available. Hence, we calculated the following outcomes from information presented in two tables in the original dissertation.
1. Standard deviation and variance from baseline to subsequent weeks in the intervention group versus the control group. Boyd 2004 presented point estimates and 95% confidence intervals for this result. The standard deviation was calculated using the relationship SD = SQRT(30) * (UL ‐ PE) / (1.96), where PE is the point estimate and UL is the 95% confidence limit. The variance was calculated as the square of the standard deviation.
2. Standard deviation and variance for results from baseline to subsequent weeks in the intervention group. Boyd 2004 presented point estimates and 95% confidence intervals for this result and methods used above were used.
3. Point estimate, variance, standard deviation for results from baseline to subsequent weeks in the control group. These results were not provided by Boyd 2004. However, using information estimated from (1) and (2) above, the following information may be derived using well‐established statistical relationships.
a. Point estimate: PE(2) ‐ PE(1)
b. Variance: Var(2) ‐ Var(1)
c. Standard deviation: Square root of the variance
Outcome measures with limited known validity or reliability were excluded from analysis. These included Pediatric Motor Activity Log, Actual Amount of Use Test, block transfer task (speed) and block tower task (dexterity) from Boyd 2004, Upper Extremity Rating Scale, the Melbourne Assessment (when it was modified by the trial authors), Impact on Family Scale from Koman 2007, pain scale and subjective function and cosmesis rating from Russo 2007, subjective judgements by child and parent from Speth 2005 and the parent questionnaire from Wallen 2007.
Due to the large number of domains included in the CHQ, the number of existing analyses undertaken in the review and the failure to identify treatment effects, only summary data from the CHQ (Boyd 2004, Wallen 2007, Russo 2007) have been provided in tabular form in Table 8 , Table 9 and Table 10. Similarly, only summary data from the Self Perception Profile for Children, Pictorial Scale of Perceived Competence and Social Acceptance and PEDsQL (Russo 2007) are provided (Table 11; Table 12; Table 13).
2. Russo ‐ Child Health Questionnaire (change from baseline).
| 3 months | 6 months | |||||
| Domain | BoNTA & OT | OT ALONE | SMD & 95% CI | BoNTA & OT | OT ALONE | SMD & 95% CI |
| Physical functioning | 2.12(21.04) | 5.56(23.76) | ‐3.44(‐16.84,9.96) | 3.70(28.30) | 1.26 (24.66) | 2.44(‐13.46,18.34) |
| Role ‐ emotional | 1.06(37.34) | 3.18(27.92) | ‐2.12(‐21.90,17.66) | 3.18(36.54) | ‐1.06 (33.68) | 4.24(‐16.79,25.27) |
| Role ‐ physical | 5.00(14.41) | 3.18(31.89) | 1.82(‐12.86,16.50) | 5.00(37.89) | 4.76(35.80) | 0.24(‐21.78,22.26) |
| Bodily pain | 8.57(18.52) | 1.36(22.10) | 7.21(‐4.96,19.38) | 10.00(15.81) | 3.18(29.18) | 6.82(‐7.12,20.76) |
| General behaviour | 1.67(15.84) | 5.68(14.58) | ‐4.01(‐13.12,5.10) | 6.67(15.18) | 4.09(15.63) | 2.58(‐6.63,11.79) |
| Mental health | 2.62(11.79) | 2.27(13.34) | 0.35(‐7.17,7.87) | 0.24(12.79) | 1.59(15.54) | ‐1.35(‐9.84,7.14) |
| Self‐esteem | 1.67(17.70) | 5.49(19.81) | ‐3.82(‐15.04,7.40) | 0.42(15.47) | 10.80(16.20) | ‐10.38(‐19.85,‐0.91) |
| General health | ‐4.52(14.22) | ‐0.46(20.35) | ‐4.06(‐14.51,6.39) | ‐0.71(16.98) | ‐1.59(20.95) | 0.88(‐10.49,12.25) |
| Parent impact ‐ emotional | ‐0.40(20.15) | 3.03(25.40) | ‐3.43(‐17.10,10.24) | 2.78(26.66) | ‐2.27(24.69) | 5.05(‐10.33,20.43) |
| Parent impact ‐ time | 1.06(20.76) | 11.62(25.31) | ‐10.56(‐24.37,3.25) | ‐0.53(18.42) | 7.58(31.12) | ‐8.11(‐23.31,7.09) |
| Family activities | ‐0.40(14.90) | 7.58(22.88) | ‐7.98(‐19.47,3.51) | 3.37(14.71) | 2.65(21.77) | 0.72(‐10.34,11.78) |
| Family cohesion | 2.86(17.79) | 5.68(22.11) | ‐2.82(‐14.79,9.15) | 0.95(21.25) | 12.27(19.62) | ‐11.32(‐23.56,0.92) |
Mean change and SD of mean change
3. Boyd ‐ Child Health Questionnaire (change from baseline).
| 3 Weeks | 3 months | |||||
| Domain | BoNTA & OT | OT ALONE | SMD & 95% CI | BoNTA & OT | OT ALONE | SMD & 95% CI |
| Physical functioning | 3.7(23.72) | 4.8(41.0) | ‐1.10(‐25.07,22.87) | 1.86(23.71) | ‐6.24(?) | ? |
| Role ‐ emotional | 8.12(23.12) | ‐0.68(39.41) | 8.80(‐14.32,31.92) | 9.6(23.12) | 0.74(39.41) | 8.86(‐14.26,31.98) |
| Role ‐ physical | 2.01(30.04) | ‐12.79(51.95) | 14.80(‐15.57,45.17) | 3.1(30.63) | ‐11.6(52.14) | 14.70(‐15.90,45.30) |
| Bodily pain | 6.66(18.86) | ‐4.64(32.51) | 11.24(‐7.78,30.26) | 2.66(18.86) | ‐7.94(32.67) | 10.60(‐8.49,29.69) |
| General behaviour | 5.29(10.52) | 3.37(18.13) | 11.30(‐7.72,30.32) | 2.88(10.57) | 3.16(18.24) | 10.60(‐8.49,29.69) |
| Mental health | 8.55(10.03) | 5.33(17.44) | 3.22(‐6.96,13.40) | 8.0(10.09) | 8.66(17.33) | ‐0.66(‐10.81,9.49) |
| Self‐esteem | 7.22(16.93) | 0.62(29.11) | 6.60(‐10.44,23.64) | 7.88(16.96) | 1.18(29.09) | 6.70(‐10.34,23.74) |
| General health | ‐1.33(13.64) | 0.33(23.83) | ‐1.36(‐17.50,14.78) | ‐5.0(13.67) | ‐3.0(23.76) | ‐2.00(‐15.87,11.87) |
| Parent impact ‐ emotional | 8.05(21.44) | 1.55(39.08) | 6.50(‐16.06,29.06) | 8.61(21.46) | 3.21(38.59) | 5.40(‐16.95,27.75) |
| Parent impact ‐ time | 2.96(17.71) | 0.06(30.60) | 2.90(‐14.99,20.79) | 2.96(17.71) | 10.36(30.76) | ‐7.40(‐25.36,10.56) |
| Family activities | 6.05(14.88) | 1.94(25.61) | 4.11(‐10.88,19.10) | 8.33(14.80) | ‐1.67(25.69) | 10.00(‐5.00,25.00) |
| Family cohesion | ‐2.28(19.74) | ‐1.43(33.45) | ‐0.85(‐20.51,18.81) | ‐4.10(19.06) | ‐5.19(32.88) | 1.09(‐22.65,24.83) |
Mean change and SD of mean change
4. Wallen ‐ Child Health Questionnaire (change from baseline).
| 3 months | 6 months | |||||
| Domain | BoNTA&OT | OT ALONE | SMD & 95% CI | BoNTA&OT | OTALONE | SMD & 95% CI |
| Physical functioning | ‐3.1(33.9) | 2.1(37.4) | ‐5.2(30.86,20.46) | 10.0(41.3) | 13.2(18.6) | ‐3.2(‐23.93,17.53) |
| Role ‐ emotional | 15.2(21.7) | ‐13.3(32.9) | 28.50(9.2,47.80) | 7.0(37.3) | ‐3.5(29.5) | 10.50(‐11.64,32.64) |
| Role ‐ physical | 9.2(38.8) | ‐17.8(42.9) | 27.0(‐0.58,54.58) | 5.0(33.8) | 1.0(37.7) | 4.00(‐19.68,27.68) |
| Bodily pain | 6.0(19.8) | ‐1.3(22.60) | 7.30(‐7.04,21.64) | 3.9(17.5) | 5.3(36.8) | ‐1.31(‐21.61,18.99) |
| General behaviour | 5.1(11.9) | ‐0.3(12.3) | 7.30(‐7.04,21.64) | 4.0(8.3) | 1.3(11.1) | 2.70(‐4.04,9.44) |
| Mental health | 0.5(12.2) | 0.3(11.9) | 0.20(‐7.85,8.25) | 4.5(11.6) | ‐0.3(10.2) | 4.80(‐2.33,11.93) |
| Self‐esteem | 0.8(12.7) | ‐4.7(6.7) | 5.50(‐1.02,12.02) | ‐3.7(9.3) | ‐3.1(11.8) | ‐0.60(‐7.89,6.69) |
| General health | ‐3.9(9.4) | 4.3(14.3) | ‐8.20(‐16.53,0.13) | ‐2.5(11.8) | 2.0(13.9) | ‐4.50(‐13.05,4.05) |
| Parent impact‐emotional | 4.6(27.2) | 3.3(27.8) | 1.30(‐17.14,19.74) | ‐1.2(29.7) | ‐0.5(31.0) | ‐0.70(‐20.70,19.30) |
| Parent impact‐time | 5.6(19.9) | ‐5.2(24.4) | 10.80(‐4.32,25.92) | 10.6(25.1) | 1.4(25.9) | 9.20(‐7.59,25.99) |
| Family activities | 1.3(9.8) | ‐1.4(18.9) | 2.70(‐7.78,13.18) | 2.7(17.1) | 6.0(22.3) | ‐3.30(‐16.55,9.95) |
| Family cohesion | ‐0.5(14.3) | 4.0(21.4) | ‐4.50(17.01,8.01) | 2.2(14.2) | 5.6(21.0) | ‐3.40(‐15.43,8.63) |
5. Russo ‐ Self Perception Profile (change from baseline).
| 3 months | 6 months | |||||
| SELF‐CONCEPT | BoNTA & OT | OT alone | SMD & 95% CI | BoNTA & OT | OT alone | SMD & 95% CI |
| Scholastic Competence | ‐0.08(0.77) | 0.04(0.53) | ‐0.12(‐0.70,0.46) | 0.10(0.75) | 0.07(0.60) | 0.03(‐0.56,0.62) |
| Social Acceptance | ‐0.38(0.58) | 0.08(0.46) | 0.46(‐0.91,‐0.01) | 0.04(0.46) | ‐0.05(0.49) | 0.09(‐0.31,0.49) |
| Athletic Competence | ‐0.08(0.32) | 0.01(0.57) | ‐0.09(‐0.46,0.28) | 0.25(0.52) | 0.10(0.51) | 0.15(‐0.29,0.59) |
| Physical Appearance | 0.08(0.41) | 0.19(0.35) | ‐0.11(‐0.44,0.22) | 0.15(0.26) | ‐0.01(0.83) | 0.16(‐0.32,0.64) |
| Behavioral Competence | 0.23(0.43) | ‐0.24(0.60) | 0.47(0.04,0.90) | 0.08(0.40) | ‐0.04(0.60) | 0.12(‐0.30,0.54) |
| Global Self‐worth | 0.15(0.45) | ‐0.17(0.58) | 0.32(‐0.11,0.75) | 0.23(0.56) | ‐0.07(0.50) | 0.30(‐0.16,0.76) |
6. Russo ‐ The Pictorial Scale of Perceived Competence and Social Acceptance for Young Children (change from baseline).
| 3 months | 6 months | |||||
| SELF‐CONCEPT | BoNTA & OT | OT alone | SMD & 95% CI | BoNTA & OT | OT alone | SMD & 95% CI |
| Cognitive Competence | 0.31(1.07) | 0.60(1.15) | ‐0.29(‐1.25,0.67) | 0.90(0.96) | 0.53(1.34) | 0.37(‐0.66,1.40) |
| Physical Competence | ‐0.25(1.06) | 0.43(0.71) | ‐0.68(‐1.44,0.08) | 0.17(1.24) | 0.27(0.43) | ‐0.10(‐0.86,0.66) |
| Peer Acceptance | ‐0.67(0.89) | 0.57(0.38) | ‐1.24(‐1.80,‐0.68) | ‐0.07(0.63) | 0.37(0.63) | ‐0.44(‐0.98,‐0.10) |
| Maternal Acceptance | ‐1.08(0.50) | 0.70(0.56) | ‐1.78(‐2.24,‐1.32) | ‐0.83(0.95) | 0.67(0.70) | ‐1.50(‐2.21,‐0.79) |
7. Russo ‐ Pediatric Quality of Life Inventory (change from baseline).
| 3 months | 6 months | |||||
|
BoNTA&OT n = 15 |
OTALONE n = 17 |
SMD & 95% CI |
BoNTA&OT n = 15 |
OTALONE n = 19 |
SMD & 95% CI | |
| Parent | 3.39(13.37) | 3.43(8.58) | ‐0.04(‐7.94,7.86) | 4.11(12.24) | 4.01(10) | 0.10(‐7.55,7.75) |
| Child | ‐7.12(15.6) | 1.3(15.66) | ‐8.42(‐19.27,2.43) | 1.61(18.81) | 5.66(13.93) | ‐4.05(‐15.44,7.34) |
The design of the included studies enabled 6 separate comparisons to be undertaken. These included:
1) BoNT‐A vs. placebo/no treatment (n = 3)
Corry 1997; Koman 2007; Wallen 2007
2) BoNT‐A and OT vs. OT alone (n = 7)
Fehlings 2000; Boyd 2004; Greaves 2004; Speth 2005; Lowe 2006; Russo 2007; Wallen 2007
3) BoNT‐A and OT vs. BoNT‐A alone (n = 1)
4) BoNT‐A and OT vs. no treatment (n=1)
5) BoNT‐A vs. OT alone (n = 1)
6) Low dose BoNT‐A vs. High dose BoNT‐A (n = 1)
Summary of evidence
Using GRADEprofiler (GradePro) and the GRADE guidelines (Higgins 2008), key results of the six comparisons have been included in Table 1 to Table 6. Through consensus, two reviewers selected the following seven outcomes for inclusion in the tables: MTS (elbow flexors); MTS (wrist flexors); QUEST; Melbourne Assessment; GAS and COPM (performance and satisfaction). A follow‐up period of three months was selected as this was considered to be a time of peak effect for BoNT‐A. Two reviewers (BH, CI) independently assessed the methodological quality of the body of evidence using the GRADE guidelines (Higgins 2008) with discrepancies resolved by discussion.
Results
Description of studies
A total of 327 references were identified. Independent scrutiny of the titles and abstracts identified 45 potentially relevant articles. Of the 45, 35 were excluded because they were a mixture of abstracts of non RCTs, case reports, case series, narrative reviews or included children with diagnoses other than cerebral palsy. The remaining 10 trials met the inclusion criteria and formed the basis of this review. These studies are described in full in the Characteristics of included studies table. Methods for delivery of BoNT‐A for each study have been detailed in Table 14.
8. Injection Details.
| Study | BoNT‐A Type | Dilution | Maximum total dose |
Dosage Muscle Selection |
Muscle Localisation | Type of Anasthesia |
| Corry | Botox & Dysport | 100U/1.0ml (Botox): 2.5ml/500U (Dysport). | 250U(Botox) 400U(Dysport) |
Botox: 4‐7U/kg Dysport: 8‐9U/kg Muscles injected included biceps, brachialis, flexor carpi radialis and ulnaris, flexor digitorum superficialis and profundus, flexor pollicis longus, flexor pollicis brevis, adductor pollicis and pronator teres. |
Muscle palpation | Topical anaesthetic. General anaesthesia (1 child). |
| Fehlings | Botox | 100U/1.0ml | NA | 2 to 6U/kg Muscles included biceps, volar forearm muscles including pronator teres, flexor carpi ulnaris, adductor pollicis longus or finger flexors. Identification of injection site based on 2 investigator observations during reach‐and‐grasp activities of the involved hand. |
Palpation and anatomical knowledge. | Topical anaesthetic |
| Boyd | Botox | 100U/1.0ml | 250U | 0.5 U/kg Botox per muscle in the adductor or flexor pollicis; to 1.5 U/kg per muscle into flexor carpi ulnaris and flexor carpi radialis and 2‐3 U/kg into Biceps. Mean total dose of 4.8 U/kg per muscle (+/‐ 1.5U). Muscles included biceps, pronator teres, flexor carpi ulnaris, flexor carpi radialis, adductor pollicis, Flexor pollicis longus and flexor digitorum profundus. Identification based on observation of overactivity of muscles on a range of functional tasks including gross and fine grasp, transport, release and supination. |
Electrical stimulation | General anaesthesia |
| Greaves | Botox | 100U/1.0ml | 300U | 0.4ml (above elbow) and 0.2ml (below elbow) and 0.1ml (muscles of the thumb). Total dose 4U/kg to 16U/kg per muscle . Muscles included biceps, pronator teres, flexor carpi radialis and ulnaris, flexor digitorum profundus and superficialis, flexor pollicis longus and adductor pollicis. Muscles selected through assessment by OT and paediatrician and discussion with parents, community therapists and orthopaedic surgeon. |
EMG & electrical stimulation | General anaesthesia or sedation |
| Speth | Botox | 50U/1.0ml | 400 U | 2 to 3 U/kg body weight (above elbow) and 1 to 2 U/kg (forearm). Limit of 50U at any one site. Muscles injected included adductor pollicis, flexor pollicis brevis, flexor carpi ulnaris, pronator teres, brachioradialis and biceps. Identification based on clinical examination. Spastic hypertonia of a specific muscle disturbing strength and/or function in daily activities in relation to the Zancolli grade and House score were criteria to inject. |
Electrical stimulation | General anaesthesia |
| Lowe | Botox | 200U/1.0ml | 220 U | 0.5 to 2.0 U/kg/muscle. Muscles injected included elbow flexors, pronators, wrist‐flexors, wrist extensors, finger flexors, thumb adductors, opponens and flexors. Number of muscles injected, mean = 6 (SD 1.05). Identification based on the degree of spasticity (baseline Ashworth score) of at least 2), estimated effect on functional abilities and parental preference of likely arm posture if BoNT‐A was effective. |
EMG & electrical stimulation | Combinations of agents to achieve sedation and analgesia. Single session day procedure. |
| Russo | Botox | 100U/1.0ml | 300 U | Mean of 8 U/kg body weight with a minimum of 5.0U/kg and a maximum dose of 11.6 U/kg. All muscles across the upper limb were injected if tone was affected (tone (MAS) = 0 the muscle was not injected; 1 to 1+/4 half the maximal dose was injected; 2 to 3/4 the maximal dose was injected). |
Electrical stimulation. | General anaesthesia |
| Wallen | Botox | 100U/1.0ml | 410U | 2.0 to 13 U/kg (mean=8.1 U/kg, SD=2.9) of body weight per muscle Muscles injected included pectoralis complex, latissimus dorsi, teres major, pronator quadratus and teres, brachioradialis, biceps, brachialis, flexor carpi radialis and ulnaris, flexor digitorum profundus and superficialis, lumbricals, flexor pollicis longus, adductor pollicis and opponens pollicis). Identification based on clinical examination. Muscle groups that provided moderate to significant resistance to PROM ‐ contributing to abnormal limb positioning or movement and inhibiting functional goal achievement ‐ were identified and injected. |
Electrical stimulation | Sedation and local anaesthesia. |
| Kawamurra | Botox | 100U/0.5‐2.0ml | 50 U per site | Maximum
volume per site = 0.5ml. Maximum
total dose = 50U per site. Identification based on a grasp activity using the involved hand/arm. For persistent elbow flexion during reach, the biceps and/or brachioradialis was injected; if wrist and/or fingers were flexed, the common flexor origin was injected; if forearm was pronated, the pronator teres was injected. If thumb was adducted, the adductor pollicis was injected; if the thumb was opposed, the opponens pollicis was injected. |
Muscle palpation | Topical anaesthesia |
| Koman* | Botox | 10‐100U/1.0ml | 300 U | 0.25 U/kg in adductor pollicis, or 1st dorsal interosseus; 0.5 U/kg into flexor pollicis longus; 1.0 U/kg per muscle into flexor digitorum superficialis, flexor digitorum profundus, pronator teres, flexor carpi ulnaris, flexor carpi radialis and 1‐2.0 U/kg into Bicep brachii. Identification based on observation of each participants' individual spasticity pattern. |
Palpation & ultrasound guidance | Topical anaesthetic spray and/or sedation |
* this study used multiple injection sessions.
Corry 1997 compared the effects of intramuscular BoNT‐A alone(either Botox 90‐250U at 4‐7U/kg: Dilution 100U/1.0ml or Dysport 160‐400U at 8‐9U/kg: Dysport 500U/2.5ml saline) with normal saline in the hemiplegic upper limb of 14 children with cerebral palsy (5 male, 9 female; mean age 9 years). Outcome measures included AROM, muscle tone and quality of movement obtained at baseline, two weeks and 12 weeks post‐injection.
Fehlings 2000 compared the use of BoNT‐A(Botox 2 to 6U/kg: Dilution 100U/1.0ml saline)and occupational therapy with occupational therapy alone in 29 children aged 2 to 10 years diagnosed with hemiplegic cerebral palsy and moderate spasticity of the elbow, wrist or thumb. Primary outcome measures obtained at baseline, 1, 3 and 6 months included: QUEST; PEDI; grip strength; MAS for elbow, wrist and thumb extension and forearm supination; and PROM for elbow and wrist extension, supination and thumb abduction.
Boyd 2004 compared BoNT‐A(Botox 100‐250U at 0.5U/kg‐3U/kg: Dilution 100U/1.0ml saline)and occupational therapy with occupational therapy alone in 30 children with hemiplegic cerebral palsy aged 5 to 15 years. Outcomes at baseline, 3 weeks and 3 months included: functional Magnetic Resonance Imaging (fMRI); wrist resonance frequency; grip strength; The Melbourne Assessment; PEDI ‐ self care domain; COPM; GAS; Australian Authorised Adaptation of the CHQ; Pediatric Motor Activity Log (PMAL); Actual Amount of Use Test (AAUT); block transfer task (speed) and block tower task (dexterity). Severity of cerebral palsy was classified according to Gross Motor Function Classification System and the Bimanual Fine Motor Function scale.
Greaves 2004 compared BoNT‐A(Botox maximum total dose 300U/kg at 4U/kg‐16U/kg: Dilution 100U/1.0ml saline)and occupational therapy with occupational therapy alone in 20 children with hemiplegic cerebral palsy aged 22 to 58 months. Primary outcome measures were COPM and GAS. Secondary outcomes included: PDMS‐FM; QUEST; MAS and MTS. Outcomes administered at baseline, 6 weeks (MAS, MTS and GAS only) and 4 months (all outcome measures).
Speth 2005 compared BoNT‐A(Botox maximum total dose 400U/kg at 1U/kg‐3U/kg: Dilution 50U/1.0ml saline)and occupational therapy/physiotherapy with occupational therapy/physiotherapy alone in 20 children with hemiplegic cerebral palsy aged 4 to 16 years. Outcomes administered at baseline, 2 and 6 weeks and 3, 6 and 9 months included: AROM for wrist extension; thumb abduction and supination; Ashworth scale; PEDI (full scale at baseline and 6 months, self care component at all other times); The Melbourne Assessment; and the Nine Hole Peg Test.
Lowe 2006 compared BoNT‐A(Botox 0.5U/kg‐2.0 U/kg: Dilution 200U/1ml saline)and occupational therapy with occupational therapy alone in 42 children with hemiplegic cerebral palsy aged 2 to 8 years. Primary outcome measure was the QUEST (dissociated movement and grasp domains only). Secondary outcomes included: COPM; PEDI (self care functional skills and caregiver assistance); GAS and the Ashworth scale. All outcomes were administered at baseline, 1, 3 and 6 months.
Wallen 2007 compared BoNT‐A(Botox maximum total dose 410U at 2.0U/kg‐13U/kg: Dilution 100U/1ml saline)and occupational therapy, OT alone, BoNT‐A alone and no treatment in 72 children, aged 2 to 14 years, with cerebral palsy affecting one or both upper limbs. Primary outcome measures were COPM and GAS. Secondary outcomes included: The Melbourne Assessment; QUEST; PEDI; Australian Authorised Adaptation of the CHQ; MTS and PROM. All outcomes were assessed at baseline, 2 weeks, 3 and 6 months.
Russo 2007 compared BoNT‐A(Botox 5.0U/kg‐11.6U/kg: Dilution 100U/1ml saline)and occupational therapy with occupational therapy alone in 43 children with hemiplegic cerebral palsy with a mean age of 8.6 years. Primary outcomes were the AMPS and GAS. Secondary outcomes included: MAS; MTS; The Self Perception Profile for Children; The Pictorial Scale of Perceived Competence and Social Acceptance for Young Children; PEDI ‐ Self care domain; PedsQL; CHQ; pain scale and subjective function and cosmesis rating. Outcomes were assessed at baseline, 1 (AMPS, GAS, pain scale only), 3 and 6 months.
Koman 2007 compared the effects of multi‐session BoNT‐A injections alone(Botox maximum total dose 400U/kg at 0.25‐2U/kg: Dilution 100U/1.0ml saline) with normal saline in 73 children, aged 2 to 8 years with hemiplegic, diplegic or quadriplegic cerebral palsy. Outcome measures included Upper Extremity Rating Scale, The Melbourne Assessment (modified), RAND‐36 (subscales), Impact on Family Scale and WeeFIM completed at baseline, 1, 2, 3, 5 and 6.5 weeks.
Kawamura 2007 compared the effects of low dose BoNT‐A(Botox Dilution 100U/1.0‐2.0ml saline) with a high dose BoNT‐A (Botox: Dilution 100U/0.5‐1.0ml saline) in 40 children with hemiplegic/tetraplegic CP or ABI with a mean age 6.2 years (37 CP; 3 ABI). Primary outcome measure was the QUEST. Secondary outcomes included: PEDI – Functional Skills, Self Care Domain; PROM; grip strength; MAS and GAS. Outcomes were administered at baseline, 1 and 3 months after injection.
Risk of bias in included studies
Details of allocation concealment, blinding and follow‐up are reported in the Description of studies table.
Concealment of Allocation
Of the 10 studies, seven had adequate concealment of allocation (Boyd 2004; Kawamura 2007; Koman 2007; Lowe 2006; Russo 2007; Speth 2005; Wallen 2007). The remaining three studies did not clearly state allocation concealment methods (Corry 1997; Fehlings 2000; Greaves 2004).
Blinding
Outcome Measures
Three trials (Corry 1997; Kawamura 2007; Koman 2007) used double blind, placebo controlled, randomised designs where injectors, participants and outcome assessors were blinded to group allocation. The seven remaining trials Fehlings 2000; Greaves 2004; Lowe 2006; Russo 2007; Speth 2005; Wallen 2007) were single blind designs. Of these trials, 2 used outcome assessors blinded to group allocation for all outcome measures (Fehlings 2000; Lowe 2006). The remaining 5 trials used blinded assessors for primary outcomes only or a subset of outcomes. These included: Boyd 2004 (blinded for fMRI, The Melbourne Assessment and GAS only); Greaves 2004 (PDMS‐FM; QUEST; MAS and MTS only); Russo 2007 (all outcomes except for MTS and MAS); Wallen 2007 (The Melbourne Assessment and QUEST only) and Speth 2005 (The Melbourne Assessment only).
Intervention
Masking of treating occupational therapists was reported in three of the single blind trials (Fehlings 2000; Boyd 2004; Russo 2007). The intervention provided in the remaining 4 trials was provided by therapists aware of group allocation (Greaves 2004; Wallen 2007; Lowe 2006; Speth 2005).
Follow‐up
All 10 studies had greater than 85% follow up at all time points. Three trials reported no drop‐outs (Boyd 2004; Speth 2005; Corry 1997). Six trials reported drop‐outs from both treatment (n = 6) and control groups (n=12). These include: Fehlings 2000 (n=1; BoNT‐A and occupational therapy group); Greaves 2004 (n=2; 1 BoNT‐A and occupational therapy group, 1 occupational therapy alone group); Lowe 2006 (n=1; occupational therapy alone group); Wallen 2007 (n=8; 1 BoNT‐A alone group, 3 occupational therapy alone group, 4 no treatment group); Russo 2007 (n=3; 2 BoNT‐A and occupational therapy, 1 occupational therapy alone group). The remaining trial by Kawamura 2007 reported exclusion of 1 child due to injection of a double high‐dose of BoNT‐A.
PEDro rating
Nine studies were considered to be of high quality, scoring at least seven out of 10 using the PEDro scale of methodological quality. The highest quality studies were the trials by Koman 2007 which scored 10/10, followed by Boyd 2004; Russo 2007; Kawamura 2007 9/10, Corry 1997; Speth 2005; Lowe 2006; Wallen 2007 8/10, Greaves 2004 7/10 and Fehlings 2000 6/10. All studies specified their inclusion criteria. PEDro ratings are detailed in Table 7.
Baseline Characteristics
The baseline equivalency of children between groups included in the 10 studies is detailed in Table 15. The trial by Corry 1997 did not report baseline characteristics of children and this information was not available in the unpublished material obtained for the study by Koman 2007. Speth 2005 reported a difference in side of paresis, active wrist extension and supination between groups. A 7‐point mean difference between groups on The Melbourne Assessment also favoured the BoNT‐A and occupational therapy group. Although Fehlings 2000 reported no difference between groups at baseline, differences in scores on the QUEST appear clinically significant with higher scores for the occupational therapy alone group (Treatment mean 19.2(SD15.1); Control mean 27.6(SD19.0)).
9. Baseline Characteristics.
| Study | Analysis of baseline characteristics | Outcome |
| Corry | No | Unknown |
| Fehlings | Yes |
|
| Boyd | Yes |
|
| Greaves | No |
|
| Speth | No |
|
| Lowe | Yes |
|
| Russo | Yes |
|
| Wallen | Yes |
|
| Kawamurra | Yes |
|
| Koman | Unknown | Unknown |
Baseline differences between groups at baseline were reported by Lowe 2006 (PEDI), Wallen 2007 (COPM ‐ performance), Boyd 2004 (domains of the CHQ) and Russo 2007 (athletic competency domain from The Self Perception Profile). There were no reported differences between groups at baseline in the Kawamura 2007 study.
Effects of interventions
See: Table 1; Table 2; Table 3; Table 4; Table 5; Table 6
The ten studies included in this review used a range of outcome measures across the body function/structure and activity level domains of the ICF (WHO 2001). No study used outcomes measuring change within the participation domain.
Table 16 provides details on adverse events reported for the 395 children enrolled across all included studies. One child was reported to experience a serious adverse event (Russo 2007). This child had a past history of epilepsy and was admitted to hospital for seizure management shortly after injection. The most commonly reported adverse event was excessive grip weakness (Corry 1997; Boyd 2004; Russo 2007; Kawamura 2007). Other reports included nausea, vomiting, flu symptoms, coughing, soreness at injection site, respiratory infections, headache, fainting episodes (hot day), anxiety, depression (past history), alopecia and fatigue.
10. Adverse Events.
| Study | Events |
| Corry | Weak grasp (n=2 Tx group). Temporary hypertonicity (irritable, pyrexial, poorly cooperative) at 48 hours (n=1 control (placebo) group). |
| Fehlings | Weak grasp (n=1 Tx group) lasting 2 weeks. |
| Boyd | No major adverse events reported. Three children were noted to have decreased extension of the index finger that impaired the pinch grip tasks at 3 week follow‐up (n=2 BoNT‐A group and n=1 control group). These were resolved by 6 weeks. |
| Greaves | No adverse events were reported. |
| Speth | No adverse events. |
| Lowe | There were 31 adverse events reported by 15 participants and no between‐group difference. No events were considered related to BoNT‐A by the South Eastern Sydney Area Health Service review panel. |
| Russo | There were 29 adverse events reported by 20 participants over six months. Control group ‐ 5 reported serious adverse events (2 hospital admissions for seizures in 1 child with epilepsy, 3 hospital admissions for medical reasons in another). Intervention group ‐ One significant adverse event reported in a child with epilepsy (admission to hospital after a seizure). Other minor adverse events included; feeling unwell after the anaesthetic (n=4); excessive weakness in the injected limb (n=5) which was prolonged in 2 children; headache (n=2); flu like symptom (n=1) for one day; fainting episodes (n=1) on a hot day; anxiety (n=1) and depression (n=1) in an adolescents with past histories; alopecia (n=1) and fatigue (n=1). |
| Wallen | Adverse events for each group were as follows; BoNT‐A/OT group ‐ (Frequency n = 5) including nausea and vomiting 3 days post‐injection, unsettled a few days after injection, vomiting post nitrous oxide, flu symptoms 2 weeks post‐injection, sick and coughing 2‐3 weeks post‐injection) BoNT‐A group ‐ (Frequency n = 4) including fever overnight 2 weeks post injection, sore wrist 2 weeks post‐injection, upper respiratory tract infection, sore hand at 2 days post‐injection. OT group ‐ (Frequency n = 4) including illness at 1 week, illness at 2 weeks post baseline, ill at 2 week appointment, sick with rash at 2‐4 weeks post baseline) Conrol group ‐ no adverse events. |
| Kawamurra | Weak grasp (n = 3 low‐dose group; n = 2 high‐dose group). Each had a full recovery of their grip strength. General fatigue (n = 3 (n=2 low‐dose & n=1 high‐dose group). |
| Koman |
1st injection session (8 weeks) Whole body weakness n=1 (Tx group) 2nd injection session (20 weeks) Muscle cramps n = 1 (Tx group), excessive weakness n=1 (Tx group) 3rd injection session (26 weeks) Muscle cramps n = 1 (Tx group), excessive weakness n=1 (Tx group) |
All results reported below are from analyses undertaken by the review authors using RevMan 5.0.15 and include the standard mean difference and 95% confidence interval for each outcome. Further details related to analyses can be viewed in the Data collection and analysis section of the review.
1) Botulinum toxin‐A vs. placebo/no treatment
Is injection of Botulinum toxin‐A alone effective?
Three RCTs examined the use of BoNT‐A compared with a placebo or no treatment (Corry 1997; Wallen 2007; Koman 2007). All trials used different outcome measures so analysis of pooled data was not possible. The trial by Koman 2007 was unique due to multi‐sessional intramuscular injections of BoNT‐A where additional injections were administered at weeks 8 and 20 following initial injection to target muscles that still exhibited marked spasticity.
Corry 1997, reported medians, ranges, and p‐values derived from non‐parametric statistical analysis. This was appropriate given the small sample size (n=14), but precluded the data from analysis using RevMan 5.0.15. The changes that Corry 1997 reported therefore need to be considered with respect to the small sample size and resultant data reporting. Results have been provided in Table 17 and Table 18.
11. Corry (median change (range) in upper limb function, tone, and ROM at 2 weeks).
| Outcome | Placebo | BoNT‐A | P‐Value |
| Wrist resonant frequency (Hz²) | 1.1 (0, 1.2) | ‐3.1 (‐15.1, ‐1.1) | 0.020 |
| Elbow extension (degrees) | 0 (‐4, 8) | 5 (0, 76) | 0.026 |
| Thumb extension (score) | 0 (0, 0) | 1 (0, 3) | 0.036 |
| Thumb abduction (score) | 0 (0, 0) | 0 (‐1, 2) | NS |
| Wrist extension (degrees) | 0 (‐10, 35) | 5 (‐10, 15) | NS |
| MCP extension (degrees) | 0 (‐15, 15) | 7 (1, 28) | NS |
| Coins (transfer per minute) | 0 (‐1.3, 1) | 0.3 (‐2, 1.3) | NS |
| Elbow tone (Ashworth grade) | 0 (‐1, 0) | ‐1 (‐1, 0) | 0.010 |
| Wrist tone (Ashworth grade) | 0 (‐1, 0) | ‐1 (‐2, ‐1) | 0.003 |
| Thumb tone (Ashworth grade) | 0 (0, 0) | ‐1 (‐1, 0) | NS |
| Grasp and release (score) | 0 (0, 1) | 1 (0, 3) | NS |
12. Corry (median change (range) in upper limb function, tone, and ROM at 12 weeks).
| Outcome | Placebo | BoNT‐A | P‐Value |
| Wrist resonant frequency (Hz²) | 0.9 (0, 8.7) | ‐1.5 (‐12.2, 0.4) | 0.045 |
| Elbow extension (degrees) | 0 (‐7, 2) | 4 (‐3, 73) | NS |
| Thumb extension (score) | 0 (0, ‐1) | 0 (‐1, 3) | NS |
| Thumb abduction (score) | 0 (0, 1) | 0 (0, 1) | NS |
| Wrist extension (degrees) | 0 (‐14, 32) | 2 (‐20, 13) | NS |
| MCP extension (degrees) | 2 (‐25, 15) | 3 (‐9, 13) | NS |
| Coins (transfer per minute) | 0 (‐7.6, 0.3) | 1 (‐1.7, 6.7) | NS |
| Elbow tone (Ashworth grade) | 0 (0, 1) | ‐1 (0, ‐1) | NS |
| Wrist tone (Ashworth grade) | 0 (0, 1) | ‐1 (0, ‐1) | 0.010 |
| Thumb tone (Ashworth grade) | 0 (0, 1) | ‐1 (‐2, 0) | NS |
| Grasp and release (score) | 0 (‐1, 0) | 1 (0, 4) | 0.010 |
Koman 2007 provided unpublished data for all outcomes however, due to the unknown psychometric properties of the Upper Extremity Rating Scale, Impact on Family Scale and the modification of the The Melbourne Assessment, only data from the WeeFIM were entered and analysed in RevMan 5.0.15.
Body function and body structure level outcomes
Using the MTS, a treatment effect was identified at 2 weeks post‐injection for a reduction in spasticity in the elbow flexors (weighted mean difference (WMD) ‐50.63, 95% CI ‐80.56 to ‐20.70) when compared with no treatment in the Wallen 2007 trial, however this did not persist at the 3 or 6‐month follow‐up (Analysis 1.1). There was no treatment effect for other muscle groups at any follow‐up for reduction of spasticity or improved PROM (Analysis 1.2 to Analysis 1.5). Corry 1997 reported wrist resonance frequency improved significantly more in the BoNT‐A group than the placebo group at 2 weeks and 12 weeks (Table 17; Table 18). At two weeks, elbow extension, and elbow and wrist tone (Ashworth scale) also improved significantly more in the BoNT‐A group than the placebo group (Table 17; Table 18).
1.1. Analysis.

Comparison 1 BoNT‐A vs Placebo/no treatment, Outcome 1 modified Tardieu scale ‐ Elbow flexors (change from baseline R2‐R1).
1.2. Analysis.

Comparison 1 BoNT‐A vs Placebo/no treatment, Outcome 2 modified Tardieu scale ‐ Forearm pronators (change from baseline R2‐R1).
1.5. Analysis.

Comparison 1 BoNT‐A vs Placebo/no treatment, Outcome 5 Forearm supination PROM (change from baseline).
Activity level outcomes
When compared with no treatment, BoNT‐A alone was not found to improve upper limb quality of movement of children using the QUEST (Analysis 1.6) or the The Melbourne Assessment (Analysis 1.7) at 2 weeks, 3 months or 6 months (Wallen 2007). The global functional status of children measured using both the PEDI (Wallen 2007) and WeeFIM (Koman 2007) was not significantly different between groups at any time point (Analysis 1.8 to Analysis 1.12).
1.6. Analysis.

Comparison 1 BoNT‐A vs Placebo/no treatment, Outcome 6 QUEST scores (change from baseline).
1.7. Analysis.

Comparison 1 BoNT‐A vs Placebo/no treatment, Outcome 7 Melbourne Assessment (change from baseline).
1.8. Analysis.

Comparison 1 BoNT‐A vs Placebo/no treatment, Outcome 8 PEDI raw scores ‐ Functional Skills (change from baseline).
1.12. Analysis.

Comparison 1 BoNT‐A vs Placebo/no treatment, Outcome 12 WeeFIM (change from baseline).
Occupational performance and individual goal setting outcomes
Children receiving BoNT‐A alone (Wallen 2007) achieved significantly greater activity‐level goal attainment at 3 months (WMD 9.24, 95% CI 0.92 to 17.56) persisting at 6 months post‐injection (WMD 12.83, 95% CI 3.73 to 21.93) (Analysis 1.13). Using the COPM, parents in the study by Wallen 2007 also rated their child’s occupational performance in nominated activities higher (WMD 1.10, 95% CI 0.19 to 2.01) and were more satisfied with the performance (WMD 1.40, 95% CI 0.22 to 2.58) at 3 months after injection of BoNT‐A (Analysis 1.14; Analysis 1.15). The treatment effect however, did not persist at the 6‐month follow‐up. The GAS and COPM were not administered by blinded raters.
1.13. Analysis.

Comparison 1 BoNT‐A vs Placebo/no treatment, Outcome 13 Goal Attainment Scaling (change from baseline).
1.14. Analysis.

Comparison 1 BoNT‐A vs Placebo/no treatment, Outcome 14 COPM Performance (change from baseline).
1.15. Analysis.
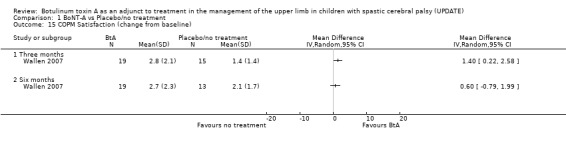
Comparison 1 BoNT‐A vs Placebo/no treatment, Outcome 15 COPM Satisfaction (change from baseline).
2) Botulinum toxin‐A and occupational therapy vs. occupational therapy alone
Does Botulinum toxin‐A enhance the effects of occupational therapy?
Seven RCT’s examined the effects of a combination of BoNT‐A and occupational therapy compared with occupational therapy alone (Wallen 2007; Greaves 2004; Fehlings 2000; Speth 2005; Russo 2007; Lowe 2006; Boyd 2004). Two of these studies remain unpublished at the time of review (Greaves 2004, Boyd 2004). All authors were contacted and additional unpublished data including mean change and the standard deviation of the mean change were requested and kindly provided in most cases. Additional data from Boyd 2004 were not made available, however data reported in the original dissertation was converted by reviewers to obtain the required mean change and the standard deviation of the mean change data for the occupational therapy alone group (see Data collection and analysis for description of conversion).
The majority of studies used a standard dilution of 100U Botox® /1.0ml saline. Speth 2005 however, used low concentration of 50U Botox® /1.0ml saline whilst Lowe 2006 used a high concentration of 200U Botox® /1ml saline.
Pooling of data across studies for specific time periods was possible for some outcomes including the MAS (elbow flexors, wrist flexors), PROM (elbow extension, forearm supination), grip strength, The Melbourne Assessment, QUEST, PEDI, GAS and the COPM.
Body function and Body structure level outcomes
When compared with occupational therapy alone, data from Wallen 2007 at the 2‐week and 3‐month time points identified that BoNT‐A and occupational therapy significantly reduces spasticity (as measured using the MTS) in the elbow flexors (Analysis 2.2), forearm pronators (Analysis 2.3) and wrist flexors (Analysis 2.4) of the upper limb. This reduction persisted at the 6 month follow‐up for elbow flexors and forearm pronators but not for wrist flexors. Despite this result from Wallen 2007, data from Greaves 2004 demonstrated no treatment effect for any of these outcomes except for elbow flexors at 6‐weeks. A trend however, favouring BoNT‐A and occupational therapy, was evident (See Analysis 2.1 to Analysis 2.4). Data for wrist resonance frequency (Analysis 2.9; Analysis 2.10), along with 2‐point discrimination (assessment of tactile sensibility) (Analysis 2.19) measured by Boyd 2004 did not demonstrate a treatment effect at 3 weeks or 3 month post‐injection.
2.2. Analysis.

Comparison 2 BoNT‐A/OT vs OT only, Outcome 2 modified Tardieu scale ‐ elbow flexors (change from baseline R2‐R1).
2.3. Analysis.

Comparison 2 BoNT‐A/OT vs OT only, Outcome 3 modified Tardieu scale ‐ forearm pronators (change from baseline R2‐R1).
2.4. Analysis.

Comparison 2 BoNT‐A/OT vs OT only, Outcome 4 modified Tardieu scale ‐ wrist flexors (change from baseline R2‐R1).
2.1. Analysis.

Comparison 2 BoNT‐A/OT vs OT only, Outcome 1 modified Tardieu scale ‐ shoulder adductors (change from baseline R2‐R1).
2.9. Analysis.

Comparison 2 BoNT‐A/OT vs OT only, Outcome 9 Wrist resonance Frequency 2Nm (change from baseline).
2.10. Analysis.

Comparison 2 BoNT‐A/OT vs OT only, Outcome 10 Wrist resonance Frequency 4Nm (change from baseline).
2.19. Analysis.

Comparison 2 BoNT‐A/OT vs OT only, Outcome 19 2‐point discrimination( change from baseline).
Two trials used the Ashworth scale to measure change in muscle tone (passive resistance to stretch) (Lowe 2006, Speth 2005). Due to limitations and difficulties obtaining these data, analysis in RevMan 5.0.15 was not possible. Four additional trials used the MAS (Fehlings 2000, Greaves 2004, Russo 2007, Wallen 2007), however data from Fehlings 2000 were not available. Analysis of pooled data demonstrated a treatment effect for BoNT‐A and occupational therapy for elbow flexors (2 weeks, 3 and 6 months), wrist flexors (2 weeks, 3 and 6 months) and forearm pronators (2 and 6 weeks) (Analysis 2.5 to Analysis 2.8). No effect was demonstrated in the shoulder adductors measured by Greaves 2004 (Analysis 2.5).
2.5. Analysis.

Comparison 2 BoNT‐A/OT vs OT only, Outcome 5 modified Ashworth scale ‐ shoulder adductors.
2.8. Analysis.

Comparison 2 BoNT‐A/OT vs OT only, Outcome 8 modified Ashworth scale ‐ wrist flexors.
Analysis of Speth 2005 data demonstrated occupational therapy alone increased active range of forearm supination compared with a combination of BoNT‐A and occupational therapy (Analysis 2.11). A treatment effect was present both immediately after injection and at the 9‐month follow‐up for occupational therapy alone. Data for active range of wrist extension from specific time points, did not indicate a treatment effect at any one point at follow‐up. There were no treatment effects for active thumb abduction (Analysis 2.13) or PROM for elbow extension, forearm supination, wrist extension or thumb abduction at any time points (Analysis 2.14 to Analysis 2.17).
2.11. Analysis.

Comparison 2 BoNT‐A/OT vs OT only, Outcome 11 Supination AROM (change from baseline).
2.13. Analysis.

Comparison 2 BoNT‐A/OT vs OT only, Outcome 13 Thumb abduction AROM (change from baseline).
2.14. Analysis.

Comparison 2 BoNT‐A/OT vs OT only, Outcome 14 Elbow extension PROM (change from baseline).
2.17. Analysis.

Comparison 2 BoNT‐A/OT vs OT only, Outcome 17 Palmar thumb abduction PROM (change from baseline).
Grip strength was measured by Boyd 2004 and Fehlings 2000. Data from individual trials indicated no difference between groups at any time point however, pooled analysis of data at 1 and 3 months demonstrated a trend for maintenance of grip strength for occupational therapy alone (Analysis 2.18).
2.18. Analysis.

Comparison 2 BoNT‐A/OT vs OT only, Outcome 18 Grip strength (change from baseline).
Activity level outcomes
Despite a positive trend favouring the BoNT‐A and occupational therapy at the initial post injection and 3‐month follow‐up, pooled data for The Melbourne Assessment obtained from Speth 2005, Wallen 2007 and Boyd 2004 were not significant (Analysis 2.20). Individually, Boyd 2004 was the only trial to demonstrate a treatment effect which was present at the initial post‐injection follow‐up (WMD 10.10, 95% CI 0.89 to 19.31) and sustained at the 3 month follow‐up (WMD 12.90, 95% CI 3.19 to 22.61).
2.20. Analysis.

Comparison 2 BoNT‐A/OT vs OT only, Outcome 20 Melbourne Assessment (change from baseline).
The outcomes demonstrated by The Melbourne Assessment differ from those obtained on the QUEST (Fehlings 2000; Lowe 2006; Wallen 2007; Greaves 2004), where a significant pooled effect for BoNT‐A and occupational therapy groups were demonstrated at the initial post‐injection assessment and the 3 month follow‐up (Analysis 2.21). Specific time point data for the QUEST however demonstrates extensive variability in the range of effects across the 4 studies. Data from both Wallen 2007 and Greaves 2004 did not demonstrate a treatment effect at any time point. For Wallen 2007 this is most likely due to the extremely small group sizes (n=7 and n = 7). Despite a small sample size however, Greaves 2004 demonstrated a greater mean change in the OT alone group (6.07 (SD 6.18) compared with the BoNT‐A and occupational therapy group (1.65 (SD 6.51) at 4 months. Lowe 2006 (WMD 9.15, 95% CI 4.62 to 13.68) (grasp and dissociated movement domains only) and Fehlings 2000 (WMD 11.60, 95% CI 3.25 to 19.95) both demonstrated treatment effects for BoNT‐A and occupational therapy groups at the initial‐post injection follow‐up period on the QUEST. This effect only persisted for Lowe 2006 at 3 months however no treatment effect for either study was demonstrated at 6 months which was beyond the chemo‐denervation effect for BoNT‐A (i.e. 3 to 6 months). Data from other activity level outcomes including AMPS, PDMS‐FM and PEDI did not demonstrate any treatment effect at any time point (see Analysis 2.22 to Analysis 2.29).
2.21. Analysis.

Comparison 2 BoNT‐A/OT vs OT only, Outcome 21 QUEST scores (change from baseline).
2.22. Analysis.

Comparison 2 BoNT‐A/OT vs OT only, Outcome 22 AMPS ‐ Motor (change from baseline).
2.29. Analysis.

Comparison 2 BoNT‐A/OT vs OT only, Outcome 29 PEDI scaled score ‐ Caregiver assistance (change from baseline).
Occupational performance and individual goal setting outcomes
Analysis of pooled data from studies using the GAS (Boyd 2004; Lowe 2006; Russo 2007; Wallen 2007; Greaves 2004), demonstrated a treatment effect for the BoNT‐A and occupational therapy at the initial post injection follow‐up that persisted at the 3 and 4 month follow‐up but not 6 month follow‐up (Analysis 2.30). Lowe 2006 was the only study to demonstrate a treatment effect at all time points that persisted at the 6‐month follow‐up for GAS devised by parents (WMD 9.15, 95% CI 3.55 to 14.75) and therapists (WMD 10.62, 95% CI 0.78 to 20.46).
2.30. Analysis.

Comparison 2 BoNT‐A/OT vs OT only, Outcome 30 Goal Attainment Scaling (change from baseline) ‐ Parent.
The COPM rates parents' perception of important occupational performance difficulties their children are experiencing and their current level of satisfaction with their performance. This outcome was used by Lowe 2006; Wallen 2007 and Greaves 2004. Data from time points shows a small but significant treatment effect for the COPM ‐ Performance at initial post injection follow‐up and 3 months (Analysis 2.32). This did not persist at the 6 month follow‐up. Individually, the study by Lowe 2006 was the only study to demonstrate a treatment effect at specific time points. Similarly, Lowe 2006 was also the only study to demonstrate a treatment effect for COPM ‐ Satisfaction, for BoNT‐A and occupational therapy at 3 months (Analysis 2.33).
2.32. Analysis.

Comparison 2 BoNT‐A/OT vs OT only, Outcome 32 COPM Performance (change from baseline).
2.33. Analysis.

Comparison 2 BoNT‐A/OT vs OT only, Outcome 33 COPM Satisfaction (change from baseline).
Health related quality of life and self‐perception outcomes
Three studies examined differences in quality of life and self‐perception between children receiving BoNT‐A and occupational therapy compared with those receiving occupational therapy alone (Boyd 2004; Wallen 2007; Russo 2007). Summary data are reported in Table 8 to Table 13.
The three studies used the parent‐report version of the Australian Authorised Adaptation of the CHQ (Aust CHQ PF50 Waters 1999), a measure of functional health and well‐being. This 50‐item questionnaire consists of 12 separate scales. Data from Boyd 2004 at 3 weeks showed no difference between groups on any CHQ scale. All three studies collected CHQ data at 3 months but only Wallen 2007 demonstrated a statistically significant but clinically unimportant effect in favour of the BoNT‐A and occupational therapy group for the Role/Social Limitations ‐ Emotional/Behavioural scale. Russo 2007 and Wallen 2007 collected data at 6‐months and they found no differences between groups.
Russo 2007 used the PedsQL (PedsQL 4.0, Varni 2001) to measure health related quality of life. There were no differences between groups in either the parent or the child report versions at 3 or 6 months (Table 13).
Russo 2007 measured self‐perception and self‐worth at 3 and 6 months using The Self‐Perception Profile for Children (for children ≥ 8 years) Harter 1985 (Table 11) or The Pictorial Scale of Perceived Competence and Social Acceptance for Young Children (up to 7 years of age) Harter and Pike 1984 (Table 12). The Self‐Perception Profile for Children evaluates scholastic competence, social acceptance, athletic competence, physical appearance, behavioural competence, and global self‐worth. The Pictorial Scale for younger children evaluates the child's perception of his or her cognitive competence, physical competence, peer acceptance and maternal acceptance. Both measures use 4‐point rating scales with a score of 4 indicating higher self‐perception/competence. When interpreting these results we considered a change of 0.4 (or 10%) of the scale at the lower limit of the confidence intervals to be clinically important.
At 3 months, younger children participating in occupational therapy alone reported better peer and maternal acceptance (statistically significant and clinically important) than the BoNT‐A and occupational therapy group (Table 12. The older children participating in occupational therapy alone reported more social acceptance than the BoNT‐A and occupational therapy group, whereas the latter group perceived higher behavioural competence. The results for the older children were statistically significant but not clinically important. There were no differences between treatment groups at 6 months for the older or younger children.
3) Botulinum toxin‐A and occupational therapy vs. Botulinum toxin‐A alone
Does occupational therapy enhance the effects of Botulinum toxin‐A?
Only one study by Wallen 2007 addresses this comparison.
Body function and body structure level outcomes
As measured using the MTS, there was a greater reduction in muscle spasticity in the pronators and wrist flexors in the BoNT‐A and occupational therapy group compared with BoNT‐A alone group, but not for elbow flexors (Analysis 3.1 to Analysis 3.3). There were no differences between groups in passive elbow extension at any time (Analysis 3.4). There was a trend for the BoNT‐A and occupational therapy group to have increased passive supination at 2 weeks and 3 months which did not reach significance (Analysis 3.5).
3.1. Analysis.

Comparison 3 BoNT‐A/OT vs BoNT‐A only, Outcome 1 modified Tardieu scale ‐ Elbow Flexors (change from baseline).
3.3. Analysis.

Comparison 3 BoNT‐A/OT vs BoNT‐A only, Outcome 3 modified Tardieu scale ‐ Wrist Flexors (change from baseline).
3.4. Analysis.

Comparison 3 BoNT‐A/OT vs BoNT‐A only, Outcome 4 Elbow extension PROM (change from baseline).
3.5. Analysis.

Comparison 3 BoNT‐A/OT vs BoNT‐A only, Outcome 5 Forearm supination PROM (change from baseline).
Activity level outcomes
There were no differences between groups for the Melbourne Assessment or QUEST at specific time points (Analysis 3.6; Analysis 3.7). There were also no differences between groups at any time points on the PEDI. Mean within‐group change scores for both functional skills and caregiver assistance were small (Analysis 3.8 to Analysis 3.11).
3.6. Analysis.

Comparison 3 BoNT‐A/OT vs BoNT‐A only, Outcome 6 Melbourne Assesment (change from baseline).
3.7. Analysis.

Comparison 3 BoNT‐A/OT vs BoNT‐A only, Outcome 7 QUEST scores (change from baseline).
3.8. Analysis.

Comparison 3 BoNT‐A/OT vs BoNT‐A only, Outcome 8 PEDI raw score ‐ Functional Skills (change from baseline).
3.11. Analysis.

Comparison 3 BoNT‐A/OT vs BoNT‐A only, Outcome 11 PEDI scaled score ‐ Caregiver Assistance (change from baseline).
Occupational performance and individual goal setting outcomes
Children receiving BoNT‐A and occupational therapy achieved greater activity‐level goal attainment at 3 months compared with BoNT‐A alone, however this did not persist at 6 months post‐injection (Analysis 3.12). There was no difference between groups at any time point on the COPM Performance or Satisfaction scales (Analysis 3.13; Analysis 3.14).
3.12. Analysis.

Comparison 3 BoNT‐A/OT vs BoNT‐A only, Outcome 12 Goal Attainment Scaling (change from baseline).
3.13. Analysis.

Comparison 3 BoNT‐A/OT vs BoNT‐A only, Outcome 13 COPM Performance (change from baseline).
3.14. Analysis.

Comparison 3 BoNT‐A/OT vs BoNT‐A only, Outcome 14 COPM Satisfaction (change from baseline).
4) Botulinum toxin‐A and occupational therapy vs. no treatment
Is Botulinum toxin‐A and occupational therapy more effective than no treatment?
Only one study by Wallen 2007 addresses this comparison.
Body function and body structure level outcomes
At 1 month, the BoNT‐A and occupational therapy group demonstrated a greater reduction in muscle spasticity in the elbow and wrist flexors compared with the no treatment group. At 3 months, muscle spasticity reduction was also greater in the BoNT‐A and occupational therapy group for forearm pronators and wrist flexors but not elbow flexors. These differences did not persist at 6 months post‐injection (Analysis 4.1 to Analysis 4.3). There were no differences between groups in passive elbow extension or forearm supination at any time (Analysis 4.4; Analysis 4.5).
4.1. Analysis.

Comparison 4 BoNT‐A/OT vs Placebo/no treatment, Outcome 1 modified Tardieu scale ‐ Elbow flexors (change from baseline R2‐R1).
4.3. Analysis.

Comparison 4 BoNT‐A/OT vs Placebo/no treatment, Outcome 3 modified Tardieu scale ‐ Wrist flexors (change form baseline R2‐R1).
4.4. Analysis.

Comparison 4 BoNT‐A/OT vs Placebo/no treatment, Outcome 4 Elbow extension PROM (change from baseline).
4.5. Analysis.

Comparison 4 BoNT‐A/OT vs Placebo/no treatment, Outcome 5 Forearm supination PROM (change from baseline).
Activity level outcomes
Compared with no treatment, the BoNT‐A and occupational therapy group demonstrated greater improvement on the QUEST at 3 months (WMD 16.0 95% CI 0.50 to 31.50) but not at 1 or 6 months (Analysis 4.6). Despite a trend favouring the BoNT‐A and occupational therapy group there were no differences between groups at any time point for the Melbourne Assessment (Analysis 4.7). There were no differences between groups at any time points on the PEDI (Analysis 4.8 to Analysis 4.11).
4.6. Analysis.

Comparison 4 BoNT‐A/OT vs Placebo/no treatment, Outcome 6 QUEST scores (change from baseline).
4.7. Analysis.

Comparison 4 BoNT‐A/OT vs Placebo/no treatment, Outcome 7 Melbourne Assessment (change from baseline).
4.8. Analysis.

Comparison 4 BoNT‐A/OT vs Placebo/no treatment, Outcome 8 PEDI raw scores ‐ Functional Skills (change from baseline).
4.11. Analysis.

Comparison 4 BoNT‐A/OT vs Placebo/no treatment, Outcome 11 PEDI scaled scores ‐ Caregiver Assistance (change from baseline).
Occupational performance and individual goal setting outcomes
Children receiving BoNT‐A and occupational therapy achieved significantly greater activity‐level goal attainment at 3 months (WMD 17.93, 95% CI 10.17 to 25.69) persisting at 6 months post‐injection (WMD 10.96, 95% CI 2.20 to 19.72) (Analysis 4.12). Using the COPM, also rated their child’s occupational performance in nominated activities higher and were more satisfied with the performance at both 3 and 6 months (Analysis 4.13; Analysis 4.14).
4.12. Analysis.

Comparison 4 BoNT‐A/OT vs Placebo/no treatment, Outcome 12 Goal Attainment Scaling (change from baseline).
4.13. Analysis.

Comparison 4 BoNT‐A/OT vs Placebo/no treatment, Outcome 13 COPM Performance (change from baseline).
4.14. Analysis.

Comparison 4 BoNT‐A/OT vs Placebo/no treatment, Outcome 14 COPM Satisfaction (change from baseline).
5) Botulinum toxin‐A vs. occupational therapy
Is Botulinum toxin‐A alone more effective than occupational therapy or standard treatment?
Again, only a single study addressed this comparison (Wallen 2007).
Body function and body structure level outcomes
The BoNT‐A alone group had a greater reduction in elbow flexor and forearm pronator spasticity at 2 weeks and 3 months (Analysis 5.1; Analysis 5.2). There was no difference between groups for change in wrist flexor spasticity (Analysis 5.3). There were also no differences between groups on passive elbow extension or supination (Analysis 5.4; Analysis 5.5).
5.1. Analysis.

Comparison 5 BoNT‐A only vs OT only, Outcome 1 modified Tardieu scale ‐ Elbow Flexors (change from baseline).
5.2. Analysis.

Comparison 5 BoNT‐A only vs OT only, Outcome 2 modified Tardieu scale ‐ Pronators (change from baseline).
5.3. Analysis.

Comparison 5 BoNT‐A only vs OT only, Outcome 3 modified Tardieu scale ‐ Wrist flexors (change from baseline).
5.4. Analysis.
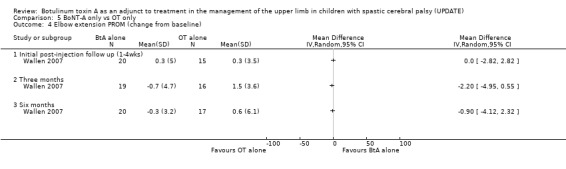
Comparison 5 BoNT‐A only vs OT only, Outcome 4 Elbow extension PROM (change from baseline).
5.5. Analysis.

Comparison 5 BoNT‐A only vs OT only, Outcome 5 Forearm supination PROM (change from baseline).
Activity level outcomes, occupational performance and individual goal setting outcomes
There were no differences between groups at any time points for the The Melbourne Assessment, QUEST, PEDI, GAS or COPM (see Analyses Analysis 5.6 to Analysis 5.14).
5.6. Analysis.

Comparison 5 BoNT‐A only vs OT only, Outcome 6 Melbourne Assesment (change from baseline).
5.14. Analysis.

Comparison 5 BoNT‐A only vs OT only, Outcome 14 COPM Satisfaction (change from baseline).
6) Low dose BoNT‐A vs. High dose BoNT‐A
Is the effect of BoNT‐A dose dependent?
One trial by Kawamura 2007 compared the effects of low dose BoNT‐A (Botox Dilution 100U/1.0‐2.0ml saline) with a high dose BoNT‐A (Botox: Dilution 100U/0.5‐1.0ml saline). This is the only study evaluating dose dependent response to BoNT‐A, therefore combined analyses of pooled data using RevMan 5.0.15 were not possible. Data for QUEST, PEDI (functional skills ‐ self care domain) and grip strength were provided by the authors and entered into RevMan 5.0.15 to examine trends.
Body function and body structure level outcomes
There was no difference between groups for grip strength. Standard deviations at both 4 weeks and 3 months indicated large variability in individual responses to BoNT‐A in both groups (Analysis 6.1).
6.1. Analysis.

Comparison 6 High dose BoNT‐A vs Low dose BoNT‐A, Outcome 1 Grip Strength (change from baseline).
Activity level outcomes
There were no differences between groups on the QUEST at the initial post‐injection follow‐up or 3 months post‐injection (Analysis 6.2). The low dose group had increased PEDI ‐ Functional skills (self care domain) scores than the high dose group at 3 months but not immediately post‐injection (Analysis 6.3).
6.2. Analysis.

Comparison 6 High dose BoNT‐A vs Low dose BoNT‐A, Outcome 2 QUEST scores (change from baseline).
6.3. Analysis.
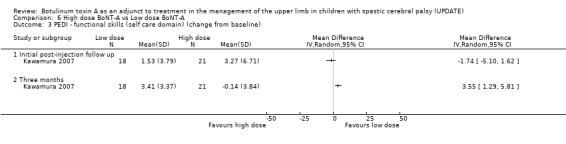
Comparison 6 High dose BoNT‐A vs Low dose BoNT‐A, Outcome 3 PEDI ‐ functional skills (self care domain) (change from baseline).
Discussion
Efficacy of upper limb BoNT‐A injections
In our 2004 Cochrane review, data from two small RCTs (Fehlings 2000; Corry 1997) provided insufficient evidence to support or refute the use of intramuscular injections of BoNT‐A as an adjunct to managing the upper limb in children with cerebral palsy (Wasiak, Hoare, Wallen 2004). This update included 10 RCTs predominantly of high quality (Maher 2003) and provided high level evidence (GradePro) that BoNT‐A in the upper limb in combination with occupational therapy improves outcomes at both the body function/structure and activity level domains of the ICF (WHO 2001) in comparison to occupational therapy alone. Additionally, there was moderate to high level evidence that BoNT‐A in combination with occupational therapy improves outcomes in comparison to BoNT‐A alone or no treatment/placebo. When compared with placebo or no treatment, there is moderate evidence that BoNT‐A alone is not effective. No trial used outcomes measuring change within the participation domain.
Effects on body function and body structure level outcomes
For children with cerebral palsy with more severe upper limb impairment (i.e. Manual Ability Classification System level IV to V) (Eliasson 2006), injection of BoNT‐A can be used to manage symptoms and reduce carer burden. Aims for treatment using BoNT‐A for these children may include: reducing muscle spasticity and muscle tone; increasing range of motion; improving agonist‐antagonist balance; delaying the need for and/or complimenting orthopaedic procedures; improving tolerance to splinting; maintaining hygiene and skin integrity; improving cosmesis; managing pain and preventing long‐term deformity (Hoare and Russo 2009). In all children who receive BoNT‐A injection, assessment must include impairment‐level domains. These measures assist in identifying muscles with significant spasticity interfering with function and, alongside activity level assessment measures, provide information for muscle selection, dosage and the direction of post‐injection therapy (Hoare and Russo 2009). In this review, data from two studies provided strong evidence that a combination of BoNT‐A and occupational therapy was more effective than occupational therapy alone in reducing spasticity in the elbow flexor, forearm pronator and wrist flexor muscles of the upper limb (Greaves 2004, Wallen 2007). Additionally, using the modified Ashworth Scale (MAS), the studies by Greaves 2004, Russo 2007 and Wallen 2007 also demonstrated strong evidence that BoNT‐A and occupational therapy reduced muscle tone in the same muscles groups.
All muscles have an optimal length at which they produce maximal contraction. Any shortening or lengthening of the muscle fibers of the long flexors and extensors of the fingers and thumb could decrease their ability to contract maximally and impair function (Richards 1996). In this review, no improvement was found in passive ROM for any treatment group. This result is expected given the criteria adopted by all included studies where children with fixed contracture or significant fixed contracture were excluded (i.e. children had full PROM before treatment). Therefore, change in passive range of movement is not expected.
Speth 2005, the only study to evaluate isolated active ROM for individual joints, demonstrated no treatment effect for wrist extension or thumb abduction. In children with spastic hemiplegic cerebral palsy, increased spasticity and muscle tone in pronator muscles changes the spatial relationships among the extrinsic muscles of their upper limb. The result reported by Speth 2005, where active supination improved significantly more in the occupational therapy alone group than the BoNT‐A and occupational therapy group, may be related to very low baseline scores in three children in the occupational therapy alone group who made substantial improvements. The result however, raises the question of potential limitation of BoNT‐A to effect change in active supination due to antagonist weakness, changes in the mechanical‐elastic properties and shortening of the pronator teres and pronator quadratus muscles in early life. As the hand is actively moved to a pronated position the radius rotates over the ulna and flexor digitorum superficialis, flexor digitorum profundus, and flexor pollicis longus wrap around the radius as it rotates. The resulting change in length of these muscles may alter the length‐tension relationship and impair their ability to achieve maximum contraction, to act as a synergist, or to act as a stabiliser of the wrist joint (Richards 1996). On the basis of these potential changes in the length‐tension relationships, one would predict a weaker grip in the pronated position than in the supinated position and further impairment of the functional effectiveness of the affected hand. The importance of active supination for grip strength and wrist stabilisation warrants further investigation of the impact of stretching/splinting the forearm pronator muscles following injection of BoNT‐A in children with cerebral palsy (Delgado 2006).
Maximising effects on body function and body structure level outcomes
Stretching
In 2004, Gracies reported strong evidence that BoNTA uptake is enhanced in nerve terminals that are most active, whether hyperactivity is induced by nerve stimulation or increased voluntary activity. Gracies 2004 reports on studies in adults which demonstrated greater improvement after BoNT‐A injection when performing periodic stimulation of the injected muscle and its antagonist for three 30‐minute sessions a day during the 3 days after injection (Hesse 1995, Hesse 1998). Since these studies, a preliminary report relating to animal muscle has demonstrated that either active or passive manipulation of a muscle for 20 minutes immediately post‐injection increases the efficacy of BoNT‐A in the injected muscle and reduces diffusion to distant muscles (Minamoto 2007). Based on these findings, further investigation of the effect of immediate active or passive stretch following upper limb injection in children with cerebral palsy is warranted. Longtitudinal studies are also required to explore the effects of BoNT‐A on muscle morphology and growth (Gough 2009).
Splinting
The scientific support for static splinting in cerebral palsy stems from a small number of animal studies reporting that muscles increase in length when immobilised in a lengthened position (Williams 1984, Williams 1988) and few studies in adult lower limb literature suggesting a prolonged low load stretch is more effective than brief stretches in preventing contracture (Light 1984, Steffen 1995). For children with cerebral palsy, evidence that static splinting maintains the mechanical‐elastic properties of muscle is weak (Pin 2006). One study has suggested a splint should be worn for a minimum of 6 hours based on evidence that contractures did not occur in children with cerebral palsy when lower limb muscles were stretched for more than 6 hours (Tardieu 1988). In adults following stroke, recent studies indicating splinting for 4 weeks did not reduce wrist contracture have led to suggestions that the practice of routine upper limb splinting to prevent muscle contracture soon after adult stroke should be discontinued (Lannin 2003, Lannin 2007).
Three of the included studies in this review reported the use upper limb splints following injection of BoNT‐A (Greaves 2004, Lowe 2006, Speth 2005). Speth 2005 reported all children receiving injections were provided with a night resting splint. Boyd 2004 specifically reported that no children used splints following injection, whilst the remaining studies did not report the use of splints as a component part of their post‐injection management program (Corry 1997, Fehlings 2000, Koman 2007, Kawamura 2007, Russo 2007). Due to the limited data, there is no evidence to support or refute the effectiveness of splinting following upper limb injections of BoNT‐A. A lack of consensus remains regarding the optimal splint design (amount of wrist, digit and thumb extension) and wearing regime. A recently identified study by Kanellopoulos 2009 (awaiting classification for next update of review), should assist in providing evidence for the efficacy of upper limb splinting following upper limb injection of BoNTA.
Casting
A recent systematic review reported insufficient evidence to either support or refute the effectiveness of upper limb casting alone in children and adults (Lannin 2007a). The authors reported a lack of consensus regarding the timing of application, casting material, positioning of joint, duration of serials and number of casts to be applied (Lannin 2007a). Casting following BoNT‐A injection is clinically indicated when fixed contracture is present. The BoNT‐A aims to reduce spasticity whilst the cast is used to hold a joint in a specific position to achieve a low‐load prolonged duration muscle stretch (Hoare and Russo 2009) to reduce fixed contracture and improve passive range of movement. As all studies included in this review excluded children with fixed contracture or significant fixed contracture, casting was not used in the majority of the studies. Lowe 2006 however, reported casting as part of post‐injection therapy. No further details were provided. As a result, there is insufficient evidence to support or refute the efficacy of casting in combination with BoNT‐A.
Considerations for body function and body structure level assessment
Muscle weakness is a secondary consequence of cerebral palsy and impacts not only a child's ability to move but also their ability to participate fully in activities of daily living. Children with cerebral palsy do not move as much as their typically developing peers and as such their muscles do not just atrophy but fail to develop normally (Damiano 2008). Muscles targeted for injection of BoNT‐A in the upper limb often include the long finger flexors and thumb adductors/flexors, muscle groups required for generating grip strength. The effect of BoNT‐A weakens and potentially exposes underlying weakness in these muscles. This supposition is supported by the analysis of pooled data from Fehlings 2000 and Boyd 2004 which indicated a reduction in grip strength following BoNT‐A . This review also found excessive weakness as the most common adverse event following upper limb injection of BoNT‐A in children with cerebral palsy. These issues, coupled with Fehlings 2000 follow‐up analysis identifying grip strength as a predictor for positive response to upper limb injection of Botulinum toxin‐A (Fehlings 2000), supports establishing baseline level of grip strength prior to injection for: a) determination of appropriate muscles for injection; b) appropriate dosage used; c) monitoring of adverse events and recovery; and d) as a means of determining a child’s readiness to commence post‐injection therapy. The implementation of upper limb specific strength training programs following injection of BoNT‐A also warrants investigation.
Closer inspection of data obtained from the no treatment group from Wallen 2007 provides important information on the variability and potential measurement error of the outcome measures. Variability was particularly evident in the modified Tardieu scale (MTS), where elbow flexor and forearm pronator muscle data (Analysis 1.1 to Analysis 1.3) demonstrated large mean change (up to 17°) and extreme variability (standard deviation) in the no treatment group. This variability is consistent with recent literature relating to the poor reliability of the modified Tardieu scale for elbow flexor spasticity in children with cerebral palsy (Mackey 2004). Despite these limitations for research purposes, clinically the modified Tardieu scale is a useful tool for identifying spasticity in larger muscles (Patrick and Ada 2006; Scholtes 2006). The recently developed Australian Spasticity Assessment Scale (ASAS) however, is showing promising reliability and requires further investigation as a measure of spasticity in the upper limb in children with cerebral palsy (Williams 2008).
1.3. Analysis.

Comparison 1 BoNT‐A vs Placebo/no treatment, Outcome 3 modified Tardieu scale ‐ Wrist flexors (change form baseline R2‐R1).
Effects on activity level outcomes (hand function and quality of movement)
For children with less severe upper limb impairment (i.e. MACS level I to III) (Eliasson 2006) injection of BoNT‐A, combined with movement based therapy, targets improvement in a child's hand function. Improving hand skills , occupational performance and functional activities are often the goals for treatment (Hoare and Russo 2009). Movement based assessments such as the Melbourne Assessment and the QUEST provide valuable information on children's typical movement abilities. These observations are critical for guiding muscle selection, directing post‐injection therapy and providing objective data measuring change post‐injection. In this review, three trials used the Melbourne Assesment to evaluate quality of movement following injection of BoNT‐A (Boyd 2004; Speth 2005; Wallen 2007) and four used the QUEST (Fehlings 2000; Greaves 2004; Lowe 2006; Wallen 2007). The trial by Wallen 2007 used both measures due to the broad age range of included children (2 to 14 years). The Melbourne Assessment has been validated for children aged 5 to 15 years and QUEST for children aged 18 months to 8 years. A recent study by Klingels 2008 demonstrated a high correlation between the Melbourne Assessment and the QUEST supporting the concurrent validity of the scales. Klingels 2008 also reported the Smallest Detectable Difference (SDD) for both measures. The SDD expresses the smallest change that must take place between two measurements for the test to detect a real change with 95% probability (Beckerman 2001). The SDD was 8.99% for the Melbourne Assessment. For the QUEST total score the SDD was 7.11% and if only the hemiplegic side was measured, 13.8% SDD.
Data obtained from studies using a range of concentration and dosage schedules provided strong evidence that in young children with cerebral palsy, a combination of BoNT‐A and occupational therapy was more effective than occupational therapy alone in improving activity‐level outcomes measured using the QUEST (Fehlings 2000, Lowe 2006, Wallen 2007). The pooled mean difference at initial post‐injection follow‐up and 3 month were greater than Klingels 2008 SDD of 7.11%. A lack of ongoing effect at 6 months on the QUEST suggests appropriate children may require re‐injection into the upper limb more frequently than every 6 months. The outcomes of a 3‐phase multiple injection study by Olesch 2009, will provide valuable information on this issue.
The pooled data from the Melbourne Assessment did not demonstrate a treatment effect. The SDD was smaller than recommended by Klingels 2008 although the 95%CI for two of the trials (Boyd 2004; Wallen 2007) included the SDD suggesting further investigation is warranted. The small mean change in both groups at all time points for both these trials could indicate older children assessed using The Melbourne Assessment may not be as responsive to treatment using BoNT‐A compared with younger children who were assessed using the QUEST. From another perspective, growth curve analysis of children with cerebral palsy by Hanna 2003 using the QUEST indicated that all children, regardless of severity of impairment experienced a decline in QUEST scores from age 5 years. In this context, the improvements in children aged greater than 5 demonstrated by Wallen 2007, Speth 2005 and Boyd 2004, despite being small, may have reversed a potential decline in function. Further longitudinal intervention trials and investigation of outcome measure responsiveness are required to address this issue. The current work establishing the validity of the Melbourne Assessment for children ages 2 to 4 years will also allow investigation of the influence of age following upper limb injection of BoNT‐A (Randall 2008).
Activity level intervention following upper limb BoNT‐A
A reduction in muscle spasticity alone does not automatically confer improvements in a child's ability to use their affected upper limb(s) or perform daily tasks (Hurvitz 2000). This review has provided evidence that a combination of BoNT‐A and occupational therapy was able achieve greater change at both the body function/structure and activity levels compared with occupational therapy alone. Due to the nature of three included trials, this review was also able to investigate whether injection of Botulinum toxin‐A alone was effective (Corry 1997Koman 2007; Wallen 2007). Except for reduced spasticity in elbow flexor muscles at 2 weeks and goal attainment, data from Wallen 2007 and Koman 2007 demonstrated injection of BoNT‐A alone did not demonstrate a treatment effect on outcomes at the body function/structure or activity level domains. Thus, when compared with placebo or no treatment, there is moderate evidence that BoNT‐A alone is not effective (Analysis 1.1 to Analysis 1.15). It is therefore recommended upper limb injection of BoNT‐A always be accompanied by pre‐planned post‐injection therapeutic intervention.
Spasticity in combination with sensorimotor deficits, poor selective motor control, mirror movements and weakness result in inefficient movements significantly limiting a child's ability to perform daily tasks (Eliasson 2005; Kuhtz‐Buschbeck 2000; Vaz 2006; Hoare and Russo 2009). In theory, by reducing spasticity and muscle tone, BoNT‐A assists in establishing a balance between spastic and antagonist muscles (Hoare 2004). In conjunction with appropriate therapy techniques, the improved muscle balance aims to create a window of opportunity to facilitate improved limb mobility, development of selective motor control and improved activity performance. In this review, post‐injection therapy in studies evaluating the effects of BoNT‐A and occupational therapy varied in intensity, type and timing (Fehlings 2000; Boyd 2004; Greaves 2004; Speth 2005; Lowe 2006; Russo 2007; Wallen 2007). These trials suggest however, that intensive bursts of occupational therapy in combination with BoNT‐A produce the largest treatment effect of all upper limb interventions for children with hemiplegic CP (Sakzewski 2009). As suggested by Hoare in 2004, further work is required to establish the timing, intensity and specific type of therapy that will enhance functional outcomes and prolong the beneficial effects of BoNT‐A (Hoare 2004). Due to the heterogeneity of children with cerebral palsy, a single therapy type will not be appropriate for all children and choice of therapies will depend on age, the child and family goals, the presenting symptoms and the severity of impairments. Prior to establishment of strong evidence for post‐injection therapy intervention, clinicians are advised to adopt the paediatric upper limb hypertonicity BoNT‐A evidence‐based guidelines for intervention and after‐care (Fehlings 2009). This international consensus statement provides assistance to clinicians managing children with upper limb hypertonicity by outlining best practice in assessment, dosing, injection techniques, and adjunctive interventions, based on evidence where available and the expert opinion of the authors (Fehlings 2009).
Effects on activity level outcomes (global function and goal setting)
Considerations for assessment of global function
A fundamental principle of any evaluation of intervention is to measure change at the level targeted by the intervention. The use of intramuscular injection of BoNT‐A targets reduction of muscle spasticity. BoNT‐A, when coupled with movement‐based therapies, also targets improvement in hand skills, effectiveness of the limb(s) in performance of daily activities and functional goal achievement. Results from trials included in this review have demonstrated favourable outcomes in these areas for children receiving BoNT‐A and occupational therapy. However, can clinicians expect clinical change on global measures of function such as the PEDI or the WeeFIM within 6 months? In 2003, Iyer 2003 reported change scores of about 11% for the PEDI appear to be clinically meaningful. In this review, no trial demonstrated change of this magnitude on the PEDI. Greatest mean change 10.6% (SD 15.1) was demonstrated by Wallen 2007 in the occupational therapy alone group at 6 months. As a result, this review has provided evidence that upper limb injection of BoNT‐A, with or without occupational therapy, does not show a clinically significant improvement in global function in children with cerebral palsy as measured by the PEDI (Boyd 2004; Wallen 2007; Lowe 2006; Fehlings 2000; Speth 2005) or WeeFIM (Koman 2007). Given the nature of the intervention, and the relatively short duration of follow‐up in the included trials, the lack of change on outcomes measuring global function is not surprising. Future trials evaluating upper limb injection of BoNT‐A in children with cerebral palsy should consider the level targeted by this focal intervention and question the inclusion of global measures of function such as the PEDI and WeeFIM.
Consideration for occupational performance and goal setting outcomes
The Canadian Occupational Performance Measure (COPM) is an individualised standardised outcome measure designed to detect change in a person's occupational performance following intervention. The COPM is a useful tool for identifying and prioritising performance concerns and setting goals pre and post‐injection of BoNT‐A. Goals set using the COPM can be scaled using the Goal Attainment Scaling (GAS). This complimentary approach enables goal identification, articulation and measurement (Fehlings 2009, Cusick, 2006, Hoare and Imms 2009).
Four studies included in this review used both the COPM and GAS to measure occupational performance and goal attainment following upper limb injection of BoNT‐A (Boyd 2004, Greaves 2004, Lowe 2006, Wallen 2007). Additonally, the study by Russo 2007 independently used the GAS. These studies demonstrated that children who received BoNT‐A and occupational therapy compared with occupational therapy alone, achieved greater goal attainment. Longer‐term outcomes however, were only demonstrated in the trial by Lowe 2006 using a higher concentration of BoNT‐A (200U Botox®/1.0ml saline). Limited data from Lowe 2006 also supports improved satisfaction with performance on important daily activities identified using the COPM, however this did not extend beyond the period of chemo‐denervation (i.e. 3 to 6 months).
Despite the emerging popularity of using the GAS to evaluate change following upper limb injection of BoNT‐A, the validity and reliability of GAS is largely unknown (Steenbeek 2007). Validity has been questioned, due to dependence on the skills of therapist who set the goals, their objectivity, ability to select realistic goals and anticipate outcomes following a specific intervention (McLaren 2003). With regard to sensitivity to change, Steenbeek 2007 reports that the responsiveness of GAS "depends on whether therapists and parents select goals and levels of attainment for each goal that represent clinically important changes in future performance" (Steenbeek 2007, p. 553). This judgement is a problematic aspect of reliability for the GAS and a potential source of bias due to overestimation or underestimation of potential for change. For example, prior to intervention, scaling of goals using the GAS is undertaken by assessors in conjunction with children and their families. Subjectively, scales or levels of achievement, are determined based on the child's current performance of a task and their expected outcome. Inherently, despite attempts to enhance objectivity, such as video recording a child's baseline performance of tasks, goal setting in a single‐blind intervention trial remains a subjective process. That is, children and families awareness of treatment to be received and potential pre‐conceived expectations for outcomes can serve as a positive bias for children receiving intervention. When comparing injections of BoNT‐A alone with no treatment, the trial by Wallen 2007 demonstrated no treatment effect on body function/structure outcomes, except for a reduction in elbow flexor spasticity at 2 weeks following injection. Activity level outcomes such as the QUEST, The Melbourne Assessment, and PEDI also demonstrated no treatment effect. During the period of chemo‐denervation effect for BoNT‐A (<6 months following injection) however, parents in the BoNT‐A alone group rated their child’s performance and satisfaction of identified goals significantly higher than the no treatment group using the COPM. Using the GAS, children receiving BoNT‐A alone also achieved significantly greater activity‐level goal attainment at 3 months, persisting at 6 months post‐injection. The trial by Wallen 2007 used therapists unblinded to group assignment for COPM and GAS adminstration and scoring. Considering the small change on other activity level outcomes, results for COPM and GAS should therefore be tempered by the potential bias due to a lack of blinding.
Using data from studies evaluating change following injection of BoNT‐A in adults, Ashford 2006 suggests a change in GAS T‐score of more than 10 appears to be associated with clinically important change. However when comparing injections of BoNT‐A alone with no treatment,Wallen 2007 demonstrated that children receiving only their usual treatment in the community (no treatment group) demonstrated a group mean change of 12.87 (SD 10.25) at 3 months and 20.54 (SD 11.99) at 6 months (Analysis 1.13). Wallen 2007 reported these changes may be associated with time and development during the trial, the usual community based therapy received, or identification of clear goals on which to focus. Whatever the reason, further development of the GAS is necessary (Steenbeek 2007), particularly establishing reliability, validity and level of clinically important change in children with cerebral palsy. Meanwhile, future studies using the GAS to evaluate BoNT‐A in children with cerebral palsy should consider formalised training of those scaling goals and rating performance and reporting of such training in research papers (Cusick, 2006; Steenbeek 2007) and analysing GAS ordinal data using non‐parametric statistics (Tennant 2007).
Effects on self competence, quality of life and participation
There was some evidence that occupational therapy alone enhanced self‐perception of peer and maternal acceptance (but not other aspects of self‐competence) in very young children 3 months after intervention when compared with children who received BoNT‐A and occupational therapy (Russo 2007). There was no evidence of a difference between groups at 6 months on measures of health related quality of life (Boyd 2004; Wallen 2007; Russo 2007). As with measures of global function, given the nature of the specific intervention in these trials, and the relatively short duration of follow‐up, the lack of change on these outcomes measuring is not surprising.
Participation, defined by WHO 2001 as involvement in a life situation, is both a subjective and objective experience. Participation is influenced by both the sociocultural environments in which a child and family live and maturational and developmental changes (Coster 1998; Humphrey 2002). Patterns of participation are therefore established according to a child’s inner drive or interest in an activity, opportunities, and exposure to activities (Wiseman 2005). To date, effects on a child's participation following injection of BoNT‐A with/without occupational therapy are unknown. No study included in this review used outcomes measuring change within the participation domain. As Imms 2008 suggest, understanding the complexity of children’s participation requires an overview of what children are choosing to do, how often, and in what environments. This is much broader than simply measuring a child's capacity and performance in activities. Ultimately, injection of BoNT‐A coupled with occupational therapy in the upper limb in children with cerebral palsy targets a reduction in impairment and improvement in activity level outcomes. Effects on a child's inner drive, interest in an activity, opportunities, and exposure to activities may not be directly influenced by a reduction in impairment and improvement in activity level outcomes. Emerging evidence from an RCT evaluating two types of upper limb interventions for children with cerebral palsy provides support for this suggestion (Carlon 2009). Again, future trials should consider the level targeted by interventions and focus measurement accordingly.
Dosage, concentration and injection method
Despite more positive, longer‐term outcomes demonstrated by Lowe 2006 using higher concentration, low volume BoNT‐A (200U Botox®/1.0ml saline) in comparison to the other trials, Kawamura 2007 who specifically evaluated whether the effect of BoNT‐A was dose dependent did not provide similar support for using higher concentration of BoNT‐A. Evidence following injection of BoNT‐A in adult biceps muscles support this outcome with high‐volume (low concentration) or endplate targeted injections achieving greater neuromuscular blockade, cocontraction, spasticity reduction, and greater active range of elbow extension than low‐volume (high concentration), non‐targeted injections (Gracies 2009). The results for Kawamura 2007 suggesting a small trend for maintenance of grip strength and improved functional skills measured using PEDI for the low dose BoNT‐A group should be viewed in light of limited data obtained from a single study and inadequate muscle localisation technique using palpation (Chin 2005). Currently there is no evidence to support or refute specific injection techniques, concentration or dosage for BoNT‐A in the upper limb in children with cerebral palsy. At this time, clinicians are advised to adopt the recommendations for dosage, dilution and injection technique outlined in the paediatric upper limb hypertonicity BoNT‐A evidence‐based guidelines for intervention and after‐care (Fehlings 2009)
Safety of upper limb BoNT‐A injections
There have been several case‐reports of serious systemic adverse events following injections of BoNTA in children with cerebral palsy. Howell 2007 reported a case of a 9 year old boy with cerebral palsy (GMFCS V) who developed stridor, increased work of breathing, vomiting and decreased tolerance of oral feeds following 4 separate injection sessions of Botox® (total dose 400 units or 40U/kg on each occasion). It was hypothesised that due to pre‐existing bulbar dysfunction, this child may have had greater sensitivity to very small amounts of systemic BoNT‐A. A recommendation for lower doses such as 4–8 units/kg was suggested.
Crowner 2007 reported a 3 year old girl (11.8kg) with cerebral palsy whose breathing and swallowing function deteriorated following a single injection of Botox® (400U or 40U/kg). This child also developed severe generalized weakness 1 month post injection and experienced a decline in her functional abilities. All symptoms resolved and following this injection session, the child received injections of Botox® on 7 further occasions (Total dose 200‐300U (17.7 to 20.0U/kg). Following these injections the child's mother did not report side effects. The authors report that this case is consistent with the findings of Scott 1988 where it was reported that 40 U/kg of BoNTA intramuscular injections in monkeys causes systemic toxicity resembling botulism.
Goldstein 2006 reported symptoms of mild systemic botulism (fatigue, ptosis, diplopia, and dysarthria) in a 13‐year‐old child with cerebral palsy who received 23U/kg of Botox® into a lower extremity. The symptoms resolved within 6 weeks. Further injection of BoNTA at a lower dosage resulted in no adverse events.
In February, 2008 the United States Food and Drug Administration received reports of systemic adverse reactions to BoNTA including respiratory compromise and death following the use of botulinum toxins types A and B for both FDA‐approved and unapproved uses. The FDA suggests these adverse reactions occurred due to botulism as a result of diffusion of BoNTA from the site of injection. Doses for children ranged from 6.25 to 32 Units/kilogram (U/kg).
The U.S Food and Drug Administration recommend that until such time it has completed its review, healthcare professionals who use medicinal botulinum toxins should:
Understand that potency determinations expressed in “Units” or “U” are different among the different botulinum toxin products; clinical doses expressed in units are not comparable from one botulinum product to the next.
Be alert to the potential for systemic effects following administration of botulinum toxins such as: dysphagia, dysphonia, weakness, dyspnoea or respiratory distress.
Understand that these effects have been reported as early as one day and as late as several weeks after treatment.
Provide patients and caregivers with the information they need to identify the signs and symptoms of systemic effects after receiving an injection of a botulinum toxin.
Inform patients they should receive immediate medical attention if they have worsening or unexpected difficulty swallowing or talking, trouble breathing, or muscle weakness.
Data from the trials included in this review indicate very few adverse events for the use of BoNT‐A in the treatment of upper limb spasticity in children with cerebral palsy (Table 16). The authors of this review however, recommend clinicians continue following the guidelines outlined by the U.S Food and Drug Administration when providing intramuscular upper limb injection of BoNT‐A to children with cerebral palsy.
Authors' conclusions
Implications for practice.
This systematic review found high level evidence to support the use of BoNT‐A as an adjunct to occupational therapy in managing the upper limb in children with spastic cerebral palsy. When compared with placebo or no treatment, there is moderate evidence that BoNT‐A alone is not effective. It is recommended that intramuscular injection of BoNT‐A in the upper limb be administered using muscle localisation methods such as electrical stimulation or ultrasound guidance (Chin 2005) and always be accompanied by planned post‐injection therapeutic intervention. Injection of BoNT‐A in the upper limb at concentrations ranging from 50U Botox® /1.0ml saline to 200U Botox® /1ml saline with a dose from 0.5U to 16U/kg body weight up to a total of 220 to 410 Units (Botox®) has demonstrated safety in this population with minimal adverse events. Clinicians are advised to adopt the paediatric upper limb hypertonicity BoNT‐A evidence‐based guidelines for intervention and after‐care (Fehlings 2009).
Implications for research.
Further research into the use of BoNT‐A in the treatment of the upper limb in children with spastic cerebral palsy is required. Issues underpinning the use of BoNT‐A that warrant further investigation include, but are not limited to:
The children most likely to respond to upper limb BoNT‐A injections, for example, optimal age, severity of spasticity, degree of intellectual impairment, sensory status and amount of baseline selective motor control.
Children's manual abilities should be classified using the Manual Ability Classification System (MACS) (Eliasson 2006). Similar to the Gross Motor Function Classification System (GMFCS), this will enhance communication among clinicians and families, improve management decisions and the ability to compare and generalise results of BoNT‐A intervention (Eliasson 2006).
The most effective combination of therapies such as splinting, casting, strengthening, movement‐based or task‐specific therapies to be used with BoNT‐A.
Evaluation of the optimal timing, frequency and intensity of therapy and its relationship with BoNT‐A.
The efficacy of various muscle localisation techniques e.g. muscle palpation, EMG guidance, electrical stimulation localisation, ultrasound guidance when injecting BoNT‐A.
The impact of different types of BoNT‐A, dosage, dilution and volume schedules and delivery via few or multiple injections per muscle.
The impact of multiple injections including the timing of injections, cumulative (or otherwise) effects and the extent of biological resistance and changes in muscle structure and function following repeated injection over time.
An economic analysis of the impact of BoNT‐A injections to ensure that optimal management (which may include multiple injection sessions and therapy post‐injections) is cost effective when compared with alternative interventions.
Longer‐term studies (greater than 6 months) are required to determine the extent to which outcomes are maintained and the impact of multiple injection sessions.
Careful selection of outcomes related to the nature and goals of the intervention.
Reporting of trial should adhere to The CONSORT (Consolidated Standards of Reporting Trials) Statement, Extension to the CONSORT Statement for Randomised Trials of Non‐Pharmacologic Treatment (Boutron 2008) and the CLEAR NPT (Checklist to Evaluate a Report of a Nonpharmacological Trial) (Boutron 2005) to improve the improve the quality of reporting of RCTs.
Feedback
Feedback from original review
Summary
Darcy Fehlings Date received: 24th April 2006 Cite this comment as: http://www.cochranefeedback.com/cf/cda/citation.do?id=9511#9511 We would like to comment on the systematic review by Wasiak et al in the Cochrane Library: "Botulinum Toxin A as an Adjunct to Treatment in the Management of the Upper Limb in Children with Spastic Cerebral Palsy." We were pleased to note that our randomized controlled trial evaluating the impact of Botulinum Toxin on hand function in children with hemiplegia (one of only two articles) was included in the analysis (1). We are concerned; however, by the conclusions reached by the Cochrane reviewers. Our analyses identified a significant improvement in the Quality of Upper Extremity Skills Test (QUEST) scores in the Botox group, compared with controls. Therefore, we were disappointed and surprised to note that the Cochrane reviewers came to a different conclusion, i.e., no effect of Botox on QUEST scores. As is outlined below, we believe our analyses to be correct. The difference between the two results is readily explainable. We completed our main analysis of the QUEST scores based on analysis of changes from baseline. In contrast, the Cochrane reviewers used the raw QUEST scores in their analysis without adjusting for baseline. Our primary data are described in Table 1 and Figure 1. Figures 1 and 2 can be accessed by the following link: www.bloorviewmacmillan.on.ca/webpdfs/CochraneResponse.doc.The two least squares fitted lines in Figure 1 are clearly parallel with slopes of 0.93 and 0.85 (p = 0.75) and a combined slope of 0.90. The post treatment QUEST scores for the treatment group are generally larger than the control group. Table 1: Primary Data Set for QUEST Treatment Group (n=14): Baseline 19.2 (SD 15.1), 1 month post 32.5 (SD 17.8), Change(pre/post) 13.3 (SD 12.6) Control Group(n=15): Baseline 27.6 (SD 19.0), 1 month post 29.3 (SD 20.4), Change (pre/post)1.7 (SD 10.1) Correlation (r)between pre and post scores = 0.8 Baseline Comparability (p‐value)= 0.20 To compensate for the baseline differences in the QUEST scores between the two groups, we analysed the change in QUEST scores rather than the actual QUEST scores using a 2‐way analysis of variance of baseline, one, three and six month measurements. We found significant differences favouring the treatment group that received Botulinum toxin on the QUEST scores (F = 4.69, df 1,83, p = 0.039) with post hoc testing reaching significance at one month (p = 0.01). If we reanalyze our data using the change in QUEST scores for each group from baseline to one month only, we also find a significant difference favouring the treatment group (independent samples t test t=2.75, df 27, p = 0.01). In contrast, the Cochrane reviewers did not take baseline differences in QUEST scores into account, but rather tested for differences in QUEST scores at one month only. The ideal scientific study involves the comparison of groups that are alike in all respects except for the intervention or treatment. Ideally comparisons should be made between individuals with similar baseline scores and this might be achieved at the design stage or in the analysis by using an adjustment technique. It is also well known that even when baseline differences between the comparison groups are not statistically significant the baseline variable can still be a confounder because the size of the confounding effect is a product of the size of that baseline difference and the size of the slope that describes the relation between the baseline and post treatment measurements. Research is available to guide decision‐making when there are baseline differences in outcome measures in randomized trials. For example, statisticians have assessed the robustness of different methods, such as comparing post treatment scores only (Cochrane approach), change scores (our method), percentage change, and analysis of covariance (ANCOVA). The "best" method as defined by low type 1 and type 2 errors, is dependent on the correlation between pre and post treatment scores and the size of the baseline difference between the two groups (2‐5). In our data set, the control group had a higher baseline QUEST score, the correlation between pre and post QUEST treatment scores was r = 0.8 and the baseline QUEST difference between groups (t‐test) had a p‐value of 0.20. When the baseline value of the outcome measure in the treatment group is less than the control group and the test for baseline differences between the groups has a p‐value in the range of 0.05 to 0.25, the type 1 error for the change scores approach is appropriate at 0.057 (2). For type 2 errors, or conversely power, when the correlation of pre and post scores is high (r=0.8) the change score approach has a high statistical power of 0.86 to detect differences (2,3). Therefore, for the conditions of our data set, the analysis of change scores had both an appropriate type 1 error rate and high statistical power. An ANCOVA analysis is also appropriate for our data The adjusted difference of the QUEST means favouring the Botox group is significant at 10.79, SE 4.4, p = 0.02. In addition, the group effect was not modified by the baseline QUEST value (a group * baseline interaction term was non‐significant in an analysis of covariance model, with a p value of 0.75) indicating the treatment effect of BTA was seen across a wide range of baseline hand function. In contrast, comparing post treatment scores only (as used in the Cochrane review of our data), is not statistically efficient as the power to detect change with this method is low at 0.43 (2). An additional criticism of the approach taken by this Cochrane review is that it did not follow the Cochrane's "preferred method for handling continuous variables" as outlined in the Cochrane Handbook (www.epi.bris.ac.uk/cochrane/Information/Resources/stats3.html). The recommended approach is to calculate a weighted mean difference that assesses the mean change from baseline to follow‐up, and includes the standard deviation of the mean difference of the variable. These values are then entered into RevMan (the Cochrane collaboration software for conducting systematic reviews and meta‐analysis). This Cochrane review ignored the baseline values of our data and used one‐month post testing only. They did not request information from the authors on the standard deviation of the mean difference, nor did they attempt to estimate or impute from a combination of available information and empirical data, for example using Follmann's method (6), described in version 4.2.5 of the Cochrane Handbook for Systematic Reviews of Interventions, pp. 119‐122. Instead the authors have entered only the post mean and SD for the QUEST into RevMan. The implication of ignoring the baseline data, as the authors Wasiak et al did, is highlighted in Figure 2 (link to www.bloorviewmacmillan.on.ca/webpdfs/CochraneResponse.doc)where we have followed the Cochrane "preferred method for handling continuous variables" and entered the correct values (sample size, mean difference, and standard deviation of the mean difference in each treatment arm) of our data into RevMan. The results favouring BTA at one‐month post are highly significant with a p value of 0.006. Based on the above, we stand by our conclusion that children with hemiplegia receiving botulinum toxin and occupational therapy improve the quality of their hand function more than children receiving occupational therapy alone. We respectfully challenge the conclusions reached by the Cochrane reviewers and assert that the analyses used in our RCT were valid and based on sound statistical principles. We request that Wasiak et al revise their review and conclusions. Darcy Fehlings MD MSc FRCPC Scientist, Bloorview Research Institute, Bloorview Kids Rehab, Associate Professor, Department of Paediatrics, University of Toronto Colin Macarthur MD PhD Clinical Epidemiologist, Director, Bloorview Research Institute, Bloorview Kids Rehab, Associate Professor, Department of Paediatrics, University of Toronto Joseph Beyene PhD Scientist, Population Health Sciences, HSC Research Institute, Assistant Professor of Biostatistics, Department of Public Health Sciences, University of Toronto Wen Le MSc Biostatistician, Public Health Sciences, University of Toronto References 1) Fehlings D, Rang M, Glazier J, Steele C. An Evaluation of Botulinum‐A Toxin Injections to Improve Upper Extremity Function in Children with Hemiplegic Cerebral Palsy. Journal of Pediatrics 2000 137: 331‐337. 2) Overall J, Ashby B. Baseline Corrections in Experimental and Quasi‐experimental Clinical Trials. Neuropsychopharmacology 1991 4:273‐281. 3) Vickers A. The Use of Percentage Change from Baseline as an Outcome in a Controlled Trial is Statistically Inefficient. BMC Med Res Methodology 2001 1:6. 4) Vickers AJ, Altman DG. Analysing controlled trials with baseline and follow up measurements. British Medical Journal 2001 323: 1123‐1124. 5) Assmann S, Pocock S, Enos L, Kasten L. Subgroup analysis and other (mis)uses of baseline data in clinical trials. The Lancet 2000 355: 1064‐1069. 6) Follmann D, Elliot P, Suh I, Cutler J. Variance imputation for overviews of clinical trials with continuous response. J Clin Epidemiol 1992 45:769‐773.
Reply
Thank you very much for your detailed feedback in April 2006 regarding our Cochrane systematic review titled, "Botulinum toxin A as an adjunct to treatment in the management of the upper limb in children with spastic cerebral palsy". We sincerely apologise for the delay in our response, however your feedback has resulted in broad discussion and correspondence with many people. In summary, your feedback related to the type of data used in the analysis section of our review. We compared post treatment scores at specific time point for all outcomes including the QUEST, PEDI, PROM, grip strength and MAS. Your feedback questioned why change scores from baseline were not used. This would allow the consideration of baseline differences between groups, important in studies such as yours with a small sample size and a heterogeneous population. As you correctly report, the result obtained using change data from your study is very different to that obtained using post‐treatment scores only. This has a significant impact on the outcome and conclusion of the review. As you are aware, the Cochrane process follows explicit methods and criteria. When this particular review was being developed in 2002/2003, we made the decision to use between group mean data at specific time points. You have correctly described this in your feedback as the "Cochrane Approach" and this methodology was not challenged during the peer review process. More recently however, following extensive discussions amongst ourselves and the editorial team of the Movement Disorders Review Group, the Criticism Editor, Dr Peter Moore has advised our review team to take into account the baseline performance of children. On this advice and prompted by your feedback our review team will be using mean change data in the update of the review which is currently being undertaken. Could we impose upon you to provide us with the information we require to complete the revision of the review using change data. We will need data that includes mean change and the standard deviation of the mean change for all measures at all time points (0, 1, 3 and 6 months): QUEST, PEDI, PROM, grip strength and MAS. We would very appreciative of any information you are able to provide to us. Thank you again for your feedback. It has lead to broad ranging discussion of many important issues relating to the use of data in studies relating to children with cerebral palsy. Please do not hesitate to contact me if you have any queries regarding this letter or our review. Your assistance with this review will help us present and deliver the best available evidence to those health care professionals working in clinical practice and those who wish to pursue clinical research. Brian Hoare, Margaret Wallen and Jason Wasiak
What's new
| Date | Event | Description |
|---|---|---|
| 3 July 2009 | New search has been performed | Search strategy updated |
| 3 July 2009 | New citation required and conclusions have changed | Conclusions updated |
| 3 July 2009 | Feedback has been incorporated | Mean change from baseline data analysed |
Acknowledgements
The authors of the review would sincerely like to thank Dr Ray Russo, Dr Iona Novak, Ms Sue Greaves, Prof Kerr Graham, Dr Lucianne Speth and Prof Beth Paterson Smith who kindly provided their time and additional unpublished data to enable this review to be undertaken. Additionally, we would like to sincerely thank Prof Darcy Fehlings for her feedback and advice regarding data analysis in the initial version of this review and her time spent in obtaining additional unpublished data for two trials.
Data and analyses
Comparison 1. BoNT‐A vs Placebo/no treatment.
| Outcome or subgroup title | No. of studies | No. of participants | Statistical method | Effect size |
|---|---|---|---|---|
| 1 modified Tardieu scale ‐ Elbow flexors (change from baseline R2‐R1) | 1 | Mean Difference (IV, Random, 95% CI) | Totals not selected | |
| 1.1 Initial post‐injection follow up (1‐4wks) | 1 | Mean Difference (IV, Random, 95% CI) | 0.0 [0.0, 0.0] | |
| 1.2 Three months | 1 | Mean Difference (IV, Random, 95% CI) | 0.0 [0.0, 0.0] | |
| 1.3 Six months | 1 | Mean Difference (IV, Random, 95% CI) | 0.0 [0.0, 0.0] | |
| 2 modified Tardieu scale ‐ Forearm pronators (change from baseline R2‐R1) | 1 | Mean Difference (IV, Random, 95% CI) | Totals not selected | |
| 2.1 Initial post‐injection follow up (1‐4wks) | 1 | Mean Difference (IV, Random, 95% CI) | 0.0 [0.0, 0.0] | |
| 2.2 Three months | 1 | Mean Difference (IV, Random, 95% CI) | 0.0 [0.0, 0.0] | |
| 2.3 Six months | 1 | Mean Difference (IV, Random, 95% CI) | 0.0 [0.0, 0.0] | |
| 3 modified Tardieu scale ‐ Wrist flexors (change form baseline R2‐R1) | 1 | Mean Difference (IV, Random, 95% CI) | Totals not selected | |
| 3.1 Initial post‐injection follow up (1‐4wks) | 1 | Mean Difference (IV, Random, 95% CI) | 0.0 [0.0, 0.0] | |
| 3.2 Three months | 1 | Mean Difference (IV, Random, 95% CI) | 0.0 [0.0, 0.0] | |
| 3.3 Six months | 1 | Mean Difference (IV, Random, 95% CI) | 0.0 [0.0, 0.0] | |
| 4 Elbow extension PROM (change from baseline) | 1 | Mean Difference (IV, Random, 95% CI) | Totals not selected | |
| 4.1 Initial post‐injection follow up (1‐4wks) | 1 | Mean Difference (IV, Random, 95% CI) | 0.0 [0.0, 0.0] | |
| 4.2 Three months | 1 | Mean Difference (IV, Random, 95% CI) | 0.0 [0.0, 0.0] | |
| 4.3 Six months | 1 | Mean Difference (IV, Random, 95% CI) | 0.0 [0.0, 0.0] | |
| 5 Forearm supination PROM (change from baseline) | 1 | Mean Difference (IV, Random, 95% CI) | Totals not selected | |
| 5.1 Initial post‐injection follow up (1‐4wks) | 1 | Mean Difference (IV, Random, 95% CI) | 0.0 [0.0, 0.0] | |
| 5.2 Three months | 1 | Mean Difference (IV, Random, 95% CI) | 0.0 [0.0, 0.0] | |
| 5.3 Six months | 1 | Mean Difference (IV, Random, 95% CI) | 0.0 [0.0, 0.0] | |
| 6 QUEST scores (change from baseline) | 1 | Mean Difference (IV, Random, 95% CI) | Totals not selected | |
| 6.1 Initial post‐injection follow up (1‐4wks) | 1 | Mean Difference (IV, Random, 95% CI) | 0.0 [0.0, 0.0] | |
| 6.2 Three months | 1 | Mean Difference (IV, Random, 95% CI) | 0.0 [0.0, 0.0] | |
| 6.3 Six months | 1 | Mean Difference (IV, Random, 95% CI) | 0.0 [0.0, 0.0] | |
| 7 Melbourne Assessment (change from baseline) | 1 | Mean Difference (IV, Random, 95% CI) | Totals not selected | |
| 7.1 Initial post‐injection follow up (1‐4wks) | 1 | Mean Difference (IV, Random, 95% CI) | 0.0 [0.0, 0.0] | |
| 7.2 Three months | 1 | Mean Difference (IV, Random, 95% CI) | 0.0 [0.0, 0.0] | |
| 7.3 Six months | 1 | Mean Difference (IV, Random, 95% CI) | 0.0 [0.0, 0.0] | |
| 8 PEDI raw scores ‐ Functional Skills (change from baseline) | 1 | Mean Difference (IV, Random, 95% CI) | Totals not selected | |
| 8.1 Three months | 1 | Mean Difference (IV, Random, 95% CI) | 0.0 [0.0, 0.0] | |
| 8.2 Six months | 1 | Mean Difference (IV, Random, 95% CI) | 0.0 [0.0, 0.0] | |
| 9 PEDI scaled scores ‐ Functional Skills (change from baseline) | 1 | Mean Difference (IV, Random, 95% CI) | Totals not selected | |
| 9.1 Three months | 1 | Mean Difference (IV, Random, 95% CI) | 0.0 [0.0, 0.0] | |
| 9.2 Six months | 1 | Mean Difference (IV, Random, 95% CI) | 0.0 [0.0, 0.0] | |
| 10 PEDI raw scores ‐ Caregiver Assistance (change from baseline) | 1 | Mean Difference (IV, Random, 95% CI) | Totals not selected | |
| 10.1 Three months | 1 | Mean Difference (IV, Random, 95% CI) | 0.0 [0.0, 0.0] | |
| 10.2 Six months | 1 | Mean Difference (IV, Random, 95% CI) | 0.0 [0.0, 0.0] | |
| 11 PEDI scaled scores ‐ Caregiver Assistance (change from baseline) | 1 | Mean Difference (IV, Random, 95% CI) | Totals not selected | |
| 11.1 Three months | 1 | Mean Difference (IV, Random, 95% CI) | 0.0 [0.0, 0.0] | |
| 11.2 Six months | 1 | Mean Difference (IV, Random, 95% CI) | 0.0 [0.0, 0.0] | |
| 12 WeeFIM (change from baseline) | 1 | Mean Difference (IV, Random, 95% CI) | Totals not selected | |
| 12.1 Two months | 1 | Mean Difference (IV, Random, 95% CI) | 0.0 [0.0, 0.0] | |
| 12.2 Six months | 1 | Mean Difference (IV, Random, 95% CI) | 0.0 [0.0, 0.0] | |
| 13 Goal Attainment Scaling (change from baseline) | 1 | Mean Difference (IV, Random, 95% CI) | Totals not selected | |
| 13.1 Three months | 1 | Mean Difference (IV, Random, 95% CI) | 0.0 [0.0, 0.0] | |
| 13.2 Six months | 1 | Mean Difference (IV, Random, 95% CI) | 0.0 [0.0, 0.0] | |
| 14 COPM Performance (change from baseline) | 1 | Mean Difference (IV, Random, 95% CI) | Totals not selected | |
| 14.1 Three months | 1 | Mean Difference (IV, Random, 95% CI) | 0.0 [0.0, 0.0] | |
| 14.2 Six months | 1 | Mean Difference (IV, Random, 95% CI) | 0.0 [0.0, 0.0] | |
| 15 COPM Satisfaction (change from baseline) | 1 | Mean Difference (IV, Random, 95% CI) | Totals not selected | |
| 15.1 Three months | 1 | Mean Difference (IV, Random, 95% CI) | 0.0 [0.0, 0.0] | |
| 15.2 Six months | 1 | Mean Difference (IV, Random, 95% CI) | 0.0 [0.0, 0.0] |
1.4. Analysis.

Comparison 1 BoNT‐A vs Placebo/no treatment, Outcome 4 Elbow extension PROM (change from baseline).
1.9. Analysis.

Comparison 1 BoNT‐A vs Placebo/no treatment, Outcome 9 PEDI scaled scores ‐ Functional Skills (change from baseline).
1.10. Analysis.

Comparison 1 BoNT‐A vs Placebo/no treatment, Outcome 10 PEDI raw scores ‐ Caregiver Assistance (change from baseline).
1.11. Analysis.

Comparison 1 BoNT‐A vs Placebo/no treatment, Outcome 11 PEDI scaled scores ‐ Caregiver Assistance (change from baseline).
Comparison 2. BoNT‐A/OT vs OT only.
| Outcome or subgroup title | No. of studies | No. of participants | Statistical method | Effect size |
|---|---|---|---|---|
| 1 modified Tardieu scale ‐ shoulder adductors (change from baseline R2‐R1) | 1 | Mean Difference (IV, Random, 95% CI) | Totals not selected | |
| 1.1 Six weeks | 1 | Mean Difference (IV, Random, 95% CI) | 0.0 [0.0, 0.0] | |
| 1.2 Four months | 1 | Mean Difference (IV, Random, 95% CI) | 0.0 [0.0, 0.0] | |
| 2 modified Tardieu scale ‐ elbow flexors (change from baseline R2‐R1) | 2 | Mean Difference (IV, Random, 95% CI) | Subtotals only | |
| 2.1 Initial post‐injection follow up (1‐4wks) | 1 | 35 | Mean Difference (IV, Random, 95% CI) | ‐43.25 [‐61.66, ‐24.84] |
| 2.2 Six weeks | 1 | 18 | Mean Difference (IV, Random, 95% CI) | ‐41.07 [‐79.87, ‐2.27] |
| 2.3 Three months | 1 | 36 | Mean Difference (IV, Random, 95% CI) | ‐27.43 [‐43.09, ‐11.77] |
| 2.4 Four months | 1 | 18 | Mean Difference (IV, Random, 95% CI) | ‐43.89 [‐92.99, 5.21] |
| 2.5 Six months | 1 | 37 | Mean Difference (IV, Random, 95% CI) | ‐20.34 [‐36.48, ‐4.20] |
| 3 modified Tardieu scale ‐ forearm pronators (change from baseline R2‐R1) | 2 | Mean Difference (IV, Random, 95% CI) | Subtotals only | |
| 3.1 Initial post‐injection follow up (1‐4wks) | 1 | 35 | Mean Difference (IV, Random, 95% CI) | ‐35.58 [‐52.09, ‐19.07] |
| 3.2 Six weeks | 1 | 18 | Mean Difference (IV, Random, 95% CI) | ‐26.12 [‐56.15, 3.91] |
| 3.3 Three months | 1 | 36 | Mean Difference (IV, Random, 95% CI) | ‐53.5 [‐79.45, ‐27.55] |
| 3.4 Four months | 1 | 18 | Mean Difference (IV, Random, 95% CI) | 2.22 [‐27.02, 31.46] |
| 3.5 Six months | 1 | 37 | Mean Difference (IV, Random, 95% CI) | ‐28.46 [‐45.00, ‐9.92] |
| 4 modified Tardieu scale ‐ wrist flexors (change from baseline R2‐R1) | 2 | Mean Difference (IV, Random, 95% CI) | Subtotals only | |
| 4.1 Initial post‐injection follow up (1‐4wks) | 1 | 35 | Mean Difference (IV, Random, 95% CI) | ‐27.58 [‐47.87, ‐7.29] |
| 4.2 Six weeks | 1 | 18 | Mean Difference (IV, Random, 95% CI) | ‐18.33 [‐43.80, 7.14] |
| 4.3 Three months | 1 | 36 | Mean Difference (IV, Random, 95% CI) | ‐21.81 [‐33.65, ‐9.97] |
| 4.4 Four months | 1 | 20 | Mean Difference (IV, Random, 95% CI) | ‐10.56 [‐30.83, 9.71] |
| 4.5 Six months | 1 | 37 | Mean Difference (IV, Random, 95% CI) | 1.81 [‐17.00, 20.62] |
| 5 modified Ashworth scale ‐ shoulder adductors | 1 | Odds Ratio (Fixed, 95% CI) | Totals not selected | |
| 5.1 6 Weeks | 1 | Odds Ratio (Fixed, 95% CI) | 0.0 [0.0, 0.0] | |
| 5.2 4 Months | 1 | Odds Ratio (Fixed, 95% CI) | 0.0 [0.0, 0.0] | |
| 6 modified Ashworth scale ‐ elbow flexors | 2 | Odds Ratio (Fixed, 95% CI) | Subtotals only | |
| 6.1 Initial post‐injection follow up (1‐4wks) | 1 | Odds Ratio (Fixed, 95% CI) | 0.08 [0.02, 0.36] | |
| 6.2 3 Months | 2 | Odds Ratio (Fixed, 95% CI) | 0.16 [0.06, 0.43] | |
| 6.3 6 Months | 2 | Odds Ratio (Fixed, 95% CI) | 0.33 [0.13, 0.86] | |
| 7 modified Ashworth scale ‐ pronators | 2 | Odds Ratio (Fixed, 95% CI) | Totals not selected | |
| 7.1 Initial post‐injection follow up (1‐4wks) | 1 | Odds Ratio (Fixed, 95% CI) | 0.0 [0.0, 0.0] | |
| 7.2 6 Weeks | 1 | Odds Ratio (Fixed, 95% CI) | 0.0 [0.0, 0.0] | |
| 7.3 3 Months | 1 | Odds Ratio (Fixed, 95% CI) | 0.0 [0.0, 0.0] | |
| 7.4 4 Months | 1 | Odds Ratio (Fixed, 95% CI) | 0.0 [0.0, 0.0] | |
| 7.5 6 Months | 1 | Odds Ratio (Fixed, 95% CI) | 0.0 [0.0, 0.0] | |
| 8 modified Ashworth scale ‐ wrist flexors | 3 | Odds Ratio (Fixed, 95% CI) | Subtotals only | |
| 8.1 Initial post‐injection follow up (1‐4wks) | 1 | Odds Ratio (Fixed, 95% CI) | 0.18 [0.04, 0.76] | |
| 8.2 6 Weeks | 1 | Odds Ratio (Fixed, 95% CI) | 0.21 [0.04, 1.19] | |
| 8.3 3 Months | 2 | Odds Ratio (Fixed, 95% CI) | 0.10 [0.03, 0.29] | |
| 8.4 4 Months | 1 | Odds Ratio (Fixed, 95% CI) | 0.36 [0.07, 1.87] | |
| 8.5 6 Months | 2 | Odds Ratio (Fixed, 95% CI) | 0.20 [0.08, 0.51] | |
| 9 Wrist resonance Frequency 2Nm (change from baseline) | 1 | Mean Difference (IV, Random, 95% CI) | Totals not selected | |
| 9.1 Initial post‐injection follow up (1‐4wks) | 1 | Mean Difference (IV, Random, 95% CI) | 0.0 [0.0, 0.0] | |
| 9.2 Three months | 1 | Mean Difference (IV, Random, 95% CI) | 0.0 [0.0, 0.0] | |
| 10 Wrist resonance Frequency 4Nm (change from baseline) | 1 | Mean Difference (IV, Random, 95% CI) | Totals not selected | |
| 10.1 Initial post‐injection follow up (1‐4wks) | 1 | Mean Difference (IV, Random, 95% CI) | 0.0 [0.0, 0.0] | |
| 10.2 Three months | 1 | Mean Difference (IV, Random, 95% CI) | 0.0 [0.0, 0.0] | |
| 11 Supination AROM (change from baseline) | 1 | Mean Difference (IV, Random, 95% CI) | Totals not selected | |
| 11.1 Initial post‐injection follow up (1‐4wks) | 1 | Mean Difference (IV, Random, 95% CI) | 0.0 [0.0, 0.0] | |
| 11.2 Six weeks | 1 | Mean Difference (IV, Random, 95% CI) | 0.0 [0.0, 0.0] | |
| 11.3 Three months | 1 | Mean Difference (IV, Random, 95% CI) | 0.0 [0.0, 0.0] | |
| 11.4 Six months | 1 | Mean Difference (IV, Random, 95% CI) | 0.0 [0.0, 0.0] | |
| 11.5 Nine months | 1 | Mean Difference (IV, Random, 95% CI) | 0.0 [0.0, 0.0] | |
| 12 Wrist extension AROM (change from baseline) | 1 | Mean Difference (IV, Random, 95% CI) | Totals not selected | |
| 12.1 Initial post‐injection follow up (1‐4wks) | 1 | Mean Difference (IV, Random, 95% CI) | 0.0 [0.0, 0.0] | |
| 12.2 Six weeks | 1 | Mean Difference (IV, Random, 95% CI) | 0.0 [0.0, 0.0] | |
| 12.3 Three months | 1 | Mean Difference (IV, Random, 95% CI) | 0.0 [0.0, 0.0] | |
| 12.4 Six months | 1 | Mean Difference (IV, Random, 95% CI) | 0.0 [0.0, 0.0] | |
| 12.5 Nine months | 1 | Mean Difference (IV, Random, 95% CI) | 0.0 [0.0, 0.0] | |
| 13 Thumb abduction AROM (change from baseline) | 1 | Mean Difference (IV, Random, 95% CI) | Totals not selected | |
| 13.1 Initial post‐injection follow up (1‐4wks) | 1 | Mean Difference (IV, Random, 95% CI) | 0.0 [0.0, 0.0] | |
| 13.2 Six weeks | 1 | Mean Difference (IV, Random, 95% CI) | 0.0 [0.0, 0.0] | |
| 13.3 Three months | 1 | Mean Difference (IV, Random, 95% CI) | 0.0 [0.0, 0.0] | |
| 13.4 Six months | 1 | Mean Difference (IV, Random, 95% CI) | 0.0 [0.0, 0.0] | |
| 13.5 Nine months | 1 | Mean Difference (IV, Random, 95% CI) | 0.0 [0.0, 0.0] | |
| 14 Elbow extension PROM (change from baseline) | 2 | Mean Difference (IV, Random, 95% CI) | Subtotals only | |
| 14.1 Initial post‐injection follow up (1‐4wks) | 2 | 64 | Mean Difference (IV, Random, 95% CI) | 1.35 [‐1.81, 4.50] |
| 14.2 Three months | 2 | 65 | Mean Difference (IV, Random, 95% CI) | 0.11 [‐2.96, 3.19] |
| 14.3 Six months | 2 | 66 | Mean Difference (IV, Random, 95% CI) | ‐0.15 [‐3.38, 3.07] |
| 15 Forearm supination PROM (change from baseline) | 2 | Mean Difference (IV, Random, 95% CI) | Subtotals only | |
| 15.1 Initial post‐injection follow up (1‐4wks) | 2 | 64 | Mean Difference (IV, Random, 95% CI) | 2.17 [‐2.76, 7.09] |
| 15.2 Three months | 2 | 65 | Mean Difference (IV, Random, 95% CI) | 3.64 [‐0.92, 8.20] |
| 15.3 Six months | 2 | 66 | Mean Difference (IV, Random, 95% CI) | 0.97 [‐4.45, 6.39] |
| 16 Wrist extension PROM (change from baseline) | 1 | Mean Difference (IV, Random, 95% CI) | Totals not selected | |
| 16.1 Initial post‐injection follow up (1‐4wks) | 1 | Mean Difference (IV, Random, 95% CI) | 0.0 [0.0, 0.0] | |
| 16.2 Three months | 1 | Mean Difference (IV, Random, 95% CI) | 0.0 [0.0, 0.0] | |
| 16.3 Six months | 1 | Mean Difference (IV, Random, 95% CI) | 0.0 [0.0, 0.0] | |
| 17 Palmar thumb abduction PROM (change from baseline) | 1 | Mean Difference (IV, Random, 95% CI) | Totals not selected | |
| 17.1 Initial post‐injection follow up (1‐4wks) | 1 | Mean Difference (IV, Random, 95% CI) | 0.0 [0.0, 0.0] | |
| 17.2 Three months | 1 | Mean Difference (IV, Random, 95% CI) | 0.0 [0.0, 0.0] | |
| 17.3 Six months | 1 | Mean Difference (IV, Random, 95% CI) | 0.0 [0.0, 0.0] | |
| 18 Grip strength (change from baseline) | 2 | Mean Difference (IV, Random, 95% CI) | Subtotals only | |
| 18.1 Initial post‐injection follow up (1‐4wks) | 2 | 59 | Mean Difference (IV, Random, 95% CI) | ‐2.92 [‐7.41, 1.57] |
| 18.2 Three months | 2 | 59 | Mean Difference (IV, Random, 95% CI) | ‐3.50 [‐11.74, 4.74] |
| 18.3 Six months | 1 | 29 | Mean Difference (IV, Random, 95% CI) | 2.27 [‐10.18, 14.72] |
| 19 2‐point discrimination( change from baseline) | 1 | Mean Difference (IV, Random, 95% CI) | Totals not selected | |
| 19.1 Initial post‐injection follow up (1‐4wks) | 1 | Mean Difference (IV, Random, 95% CI) | 0.0 [0.0, 0.0] | |
| 19.2 Three months | 1 | Mean Difference (IV, Random, 95% CI) | 0.0 [0.0, 0.0] | |
| 20 Melbourne Assessment (change from baseline) | 3 | Mean Difference (IV, Random, 95% CI) | Subtotals only | |
| 20.1 Initial post‐injection follow up (1‐4wks) | 3 | 69 | Mean Difference (IV, Random, 95% CI) | 2.07 [‐4.19, 8.33] |
| 20.2 Six weeks | 1 | 20 | Mean Difference (IV, Random, 95% CI) | ‐0.51 [‐4.65, 3.63] |
| 20.3 Three months | 3 | 69 | Mean Difference (IV, Random, 95% CI) | 4.46 [‐0.77, 9.69] |
| 20.4 Six months | 2 | 40 | Mean Difference (IV, Random, 95% CI) | 0.96 [‐1.87, 3.79] |
| 20.5 Nine months | 1 | 20 | Mean Difference (IV, Random, 95% CI) | 1.16 [‐2.96, 5.28] |
| 21 QUEST scores (change from baseline) | 4 | Mean Difference (IV, Random, 95% CI) | Subtotals only | |
| 21.1 Initial post‐injection follow up (1‐4wks) | 3 | 84 | Mean Difference (IV, Random, 95% CI) | 9.79 [5.91, 13.66] |
| 21.2 Three months | 3 | 84 | Mean Difference (IV, Random, 95% CI) | 9.19 [4.84, 13.54] |
| 21.3 Four months | 1 | 20 | Mean Difference (IV, Random, 95% CI) | ‐4.42 [‐9.98, 1.14] |
| 21.4 Six months | 3 | 84 | Mean Difference (IV, Random, 95% CI) | 2.93 [‐1.58, 7.45] |
| 22 AMPS ‐ Motor (change from baseline) | 1 | Mean Difference (IV, Random, 95% CI) | Totals not selected | |
| 22.1 Initial post‐injection follow up (1‐4wks) | 1 | Mean Difference (IV, Random, 95% CI) | 0.0 [0.0, 0.0] | |
| 22.2 Three months | 1 | Mean Difference (IV, Random, 95% CI) | 0.0 [0.0, 0.0] | |
| 22.3 Six months | 1 | Mean Difference (IV, Random, 95% CI) | 0.0 [0.0, 0.0] | |
| 23 AMPS ‐ Process (change from baseline) | 1 | Mean Difference (IV, Random, 95% CI) | Totals not selected | |
| 23.1 Initial post‐injection follow up (1‐4wks) | 1 | Mean Difference (IV, Random, 95% CI) | 0.0 [0.0, 0.0] | |
| 23.2 Three months | 1 | Mean Difference (IV, Random, 95% CI) | 0.0 [0.0, 0.0] | |
| 23.3 Six months | 1 | Mean Difference (IV, Random, 95% CI) | 0.0 [0.0, 0.0] | |
| 24 PDMS ‐ Fine motor Raw Score (change from baseline) | 1 | Mean Difference (IV, Random, 95% CI) | Totals not selected | |
| 24.1 Four months | 1 | Mean Difference (IV, Random, 95% CI) | 0.0 [0.0, 0.0] | |
| 25 PDMS ‐ Fine motor Scaled Score (change from baseline) | 1 | Mean Difference (IV, Random, 95% CI) | Totals not selected | |
| 25.1 Four months | 1 | Mean Difference (IV, Random, 95% CI) | 0.0 [0.0, 0.0] | |
| 26 PEDI raw score ‐ Functional Skills (change from baseline) | 6 | Mean Difference (IV, Random, 95% CI) | Subtotals only | |
| 26.1 Initial post‐injection follow up (1‐4wks) | 4 | 121 | Mean Difference (IV, Random, 95% CI) | 0.61 [‐1.88, 3.11] |
| 26.2 Six weeks | 1 | 20 | Mean Difference (IV, Random, 95% CI) | ‐0.10 [‐2.89, 2.69] |
| 26.3 Three months | 6 | 201 | Mean Difference (IV, Random, 95% CI) | 0.03 [‐1.57, 1.64] |
| 26.4 Six months | 5 | 171 | Mean Difference (IV, Random, 95% CI) | 0.50 [‐1.20, 2.20] |
| 26.5 Nine months | 1 | 20 | Mean Difference (IV, Random, 95% CI) | 0.20 [‐2.83, 3.23] |
| 27 PEDI scaled score ‐ Functional Skills (change from baseline) | 3 | Mean Difference (IV, Random, 95% CI) | Subtotals only | |
| 27.1 Initial post‐injection follow up (1‐4wks) | 2 | 59 | Mean Difference (IV, Random, 95% CI) | 3.53 [‐0.33, 7.38] |
| 27.2 Three months | 3 | 96 | Mean Difference (IV, Random, 95% CI) | 0.60 [‐1.44, 2.63] |
| 27.3 Six months | 2 | 66 | Mean Difference (IV, Random, 95% CI) | 1.09 [‐1.70, 3.88] |
| 28 PEDI raw score ‐ Caregiver assistance (change from baseline) | 2 | Mean Difference (IV, Random, 95% CI) | Subtotals only | |
| 28.1 Initial post‐injection follow up (1‐4wks) | 1 | 42 | Mean Difference (IV, Random, 95% CI) | 0.20 [‐2.00, 4.40] |
| 28.2 Three months | 2 | 79 | Mean Difference (IV, Random, 95% CI) | ‐1.51 [‐3.91, 0.90] |
| 28.3 Six months | 2 | 79 | Mean Difference (IV, Random, 95% CI) | ‐0.68 [‐3.31, 1.95] |
| 29 PEDI scaled score ‐ Caregiver assistance (change from baseline) | 1 | Mean Difference (IV, Random, 95% CI) | Totals not selected | |
| 29.1 Three months | 1 | Mean Difference (IV, Random, 95% CI) | 0.0 [0.0, 0.0] | |
| 29.2 Six months | 1 | Mean Difference (IV, Random, 95% CI) | 0.0 [0.0, 0.0] | |
| 30 Goal Attainment Scaling (change from baseline) ‐ Parent | 5 | Mean Difference (IV, Random, 95% CI) | Subtotals only | |
| 30.1 Initial post‐injection follow up (1‐4wks) | 3 | 115 | Mean Difference (IV, Random, 95% CI) | 7.06 [2.64, 11.48] |
| 30.2 Three months | 4 | 152 | Mean Difference (IV, Random, 95% CI) | 8.52 [4.42, 12.62] |
| 30.3 Four months | 1 | 20 | Mean Difference (IV, Random, 95% CI) | 9.21 [1.06, 17.36] |
| 30.4 Six months | 3 | 122 | Mean Difference (IV, Random, 95% CI) | 5.04 [‐0.75, 10.83] |
| 31 Goal Attainment Scaling (change from baseline) ‐ Therapist | 1 | Mean Difference (IV, Random, 95% CI) | Totals not selected | |
| 31.1 Initial post‐injection follow up (1‐4wks) | 1 | Mean Difference (IV, Random, 95% CI) | 0.0 [0.0, 0.0] | |
| 31.2 Three months | 1 | Mean Difference (IV, Random, 95% CI) | 0.0 [0.0, 0.0] | |
| 31.3 Six months | 1 | Mean Difference (IV, Random, 95% CI) | 0.0 [0.0, 0.0] | |
| 32 COPM Performance (change from baseline) | 4 | Mean Difference (IV, Random, 95% CI) | Subtotals only | |
| 32.1 Initial post‐injection follow up (1‐4wks) | 2 | 72 | Mean Difference (IV, Random, 95% CI) | 0.52 [0.01, 1.04] |
| 32.2 Three months | 3 | 109 | Mean Difference (IV, Random, 95% CI) | 0.77 [0.23, 1.31] |
| 32.3 Four months | 1 | 20 | Mean Difference (IV, Random, 95% CI) | 0.60 [‐0.68, 1.88] |
| 32.4 Six months | 2 | 79 | Mean Difference (IV, Random, 95% CI) | 0.40 [‐0.30, 1.09] |
| 33 COPM Satisfaction (change from baseline) | 4 | Mean Difference (IV, Random, 95% CI) | Subtotals only | |
| 33.1 Initial post‐injection follow up (1‐4wks) | 2 | 72 | Mean Difference (IV, Random, 95% CI) | 0.51 [‐0.09, 1.11] |
| 33.2 Three months | 3 | 109 | Mean Difference (IV, Random, 95% CI) | 0.81 [0.17, 1.46] |
| 33.3 Four months | 1 | 20 | Mean Difference (IV, Random, 95% CI) | 0.76 [‐0.92, 2.44] |
| 33.4 Six months | 2 | 79 | Mean Difference (IV, Random, 95% CI) | 0.35 [‐0.39, 1.08] |
2.6. Analysis.

Comparison 2 BoNT‐A/OT vs OT only, Outcome 6 modified Ashworth scale ‐ elbow flexors.
2.7. Analysis.

Comparison 2 BoNT‐A/OT vs OT only, Outcome 7 modified Ashworth scale ‐ pronators.
2.12. Analysis.

Comparison 2 BoNT‐A/OT vs OT only, Outcome 12 Wrist extension AROM (change from baseline).
2.15. Analysis.

Comparison 2 BoNT‐A/OT vs OT only, Outcome 15 Forearm supination PROM (change from baseline).
2.16. Analysis.

Comparison 2 BoNT‐A/OT vs OT only, Outcome 16 Wrist extension PROM (change from baseline).
2.23. Analysis.

Comparison 2 BoNT‐A/OT vs OT only, Outcome 23 AMPS ‐ Process (change from baseline).
2.24. Analysis.

Comparison 2 BoNT‐A/OT vs OT only, Outcome 24 PDMS ‐ Fine motor Raw Score (change from baseline).
2.25. Analysis.

Comparison 2 BoNT‐A/OT vs OT only, Outcome 25 PDMS ‐ Fine motor Scaled Score (change from baseline).
2.26. Analysis.

Comparison 2 BoNT‐A/OT vs OT only, Outcome 26 PEDI raw score ‐ Functional Skills (change from baseline).
2.27. Analysis.
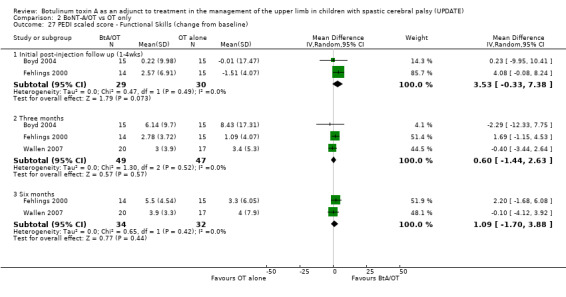
Comparison 2 BoNT‐A/OT vs OT only, Outcome 27 PEDI scaled score ‐ Functional Skills (change from baseline).
2.28. Analysis.

Comparison 2 BoNT‐A/OT vs OT only, Outcome 28 PEDI raw score ‐ Caregiver assistance (change from baseline).
2.31. Analysis.

Comparison 2 BoNT‐A/OT vs OT only, Outcome 31 Goal Attainment Scaling (change from baseline) ‐ Therapist.
Comparison 3. BoNT‐A/OT vs BoNT‐A only.
| Outcome or subgroup title | No. of studies | No. of participants | Statistical method | Effect size |
|---|---|---|---|---|
| 1 modified Tardieu scale ‐ Elbow Flexors (change from baseline) | 1 | Mean Difference (IV, Random, 95% CI) | Totals not selected | |
| 1.1 Initial post‐injection follow up (1‐4wks) | 1 | Mean Difference (IV, Random, 95% CI) | 0.0 [0.0, 0.0] | |
| 1.2 Three months | 1 | Mean Difference (IV, Random, 95% CI) | 0.0 [0.0, 0.0] | |
| 1.3 Six months | 1 | Mean Difference (IV, Random, 95% CI) | 0.0 [0.0, 0.0] | |
| 2 modified Tardieu scale ‐ Pronators (change from baseline) | 1 | Mean Difference (IV, Random, 95% CI) | Totals not selected | |
| 2.1 Initial post‐injection follow up (1‐4wks) | 1 | Mean Difference (IV, Random, 95% CI) | 0.0 [0.0, 0.0] | |
| 2.2 Three months | 1 | Mean Difference (IV, Random, 95% CI) | 0.0 [0.0, 0.0] | |
| 2.3 Six months | 1 | Mean Difference (IV, Random, 95% CI) | 0.0 [0.0, 0.0] | |
| 3 modified Tardieu scale ‐ Wrist Flexors (change from baseline) | 1 | Mean Difference (IV, Random, 95% CI) | Totals not selected | |
| 3.1 Initial post‐injection follow up (1‐4wks) | 1 | Mean Difference (IV, Random, 95% CI) | 0.0 [0.0, 0.0] | |
| 3.2 Three months | 1 | Mean Difference (IV, Random, 95% CI) | 0.0 [0.0, 0.0] | |
| 3.3 Six months | 1 | Mean Difference (IV, Random, 95% CI) | 0.0 [0.0, 0.0] | |
| 4 Elbow extension PROM (change from baseline) | 1 | Mean Difference (IV, Random, 95% CI) | Totals not selected | |
| 4.1 Initial post‐injection follow up (1‐4wks) | 1 | Mean Difference (IV, Random, 95% CI) | 0.0 [0.0, 0.0] | |
| 4.2 Three months | 1 | Mean Difference (IV, Random, 95% CI) | 0.0 [0.0, 0.0] | |
| 4.3 Six months | 1 | Mean Difference (IV, Random, 95% CI) | 0.0 [0.0, 0.0] | |
| 5 Forearm supination PROM (change from baseline) | 1 | Mean Difference (IV, Random, 95% CI) | Totals not selected | |
| 5.1 Initial post‐injection follow up (1‐4wks) | 1 | Mean Difference (IV, Random, 95% CI) | 0.0 [0.0, 0.0] | |
| 5.2 Three months | 1 | Mean Difference (IV, Random, 95% CI) | 0.0 [0.0, 0.0] | |
| 5.3 Six months | 1 | Mean Difference (IV, Random, 95% CI) | 0.0 [0.0, 0.0] | |
| 6 Melbourne Assesment (change from baseline) | 1 | Mean Difference (IV, Random, 95% CI) | Totals not selected | |
| 6.1 Initial post‐injection follow up (1‐4wks) | 1 | Mean Difference (IV, Random, 95% CI) | 0.0 [0.0, 0.0] | |
| 6.2 Three months | 1 | Mean Difference (IV, Random, 95% CI) | 0.0 [0.0, 0.0] | |
| 6.3 Six months | 1 | Mean Difference (IV, Random, 95% CI) | 0.0 [0.0, 0.0] | |
| 7 QUEST scores (change from baseline) | 1 | Mean Difference (IV, Random, 95% CI) | Totals not selected | |
| 7.1 Initial post‐injection follow up (1‐4wks) | 1 | Mean Difference (IV, Random, 95% CI) | 0.0 [0.0, 0.0] | |
| 7.2 Three months | 1 | Mean Difference (IV, Random, 95% CI) | 0.0 [0.0, 0.0] | |
| 7.3 Six months | 1 | Mean Difference (IV, Random, 95% CI) | 0.0 [0.0, 0.0] | |
| 8 PEDI raw score ‐ Functional Skills (change from baseline) | 1 | Mean Difference (IV, Random, 95% CI) | Totals not selected | |
| 8.1 Three months | 1 | Mean Difference (IV, Random, 95% CI) | 0.0 [0.0, 0.0] | |
| 8.2 Six months | 1 | Mean Difference (IV, Random, 95% CI) | 0.0 [0.0, 0.0] | |
| 9 PEDI scaled score ‐ Functional Skills (change from baseline) | 1 | Mean Difference (IV, Random, 95% CI) | Totals not selected | |
| 9.1 Three months | 1 | Mean Difference (IV, Random, 95% CI) | 0.0 [0.0, 0.0] | |
| 9.2 Six months | 1 | Mean Difference (IV, Random, 95% CI) | 0.0 [0.0, 0.0] | |
| 10 PEDI raw score ‐ Caregiver Assistance (change from baseline) | 1 | Mean Difference (IV, Random, 95% CI) | Totals not selected | |
| 10.1 Three months | 1 | Mean Difference (IV, Random, 95% CI) | 0.0 [0.0, 0.0] | |
| 10.2 Six months | 1 | Mean Difference (IV, Random, 95% CI) | 0.0 [0.0, 0.0] | |
| 11 PEDI scaled score ‐ Caregiver Assistance (change from baseline) | 1 | Mean Difference (IV, Random, 95% CI) | Totals not selected | |
| 11.1 Three months | 1 | Mean Difference (IV, Random, 95% CI) | 0.0 [0.0, 0.0] | |
| 11.2 Six months | 1 | Mean Difference (IV, Random, 95% CI) | 0.0 [0.0, 0.0] | |
| 12 Goal Attainment Scaling (change from baseline) | 1 | Mean Difference (IV, Random, 95% CI) | Totals not selected | |
| 12.1 Three months | 1 | Mean Difference (IV, Random, 95% CI) | 0.0 [0.0, 0.0] | |
| 12.2 Six months | 1 | Mean Difference (IV, Random, 95% CI) | 0.0 [0.0, 0.0] | |
| 13 COPM Performance (change from baseline) | 1 | Mean Difference (IV, Random, 95% CI) | Totals not selected | |
| 13.1 Three months | 1 | Mean Difference (IV, Random, 95% CI) | 0.0 [0.0, 0.0] | |
| 13.2 Six months | 1 | Mean Difference (IV, Random, 95% CI) | 0.0 [0.0, 0.0] | |
| 14 COPM Satisfaction (change from baseline) | 1 | Mean Difference (IV, Random, 95% CI) | Totals not selected | |
| 14.1 Three months | 1 | Mean Difference (IV, Random, 95% CI) | 0.0 [0.0, 0.0] | |
| 14.2 Six months | 1 | Mean Difference (IV, Random, 95% CI) | 0.0 [0.0, 0.0] |
3.2. Analysis.

Comparison 3 BoNT‐A/OT vs BoNT‐A only, Outcome 2 modified Tardieu scale ‐ Pronators (change from baseline).
3.9. Analysis.

Comparison 3 BoNT‐A/OT vs BoNT‐A only, Outcome 9 PEDI scaled score ‐ Functional Skills (change from baseline).
3.10. Analysis.

Comparison 3 BoNT‐A/OT vs BoNT‐A only, Outcome 10 PEDI raw score ‐ Caregiver Assistance (change from baseline).
Comparison 4. BoNT‐A/OT vs Placebo/no treatment.
| Outcome or subgroup title | No. of studies | No. of participants | Statistical method | Effect size |
|---|---|---|---|---|
| 1 modified Tardieu scale ‐ Elbow flexors (change from baseline R2‐R1) | 1 | Mean Difference (IV, Random, 95% CI) | Totals not selected | |
| 1.1 Initial post‐injection follow up (1‐4wks) | 1 | Mean Difference (IV, Random, 95% CI) | 0.0 [0.0, 0.0] | |
| 1.2 Three months | 1 | Mean Difference (IV, Random, 95% CI) | 0.0 [0.0, 0.0] | |
| 1.3 Six months | 1 | Mean Difference (IV, Random, 95% CI) | 0.0 [0.0, 0.0] | |
| 2 modified Tardieu scale ‐ Forearm pronators (change from baseline R2‐R1) | 1 | Mean Difference (IV, Random, 95% CI) | Totals not selected | |
| 2.1 Initial post‐injection follow up (1‐4wks) | 1 | Mean Difference (IV, Random, 95% CI) | 0.0 [0.0, 0.0] | |
| 2.2 Three months | 1 | Mean Difference (IV, Random, 95% CI) | 0.0 [0.0, 0.0] | |
| 2.3 Six months | 1 | Mean Difference (IV, Random, 95% CI) | 0.0 [0.0, 0.0] | |
| 3 modified Tardieu scale ‐ Wrist flexors (change form baseline R2‐R1) | 1 | Mean Difference (IV, Random, 95% CI) | Totals not selected | |
| 3.1 Initial post‐injection follow up (1‐4wks) | 1 | Mean Difference (IV, Random, 95% CI) | 0.0 [0.0, 0.0] | |
| 3.2 Three months | 1 | Mean Difference (IV, Random, 95% CI) | 0.0 [0.0, 0.0] | |
| 3.3 Six months | 1 | Mean Difference (IV, Random, 95% CI) | 0.0 [0.0, 0.0] | |
| 4 Elbow extension PROM (change from baseline) | 1 | Mean Difference (IV, Random, 95% CI) | Totals not selected | |
| 4.1 Initial post‐injection follow up (1‐4wks) | 1 | Mean Difference (IV, Random, 95% CI) | 0.0 [0.0, 0.0] | |
| 4.2 Three months | 1 | Mean Difference (IV, Random, 95% CI) | 0.0 [0.0, 0.0] | |
| 4.3 Six months | 1 | Mean Difference (IV, Random, 95% CI) | 0.0 [0.0, 0.0] | |
| 5 Forearm supination PROM (change from baseline) | 1 | Mean Difference (IV, Random, 95% CI) | Totals not selected | |
| 5.1 Initial post‐injection follow up (1‐4wks) | 1 | Mean Difference (IV, Random, 95% CI) | 0.0 [0.0, 0.0] | |
| 5.2 Three months | 1 | Mean Difference (IV, Random, 95% CI) | 0.0 [0.0, 0.0] | |
| 5.3 Six months | 1 | Mean Difference (IV, Random, 95% CI) | 0.0 [0.0, 0.0] | |
| 6 QUEST scores (change from baseline) | 1 | Mean Difference (IV, Random, 95% CI) | Totals not selected | |
| 6.1 Initial post‐injection follow up (1‐4wks) | 1 | Mean Difference (IV, Random, 95% CI) | 0.0 [0.0, 0.0] | |
| 6.2 Three months | 1 | Mean Difference (IV, Random, 95% CI) | 0.0 [0.0, 0.0] | |
| 6.3 Six months | 1 | Mean Difference (IV, Random, 95% CI) | 0.0 [0.0, 0.0] | |
| 7 Melbourne Assessment (change from baseline) | 1 | Mean Difference (IV, Random, 95% CI) | Totals not selected | |
| 7.1 Initial post‐injection follow up (1‐4wks) | 1 | Mean Difference (IV, Random, 95% CI) | 0.0 [0.0, 0.0] | |
| 7.2 Three months | 1 | Mean Difference (IV, Random, 95% CI) | 0.0 [0.0, 0.0] | |
| 7.3 Six months | 1 | Mean Difference (IV, Random, 95% CI) | 0.0 [0.0, 0.0] | |
| 8 PEDI raw scores ‐ Functional Skills (change from baseline) | 1 | Mean Difference (IV, Random, 95% CI) | Totals not selected | |
| 8.1 Three months | 1 | Mean Difference (IV, Random, 95% CI) | 0.0 [0.0, 0.0] | |
| 8.2 Six months | 1 | Mean Difference (IV, Random, 95% CI) | 0.0 [0.0, 0.0] | |
| 9 PEDI scaled scores ‐ Functional Skills (change from baseline) | 1 | Mean Difference (IV, Random, 95% CI) | Totals not selected | |
| 9.1 Three months | 1 | Mean Difference (IV, Random, 95% CI) | 0.0 [0.0, 0.0] | |
| 9.2 Six months | 1 | Mean Difference (IV, Random, 95% CI) | 0.0 [0.0, 0.0] | |
| 10 PEDI raw scores ‐ Caregiver Assistance (change from baseline) | 1 | Mean Difference (IV, Random, 95% CI) | Totals not selected | |
| 10.1 Three months | 1 | Mean Difference (IV, Random, 95% CI) | 0.0 [0.0, 0.0] | |
| 10.2 Six months | 1 | Mean Difference (IV, Random, 95% CI) | 0.0 [0.0, 0.0] | |
| 11 PEDI scaled scores ‐ Caregiver Assistance (change from baseline) | 1 | Mean Difference (IV, Random, 95% CI) | Totals not selected | |
| 11.1 Three months | 1 | Mean Difference (IV, Random, 95% CI) | 0.0 [0.0, 0.0] | |
| 11.2 Six months | 1 | Mean Difference (IV, Random, 95% CI) | 0.0 [0.0, 0.0] | |
| 12 Goal Attainment Scaling (change from baseline) | 1 | Mean Difference (IV, Random, 95% CI) | Totals not selected | |
| 12.1 Three months | 1 | Mean Difference (IV, Random, 95% CI) | 0.0 [0.0, 0.0] | |
| 12.2 Six months | 1 | Mean Difference (IV, Random, 95% CI) | 0.0 [0.0, 0.0] | |
| 13 COPM Performance (change from baseline) | 1 | Mean Difference (IV, Random, 95% CI) | Totals not selected | |
| 13.1 Three months | 1 | Mean Difference (IV, Random, 95% CI) | 0.0 [0.0, 0.0] | |
| 13.2 Six months | 1 | Mean Difference (IV, Random, 95% CI) | 0.0 [0.0, 0.0] | |
| 14 COPM Satisfaction (change from baseline) | 1 | Mean Difference (IV, Random, 95% CI) | Totals not selected | |
| 14.1 Three months | 1 | Mean Difference (IV, Random, 95% CI) | 0.0 [0.0, 0.0] | |
| 14.2 Six months | 1 | Mean Difference (IV, Random, 95% CI) | 0.0 [0.0, 0.0] |
4.2. Analysis.

Comparison 4 BoNT‐A/OT vs Placebo/no treatment, Outcome 2 modified Tardieu scale ‐ Forearm pronators (change from baseline R2‐R1).
4.9. Analysis.
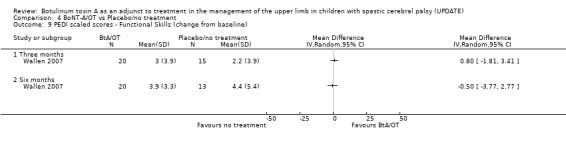
Comparison 4 BoNT‐A/OT vs Placebo/no treatment, Outcome 9 PEDI scaled scores ‐ Functional Skills (change from baseline).
4.10. Analysis.

Comparison 4 BoNT‐A/OT vs Placebo/no treatment, Outcome 10 PEDI raw scores ‐ Caregiver Assistance (change from baseline).
Comparison 5. BoNT‐A only vs OT only.
| Outcome or subgroup title | No. of studies | No. of participants | Statistical method | Effect size |
|---|---|---|---|---|
| 1 modified Tardieu scale ‐ Elbow Flexors (change from baseline) | 1 | Mean Difference (IV, Random, 95% CI) | Totals not selected | |
| 1.1 Initial post‐injection follow up (1‐4wks) | 1 | Mean Difference (IV, Random, 95% CI) | 0.0 [0.0, 0.0] | |
| 1.2 Three months | 1 | Mean Difference (IV, Random, 95% CI) | 0.0 [0.0, 0.0] | |
| 1.3 Six months | 1 | Mean Difference (IV, Random, 95% CI) | 0.0 [0.0, 0.0] | |
| 2 modified Tardieu scale ‐ Pronators (change from baseline) | 1 | Mean Difference (IV, Random, 95% CI) | Totals not selected | |
| 2.1 Initial post‐injection follow up (1‐4wks) | 1 | Mean Difference (IV, Random, 95% CI) | 0.0 [0.0, 0.0] | |
| 2.2 Three months | 1 | Mean Difference (IV, Random, 95% CI) | 0.0 [0.0, 0.0] | |
| 2.3 Six months | 1 | Mean Difference (IV, Random, 95% CI) | 0.0 [0.0, 0.0] | |
| 3 modified Tardieu scale ‐ Wrist flexors (change from baseline) | 1 | Mean Difference (IV, Random, 95% CI) | Totals not selected | |
| 3.1 Initial post‐injection follow up (1‐4wks) | 1 | Mean Difference (IV, Random, 95% CI) | 0.0 [0.0, 0.0] | |
| 3.2 Three months | 1 | Mean Difference (IV, Random, 95% CI) | 0.0 [0.0, 0.0] | |
| 3.3 Six months | 1 | Mean Difference (IV, Random, 95% CI) | 0.0 [0.0, 0.0] | |
| 4 Elbow extension PROM (change from baseline) | 1 | Mean Difference (IV, Random, 95% CI) | Totals not selected | |
| 4.1 Initial post‐injection follow up (1‐4wks) | 1 | Mean Difference (IV, Random, 95% CI) | 0.0 [0.0, 0.0] | |
| 4.2 Three months | 1 | Mean Difference (IV, Random, 95% CI) | 0.0 [0.0, 0.0] | |
| 4.3 Six months | 1 | Mean Difference (IV, Random, 95% CI) | 0.0 [0.0, 0.0] | |
| 5 Forearm supination PROM (change from baseline) | 1 | Mean Difference (IV, Random, 95% CI) | Totals not selected | |
| 5.1 Initial post‐injection follow up (1‐4wks) | 1 | Mean Difference (IV, Random, 95% CI) | 0.0 [0.0, 0.0] | |
| 5.2 Three months | 1 | Mean Difference (IV, Random, 95% CI) | 0.0 [0.0, 0.0] | |
| 5.3 Six months | 1 | Mean Difference (IV, Random, 95% CI) | 0.0 [0.0, 0.0] | |
| 6 Melbourne Assesment (change from baseline) | 1 | Mean Difference (IV, Random, 95% CI) | Totals not selected | |
| 6.1 Initial post‐injection follow up (1‐4wks) | 1 | Mean Difference (IV, Random, 95% CI) | 0.0 [0.0, 0.0] | |
| 6.2 Three months | 1 | Mean Difference (IV, Random, 95% CI) | 0.0 [0.0, 0.0] | |
| 6.3 Six months | 1 | Mean Difference (IV, Random, 95% CI) | 0.0 [0.0, 0.0] | |
| 7 QUEST scores (change from baseline) | 1 | Mean Difference (IV, Random, 95% CI) | Totals not selected | |
| 7.1 Initial post‐injection follow up (1‐4wks) | 1 | Mean Difference (IV, Random, 95% CI) | 0.0 [0.0, 0.0] | |
| 7.2 Three months | 1 | Mean Difference (IV, Random, 95% CI) | 0.0 [0.0, 0.0] | |
| 7.3 Six months | 1 | Mean Difference (IV, Random, 95% CI) | 0.0 [0.0, 0.0] | |
| 8 PEDI raw score ‐ Functional Skills (change from baseline) | 1 | Mean Difference (IV, Random, 95% CI) | Totals not selected | |
| 8.1 Three months | 1 | Mean Difference (IV, Random, 95% CI) | 0.0 [0.0, 0.0] | |
| 8.2 Six months | 1 | Mean Difference (IV, Random, 95% CI) | 0.0 [0.0, 0.0] | |
| 9 PEDI scaled score ‐ Functional Skills (change from baseline) | 1 | Mean Difference (IV, Random, 95% CI) | Totals not selected | |
| 9.1 Three months | 1 | Mean Difference (IV, Random, 95% CI) | 0.0 [0.0, 0.0] | |
| 9.2 Six months | 1 | Mean Difference (IV, Random, 95% CI) | 0.0 [0.0, 0.0] | |
| 10 PEDI raw score ‐ Caregiver Assistance (change from baseline) | 1 | Mean Difference (IV, Random, 95% CI) | Totals not selected | |
| 10.1 Three months | 1 | Mean Difference (IV, Random, 95% CI) | 0.0 [0.0, 0.0] | |
| 10.2 Six months | 1 | Mean Difference (IV, Random, 95% CI) | 0.0 [0.0, 0.0] | |
| 11 PEDI scaled score ‐ Caregiver Assistance (change from baseline) | 1 | Mean Difference (IV, Random, 95% CI) | Totals not selected | |
| 11.1 Three months | 1 | Mean Difference (IV, Random, 95% CI) | 0.0 [0.0, 0.0] | |
| 11.2 Six months | 1 | Mean Difference (IV, Random, 95% CI) | 0.0 [0.0, 0.0] | |
| 12 Goal Attainment Scaling (change from baseline) | 1 | Mean Difference (IV, Random, 95% CI) | Totals not selected | |
| 12.1 Three months | 1 | Mean Difference (IV, Random, 95% CI) | 0.0 [0.0, 0.0] | |
| 12.2 Six months | 1 | Mean Difference (IV, Random, 95% CI) | 0.0 [0.0, 0.0] | |
| 13 COPM Performance (change from baseline) | 1 | Mean Difference (IV, Random, 95% CI) | Totals not selected | |
| 13.1 Three months | 1 | Mean Difference (IV, Random, 95% CI) | 0.0 [0.0, 0.0] | |
| 13.2 Six months | 1 | Mean Difference (IV, Random, 95% CI) | 0.0 [0.0, 0.0] | |
| 14 COPM Satisfaction (change from baseline) | 1 | Mean Difference (IV, Random, 95% CI) | Totals not selected | |
| 14.1 Three months | 1 | Mean Difference (IV, Random, 95% CI) | 0.0 [0.0, 0.0] | |
| 14.2 Six months | 1 | Mean Difference (IV, Random, 95% CI) | 0.0 [0.0, 0.0] |
5.7. Analysis.

Comparison 5 BoNT‐A only vs OT only, Outcome 7 QUEST scores (change from baseline).
5.8. Analysis.

Comparison 5 BoNT‐A only vs OT only, Outcome 8 PEDI raw score ‐ Functional Skills (change from baseline).
5.9. Analysis.

Comparison 5 BoNT‐A only vs OT only, Outcome 9 PEDI scaled score ‐ Functional Skills (change from baseline).
5.10. Analysis.
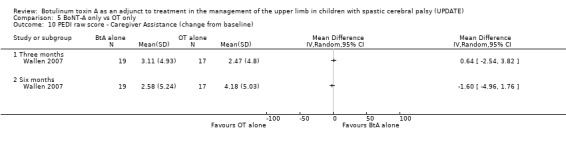
Comparison 5 BoNT‐A only vs OT only, Outcome 10 PEDI raw score ‐ Caregiver Assistance (change from baseline).
5.11. Analysis.

Comparison 5 BoNT‐A only vs OT only, Outcome 11 PEDI scaled score ‐ Caregiver Assistance (change from baseline).
5.12. Analysis.

Comparison 5 BoNT‐A only vs OT only, Outcome 12 Goal Attainment Scaling (change from baseline).
5.13. Analysis.

Comparison 5 BoNT‐A only vs OT only, Outcome 13 COPM Performance (change from baseline).
Comparison 6. High dose BoNT‐A vs Low dose BoNT‐A.
| Outcome or subgroup title | No. of studies | No. of participants | Statistical method | Effect size |
|---|---|---|---|---|
| 1 Grip Strength (change from baseline) | 1 | Mean Difference (IV, Random, 95% CI) | Totals not selected | |
| 1.1 Initial post‐injection follow up (1‐4wks) | 1 | Mean Difference (IV, Random, 95% CI) | 0.0 [0.0, 0.0] | |
| 1.2 Three months | 1 | Mean Difference (IV, Random, 95% CI) | 0.0 [0.0, 0.0] | |
| 2 QUEST scores (change from baseline) | 1 | Mean Difference (IV, Random, 95% CI) | Totals not selected | |
| 2.1 Initial post‐injection follow up (1‐4wks) | 1 | Mean Difference (IV, Random, 95% CI) | 0.0 [0.0, 0.0] | |
| 2.2 Three months | 1 | Mean Difference (IV, Random, 95% CI) | 0.0 [0.0, 0.0] | |
| 3 PEDI ‐ functional skills (self care domain) (change from baseline) | 1 | Mean Difference (IV, Random, 95% CI) | Totals not selected | |
| 3.1 Initial post‐injection follow up | 1 | Mean Difference (IV, Random, 95% CI) | 0.0 [0.0, 0.0] | |
| 3.2 Three months | 1 | Mean Difference (IV, Random, 95% CI) | 0.0 [0.0, 0.0] |
Characteristics of studies
Characteristics of included studies [ordered by study ID]
Boyd 2004.
| Methods | Randomised controlled trial comparing BoNT‐A and occupational therapy with occupational therapy alone. Blinded outcome assessors for functional Magnetic Resonance Imaging, Melbourne Assessment and Goal Attainment Scaling. Treating therapist blinded. Following baseline assessment children were matched in pairs for age, gender and side of hemiplegia. Allocation was conducted by an independent officer using opaque envelopes in pairs randomly allocated to treatment or control by computer generated numbers. Follow‐up at 3 weeks and 12 weeks. | |
| Participants | 30 children (10 male, 20 female); age range 5 to 15 (mean 8.9 years) (n=15 Treatment, n=15 control). There were no drop‐outs. Eligibility: Congenital spastic hemiplegia, no evidence of fixed muscle contractures in the forearm yet functional problems in their impaired upper limb due to spasticity in the forearm that was grade 1+ or higher on the modified Ashworth scale. Exclusion based on history of unstable epilepsy, any medical contraindication to use of BoNT‐A or previous surgery in the injected upper limb. | |
| Interventions | Treatment Group
Refer to Table 14 Both Groups An upper limb training program was provided for one hour once a week for 6 week by an occupational therapist blinded to group allocation. The program utilised principles of motor skills learning, occupational performance and goal attainment. Children were also encouraged to undertake 30 minutes of daily training at home for at least six days per week for 12 weeks. No casts or splints were used. |
|
| Outcomes | Functional Magnetic Resonance Imaging, Resonant Frequency, Grip strength, Sensitivity, Stereognosis, The Melbourne Assessment of Unilateral Upper Limb Function, Pediatric Evaluation of Disability Inventory ‐ self care domain, Canadian Occupational Performance Measure, Goal Attainment Scaling, Australian Authorised Adaptation of the Child Health Questionnaire , Pediatric Motor Activity Log, Actual Amount of Use Test, Block transfer task (speed), Block tower task (dexterity). Severity of cerebral palsy classified according to GMFCS and Bimanual Fine Motor Function scale. | |
| Notes | The authors were contacted for data, including mean change and standard deviation of the mean change. Data were not made available therefore conversion of data from unpublished thesis was undertaken by review authors. | |
| Risk of bias | ||
| Bias | Authors' judgement | Support for judgement |
| Allocation concealment? | Low risk | A ‐ Adequate |
Corry 1997.
| Methods | Double blind randomised controlled trial comparing BoNT‐A injections with injections of normal saline. Randomisation was restricted to ensure 7 patients in each group. One of 14 envelopes containing the instruction "placebo" or "botulinum" was drawn for each patient and opened by the non‐blind injector just before injection. Allocation concealment not clearly stated. Outcome assessors and participants were blinded. Follow up at 2 and 12 weeks. | |
| Participants | 14 children (5 male, 9 female; mean age 9 years) (n=7 Treatment, n=7 Control) with a dynamic component to spasticity ‐ 12 hemiplegia, 1 quadriplegia, and 1 triplegia. Three had previous upper limb surgery. No dropouts reported. | |
| Interventions | Treatment Group (BoNT‐A alone)
Refer to Table 14 Control (placebo) Intramuscular injection of saline. |
|
| Outcomes | Active ROM of MCP, wrist and elbow extension; thumb in palm position for both thumb extension and abduction; Ashworth scale for thumb, wrist, and elbow tone; wrist resonance frequency (tone); grasp and release of an empty film capsule scored using a modified Reddihough scale and the number of transfers of a coin. | |
| Notes | The authors were contacted and generously provided assistance, however no additional data were available. | |
| Risk of bias | ||
| Bias | Authors' judgement | Support for judgement |
| Allocation concealment? | Unclear risk | B ‐ Unclear |
Fehlings 2000.
| Methods | Randomised controlled trial comparing BoNT‐A and occupational therapy with occupational therapy only. Blinded outcome assessor. Not reported if treating therapists were blinded. Randomisation produced by random number generator. Allocation concealment not clearly stated. Follow up at 1, 3, and 6 months. | |
| Participants | 30 children (20 male, 10 female); age range 2.5 to 10 years (n=14 Treatment , n=15 Control). One dropout from treatment group before 1 month assessment. Eligibility: diagnosed with hemiplegic cerebral palsy; moderate spasticity at the elbow, wrist or thumb with a modified Ashworth score greater than or equal to 2; full passive range and the ability to initiate voluntary movement of the digits. Excluded if using a rigid splint. | |
| Interventions | Treatment Group (BoNT‐A and occupational therapy )
Refer to Table 14 Both Groups Community based occupational therapy at a minimum frequency of one session every two weeks. An occupational therapy manual with guidelines was developed for the study and sent to participating occupational therapists. The guidelines incorporated activities for upper extremity strengthening and the development of skills for daily living. |
|
| Outcomes | Primary: Quality of Upper Extremity Skills Test. Secondary: Pediatric Evaluation of Disability Inventory; sphygmomanometer measurements of grip strength, modified Ashworth scale for elbow, wrist and thumb extension and forearm supination; and passive elbow and wrist extension, supination and thumb abduction. | |
| Notes | The authors kindly provided mean and SD data for the Quality of Upper Extremity Skills Test. | |
| Risk of bias | ||
| Bias | Authors' judgement | Support for judgement |
| Allocation concealment? | Unclear risk | B ‐ Unclear |
Greaves 2004.
| Methods | Randomised controlled trial comparing BoNT‐A and occupational therapy with occupational therapy only. Blinded outcome assessors for Peabody Developmental Motor Scales ‐ Fine Motor, Quality of Upper Extremity Skills Test, modified Ashworth scale and modified Tardieu scale. Treating therapists not blinded to group allocation. Randomised following baseline assessment using concealed envelopes with an equal number of children being allocated to each group. Allocation concealment not clearly stated. Follow‐up at 6 weeks (modified Ashworth scale, modified Tardieu scale and Goal Attainment Scaling only) and 4 months (all outcome measures). | |
| Participants | 24 children recruited with 2 drop outs before any intervention. One from control group as they wanted BoNT‐A injections and one from treatment group as they re‐considered the appropriateness of BoNT‐A injections for their child. Two further children had not completed their cycle of assessment and intervention at the time of data analysis. 20 children (17 males, 3 females); age range 22 months to 58 months (mean 3yrs, 5mths) (n=10 Treatment, n=10 Control). Eligibility: diagnosed with hemiplegic cerebral palsy whereby spasticity was interfering with functional ability of the upper limb to complete everyday tasks as defined by parent report and physician observation and ability of parents to attend an intensive therapy program. Excluded if child had a fixed, myostatic contracture, previous upper limb surgery, BoNT‐A injections to the upper limb within 6 months, receiving interventions considered to be controversial and the parents would not agree to relinquish these alternative treatments during the trial. | |
| Interventions | Treatment Group (BoNT‐A and occupational therapy )
Refer to Table 14 Both Groups Individualised occupational therapy twice weekly, one hour sessions for 6 weeks (Total number of sessions: Treatment Group = 11.8 (0.4), Control Group = 11.5 (0.5). Therapy provided by non‐blinded study occupational therapist and community occupational therapists. Intervention used goal setting, general training, goal directed training and a home program. Dynamic and static splinting were used. Treatment group received 1.4 (SD 2.3) extra sessions of occupational therapy compared with 0.5 (SD1.1) in the control group between the end of intervention and six week follow‐up. |
|
| Outcomes | Primary: Canadian Occupational Performance Measure and Goal Attainment Scaling. Secondary: Peabody Developmental Motor Scales ‐ Fine Motor, Quality of Upper Extremity Skills Test, modified Ashworth scale and modified Tardieu scale. | |
| Notes | This trial is a component of a larger repeat injection trial (Olesch 2009). The authors kindly provided mean and standard deviation data, including mean change and standard deviation of the mean change. |
|
| Risk of bias | ||
| Bias | Authors' judgement | Support for judgement |
| Allocation concealment? | Unclear risk | B ‐ Unclear |
Kawamura 2007.
| Methods | Double‐blind, randomised controlled trial comparing low dose BoNT‐A with a high dose BoNT‐A. Participants, injectors and outcome assessors were blinded to group assignment. Stratification based on the baseline QUEST score (total score less than 25 or more than 25) was completed to ensure an even distribution of children’s baseline hand function between the two groups. Participants were assigned to either low‐dose or high‐dose group using a computer‐generated randomisation list in blocks of six. Group assignment was provided in sealed envelopes to the nurse preparing the BoNT‐A. The code was revealed to investigators and participants after recruitment, data collection, and analyses had been completed. Follow‐up at baseline, 1 and 3 months after injection. | |
| Participants | 40 children (Lower function QUEST <25 N = 6; Higher function QUEST >25 N = 34) recruited. 40 children randomised (LOW DOSE, LOW FUNCTION n=1; HIGH DOSE, LOW FUNCTION n=5; LOW DOSE, HIGH FUNCTION n = 17; LOW DOSE, HIGH FUNCTION n=17). 1 child excluded from LOW DOSE, HIGH FUNCTION as they received a double high dose of BoNT‐A. No drop‐outs. Mean age 6.2 years (22 male, 17 females) (37 CP; 3 ABI). Eligibility: aged 2 years 6 months to 12 years; diagnosis of spastic hemiplegia or spastic triplegia with single‐arm sparing secondary to CP or acquired brain injury that had occurred at least 2 years before enrolment; passive wrist extension to 20° past neutral with the fingers extended; supination of the forearm to 30° past neutral, extension at the elbow to 170°); at least moderate spasticity (rated as at least 1+ on the modified Ashworth scale in one of thumb adductor, finger flexors, wrist flexors, or elbow flexors); ability to initiate movement in the arm or hand in at least one of active thumb extension, wrist or finger extension, forearm supination, or elbow extension); > 6 months from any previous upper extremity BoNT‐A injections; able to comply with the QUEST testing. Excluded if able to complete a standardized reach and grasp task with full elbow extension, wrist and thumb in a neutral position, and fingers extended on their reach to grasp the object. |
|
| Interventions | Refer to Table 14 Children continued to receive community‐based occupational therapy. This therapy followed guidelines outlined in an occupational therapy treatment manual based on neurodevelopmental and biomechanical principles. The protocol focused on upper extremity strengthening, grading of movements and function in gross motor, fine motor, and self‐care activities, seeking to meet the functional goals set by the child’s family and therapists. |
|
| Outcomes | Quality of Upper Extremity Skills Test, Pediatric Evaluation of Disability Inventory – Functional Skills, Self Care Domain, passive ROM, grip strength, modified Ashowrth scale, Goal Attainment Scaling. | |
| Notes | The authors kindly provided mean and standard deviation data, including mean change and standard deviation of the mean change. | |
| Risk of bias | ||
| Bias | Authors' judgement | Support for judgement |
| Allocation concealment? | Low risk | A ‐ Adequate |
Koman 2007.
| Methods | Double blind, placebo controlled, randomised controlled trial comparing BoNT‐A injections with injections of normal saline. Blinded outcome assessors and injector. Randomised by an independent study nurse using a biostatistician prepared blocked random allocation sequence in consecutively numbered sealed, brown envelopes. Follow‐up at 1, 2, 3, 5 and 6.5 weeks. | |
| Participants | 73 children recruited with 3 drop‐outs. 2 from treatment group (reason unknown) and 1 from placebo group (reason unknown); 70 children (mean age 9 years) (n=36 Treatment, n=34 Control). Eligibility: diagnosed with hemiplegic, diplegic or quadriplegic cerebral palsy; dynamic upper extremity muscle imbalance interfering with physical functioning, activities of daily living, causing discomfort, or compromising caregiver activities. Excluded if had previous BoNT‐A injections, fixed upper limb contractures or joint instability, contraindications to BoNT‐A injection or previous upper extremity musculoskeletal surgery. | |
| Interventions |
Treatment Group (BoNT‐A only)
Refer to Table 14 Control (placebo) Intramuscular injection of saline. Both Groups Continued pre‐study therapy regimen. |
|
| Outcomes | Upper Extremity Rating Scale, The Melbourne Assessment of Unilateral Upper Limb Function (modified), RAND‐36 (subscales), Impact on Family Scale and Functional Independence Measure for children (WeeFIM). Severity of cerebral palsy classified according to a modified House Classification. | |
| Notes | The authors kindly provided mean and standard deviation data, including mean change and standard deviation of the mean change. WeeFIM data only data to be included in meta‐analysis. | |
| Risk of bias | ||
| Bias | Authors' judgement | Support for judgement |
| Allocation concealment? | Low risk | A ‐ Adequate |
Lowe 2006.
| Methods | Randomised controlled trial comparing BoNT‐A and occupational therapy with occupational therapy only. Blinded outcome assessors for Quality of Upper Extremity Skills Test, Canadian Occupational Performance Measure and Goal Attainment Scaling. Treating therapists not blinded. Randomised by an independent officer prior to baseline assessment using computer generated random allocation sequences in numbered sealed envelopes. Follow‐up at 1, 3 and 6 months. Intention to treat analysis undertaken. | |
| Participants | 43 children recruited with 1 drop out from control group because of travel difficulties. 42 children (31 males, 11 females); age range 2 to 8 years (mean 4y (SD 1.6) (n=21 Treatment, n=21 Control). GMFCS level I. Eligibility: diagnosed with hemiplegic cerebral palsy; presence of spasticity scoring at least 2 on the Ashworth Scale interfering with functional movement; at least 10 degrees active range of movement in antagonistic muscle during use; volitional limb use observed by both parent and investigator when instructed to play bilaterally; access to occupational therapy after baseline assessment; and parental agreement to participate in a home program. Excluded if had lower limb BoNT‐A in the past 6 months; upper limb BoNT‐A in the past 12 months; upper limb fixed contracture greater than 40 degrees; lack of sensory response to light touch or pain affected limb; child refused or was unable on 100% of occasions to demonstrate volitional upper limb movement in response to parent or investigator instructions and parent confirmed that this was consistent with their upper limb use at home. | |
| Interventions | Treatment Group (BoNT‐A and occupational therapy )
Refer to Table 14 Both Groups Occupational therapy from the same occupational therapist. Frequency and intensity not reported. Treatment, driven by the family, included a suite of intervention offered by the therapist including functional training, strengthening, splinting, casting and motor learning. Individualised family goals with mutually agreed levels of attainment were used to guide treatment. Individualised home programmes were developed with the family to implement in goal‐relevant contexts of home or school/pre‐school. |
|
| Outcomes | Primary: The dissociated movement and grasp domains of the Quality of Upper Extremity Skills Test. Secondary: Canadian Occupational Performance Measure, Pediatric Evaluation of Disability Inventory ‐ self care functional skills and self care caregiver assistance sections, Goal Attainment Scaling, Ashworth scale (elbow flexors, pronators, wrist flexors, wrist extensors, finger flexors, finger flexors, wrist extensors, finger flexors, thumb adductor, thumb opponens, thumb flexors). | |
| Notes | The authors kindly provided mean and standard deviation data, including mean change and standard deviation of the mean change. | |
| Risk of bias | ||
| Bias | Authors' judgement | Support for judgement |
| Allocation concealment? | Low risk | A ‐ Adequate |
Russo 2007.
| Methods | Randomised controlled trial comparing BoNT‐A and occupational therapy with occupational therapy only. Blinded rater for all outcome assessors except for modified Tardieu and modified Ashworth scales. Treating therapists were blind to group allocation. Randomised in blocks of 10 by an independent officer using a computer‐generated table of random numbers. Allocation was concealed using sealed, opaque, foil lined envelopes. Follow‐up at 1 month (Assessment of Motor and Process Skills, Goal Attainment Scaling, pain scale), 3 and 6 months. | |
| Participants | 43 children recruited (23 male, 20 female; mean age 8.6 years) with 3 drop‐outs (n=21 Treatment, n=22 Control). Two children in the OT group did not receive therapy and one child in the BoNT‐A/occupational therapy group refused intervention. All 43 recruits were included in an intention to treat analysis. Eligibility: children aged 3 to 16 years diagnosed with hemiplegic cerebral palsy, registered on the South Australian Cerebral Palsy register, elbow extension to neutral, wrist extension to 30 degrees past neutral with fingers extended, supination of the forearm to 30 degrees past neutral, thumb extension to neutral, ability to initiate movement of the fingers, tone on a modified Ashworth scale ≥ 2/4 at the elbow or wrist. Excluded if they had BoNT‐A injection in the upper limb up to one year prior to the study and in the lower limb up to six months prior to the study. | |
| Interventions | Treatment Group (BoNT‐A and occupational therapy )
Refer to Table 14 Both Groups Weekly occupational therapy sessions for 4 weeks. The focus of each therapy session was on upper extremity weightbearing, balls skills, fine motor strengthening (through the use of resistive putty‐based activities) and bilateral functional activities (which included activities assisting finger agility and dexterity). |
|
| Outcomes | Primary: Assessment of Motor and Process Skills, Goal Attainment Scaling. Secondary: modified Ashworth Scale, modified Tardieu Scale, The Self Perception Profile for Children (older children), The Pictorial Scale of Perceived Competence and Social Acceptance for Young Children, Pediatric Evaluation of Disability Inventory ‐ Self care domain, Pediatric Quality of Life Scale, pain scale and subjective function and cosmesis rating. | |
| Notes | The authors kindly provided mean and standard deviation data, including mean change and standard deviation of the mean change. | |
| Risk of bias | ||
| Bias | Authors' judgement | Support for judgement |
| Allocation concealment? | Low risk | A ‐ Adequate |
Speth 2005.
| Methods | Randomised controlled trial comparing BoNT‐A and occupational therapy/physiotherapy with occupational therapy/physiotherapy only. Blinded rater for one primary outcome (Melbourne Assessment). Treating therapists were not blinded to group allocation. Children were matched by age and Zancolli classification. One child of every pair was random allocated to either BoNT‐A or control group. The other child was automatically assigned to the other group. Allocation concealment was maintained using opaque envelopes and using an independent officer to select the envelope. Follow‐up at 2 and 6 weeks and 3, 6 and 9 months. | |
| Participants | 20 children (11 male, 9 female; aged 4 to 16 years) (n=10 Treatment, n=10 Control). There were no drop‐outs. Eligibility: diagnosed with hemiplegic cerebral palsy and minimum developmental age of 3 years. Excluded if contractures present (30 degrees or more for elbow and wrist extension and supination) and severe impairment of hand function and unable to initiate voluntary movement (Zacolli III). | |
| Interventions | Treatment Group (BoNT‐A and occupational therapy/physiotherapy)
Refer to Table 14 Both Groups 30 minutes physiotherapy and 30 minutes occupational therapy three times a week for 6 months. A treatment protocol including strength and coordination and task specific training was made for each level of hand function impairment (Zancolli grade). This was tailored to the individual child based on individual goal setting and clinical reasoning. All children wore a night splint. During the day children with Zancolli IIB wore a cock‐up splint almost all day. Children with less impairment used a wrist cock‐up splint or web‐space splint only during specific activities. |
|
| Outcomes | Active ROM wrist extension; thumb abduction and supination; Ashworth scale; Pediatric Evaluation of Disability Inventory (PEDI) raw score (complete at baseline and 6 months, self care component all other times); Melbourne Assessment; 9 hole peg test and subjective judgements by child and parent. | |
| Notes | The authors kindly provided mean and standard deviation data, including mean change and standard deviation of the mean change. | |
| Risk of bias | ||
| Bias | Authors' judgement | Support for judgement |
| Allocation concealment? | Low risk | A ‐ Adequate |
Wallen 2007.
| Methods | Randomised controlled trial comparing BoNT‐A/occupational therapy, occupational therapy only, BoNT‐A only and no treatment. Blinded rater for quality of upper limb function outcome measures only (Melbourne Assessment and Quality of Upper Extremity Skills Test). Children were randomly allocated in blocks of 16 into 4 groups: occupational therapy plus BoNT‐A, BoNT‐A alone, occupational therapy alone and a no‐treatment group. Group allocation was drawn by a third party from a large envelope containing 16 sealed envelopes. Follow up at 2 weeks (Melbourne Assessment, Quality of Upper Extremity Skills Test, modified Tardieu, PROM, Parent Questionnaire only), 3 and 6 months. | |
| Participants | 80 children recruited and randomised with 8 children dropping out prior to baseline assessment. See notes for reason for drop‐outs. 72 children (46 male, 26 female); age range 2 to 14 years (mean 5 yrs 11mths (SD 3yrs 2mths) (n=20 BoNT‐A/occupational therapy, n=20 BoNT‐A alone, n=17 occupational therapy alone, n=15 Control); 46% hemiplegia, 39% quadriplegia, 15% triplegia. Eligibility: Spastic cerebral palsy affecting one or both upper limbs; modified Ashworth score of 2 or 3 (moderate to significant muscle tone) in at least one muscle group of the injected limb; goals identified by the family which were related to the injected limb (e.g. improve function, hygiene, splint tolerance or limb positioning) and; stable spasticity management intervention (e.g. therapy, splints, medications) for at least 6 weeks before trial commencement. Excluded if had significant contractures at the elbow, wrist or fingers which interfered with completing daily activities as determined subjectively with the family, absence of movement and fluctuating muscle tone in the injected limb. | |
| Interventions | BoNT‐A intervention Refer to Table 14 Occupational therapy intervention One week after baseline assessment children received 1 hour a week of occupational therapy for 12 weeks. Therapy was provided by the children's usual occupational therapist or at the The Children's Hospital at Westmead. Therapy programs were individualised and included techniques to improve impairment (e.g. stretching, casting, splinting) and enhancing activities (e.g. motor training, environmental modification and practice of specific goal activities). |
|
| Outcomes | Primary: Canadian Occupational Performance Measure, Goal Attainment Scaling. Secondary: The Melbourne Assessment of Unilateral Upper Limb Function, Quality of Upper Extremity Skills Test, Pediatric Evaluation of Disability Inventory, Australian Authorised Adaptation of the Child Health Questionnaire, modified Tardieu Scale, passive Range of Movement, Parent Questionnaire. | |
| Notes | The authors kindly provided mean change and standard deviation of the mean change data. | |
| Risk of bias | ||
| Bias | Authors' judgement | Support for judgement |
| Allocation concealment? | Low risk | A ‐ Adequate |
Characteristics of excluded studies [ordered by study ID]
| Study | Reason for exclusion |
|---|---|
| Alahmar‐Bianchin 2007 | Not a randomised controlled trial |
| Arens 1997a | Not a randomised controlled trial |
| Arens 1997b | Not a randomised controlled trial |
| Autti‐Ramo 2000 | Not a randomised controlled trial |
| Autti‐Ramo 2001 | Not a randomised controlled trial |
| Chait 2002 | Not a randomised controlled trial |
| Chin 2003 | Not a randomised controlled trial |
| Chin 2005 | Not a randomised controlled trial |
| Delgado 2006 | Not a randomised controlled trial |
| Densilic & Meh 1995 | Not a randomised controlled trial |
| Desloovere 2007 | Not a randomised controlled trial |
| Fasoli 2008 | Not a randomised controlled trial |
| Freidman 2000 | Not a randomised controlled trial |
| Gibson 2007 | Not a randomised controlled trial |
| Gooch 1996 | Not a randomised controlled trial |
| Hoare 2004 | Literature Review |
| Hurvitz 2000 | Not a randomised controlled trial |
| Hurvitz 2003 | Not a randomised controlled trial |
| Johnstone 2007 | Not a randomised controlled trial |
| Keren‐Capelovitch 2007 | Lower limb BoNT‐A injections measuring change in upper limb |
| Kim 2001 | Not a randomised controlled trial |
| Kolaski 2008 | Not a randomised controlled trial |
| Lowe 2007 | Not a randomised controlled trial |
| Mackey 2006 | Not a randomised controlled trial |
| Mall 1997 | Not a randomised controlled trial |
| O'Flaherty 2003 | Not a randomised controlled trial |
| Park 2006 | Not a randomised controlled trial |
| Reeuwijk 2006 | Literature Review |
| Romanini 2000 | Not a randomised controlled trial |
| Rosblad 2007 | Not a randomised controlled trial |
| Sanger 2007 | Not a randomised controlled trial |
| Satila 2006 (a) | Not a randomised controlled trial |
| Satila 2006 (b) | Not a randomised controlled trial |
| Wall 1993 | Not a randomised controlled trial |
| Waugh 2000 | Not a randomised controlled trial |
| Wong 2002 | Not a randomised controlled trial |
| Yang 2003 | Not a randomised controlled trial |
Characteristics of studies awaiting assessment [ordered by study ID]
Gibson 2009.
| Methods |
Title: Preliminary results of using Botulinum Toxin A in the treatment of upper limb spasticity in children with cerebral palsy Design: Randomised controlled trial Method: Allocation concealment using numbered containers. Children were stratified by age within 6 months and within 10% of initial upper limb functional score as measured by the QUEST prior to randomisation. Outcome assessors blinded to group allocation. |
| Participants | 8 to 16 years, hemiplegia due to cerebral palsy, spasticity |
| Interventions | Intramuscular injection of botulinum toxin A (BoNTA) to selected upper limb muscles at 0.5‐2u/kg/body weight followed by resistance training at the peak effect of the BoNTA (6 weeks post injection). Resistance training consists of selected weighted exercises at 80% of 1 repetition maximum, repeated 5 days a week for 6 weeks with weight progressed weekly. |
| Outcomes | Primary outcome: Quality of Upper Extremity Skills Test
Secondary outcomes: Jerk analysis and mapping of corticomotor pathways using transcranial magnetic stimulation All outcomes measured at baseline, 6 weeks, 3 months and 6 months after randomisation |
| Notes | Name:Noula Gibson
Address:GPO Box D 184
Perth WA 6840
Country:Australia
Tel:08 93408503
Fax:08 9340 8001
Email:noula.gibson@health.wa.gov.au Gibson, N., Valentine, J., Pearce, A., Love, S., Chauvel, P., Blair, E. Preliminary results of using Botulinum Toxin A in the treatment of upper limb spasticity in children with cerebral palsy. In: 5th National Paediatric Physiotherapy Conference. Vol. 50. Perth: Australian Journal of Physiotherapy (Suppl), 2003:S4‐S5. [Other: http://ajp.physiotherapy.asn.au/AJP/50‐2/AustJPhysiotherv50i2Abstracts.pdf] |
Kanellopoulos 2009.
| Methods |
Title: Long lasting benefits following the combination of static night upper extremity splinting with botulinum toxin A injections in cerebral palsy children. Aim: Botulinum toxin A injections and orthotics have been used to manage upper extremity spasticity in hemiplegic children. The authors performed a study to evaluate the necessity and effectiveness of a static night splint following outpatient botulinum toxin‐A treatment in children with upper limb spastic cerebral palsy. Outcome Measures: QUEST at baseline, at 2 and 6 months post injection. |
| Participants | Twenty children with upper limb spastic cerebral palsy |
| Interventions | A static night splint was applied in half of them. |
| Outcomes |
Results: After botulinum toxin A treatment, both groups showed an improvement on their previous functional level of the injected upper extremity. At 2 months, children in group A showed a 15.4% improvement, whereas children in group B improved by 12.2% from baseline; these were not statistically significant (P=0.326). At 6 months, group A still maintained a 15.9% improvement in function compared to group B which differed only by 4.2% from pre botulinum toxin A baseline; these differences were statistically significant (P=0.001). Complications related to the botulinum toxin A injection were not observed. The static night upper extremity splints have been well tolerated by the hemiplegic children. Authors Conclusions: Static night splinting following botulinum toxin A injections has shown a definite treatment effect in reducing spasticity and improving function in children with upper limb spastic cerebral palsy. |
| Notes |
Olesch 2009.
| Methods |
Title: A randomised controlled trial of repeat injections of Botulinum toxin‐A in the upper extremity of young children with cerebral palsy. Objective: This study evaluated the effectiveness of repeated injections of botulinum toxin A (BoNT‐A in the hemiplegic upper limb in children with cerebral palsy combined with occupational therapy (OT) compared to OT alone, regarding goal achievement, occupational performance and quality of movement. Design: Single blinded, randomised controlled trial. Data Analysis: Analyses of between‐group differences were undertaken using independent samples t‐tests with alpha set at 0.05 |
| Participants | Twenty‐four children aged 18 months to 5 years were recruited. Two children did not complete the trial. Allocation to group was concealed from researchers. |
| Interventions | Intervention occurred in three 16‐week cycles and included BTX‐A injections followed by twice weekly OT for 6 weeks. The control group (Co) received twice weekly OT alone. Both groups returned to their usual OT until each 4‐month cycle was completed. |
| Outcomes | Primary outcomes included the Canadian Occupational Performance Measure (COPM), Goal Attainment Scale (GAS) measured at baseline and 4 monthly intervals to 12 months. Secondary outcomes included the Peabody Developmental Fine Motor Scale (Peabody), Quality of Upper Extremity Skills Test (QUEST) and measures of spasticity and were rated by assessor blind to group allocation. Results: Nineteen boys and 3 girls participated (mean age=3.7 years [SD=0.9]). There was no evidence of differences between the groups in number of boys (treatment group=9, control group=10), mean age (treatment=3.7 years, control=3.7 years), side of hemiplegia (right side: treatment=6, control=7), or baseline Peabody score (standardized score: treatment=503.6, control=502.6). All children were in GMFCS levels I or II. While children in both groups improved COPM performance and satisfaction scoresat the end of each treatment cycle, only the treatment group’s mean change was greater than the 2 points identified as clinically important. At the end of the second and third cycle of intervention there was evidence that children in the treatment group had higher COPM performance scores than the control group (second cycle mean difference=–0.88, 95% CI –1.73 to –0.03; third cycle mean difference=–1.43, 95% CI –2.56 to –0.30). In general, children in both groups achieved their GAS goals. There was no evidence of significant differences between the groups on the Peabody or the QUEST at 12 months. Authors Conclusion: Goal achievement was evident in both groups, though clinically and statistically, greater performance and satisfaction was achieved by the treatment group by the second and third cycles. |
| Notes | Abstract presented at The Australasian Academy of Cerebral Palsy & Developmental Medicine (2008) Greaves, S., Olesch, C., Imms, C., Reid, S., Reddihough, D., Graham, H. K. A randomised controlled trial of repeat injections of Botulinum toxin A in the upper extremity of young children with cerebral palsy. Developmental Medicine and Child Neurology 2008;50(suppl. 113):6. Abstract presented at The American Academy of Cerebral Palsy & Developmental Medicine (2008) Olesch, C., Greaves, S., Imms, C., Reid, S., Reddihough, D., Graham, H. K. A randomised controlled trial of repeat injections of Botulinum toxin A in the upper extremity of young children with cerebral palsy. Developmental Medicine and Child Neurology 2008;50(s4). |
Pearse 2009.
| Methods |
Title: Botulinum toxin injection of biceps brachii significantly increases the efficacy of occupational therapy in hemiplegic cerebral palsy: a randomised, double blinded, placebo controlled study. Hypothesis: Spasticity in biceps brachii contributes significantly to a reversible ‘never learned to use’ component of the impairment of upper limb control in hemiplegic cerebral palsy. Objective: To evaluate whether reduction in spasticity of biceps brachii by Botulinum toxin A injection (BoNT‐A) improves the efficacy of occupational therapy for the paretic arm and hand. Method: Ethical approval and informed parental and child consent were obtained. Randomised, double blinded, placebo controlled study. Outcome Measures: The primary outcome was the Melbourne Assessment of Unilateral Upper Limb Function (Melbourne Assessment); secondary outcomes were grip strength, adapted Nine Hole Pegboard Test, and the Canadian Occupational Performance Measure (COPM). Assessments were made at baseline before injections and at 3 and 6 months after injection (COPM baseline and 6 months only). Data Analysis: Statistical analysis was by repeated measures ANCOVA with age as a covariate. |
| Participants | 50 children (27 males, 23 females; age 4–17 years) were randomised to BoNT‐A or placebo injection groups, controlling for age, sex, hemiplegic side, and degree of impairment. |
| Interventions | All participants received an individually‐tailored occupational therapy programme promoting bimanual dexterity through the use of motivating games. |
| Outcomes |
Results: Both groups showed increased Melbourne Assessment (p=0.025), Nine Hole Peg Board (p=0.047), and COPM (p<0.001) scores and increased grip strength (p=0.021) for the paretic arm over the 6 months. The rate of increase was significantly greater for the BoNT‐A group regarding Melbourne Assessment (p=0.023) and Peg Board (p=0.035) scores. Authors Conclusion: The use of BoNT‐A injections to reduce spasticity in biceps brachii, significantly increases the efficacy of occupational therapy for the paretic arm and hand in hemiplegic cerebral palsy. |
| Notes | Oral presentation at the European Academy of Childhood Disability Conference (2008) and International Cerebral Palsy Conference (2009). Pearse, J., Gibson, M., Eyre, J. Botulinum toxin injection of biceps brachii significantly increases the efficacy of occupational therapy in hemiplegic cerebral palsy: a randomised, double blinded,placebo controlled study. Developmental Medicine and Child Neurology 2008;50(Suppl. 114):23. Pearse, J., Eyre, J. A., Gibson, M. Botulinum toxin injection of biceps brachii significantly increases the efficacy of occupational therapy in hemiplegic cerebral palsy: a randomised, double blinded, placebo controlled study. Developmental Medicine and Child Neurology 2009;51 (Suppl. 2):13. |
Rameckers 2009.
| Methods |
Title: Long‐term effect of standardized functional therapy versus botulinum toxin‐A and standardized functional therapy on manual isometric force generation in children with congenital spastic hemiplegia. Objectives: To investigate the short‐term and long‐term effect of standardized functional therapy and the additional effect of botulinum toxin‐A (BoNT‐A) and standardized functional therapy on manual isometric force generation in children with congenital spastic hemiplegia. Design: A single, blinded randomized controlled trial. |
| Participants | Twenty children (age range 4–16y, mean age 9y 6mo) completed a 6‐month intensive therapy programme. Matching was performed according to age and Zancolli Levels I and II. After randomization, 10 children received multilevel BoNT‐A in the upper limb. A rehabilitation‐based functional therapy programme was performed three times per week. |
| Interventions | Method: Isometric manual force generation was measured with a finger and wrist flexor isometric force task. Outcome measures of the isometric force task were maximal generated flexor force (MGF), generated force (GF), and over‐ or undershoots over a large range of force levels (12–60% of the MGF). Clinical outcome measures were active and passive range of motion (ROM), stretch restricted angle, and Ashworth scores of elbow and wrist. Measurements were performed at baseline, 2 weeks after BoNT‐A, 3 and 6 months (end of therapy), and 3 months after termination of the therapy. Participants completed the 6‐month therapy programme according to the therapy protocol, based on motor learning principles, strength training principles, and principles of muscle mobilization. Botox from Allergan was used (dilution 5 /0.1ml). |
| Outcomes |
Results: A trend of changes was seen for active ROM of wrist. GF decreased directly after the BoNT‐A injection. Increase of GF occurred during the therapy period. The therapy group showed a higher increase during the therapy period (F(4,72)=3.80, p=0.007) compared with the therapy and BoNT‐A group. The therapy and BoNT‐A group only showed undershoots during total therapy period. The therapy group changed from a small amount of undershoots to a small amount of overshoots at the end of the therapy period
(F(4,72)=1.39, p=0.002). Authors Conclusions: This research demonstrates that manual isometric flexor force increases by standardized functional therapy during a therapy period of 6 months. After BoNT‐A a reduced muscle force was seen, but increase occurred during therapy. Furthermore, a continuous amount of undershoots can be seen in the therapy and BoNT‐A group, whereas the therapy group showed a change from undershoots to a small amount of overshoots. Measurement of maximal muscle strength and the possibility to generate the force in simple isometric manual force tasks has to be taken into account in the clinical decision for the use of BTX‐A. |
| Notes | Rameckers, E. A. A., Speth, L. A. W. M., Duysens, J., Vles, J. S. H., Smits‐Engelsman, B. C. M. Long‐term effect of standardized functional therapy versus botulinum toxin‐A and standardized functional therapy on manual isometric force generation in children with congenital spastic hemiplegia. Developmental Medicine and Child Neurology 2007;49(Suppl. 111):6. |
Redman 2008(a).
| Methods |
Title: Effect of upper limb botulinum toxin‐A therapy on health‐related quality of life in children with hemiplegic cerebral palsy. Hypothesis: Currently, the use of upper limb BoNT‐A is based on evidence of functional efficacy without supporting evidence of positive change in health‐related quality of life (HRQOL). While function may improve, this cannot be directly correlated with an improvement in HRQOL. Objective: To study the effect of UL BoNT‐A therapy on HRQOL in children with hemiplegic cerebral palsy (CP) Method: Pilot prospective randomised trial. Participants were randomised into treatment and non‐treatment (control) groups using non‐marked sealed envelopes. Outcome Measures: HRQOL assessed at baseline, and 1, 3 and 6 months post‐injection by completion of Pediatric Quality of Life (PedsQL) 4.0 Generic Core Scales and PedsQL 3.0 CP Module. Outcome: 1. Change in PedsQL scores. 2. Concordance between child self‐report and parent proxy‐report scores. Data Analysis: The treatment and control groups were compared at baseline. Student’s t‐tests were performed to compare age and function, and Fisher’s exact test was performed to compare gender. The concordance between PedsQL child self‐report and parent proxy‐report scores was determined through Spearman correlation coefficients (SCCs). Intraclass correlations (ICCs) were designated as follows: <0.40 poor to fair agreement, 0.41– 0.60 moderate agreement, 0.61–0.80 good agreement and 0.81–1.00 excellent agreement. Statistical significance was inferred with a P‐value <0.05. |
| Participants | 22 children with hemiplegic CP aged 7 years 0 month‐13 years 11 months (12 treatment, 10 control). |
| Interventions | All participants received community‐based physiotherapy and occupational therapy for the duration of the study as is current best practice for spasticity management. Treatment protocol Twelve participants in the treatment group received one series of intramuscular injections of BoNT‐A at the commencement of the study. The dosage of BoNT‐A was 0.5–2 U/kg body weight/UL muscle group, with a maximum dosage of 12 U/kg body weight inclusive of lower limb BoNT‐A administered. UL muscle selection for injection was individualised based on a review of a videotape of a functional assessment (Quality of Upper Extremities Skills Test). |
| Outcomes | No statistically significant difference between treatment and control groups was observed for any domain of HRQOL. Intraclass concordance was good for the PedsQL CP Module Daily Activities, and Speech and Communication scores (P = 0.0005). Authors conclusions: This pilot work adds to the emerging evidence that UL BoNT‐A therapy has no statistically significant effect on the HRQOL of children with hemiplegic CP. With the increasing use of this therapy in children with CP, further research across the broader CP population is needed to identify whether this therapy is indicated in other target populations. Both child and parent proxy reports should be collected when assessing HRQOL in this population.. |
| Notes | This study was a component of the trial: Redman, T. A., Finn, J. C., Bremner, A. P., Valentine, J. Effect of upper limb botulinum toxin‐A therapy on health‐related quality of life in children with hemiplegic cerebral palsy. Journal of Pediatrics and Child Health 2008;44(7‐8):409‐14. [DOI: 10.1111/j.1440‐1754.2008.01319.x] |
Redman 2008(b).
| Methods |
Title: Upper limb corticomotor projections and physiological changes that occur
with botulinum toxin‐A therapy in children with hemiplegic cerebral palsy. Hypothesis: BoNT‐A is being increasingly used as a lower limb spasticity management tool in CP. While there is increasing evidence of its efficacy for upper limb spasticity, little is known about the mechanisms underlying any improvement in motor function. It is likely there are changes at the neuromuscular level as well as adaptive changes in the central nervous system. Objective: To investigate the corticomotor projection to the upper limb in children with hemiplegic cerebral palsy (CP) and the changes that occur with BoNT‐A. Method: Pilot prospective randomized trial Outcome Measures: Transcranial magnetic stimulation (TMS) was performed at baseline, and 1, 3 and 6 months post‐injection. Outcome measures were: change in position of affected and unaffected side first dorsal interosseous optimal site of stimulation (OPTx). Data Analysis: |
| Participants | Twenty‐two children with hemiplegic CP aged 7 years to 13 years 11 months were recruited. |
| Interventions | Treatment group (12) received one series of BoNT‐A injections into the upper limb. Control group (10) did not receive upper limb BoNT‐A. All participants except one treatment group participant also received lower limb BoNT‐A. |
| Outcomes | Results: A shift in affected and unaffected side OPTx was observed for both treatment and control groups, and there was no statistically significant difference between groups at 1, 3 or 6 months. Poor tolerance of TMS cortical stimuli >80% was observed. Authors Conclusions: Corticomotor projections associated with the upper limb in children with hemiplegic CP show significant variability over a 6‐month period. This variability may reflect central motor reorganization because of systemic BoNT‐Aeffect or developmental changes. Upper limb BoNT‐A therapy is associated with reorganization of both affected and unaffected projections. Poor tolerance of the TMS procedure, in conjunction with higher cortical thresholds, may limit the usefulness of TMS as an investigatory tool in young children with movement disorders. |
| Notes | This study was a component of the trial: Redman, T. A., Finn, J. C., Bremner, A. P., Valentine, J. Effect of upper limb botulinum toxin‐A therapy on health‐related quality of life in children with hemiplegic cerebral palsy. Journal of Pediatrics and Child Health 2008;44(7‐8):409‐14. [DOI: 10.1111/j.1440‐1754.2008.01319.x] |
Characteristics of ongoing studies [ordered by study ID]
Ben‐Pazi 2008.
| Trial name or title | Improvement After Botulinum Toxin Injections to the Arms in Children With Cerebral Palsy |
| Methods | Method: Twenty cooperative quadriplegic CP children ages 8‐11 years, gross motor function level 4, will be enrolled for the study. Inclusion criteria will be troublesome hypertonia that will respond to treatment with Botox® (BoNT‐A) (as identified by clinical assessment and neurophysiological measures). Since cooperation is crucial for the intensive therapy children with cognitive impairment (IQ<70) or severe behavioural disorders will be excluded. The children will be randomized to one of two groups a BoNT‐A group (BG) and a control group (CG). CG children will undergo a program of intensive therapy and BG children will be given BoNT‐A, as clinically required, in addition to an equivalent program of intensive therapy. BoNT‐A injection will be tailored according to the specific child. Generally injection site will include biceps and brachioradialis , while flexors of the wrist and digits will be injected according to abnormal postures during function. Maximal total dose will be 23 IU per kg. The intensive therapy will be as clinically required and the therapy program will be fully documented. |
| Participants | Estimated Enrollment: 20 Ages Eligible for Study: 8 Years to 11 Years Genders Eligible for Study: Both Accepts Healthy Volunteers: No Inclusion Criteria: cooperative quadriplegic CP children gross motor function level 4 troublesome hypertonia that will respond to treatment with BoNT‐A Exclusion Criteria: cognitive impairment (IQ<70) severe behavioural disorder |
| Interventions | Arms Assigned Interventions
BG: Experimental
cooperative quadriplegic CP children ages 8‐11 years, gross motor function level 4 with troublesome hypertonia that will respond to treatment. BG children will be given BoNT‐A, as clinically required, in addition to an equivalent program of intensive therapy Other: Botulinum Toxin A and physiotherapy BG children will be given Botox, as clinically required, in addition to an equivalent program of intensive therapy. BoNT‐A injection will be tailored according to the specific child. Generally injection site will include biceps and brachioradialis, while flexors of the wrist and digits will be injected according to abnormal postures during function. Maximal total dose will be 23 IU per kg. CG control group: Twenty cooperative quadriplegic CP children ages 8‐11 years, gross motor function level 4 with troublesome hypertonia that will respond to treatment.CG children will undergo a program of intensive therapy. Other: physiotherapy CG children will undergo a program of intensive physiotherapy |
| Outcomes | Outcome measures will include the following: Hypertonia‐ neurophysiological measures Impairment measures ‐ Grip and Pinch strength, active and passive range of motion at the writs elbow and shoulder Upper extremity function ‐ Quality of Upper Extremity Skills Test (QUEST), Box and Blocks test Function and patient needs assessment ‐ Goal Attainment Scaling, Developmental Fine Motor Scale, Pediatric Evaluation and Disability Inventory (PEDI) Quality of life scales (care and comfort hypertonicity questionnaire) All of these measures will be taken once before treatment and then repeated at 7 months, and at 13 months after treatment. |
| Starting date | Study Start Date: September 2007 Estimated Study Completion Date: September 2009 |
| Contact information | Contact: Hilla Ben‐Pazi, MD 972‐2‐6666641 benpazi@szmc.org.il Locations Israel Shaare Zedek Medical Center Recruiting Jerusalem, Israel, 91031 Contact: Hilla Ben‐Pazi 972‐2‐6666641 benpazi@szmc.org.il Sub‐Investigator: Nava Gelkop |
| Notes |
Hoare 2008.
| Trial name or title | A randomised controlled trial to evaluate the effect of modified constraint induced movement therapy or conventional occupational therapy following injection of botulinum toxin‐A to improve bimanual performance in children with hemiplegic cerebral palsy. |
| Methods | Target sample size:40 Randomised controlled trial Allocation concealed using a set of random numbers which will be used to create a sequence contained in individual opaque envelopes for use by the researcher. As participants are recruited, the next envelope in the sequence is opened and the participant assigned to the stated group. Subjects are block randomised matched by age (+/‐ 6 months) using a computer generated set of random numbers. Blinding: Outcome assessors and scorers are blind to group allocation Assignment:Parallel |
| Participants | Key inclusion criteria: Diagnosis of spastic hemiplegic cerebral palsy; active movement of the shoulder, elbow, wrist, digits and thumb; able to grasp a 1 inch cube from a table top and release it into a large container; ability to attend to tasks and follow simple one stage commands; moderate levels of muscle tone and spasticity; no fixed contracture in target group of muscles to be injected with Botulinum toxin‐A. Minimum Age:18 Months Maximum Age:6 Years Gender:Both males and females Key exclusion criteria: Previous Botulinum toxin‐A injections in the upper limb in the past twelve months; prior upper limb surgery (ie. tendon transfer/tendon lengthening); families do not agree to cease all other alternative upper limb therapies. |
| Interventions | Study Group Upper limb injections of Botulinum toxin‐A & modified Constraint Induced Movement Therapy using a neoprene mitt for 3 hours per day for 2 months. Comparator / control treatment Control Group ‐ Upper limb injections of Botulinum toxin‐A & conventional Occupational Therapy for 2 months. |
| Outcomes | Primary Outcome: Assisting Hand Assessment Secondary outcomes: Quality of Upper Extremity Skills Test (QUEST), modified Tardieu scale, modified Ashworth scale, passive Range of Movement, Pediatric Evaluation of Disability Index (PEDI), Pediatric Motor Activity Log (PMAL), Canadian Occupational Performance Measure (COPM), Goal Attainment Scaling (GAS). Timepoint: Baseline, 1 month, 3 months and 6 months post Boutlinum toxin injection. |
| Starting date | 7/07/2003 |
| Contact information | Brian Hoare
Monash Medical Centre 246 Clayton Road Clayton VIC 3168 Country: Australia Tel:+61 3 95942270 Fax:+61 3 95946444 Email:brian.hoare@southernhealth.org.au |
| Notes |
Sholas 2008.
| Trial name or title | Randomized Double Masked Placebo Controlled Study of Upper Extremity Function with Botulinum Toxin A (BoNT‐A) |
| Methods | The objective of this study is to learn whether Botulinum Toxin (BoNT‐A) can reduce increased tone in the arms. |
| Participants | Age between 5 and 15 years Diagnosis of hypertonia/dystonia from CNS dysfunction Hemiplegic, Triplegic, or Quadriplegic Spasticity present that interferes with arm function GMFC II, III, IV Modified House Classification of 2, 3, 4, 5 On stable spasticity medications Can follow commands with 90% accuracy |
| Interventions | Not available |
| Outcomes | Not available |
| Starting date | Not available |
| Contact information | Dr. Deborah Gaebler‐Spira or Dr. Maurice Sholas at 312.238.1149. |
| Notes |
Speth 2008.
| Trial name or title | Effect of botulinum toxin A injections and specific intensive rehabilitation therapy in children with hemiparetic cerebral palsy on upper limb functions and skills |
| Methods | This study will take place in three hospitals in the Netherlands: University Hospital Maastricht (Franciscusoord Valkenburg), Maartenskliniek Nijmegen Hospital and Free University Medical Centre (Vrije Universiteit Medisch Centrum [VUMC]) Amsterdam.
Research question:
What is the effect of Botulinum toxin A (BoNT‐A) injections (B), an intensive physical and occupational therapy program aimed at improving arm function and skills (C), or a combination of both (A) and (B), on arm function, bimanual skills and use of the affected arm, in children with hemiparetic cerebral palsy, relative to the course in such children who receive usual care (D)? Ethics approval Ethics approval received from the Medical Ethics Committee of the Meuse Hospital (Medisch Ethische Toetsingscommissie Atrium MC‐Maaslandziekenhuis) on the 27th July 2006. This trial is also registrated at the Centrale Commissie Mensgebonden Onderzoek (CCMO) Central Committee for Research Involving Human Subjects (https://toetsingonline.ccmo.nl) (ref: NL12005.096.06). Study design Randomised controlled trial |
| Participants | Participants ‐ inclusion criteria 1. Aged 2.5 ‐ 12 years, either sex 2. Cerebral palsy 3. Hagberg diagnosis: spastic hemiparesis or extreme asymmetric diplegia 4. Hand function impairment Zancolli grade I with evident problems in thumb extension and supination, Zancolli grade IIA and IIB 5. Mentally able to comprehend and perform tasks 6. Children and their parents should be able to cope with the intensive rehabilitation therapy programme and the measurement sessions 7. Children and the parents/caregivers should comprehend and speak Dutch 8. Children and their parents indicate the necessity for improvement of the children's abilities Participants ‐ exclusion criteria 1. Severe structural contractures of the muscles at the extremity to be treated: 1.1. Passive elbow extension maximum 160 degrees or less 1.2. Supination maximum 30 degrees or less from neutral position 1.3. Wrist dorsal flexion maximum 20 degrees or less in children aged 2.5 ‐ 6 years, or 45 degrees or less in age group 7 ‐ 12 years 2. Severe impairment of hand function: no active hand function is expected after treatment (Zancolli III) 3. Hand surgery or phenolisation or BoNT‐A injections in the arm less than nine months ago 4. Contraindication for botulinum toxin (muscular diseases such as myasthenia gravis, tetanus vaccination less than three months before the injection, use of aminoglycoside antibiotics or spectinomycine and known hypersensitivity for human albumin) 5. Contraindication for anaesthesia 6. Children who cannot bear touching the affected arm and hand |
| Interventions | Interventions: Group A: BoNT‐A injections (Dysport®) prior to therapy programme and intensive physical and occupational therapy programme Group B: BoNT‐A injections only Group C: Intensive physical and occupational therapy programme Group D: Usual care BtA injections: The most spastic muscles hampering function will be injected. Dysport® dilution: 25 U/0.1 ml, dose 6 ‐ 9 U/kg body weight muscles above elbow, 3 ‐ 6 U/kg body weight muscles in forearm, limited to no more than 150 units (0.6 ml) at any one injection site. In the intrinsic thumb muscles the maximum dose will be 25 U per muscle. A maximum Dysport® dose of 1,000 U per child in total per session will be used. Intensive physical and occupational therapy programme: Participants will receive one hour of ocupational therapy and 30 minutes of physical therapy, twice a week for 12 weeks. |
| Outcomes | Primary outcome measure(s) 1. Assisted Hand Assessment (AHA): original test kit for children 2.5 ‐ 6 years and board game for children 7 ‐ 12 years (T2, T4, T6) 2. A measure of manual ability for children with upper limb impairments (ABILHAND)‐Kids questionnaire (T1 ‐ T6) 3. Canadian Occupational Performance Measure (COPM): establishing treatment goals; Goal Attainment Scaling (GAS) of the most important bimanual treatment goal (T1, T4, T6) 4. Video recording of two fine motor tasks (children 7 ‐ 12 years: buttering and cutting bread, screw construction task; children 2.5 ‐ 6 years: building with 'poppons', threading beads) and one gross motor task (children 2.5 ‐ 6 years: building blocks; children 7 ‐ 12 years: stacking cylinders). These videos will be scored with newly developed and reliability tested Video Observation (VO) criteria (T2, T6). T1 and T2: Baseline T3: 6 weeks after BoNT‐A and start of the therapy program T4: 12 weeks, end of therapy program T5: 18 weeks T6: 24 weeks Secondary outcome measure(s) 1. Wrist and elbow tone and Tardieu Scale or Spasticity Test (SPAT): supine and sitting (T1 ‐ T6) 2. Active and passive range of motion (ROM) of wrist (with fisted hand and with extended fingers), and of elbow and thumb (T1 ‐ T6) 3. Grip strength: E‐link (biometrics®) and functional grip strength (T1 ‐ T6) T1 and T2: Baseline T3: 6 weeks after btA and start of the therapy program T4: 12 weeks, end of therapy program T5: 18 weeks T6: 24 weeks |
| Starting date | 01/01/2008 |
| Contact information | Mrs Lucianne Speth Address Franciscusoord Child Rehabilitation Onderstestraat 29 City/town Valkenburg Zip/Postcode 6301 KA Country Netherlands Tel +31 (0)455 282 615 Fax +31 (0)455 282 120 EmailLSpeth@T‐Online.de |
| Notes |
Contributions of authors
Brian Hoare: literature searching, study selection, development of inclusion/exclusion criteria, trial quality rating, data extraction, data analysis, GRADE rating, review development, and drafting of written submissions.
Margaret Wallen: study selection, quality rating, data extraction, data analysis, review development and drafting of written submissions.
Christine Imms: data extraction, data analysis, GRADE rating, review development, drafting of written submissions.
Leeanne Carey: data analysis, review development, drafting of written submissions.
Barry Rawicki: expert clinical advice, drafting of written submissions.
Elmer Villanueva: data extraction, data analysis, statistical advice.
Declarations of interest
Brian Hoare ‐ In 2002 received a research grant from Allergan Australia to conduct an ongoing randomised controlled trial evaluating the effects of occupational therapy interventions following upper limb injection of BoNT‐A in children with cerebral palsy. These funds have been used to provide the BoNT‐A used in the research, payment of blinded outcome assessors and scorers and video editing for randomisation purposes. Brian Hoare has also received sponsorship from Allergan Australia to attend and teach at conferences and meetings but has no personal financial interest in Botox® or any related product.
Margaret Wallen ‐ In 2000 and 2003, Margaret Wallen was one member of a research group which received two separate grants from Allergan Australia to support a randomised controlled trial evaluating the effects of BoNT‐A and occupational therapy in children with cerebral palsy. The 2000 grant was used to provide the BONT‐A used in the research and payment of research staff to conduct the outcome assessments of study participants. The 2003 grant was used to support the statistical analysis of the RCT. Margaret Wallen has no personal or other financial interest in Botox or any related product.
Christine Imms ‐ is co‐investigator of a randomised controlled trial investigating the effect of repeat injections of BoNT‐A and occupational therapy in the upper limbs of children with hemiplegic cerebral palsy which has received support from Allergan Australia. In 2008, Christine Imms received a grant from Allergan Australia to present results of this trial at the American Academy of Cerebral Palsy and Developmental Medicine in Atlanta.
Barry Rawicki has received sponsorship from Allergan Australia to attend and teach at conferences and meetings but has no personal financial interest in Botox® or any related product.
Elmer Villanueva ‐ No competing interests.
Leeane Carey ‐ No competing interests
No author has a pecuniary interest in Allergan.
New search for studies and content updated (conclusions changed), comment added to review
References
References to studies included in this review
Boyd 2004 {unpublished data only}
- Boyd, R. N. The central and peripheral effects of botulinum toxin A in children with cerebral palsy. Doctor of Philosophy Thesis. Victoria: Schools of Human BioSciences and Phsyiotherapy. Faculty of Health Sciences. La Trobe University, 2004. [618.92836] [Google Scholar]
- Boyd, R. N, Bach, T. M, Morris, C, Graham, H. K. A single blind randomized trial of botulinum toxin A and upper limb training in congenital hemiplegia ‐ activity, participation and health related quality of life. Developmental Medicine and Child Neurology. 2003; Vol. 45, issue Suppl. 96:10‐11.
- Boyd, R. N, Bach, T, Morris, M. E, Imms, C, Johnson, L. B, Graham, H. K, et al. A randomised trial of botulinum toxin A and upper limb training ‐ a functional magnetic imaging and resonance frequency study.. Developmental Medicince and Child Neurology. 2002; Vol. 44, issue (Suppl. 91):9.
- Boyd, R. N, Bach, T, Morris, M. E, Imms, C, Johnson, L. B, Graham, H. K, et al. A randomised trial of botulinum toxin A and upper limb training ‐ a functional magnetic resonance imaging and resonance frequency study. Gait Posture 2002;16((Suppl. 1)):129. [Google Scholar]
Corry 1997 {published data only}
- Corry, I. S. Use of motion analysis laboratory in assessing the effects of Botulinum toxin in cerebral palsy. Thesis. The Queens University of Belfast. Degree of Doctor of Medicine 1995:80‐92.
- Corry, I. S, Cosgrove, A. P, Walsh, E, G, McGlean, D, Graham, H, K. Botulinum toxin A in the hemiplegic upper limb: a double blind trial. Developmental Medicine and Child Neurology 1997;39:185‐193. [DOI] [PubMed] [Google Scholar]
Fehlings 2000 {published and unpublished data}
- Fehlings, D, Rang, M, Glazier, J, Steele, C. An evaluation of botulinum‐A toxin injections to improve upper extremity function in children with hemiplegic cerebral palsy. Journal of Pediatrics 2000;137:331‐337. [DOI] [PubMed] [Google Scholar]
- Fehlings, D, Rang, M, Glazier, J, Steele, C. Botulinum toxin type A injections in the spastic upper extremity of children with hemiplegia: child characteristics that predict a positive outcome. European Journal of Neurology 2001;8(Suppl. 5):145‐49. [DOI] [PubMed] [Google Scholar]
Greaves 2004 {unpublished data only}
- Greaves, S. M. The effect of botulinum toxin A injections on occupational therapy outcomes for children with spastic hemiplegia. Master of Occupational Therapy thesis. Victoria: School of Occupational Therapy. Faculty of Health Sciences. La Trobe University, 2004. [Google Scholar]
Kawamura 2007 {published and unpublished data}
- Kawamura, A, Campbell, K, Lam‐Damji, S, Fehlings, D. A randomised controlled trial comparing botulinum toxon A dosage in the upper extremity of children with spasticity. Developmental Medicine and Child Neurology 2007;49:331‐37. [DOI] [PubMed] [Google Scholar]
Koman 2007 {unpublished data only}
- Koman, A. L, Paterson Smith, B, Evans, P, Williams, R, Richardson, R, Rushing, J. A placebo‐controlled, double‐blind, randomised clinical trial evaluating the effect of botulinum A toxin on upper extremity spasticity associated with cerebral palsy. Developmental Medicine and Child Neurology. 2004; Vol. 46 (Suppl. 99):10.
Lowe 2006 {published and unpublished data}
- Cusick, A, McIntyre, S, Novak, I, Lannin, N, Lowe, K. A comparison of Goal Attainment Scaling and the Canadian Occupational Performance Measure for pediatric rehabilitation research. Pediatric Rehabilitation 2006;9(2):149‐157. [DOI] [PubMed] [Google Scholar]
- Lowe, K, Novak, I, Cusick, A. Low‐dose/high‐concentration localised botulinum toxin A improves upper limb movement and function in children with hemiplegic cerebral palsy. Developmental Medicine and Child Neurology 2006;48:170‐75. [DOI] [PubMed] [Google Scholar]
Russo 2007 {published and unpublished data}
- Russo, R. N, Crotty, M, Miller, M. D, Murchland, S, Flett, P, Haan, E. Upper Limb Botulinum toxin A injection and occupational therapy in children with hemiplegic cerebral palsy identified from a population register: A single‐blind randomised controlled trial. Pediatrics 2007;119(5):1149‐1158. [DOI: 10.1542/peds.2006-2425] [DOI] [PubMed] [Google Scholar]
Speth 2005 {published and unpublished data}
- Rameckers, E. A. A, Speth, L. A. W. M, Duysens, J, Hans Vles, J. S, Smits‐Engelsman, B. C. M. Kinematic aiming task. Measuring functional changes in hand and arm movements after Botulinum toxin‐A injections in children with spastic hemiplegia. American Journal of Physical Medicine and Reahbilitation 2007;86(7):538‐547. [DOI] [PubMed] [Google Scholar]
- Speth, L. A. W. M, Leffers, P, Janssen‐Potten, Y. J. M, Vles, J. S. H. Botulinum toxin A and upper limb functional skills in hemiparetic cerebral palsy: a randomised trial in children receiving intensive therapy. Developmental Medicine and Child Neurology 2005;47:468‐73. [DOI] [PubMed] [Google Scholar]
- Speth, L. M, Vles, J. S. H. Additional effect of Botulinum toxin A injections in the upper limb in children with hemipartic cerebral palsy on upper‐limb skills. Developmental Medicine and Child Neurology. 2002; Vol. 44 (Suppl. 92):47‐48.
Wallen 2007 {published and unpublished data}
- Wallen, M, A, O'Flaherty, S. J, Waugh, M‐C, A. Functional outcomes of intramuscular botulinum toxin tye A in the upper limbs of children with cerebral palsy: A phase II trial. Archives of Physical Medicine and Rehabilitation 2004;85:192‐200. [DOI] [PubMed] [Google Scholar]
- Wallen, M. A, O'Flaherty, S. J, Waugh, M‐C. A. Functional outcomes of intra‐muscular boutlinum toxin type A and occupational therapy in the upper limbs of children with cerebral palsy: A randomised controlled trial. Archives of Physical Medicine and Rehabilitation 2007;88:1‐10. [DOI] [PubMed] [Google Scholar]
- Waugh, M‐C, Wallen, M, O'Flaherty, S. Botulinum toxin A injections in the upper limbs of children with cerebral palsy: a pilot project. Developmental Medicine and Child Neurology. 2000; Vol. 42 (Suppl. 84):34.
References to studies excluded from this review
Alahmar‐Bianchin 2007 {published data only}
- Alahmar‐Bianchin, M, Saraiva‐Storti, H. C, Fornari‐Chueri, R, Lucato, R. V. Prevalence of hand dysfunction in cerebral palsy following Botulinum toxin therapy. Revista De Neurologica 2007;45(6):334‐7. [PubMed] [Google Scholar]
Arens 1997a {published data only}
- Arens L J, Goldschmidt R B, & Leary PM. Botulinum toxin A in the hemiplegic upper limb: A double blind trial (Letter to the editor). Developmental Medicine and Child Neurology 1997a;39:491‐493. [PubMed] [Google Scholar]
Arens 1997b {published data only}
- Arens, L. J, Goldschmidt, R. B, Leary, P. M. Experience with botulinum toxin in the treatment of cerebral palsy. South African Medical Journal 1997;87(8):1001‐1003. [PubMed] [Google Scholar]
Autti‐Ramo 2000 {published data only}
- Autti‐Ramo, I, Larsen, A, Peltonen, J, Taimo, A, von Wendt, L. Botulinum toxin injection as an adjunct when planning hand surgery in children with spastic hemiplegia. Neuropediatrics 2000;31:4‐8. [DOI] [PubMed] [Google Scholar]
Autti‐Ramo 2001 {published data only}
- Autti‐Ramo, I, Larsen, A, Taimo, A, von Wendt, L. Management of the upper limb with botulinum type A in children with spastic type cerebral palsy and acquired brain injury: Clinical implications. European Journal of Neurology 2001;8(Suppl. 5):136‐44. [DOI] [PubMed] [Google Scholar]
Chait 2002 {published data only}
- Chait, L. A, de Aguiar, G, Theron, A, Bleloch, S. The role of Botulinum toxin in treating cerebral palsy hands. Current Opinion in Orthopaedics 2002;13:251‐255. [Google Scholar]
Chin 2003 {published data only}
- Chin, T. Y. P, Kerr Graham, H. Botulinum toxin A in the management of the upper limb spasticity in cerebral palsy. Hand Clinics 2003;19:591‐600. [DOI] [PubMed] [Google Scholar]
Chin 2005 {published data only}
- Chin, T. Y. P, Duncan, J. A, Johnstone, B. R, Kerr Graham, H. K. Management of the upper limb in cerebral palsy. Journal of Pediatric Orthopedics B 2005;14:389‐404. [DOI] [PubMed] [Google Scholar]
Delgado 2006 {unpublished data only}
- Delgado, M. Effect of a supination splint on upper limb function of cerebral palsy children after Botulinum toxin A. Dissertation, Faculty of Health Sciences, University of Pretoria 2006.
Densilic & Meh 1995 {published data only}
- Denislic, M, Meh, D. Botulinum toxin in the treatment of cerebral palsy. Neuropediatrics 1995;26:249‐252. [DOI] [PubMed] [Google Scholar]
Desloovere 2007 {published data only}
- Desloovere, K, Molenaers, G, Van Campenhout, A, Schorkhuber, V, De Cat, J. Features of success of botulinum toxin type A treatment in children with cerebral palsy: a clinical responsiveness study. Developmental Medicince and Child Neurology 2007;49(Suppl. 49):37. [Google Scholar]
Fasoli 2008 {published data only}
- Fasoli, S. E, Fragala‐Pinkham, M, Hughes, R, Krebs, H. I, Hogan, N, Stein, J. Robotic Therapy and Botulinum Toxin Type A: A Novel Intervention Approach for Cerebral Palsy. American Journal of Physical Medicine and Rehabilitation 2008;87:1‐8. [DOI: 10.1097/PHM.0b013e31817fb346] [DOI] [PubMed] [Google Scholar]
Freidman 2000 {published data only}
- Freidman, A, Diamond, M, Johnston, M, Daffner, C. Effects of Botulinum toxin A on upper limb spasticity in children with cerebral palsy. American Journal of Physical Medicine and Rehabilitation 2000;79:53‐59. [DOI] [PubMed] [Google Scholar]
Gibson 2007 {published data only}
- Gibson, N, Kerr Graham, H, Love, S. Botulinum toxin A in the management of focal muscle overactivity in children with cerebral palsy. Disability and Rehabilitation 2007;29(23):1813‐1822. [DOI] [PubMed] [Google Scholar]
Gooch 1996 {published data only}
- Gooch, J. L, Snadell, T. V. Botulinum toxin for spasticity and athetosis in children with cerebral palsy. Archives of Physical and Medical Rehabilitation 1996;77:508‐11. [DOI] [PubMed] [Google Scholar]
Hoare 2004 {published data only}
- Hoare, B. J, Imms, C. Upper‐limb injections of botulinum toxin‐A in children with cerebral palsy: A critical review of the literature and clinical implications for occupational therapists. The American Journal of Occupational Therapy 2004;58(4):389‐97. [DOI] [PubMed] [Google Scholar]
Hurvitz 2000 {published data only}
- Hurvitz, E. A, Conti, G. E, Flansburg, E. J, Brown, S. H. Motor control testing of upper limb function after botulinum toxin injection: A case study. Archives of Physical Medicine and Rehabilitation 2000;81:1408‐15. [DOI] [PubMed] [Google Scholar]
Hurvitz 2003 {published data only}
- Hurvitz, E. A, Conti, G. E, Brown, S. H. Changes in movement characteristics of the spastic upper extremity after botulinum toxin injection. Archives of Physical Medicine and Rehabilitation 2004;84:444‐454. [DOI] [PubMed] [Google Scholar]
Johnstone 2007 {published data only}
- Johnstone, B. R, Coombs, C, McCombe, D, Duncan, J. Botulinum toxin A in the upper limb in cerebral palsy. RACS Annual Scientific Congress. Australian and New Zeland Journal of Surgery. 2007; Vol. 77, issue (Suppl. 1):A34‐A36.
Keren‐Capelovitch 2007 {published data only}
- Keren‐Capelovitch, T, Jarus, T. Upper extremity function and daily functioning in children with spastic cerebral palsy following lower extremity botulinum toxin injections. Developmental Medicine and Child Neurology 2007;49(Suppl. 111):41. [DOI] [PubMed] [Google Scholar]
Kim 2001 {published data only}
- Kim, H. S, Hwang, J. H, Lee, P. K, Jung, S. H, Park, H. D, Cho, E. H, Shim, J. S, Kim, J. M. The effects of botulinum toxin A on upper limb function in children with cerebral palsy. Journal of Korean Academic Rehabilitation Medicine 2001;25(4):594‐600. [Google Scholar]
Kolaski 2008 {published data only}
- Kolaski, K, Ajizian, S. J, Passmore, L, Pasutharnchat, N, Koman, L. A, Smith, B. P. Safety profile of multilevel chemical denervation procedures using phenol or botulinum toxin or both in a pediatric population. American Journal of Physical Medicine and Rehabilitation 2008;87:556‐566. [DOI: 10.1097/PHM.0b013e31817c115b] [DOI] [PubMed] [Google Scholar]
Lowe 2007 {published data only}
- Lowe, K, Novak, I, Cusick, A. Repeat injection of Botulinum toxin A is safe and effective for upper limb movement and function in children with cerebral palsy. Developmental Medicince and Child Neurology 2007;49(11):823‐829. [DOI] [PubMed] [Google Scholar]
Mackey 2006 {unpublished data only}
- Mackey, A. H, Walt, S. E, Miller, F, Waugh, M‐C, Stott, N. S. Three‐dimensional movement analysis following upper limb botulinum toxin A for children with hemiplegia. Archives of Physical Medicine and Rehabilitation 2006;87(2):207‐15. [Google Scholar]
Mall 1997 {published data only}
- Mall, V, Heinen, F, Linder, M, Philipsen, A, Korinthenberg, R. Treatment of cerebral palsy with botulinum toxin A: functional benefit and reduction of disability. Three case reports. Pediatric Rehabilitation 1;4:235‐7. [DOI] [PubMed] [Google Scholar]
O'Flaherty 2003 {published data only}
- O'Flaherty, S, Waugh, M‐C. Pharmacologic management of the spastic and dystonic upper limb in children with cerebral palsy. Hand Clinics 2003;19:585‐589. [DOI] [PubMed] [Google Scholar]
Park 2006 {published data only}
- Park, E. S, Rha, D. W. Botulinum toxin type A injection for management of upper limb spastcity in children with cerebral palsy: a literature review. Yonsei Medical Journal 2006;47(5):589‐603. [DOI] [PMC free article] [PubMed] [Google Scholar]
Reeuwijk 2006 {published data only}
- Reeuwijk, A, van Schie, P. E. M, Becher, J. G, Kwakkel, G. Effects of botulinum toxin type A on upper limb function in children with cerebral palsy: a systematic review. Clinical Rehabilitation 2006;20:375‐87. [DOI] [PubMed] [Google Scholar]
Romanini 2000 {published data only}
- Romanini, L, Villani, C, Chiozzi, F, Persiani, P. The spastic hand: treatment with botulinum toxin [La mano spastica: trattamento con tossina botulinica]. Riv.Chir.Riab.Mano Arto Sup 2000;38(1):113‐119. [Google Scholar]
Rosblad 2007 {published data only}
- Rosblad, B, Andersson, G, Petterson, K. Effects of botulinum toxin type A and a programme of functional activity to improve manaul ability in children and adolescents with cerebral palsy. Scandanavian Journal of Plastic and Reconstructive Surgery of the Hand 2007;41:250‐258. [DOI] [PubMed] [Google Scholar]
Sanger 2007 {published data only}
- Sanger, T. D, Kukke, S. N, Sherman‐Levine, S. Dystonia: An open‐label, dose‐escalation pilot study Botulinum toxin type B improves the speed of reaching in children with cerebral palsy. Journal of Child Neurology 2007;22:116‐122. [DOI] [PubMed] [Google Scholar]
Satila 2006 (a) {published data only}
- Satila, H, Kotamaki, A, Koivikko, M, Autti‐Ramo, I. Low and high‐dose botulinum toxin A treatment: A retrospective analysis. Pediatric Neurology 2006;34:285‐290. [DOI] [PubMed] [Google Scholar]
Satila 2006 (b) {published data only}
- Satila, H, Kotamaki, A, Koivikko, M, Autti‐Ramo, I. Upper limb function after botulinum toxin A treatment in cerebral palsy: Two years follow‐up of six cases. Pediatric Rehabilitation 2006;9(3):247‐58. [DOI] [PubMed] [Google Scholar]
Wall 1993 {published data only}
- Wall, S. A, Chait, L. A, Temlett, J. A, Perkins, B, Hillen, G, Becker, P. Botulinum A chemodenervation: a new modality in cerebral palsied hands. British Journal of Plastic Surgery 1993;46:703‐706. [DOI] [PubMed] [Google Scholar]
Waugh 2000 {published data only}
- Waugh, M‐C. A, Wallen, M. A, O'Flaherty, S. J. Botulinum toxin A injections in the upper limbs of children with cerebral palsy: a pilot project. Developmental Medicine and Child Neurology 2000;42(Suppl 83):34. [Google Scholar]
Wong 2002 {published data only}
- Wong, V, Ng, A, Sit, P. Open‐label study of Botulinum toxin for upper limb spasticity in cerebral palsy. Journal of Child Neurology 2002;17:138‐142. [DOI] [PubMed] [Google Scholar]
Yang 2003 {published data only}
- Yang, T. F, Kao, N. T, Chan, R. C, Chen, S. J. Effect of botulinum toxin type A on cerebral palsy with upper limb spasticity. American Journal of Physical Medicine and Rehabilitation 2003;82(4):284‐289. [DOI] [PubMed] [Google Scholar]
References to studies awaiting assessment
Gibson 2009 {published data only}
- Gibson, N, Valentine, J, Pearce, A, Love, S, Chauvel, P, Blair, E. Preliminary results of using Botulinum Toxin A in the treatment of upper limb spasticity in children with cerebral palsy. 5th National Paediatric Physiotherapy Conference. Perth: Australian Journal of Phsyiotherapy (Suppl), 2003; Vol. 50, issue 2:S4‐S5. [http://ajp.physiotherapy.asn.au/AJP/50‐2/AustJPhysiotherv50i2Abstracts.pdf]
Kanellopoulos 2009 {published data only}
- Kanellopoulos, A. D, Mavrogenis, A. F, Mitsiokapa, E. A, Panagopoulos, D, Skouteli, H, Vrettos, S. G, Tzanos, G, Papagelopoulos, P. I. Long lasting benefits following the combination of static night upper extremity splinting with botulinum toxin A injections in cerebral palsy children. European Journal of Physical and Rehabilitation Medicine 2009;45:1‐6. [PubMed] [Google Scholar]
Olesch 2009 {published data only}
- Greaves, S, Olesch, C, Imms, C, Reid, S, Reddihough, D, Graham, H. K. A randomised controlled trial of repeat injections of Botulinum toxin A in the upper extremity of young children with cerebral palsy. Developmental Medicine and Child Neurology 2008;50(suppl. 113):6. [Google Scholar]
Pearse 2009 {published data only}
- Pearse, J, Eyre, J. A, Gibson, M. Botulinum toxin injection of biceps brachii significantly increases the efficacy of occupational therapy in hemiplegic cerebral palsy: a randomised, double blinded, placebo controlled study. Developmental Medicine and Child Neurology 2009;51 (Suppl. 2):13. [Google Scholar]
- Pearse, J, Gibson, M, Eyre, J. Botulinum toxin injection of biceps brachii significantly increases the efficacy of occupational therapy in hemiplegic cerebral palsy: a randomised, double blinded,placebo controlled study. Developmental Medicine and Child Neurology 2008;50(Suppl. 114):23. [Google Scholar]
Rameckers 2009 {published data only}
- Rameckers, E. A. A, Speth, L. A. W. M, Duysens, J, Vles, J. S. H, Smits‐Engelsman, B. C. M. Long‐term effect of standardized functionaltherapy versus botulinum toxin‐A andstandardized functional therapy on manual isometric force generation in children with congenital spastic hemiplegia. Developmental Medicine and Child Neurology 2007;49(Suppl. 111):6. [Google Scholar]
- Rameckers, E. A. A, Speth, L. A. W. M, Duysens, J, Vles, J. S. H, Smits‐Engelsman, B. C. M. Botulinum toxin‐a in children with congenital spastic hemiplegia does not improve upper extremity motor‐related function over rehabilitation alone: a randomized controlled trial. Neurorehabilitation and Neural Repair 2009;23(3):218‐225. [DOI] [PubMed] [Google Scholar]
Redman 2008(a) {published data only}
- Redman, T. A, Finn, J. C, Bremner, A. P, Valentine, J. Effect of upper limb botulinum toxin‐A therapy on health‐related quality of life in children with hemiplegic cerebral palsy. Journal of Pediatrics and Child Health 2008;44(7‐8):409‐14. [DOI: 10.1111/j.1440-1754.2008.01319.x] [DOI] [PubMed] [Google Scholar]
Redman 2008(b) {published data only}
- Redman, T. A, Gibson, N, Finn, J. C, Bremner, A. P, Valentine, J, Thickbroom, G. W. Upper limb corticomotor projections and physiological changes that occur with botulinum toxin‐A therapy in children with hemiplegic cerebral palsy. European Journal of Neurology 2008;15(8):787‐791. [DOI] [PubMed] [Google Scholar]
- Redman, T, Gibson, N, Thickbroom, G, Valentine, J, Finn, J, Bremner, A. Motor pathway changes associated with upper limb botulinum toxin A therapy in children with hemiplegic cerebral palsy. Developmental Medicine and Child Neurology 2007;49(Suppl. 111):42. [Google Scholar]
References to ongoing studies
Ben‐Pazi 2008 {published data only}
- Ben‐Pazi, H. Improvement after Botulinum toxin injections to the arms in children with cerebral palsy. ClinicalTrials.gov. Israel: Shaare Zedek Medical Center, 2007. [ClinicalTrials.gov Identifier: NCT00549471]
Hoare 2008 {unpublished data only}
- Hoare B. J. Imms C. Carey L. Rawicki B. Botulinum toxin‐A and modified constraint induced movement therapy in the treatment of the upper limb in children with spastic hemiplegic cerebral palsy. http://www.anzctr.org.au/trial_view.aspx?ID=3. [http://www.anzctr.org.au/trial_view.aspx?ID=3] [DOI] [PubMed]
Sholas 2008 {published data only}
- Sholas, M. G, Yakusawa, A, Kahn, L, Cruz, E, Tann, B, Gaebler‐Spira, D. Randomized Double Masked Placebo Controlled Study of Upper Extremity Function with Botulinum Toxin A (Botox). http://www.ric.org/research/trials.php#extremity 2008.
Speth 2008 {published data only}
- Speth, L. M. Effect of botulinum toxin A injections and specific intensive rehabilitation therapy in children with hemiparetic cerebral palsy on upper limb functions and skills. http://www.srl.nl/default.asp?id=396&parent=0&template=algemeen.htm&sitecat=5 2008.
Additional references
Ashford 2006
- Ashford, S, Turner‐Stokes, L. Goal attainment for spasticity management using botulinum toxin. Physiotherapy Research International 2006;11(1):21‐34. [DOI] [PubMed] [Google Scholar]
Bax 2005
- Bax, M, Goldstein, M, Rosenbaum, P, Leviton, A, Paneth, N, Dan, B, Jacobsson, B, Damiano, D. Proposed definition and classification of cerebral palsy. Developmental Medicine and Child Neurology 2005;47(8):571‐6. [DOI] [PubMed] [Google Scholar]
Beckerman 2001
- Beckerman, H, Roebroeck, M, Lankhorst, G, Becher, J, Bezemer, P, Verbeek, A. Smallest real difference, a link between reproducibility and responsiveness. Quality of Life Research 2001;10:571‐578. [DOI] [PubMed] [Google Scholar]
Blair 2006
- Blair, E, Watson. L. Epidemiology of cerebral palsy. Semin Fetal Neonatal Med 2006;11:117‐25. [DOI] [PubMed] [Google Scholar]
Boutron 2005
- Boutron, I, Moher, D, Tugwell, P, Giraudeau, B, Poiraudeau, S, Nizard, R, Philippe, R. A checklist to evaluate a report of a nonpharmacological trial (CLEAR NPT) was developed using consensus. Journal of Clinical Epidemiology 2005;58(12):1233‐40. [DOI] [PubMed] [Google Scholar]
Boutron 2008
- Boutron, I, Moher, D, Altman, D. G, Schulz, K. F, Ravaud, P. Methods and processes of the CONSORT Group: example of an extension for trials assessing nonpharmacologic treatments. Annals of Internal Medicine 2008;148(4):W60‐6. [DOI] [PubMed] [Google Scholar]
Carlon 2009
- Carlon, S, Shields, N, Yong, K, Sakzewski, L, Gilmore, R, Boyd, R. INCITE ‐ Contraint induced movement therapy and bimanual training ‐ effect on quality of life of children with congenital hemiplegia. Developmental Medicine and Child Neurology 2009;51(Suppl. 2):14. [Google Scholar]
Chin 2005
- Chin, T. Y. P, Nattrass, G. R, Selber, P, Graham, H. K. Accuracy of intramuscular injection of botulinum toxin A in juvenile cerebral palsy: a comparison between manual needle placement and placement guided by electrical stimulation. Journal of Pediatric Orthopedics 2005;25(3):286‐291. [DOI] [PubMed] [Google Scholar]
Coster 1998
- Coster, W. Occupation‐centered assessment of children. American Journal of Occupational Therapy 1998;52:337‐44. [DOI] [PubMed] [Google Scholar]
Crowner 2007
- Crowner, B. E, Brunstrom, J. E, Racette, B. A. Iatrogenic botulism due to therapeutic Botulinum toxin A injection ina pediatric patient. Clinical Neuropharmacology 2007;30(5):310‐313. [DOI: 10.1097/WNF.0B013E31804B1A0D] [DOI] [PubMed] [Google Scholar]
Cusick, 2006
- Cusick, A, McIntyre, S, Novak, I, Lannin, N, Lowe, K. A comparison of Goal Attainment Scaling and the Canadian Occupational Performance Measure for pediatric rehabilitation research. Pediatric Rehabilitation 2006;9(2):149‐157. [DOI] [PubMed] [Google Scholar]
Damiano 2008
- Damiano, D. Strengthening in children with motor disabilities: Just do it! Keynote presentation, The Australasian Academy of Cerebral Palsy and Developmental Medicine. Developmental Medicine and Child Neurology. 2008; Vol. Suppl. 113:3.
Deeks 2005
- Deeks J. J. Higgins J. P. T. Altman, D. G. Analysing and presenting results. In: Higgins, J. P. T, Green, S editor(s). Cochrane Handbook for Systematic Reviews of Interventions 4.2.5: [updated May 2005]: Section 8. In The Cochrane Library 2005, Issue 3. Chichester, UK. www.cochrane.org/resources/handbook/hbook.htm: John Wiley & Sons, Ltd, 2005. [Google Scholar]
dePaiva 1999
- de Paiva, A, Meunier, F. A, Molgo, J, Aoki, K. R, Dolly, J. O. Functional repair of motor endplates after botulinum neurotoxin type A poisoning: biphasic switch of synaptic activity between nerve sprouts and their parent terminals. Proceedings of the National Academy of Sciences of the United States of America. 1999:3200‐3205. [DOI] [PMC free article] [PubMed]
Eliasson 2005
- Eliasson, A. Improving the use of hands in daily activities: aspects of the treatment of children with cerebral palsy. Physical & occupational therapy in pediatrics 2005;25(3):37‐60. [DOI] [PubMed] [Google Scholar]
Eliasson 2006
- Eliasson, A‐C, Krumlinde‐Sundholm, L, Rosblad, B, Beckung, E. The Manual Ability Classification System (MACS) for children with cerebral palsy: scale development and evidence of validity and reliability. Developmental Medicine and Child Neurology 2006;48(7):549‐554. [DOI] [PubMed] [Google Scholar]
Fehlings 2009
- Fehlings, D, Novak, I, Berweck, S, Hoare, B. J, Stott, S, Russo, R. N. Botulinum Toxin Assessment, Intervention and After‐care for paediatric upper limb hypertonicity: Evidence‐based guidelines: International consensus guidelines. European Journal of Neurology In Press. [DOI] [PubMed] [Google Scholar]
Goldstein 2006
- Goldstein, E. M. Safety of high‐dose Botulinum Toxin Type A therapy for the treatment of pediatric spasticity. Journal of Child Neurology 2006;21:189. [DOI: 10.2310/7010.2006.00041] [DOI] [PubMed] [Google Scholar]
Gough 2009
- Gough, M. Does botulinum toxin prevent or promote deformity in children with cerebral palsy?. Developmental Medicine and Child Neurology 2009;51(2):89‐90. [DOI] [PubMed] [Google Scholar]
Gracies 2004
- Gracies JM. Physiological effects of botulinum toxin in spasticity. Mov Disord 2004;19(Suppl. 8):S120‐8. [DOI] [PubMed] [Google Scholar]
Gracies 2009
- Gracies, J. M, Lugassy, M, Weisz, D. J, Vecchio, M, Flanagan, S, Simpson, D. M. Botulinum toxin dilution and endplate targeting in spasticity: a double‐blind controlled study. Archives of Physical Medicine and Rehabilitation 2009;90(1):9‐16.e2. [DOI] [PubMed] [Google Scholar]
GradePro [Computer program]
- Jan Brozek, Andrew Oxman, Holger Schünemann. GRADEprofiler. Version 3.2.2 for Windows 2008.
Graham 2000
- Graham, H. Botulinum toxin A in cerebral palsy: functional outcomes. Journal of Paediatrics 2000;137(3):300‐3. [DOI] [PubMed] [Google Scholar]
Hanna 2003
- Hanna, S. E, Law, M. C, Rosenbaum, P. L, King, G. A, Walter, S. D, Pollock, N, Russell, D. J. Development of hand function amoung children with cerebral palsy: growth curve analysis for ages 16 to 70 months. Developmental Medicine and Child Neurology 2003;45:448‐455. [PubMed] [Google Scholar]
Harter 1985
- Harter, S. Manual for the Self Perception Profile for Children. Denver, CO: University of Denver, 1985. [Google Scholar]
Harter and Pike 1984
- Harter, S, Pike, R. The Pictorial Scale of Perceived Competence and Social Acceptance for Young Children. Child Development 1984;55:1969‐1982. [PubMed] [Google Scholar]
Hesse 1995
- Hesse, S, Jahnke, M. T, Luecke, D, Mauritz, K. H. Short‐term electrical stimulation enhances the effectiveness of botulinum toxin in the treatment of lower limb spasticity in hemiparetic patients. Neuroscience Letters 1995;201:37‐40. [DOI] [PubMed] [Google Scholar]
Hesse 1998
- Hesse, S, Reiter, F, Konrad, M, Jahnke, M. T. Botulinum toxin type A and short‐term electrical stimulation in the treatment of upper limb flexor spasticity after stroke: a randomized, double‐blind, placebo‐controlled trial. Clinical Rehabilitation 1998;12:381‐388. [DOI] [PubMed] [Google Scholar]
Higgins 2008
- Higgins, J. P. T. l, Green, S. Cochrane Handbook for Systematic Reviews of Interventions. Version 5.0.1 (updated September 2008). The Cochrane Collaboration, 2008. [Google Scholar]
Hoare and Imms 2009
- Hoare, B. J, Imms, C . Getting Ready for School. In: Dodd, K, Imms, C, Taylor, N editor(s). Physical and Occupational Therapy for Cerebral Palsy. McKeith Press, In Press. [Google Scholar]
Hoare and Russo 2009
- Hoare, B. J, Russo, R. Botulinum toxin‐A in children with cerebral palsy: Treatment of the upper limb following injection. In: Soderback, I editor(s). International Hanbook of Occupational Therapy Interventions. New York: Springer Publishers, 2009. [Google Scholar]
Howell 2007
- Howell, K, Selber, P, Graham, H. K, Reddihough, D. Botulinum neurotoxin A: An unusual systemic effect. Journal of Pediatrics and Child Health 2007;43:499‐501. [DOI: 10.1111/j.1440-1754.2007.01122.x] [DOI] [PubMed] [Google Scholar]
Humphrey 2002
- Humphry, R. Young children's occupations: explicating the dynamics of developmental processes. American Journal of Occupational Therapy 2002;56:171‐79. [DOI] [PubMed] [Google Scholar]
Imms 2008
- Imms, C, Reilly, S, Carlin, J, Dodd, K. Diversity of participation in children with cerebral palsy. Developmental Medicine and Child Neurology 2008;50(5):363‐9. [DOI] [PubMed] [Google Scholar]
Iyer 2003
- Iyer, L. V, Haley, S. M, Watkins, M. P, Dumas, H. M. Establishing minimal clinically important differences for scores on the Pediatric Evaluation of Disability Inventory for Inpatient Rehabilitation. Physical Therapy 2003;83(10):888‐898. [PubMed] [Google Scholar]
Klingels 2008
- Klingels, K, De Cock, P, Desloovere, K, Huenaerts, C, Molenaers, G, Van Nuland, I, Huysmans, A, Feys, H. Comparison of the Melbourne Assessment of Unilateral Upper Limb Function and the Quality of Upper Extremity Skills Test in hemiplegic CP. Developmental Medicine and Child Neurology 2008;50(12):904‐9. [DOI] [PubMed] [Google Scholar]
Kuhtz‐Buschbeck 2000
- Kuhtz‐Buschbeck, J. P, Krumlinde‐Sundholm, L, Eliasson, A‐C, Forssberg, H. Quantitative assessment of mirror movements in children and adolescents with hemiplegic cerebral palsy. Developmental Medicine and Child Neurology 2000;42:728‐36. [DOI] [PubMed] [Google Scholar]
Lance 1980
- Lance J. Symposium synopsis. Chicago: Year Book Medical Publishers, 1980. [Google Scholar]
Lance and McLeod 1981
- Lance, J. W, McLeod, J. G. A physiological approach to clinical neurology. London: Butterworths, 1981. [Google Scholar]
Lannin 2003
- Lannin, N. A, Horsley, S. A, Herbert, R, McCluskey, A, Cusick, A. Splinting the hand in the functional position after brain impairment: A randomized, controlled trial. Archives of Physical Medicine and Rehabilitation 2003;84(2):297‐302. [DOI] [PubMed] [Google Scholar]
Lannin 2007
- Lannin, N. A, Cusick, A, McCluskey, A, Herbert, R. D. Effects of Splinting on Wrist Contracture After Stroke: A Randomized Controlled Trial. Stroke 2007;38(1):111‐6. [DOI] [PubMed] [Google Scholar]
Lannin 2007a
- Lannin, N. A, Novak, I, Cusick, A. A systematic review of upper extremity casting for children and adults with central nervous system motor disorders. Clinical Rehabilitation 2007;21(11):963‐76. [DOI] [PubMed] [Google Scholar]
Light 1984
- Light, K. E, Nuzik, S, Personius, W, Barstrom, A. Low‐load prolonged stretch vs. high‐load brief stretch in treating knee contractures. Physical Therapy 1984;64(3):330‐3. [DOI] [PubMed] [Google Scholar]
Mackey 2004
- Mackey, A. H, Walt, S. E, Lobb, G, Stott, S. N. Intraobserver reliability of the modified Tardieu scale in the upper limb of children with hemiplegia. Developmental Medicine and Child Neurology 2004;46(4):267‐272. [DOI] [PubMed] [Google Scholar]
Maher 2003
- Maher, C. G, Sherrington, C, Herbert, R. D, Moseley, A. M, Elkins, M. Reliability of the PEDro scale for rating Quality of Randomised Controlled Trials. Physical Therapy 2003;83(8):713‐21. [http://www.pedro.fhs.usyd.edu.au/faq.html] [PubMed] [Google Scholar]
McLaren 2003
- McLaren, C, Rodger, S. Goal attainment scaling: Clinical implications for paediatric occupational therapy. Australian Occupational Therapy Journal 2003;50(4):216‐224. [Google Scholar]
Medicare Australia 2009
- Medicare Australia. Botulinum toxin. www.medicareaustralia.gov.au/provider/pbs/drugs1/botulinum.jsp 7/4/2009.
Minamoto 2007
- Minamoto, V. B, Hulst, J. B, Lim, M, Peace, W. J, Bremner, S. N, Ward, S. R, Lieber, R. L. Increased efficacy and decreased systemic‐effects of botulinum toxin A injection after active or passive muscle manipulation. Developmental Medicine and Child Neurology 2007;49(12):907‐14. [DOI] [PubMed] [Google Scholar]
NIHCDCS 1991
- NIHCDCS. Clinical use of botulinum toxin. National Institutes of Health Consensus Development Conference Statement. November 12‐14, 1990. Archives of Neurology 1991;48:1294‐8. [PubMed] [Google Scholar]
Patrick and Ada 2006
- Patrick, E, Ada, L. The Tardieu Scale differentiates contracture from spasticity whereas the Ashworth Scale is confounded by it. Clinical Rehabilitation 2006;20(2):173‐82. [DOI] [PubMed] [Google Scholar]
Pin 2006
- Pin, T, Dyke, P, Chan, M. The effectiveness of passive stretching in children with cerebral palsy. Developmental Medicine and Child Neurology 2006;48:855‐862. [DOI] [PubMed] [Google Scholar]
Randall 2008
- Randall, M, Imms, C, Carey, L. Establishing validity of a modified Melbourne Assessment for children ages 2 to 4 years. The American journal of Occupational Therapy 2008;62(4):373‐83. [DOI] [PubMed] [Google Scholar]
Rang 1990
- Rang, M. Cerebral Palsy. In: Morrissey RT editor(s). Lovell and Winters Paediatric Orthopaedics. 3rd Edition. Philadelphia: JB Lippincott, 1990:465‐506. [Google Scholar]
Richards 1996
- Richards, L. G, Olson, B, Palmiter‐Thomas, P. How forearm position affects grip strength. American Journal of Occupational Therapy 1996;50(2):133‐8. [DOI] [PubMed] [Google Scholar]
Rosenbaum 2007
- Rosenabaum, P, Paneth, N, Leviton, A, Goldstein, M, Bax, M, Damiano, D, Dan, B, Jacobsson, B. A report: the definition and classification of cerebral palsy April 2006. Developmental Medicine and Child Neurology 2007;109(Suppl.):8‐14. [PubMed] [Google Scholar]
Sakzewski 2009
- Sakzewski, L, Ziviani, J, Boyd, R. Efficacy of therapeutic management of upper limb dysfunction for children with congenital hemiplegia to improve activity and participation outcomes ‐ Systematic review and meta‐analysis. Developmental Medicine and Child Neurology 2009;51(Suppl. 2):57‐58. [Google Scholar]
Scholtes 2006
- Scholtes, V. A, Becher, J. G, Beelen, A. Lankhorst, G. J. Clinical assessment of spasticity in children with cerebral palsy: a critical review of available instruments. Developmental Medicine and Child Neurology 2006;48(1):64‐73. [DOI] [PubMed] [Google Scholar]
Scott 1988
- Scott, A. B, Suzuki, D. Systemic Toxicity of Botulinum Toxin by Intramuscular Injection in the Monkey. Movement Disorders 1988;3(4):333‐335. [DOI] [PubMed] [Google Scholar]
SCPE 2000
- SCPE. Surveillance of cerebral palsy in Europe: a collaboration of cerebral palsy surveys and registers. Developmental Medicine and Child Neurology 2000;42:816‐824. [DOI] [PubMed] [Google Scholar]
Stanley 2000
- Stanley, F, Blair, E, Alberman, E. Cerebral palsies: Epidemiology and causal pathways. Clinics in Developmental Medicine No. 151. London: Mac Keith, 2000. [Google Scholar]
Steenbeek 2007
- Steenbeek, D, Ketelaar, M, Galama, K, Gorter, J. W. Goal attainment scaling in paediatric rehabilitation: a critical review of the literature. Developmental Medicine & Child Neurology 2007;49:550‐56. [DOI] [PubMed] [Google Scholar]
Steffen 1995
- Steffen, T. M, Mollinger, L. A. Low‐load, prolonged stretch in the treatment of knee flexion contractures in nursing home residents. Physical Therapy 1995;75(10):886‐95. [DOI] [PubMed] [Google Scholar]
Tardieu 1988
- Tardieu, C, Lespargot, A, Tabary, C, Bret, M. D. For how long must the soleus muscle be stretched each day to prevent contracture?. Developmental Medicine and Child Neurology 1988;1:3‐10. [DOI] [PubMed] [Google Scholar]
Tennant 2007
- Tennant A. Goal attainment scaling: current methodological challenges. Disability and rehabilitation 2007;29(20‐21):1583‐8. [DOI] [PubMed] [Google Scholar]
U.S Food and Drug Administration
Varni 2001
- Varni, J.W, Seid, M, Kurtin, P.S. Reliability and validity of the Pediatric Quality of Life Inventory version 4.0 generic core scales in health and patient populations. Medical Care 2001;39:800‐812. [DOI] [PubMed] [Google Scholar]
Vaz 2006
- Vaz, D.V, Cotta Mancini, M, Fonseca, S. T, Vieira, D.S.R. Muscle stiffness and strength and their relation to hand function in children with hemiplegic cerebral palsy. Developmental Medicine and Child Neurology 2006;48:728‐733. [DOI] [PubMed] [Google Scholar]
Wasiak 2004
- Wasiak, J, Hoare, B.J, Wallen, M. Botulinum toxin‐A as an adjunct to treatment in the management of the upper limb in children with spastic cerebral palsy. Cochrane Database of Systematic Reviews 2004, Issue 4. [DOI] [PubMed] [Google Scholar]
Waters 1999
- Waters, E, et al. Australian Authorised Adaptation of the Child Health Questionnaire. Melbourne: Centre for Community Child Health: Royal Children's Hospital, 1999. [Google Scholar]
Whitehead 1994
- Whitehead, A, Jones, N. M. B. A meta‐analysis of clinical trials involving different classifications of response into ordered categories. Statistics in Medicine 1994;13:2503‐2515. [DOI] [PubMed] [Google Scholar]
WHO 2001
- International Classification of Functioning, Disability and Health. World Health Organization (WHO). http://www.who.int/icf Vol. 2001.
Williams 1984
- Williams, P. E, Goldspink, G. Connective tissue changes in immobilised muscle. Journal of Anatomy 1984;138 (Pt 2):343‐50. [PMC free article] [PubMed] [Google Scholar]
Williams 1988
- Williams, P. E. Effect of intermittent stretch on immobilised muscle. Annals of the Rheumatic Diseases 1988;47(12):1014‐6. [DOI] [PMC free article] [PubMed] [Google Scholar]
Williams 2008
Wiseman 2005
- Wiseman, J.O, Davis, J. A, Polatajko, H. J. Occupational development: towards an understanding of children's doing. Journal of Occupational Science 2005;12:26‐35. [Google Scholar]
References to other published versions of this review
Wasiak, Hoare, Wallen 2004
- Wasiak, J, Hoare, B, Wallen, M. Botulinum toxin A as an adjunct to treatment in the management of the upper limb in children with spastic cerebral palsy. Cochrane Database of Systematic Reviews 2004, Issue 4. [DOI] [PubMed] [Google Scholar]