

Abstract
The aim of this work is to study the effect of temperature fluctuations on spoilage microbial flora behaviour of a semi-preserved seafood product in modified atmosphere packaging (MAP) as well as to find correct interpretation criteria for simulating temperature fluctuations during storage tests. The study concerned 54 packages of “Octopus carpaccio” that were grouped in three batches and stored at 3 different temperature profiles: the first (16 packages - Group 4°C) was stored at 4±0.5°C; the second (16 packages - Group 8°C) was stored at 8±0.5°C; the third (16 packages - Group F) was stored under a fluctuating temperature regime between 2°C and 14°C. Spoilage microflora, pH and AW has been monitored, at regular intervals, along the storage period (44 days). A predictive model was constructed according to the accredited scientific literature and validated against the observed growth curves of the above three groups. Afterwards, the predictive model has been used setting the temperature at the mean value of fluctuations (6.72°C), at the kinetic mean value of fluctuations (7.80°C) and at the 75th percentile value of fluctuations (11.14°C). The best fitting to the observed data was obtained with the kinetic mean temperature value and this result shows that this parameter can be proposed to reproduce the temperature fluctuation along the distribution and the domestic storage when a storage test has to be carried out.
Key words: Temperature fluctuations, Shelflife, octopus semi-preserved product, Predictive microbiology
Introduction
Shelf life of food can be defined as the period it will retain acceptable characteristics from a safety, hygienic and organoleptic point of view (Corradini, 2018; Fu and Labuza, 1993). Especially in fresh food with a short shelf life, often labeled with the “use by date” (Reg. 1169/2011 EU), a large part of deterioration is related to the microbial activity since the specific spoilage microflora can produce several kinds of offflavors, off-odors and discolorations. Furthermore, the term of consumption is strongly related to the potential growth of some foodborne disease agents, also according to the specific European Regulation 2073/2005 UE. Shelf life can be assessed by the use of storage tests that are carried out through the enumeration of microbial spoilage flora and, at the same time, associating the evaluation of sensorial modifications (Fu and Labuza, 1993). Also, it is widely consolidated the use of challenge tests based on experimental contamination of products and determination of growth rate or growth potential.
Storage tests need to explore the entire storage period at least; in some cases, the use of the Accelerated Shelf Life Tests (ASLT) can help to obtain an earlier response, since the test is carried out at higher storage temperature (Corradini, 2018). Furthermore, ASLT con produce a linear model to predict the shelf-life of product, based on Arrhenius relation and determination of the temperature coefficient (Q10) that represents the factor by which the rate of a reaction increases for every 10- degree rise in the temperature (T).
Concerning the shelf life of seafood products, it is well known it is mainly conditioned by the proliferation of some spoilage psychrotrophic bacteria belonging to Pseudomonas genera (Dalgard, 1995). For this product, the application of ASLT and related predictive model based on Arrhenius equation could not produce a good fitting with observed data since the relation between Temperature and bacterial growth is not always linear. Furthermore, the using of Q10 coefficient does not easily allow to predict shelf life under a fluctuating temperature regime (Corradini, 2018).
The fluctuation of food storage temperature under distribution and at domestic level are widely documented (James et al., 2017; Pelletier et al., 2011; Renard et al., 2013; Roccato et al., 2017; Vergara et al., 2014). Several authors evidence the high level of temperature heterogeneity inside the trucks, refrigerated container, cold room, or warehouse (Pelletier et al., 2011; Raab et al., 2008). Furthermore, significant temperature heterogeneity can also be observed inside a single pallet (Nunes et al., 2014). Recently two contemporary and wide review have been carried out about the domestic refrigerators temperature and they find, beside the temperature mean of several countries, a high heterogeneity of storage condition related to the temperature fluctuation too (James et al., 2017; Roccato et al., 2017).
There is not a wide knowledge on the relationship between shelf life and fluctuating temperature because it is not clear the effect of fluctuations on microorganism behavior. Furthermore, it is not clear which temperature value gives a better representation of the fluctuations in order to simulate the thermal fluctuations during the food distribution and domestic storage when a storage test for assessing a product shelf life is planning.
The present work aims to study the effect of temperature fluctuations on spoilage microbial flora behavior of a semipreserved seafood product in modified atmosphere packaging (MAP) as well as to find a correct interpretation of criteria for simulating temperature fluctuations during storage tests.
Materials and Methods
For the present study, 54 packages of “Octopus carpaccio” of 100g in modified atmosphere packaging (MAP; 70% Nitrogen – 30% Carbone dioxide) were sampled, from a seafood industry located in the western Sicily, at the end of production and transferred at laboratory within 3 hours, in refrigerated conditions. Briefly, “Octopus carpaccio” is a semi-preserved product obtained by boiled octopus, inserted into plastic casing, opportunely pressed and, after 12 hours of refrigeration, sliced and packaged.
Samples were grouped in three batches and stored at 3 different temperature profiles: the first (16 packages - Group 4°C) was stored at 4±0.5°C; the second (16 packages - Group 8°C) was stored at 8±0.5°C; the third (16 packages - Group F) was stored under a fluctuating temperature regime between 2°C and 14°C. For this group, temperature monitoring was carried out by a data logger Thermo fisher mod. 3475.
Three samples for each group were sampled at 0, 7, 14, 23, 34 and 44 days from the end of production, for the microbial analysis, for the determination of pH and AW as well as for the sensorial evaluation.
Particularly, microbiological analysis regarded the count of Enterobacteriaceae (ISO 21528-2:2017), the determination of Total Viable Count on plate of Iron Agar (Lingby), incubated at 25°C for 72 hours (Gram et al., 1987) and the count of presumptive Pseudomonas spp. on plates of Pseudomonas Agar (Biolife, Italia) supplemented with CFC Pseudomonas Supplement incubated at 25°C for 40-48 hours (ISO 13720:2010). Each sample was analysed for pH value too (pHmeter HI90023CW - Hanna Instruments – with electrode Mettler Toledo InLab 427) as well as for the activity water (AW - Decagon Devices, AquaLab Serie 3TE). For the sensorial analysis four panelists, regularly trained in fish quality assessment, applied a demerit point system considering three parameters (odour, colour and taste) and assigning a demerit score from 10 to 0; the average of each score has provided the total sensorial score of the product.
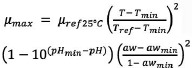
In order to characterize the bacterial behaviour, a microbial predictive model has been implemented trough the association of a primary and a secondary model. The former is the well-known Baranyi and Roberts model (1994) [Eq. 1] and the latter is the equation of Martinez-Rios et al. (2016) [Eq. 2] for calculating the growth rate as function of environmental parameters (Temperature, pH and AW) for Pseudomonads.
Figure 1.

Rapresentation of temperature fluctuation applied for “Group F” and related mean value (6,72°C), kinetic mean value (7,80°C) and 75th percentile value (11,14°C) of temperature fluctuations.
Figure 2.

Observed growth curves for Pseudomonas spp. (A), Total Viable Count in Iron Agar (B) and sensorial scores (C) along the storage at 4°C, 8°C and under fluctuating regime.
| [Eq. 1] |
 |
[Eq. 2] |
First of all, predictive model has been validated by reproducing the mean growth curves of Pseudomonas at 4°C and 8°C. In this way the initial value of “Q” (Eq. 1) has been calculated by fitting predicted to observed data. For “N0” (initial value) and “Nmax” in Eq. 1, the observed values were used. After this, the validated model has been applied to the prediction of Pseudomonas mean growth curve under temperature fluctuating regime. Further resolution has carried out applying the mean value of temperature fluctuations, the 75th percentile of temperature fluctuations and the mean kinetic value of temperature fluctuations, obtained according [Eq. 3]
 |
[Eq. 3] |
Where Tk is the Mean Kinetic Temperature in Kelvin degree;  is the activation energy (generally between 60 and 100 kj.mol-1); R is the gas constant; Ti is the temperature of ith sample in Kelvin degree; n is the number of temperature samples.
In all cases, the predictive performance of model has been evaluated by the calculation of Root Mean Square Error (RMSE). All numerical resolutions of model have been carried out by the application of Eulero techniques.
Results and Discussion
Figure 1 shows the temperature fluctuation applied for “Group F” and the related mean value (6.72°C), kinetic mean value (7.80°C) and 75th percentile value (11.14°C) of temperature.
Microbiological and sensorial result are summarised in Figure 2 that shows a shelf life of almost 33 days for product of Group 4°C while samples stored at 8°C and under fluctuating temperatures have reached a shelf life of 15 days and 22 days respectively. On this regard, note that, under the fluctuation temperature regime (“Group F”), samples have a slightly longer shelf life than samples of “Group 8°C” despite the storage temperature of both groups are meanly very close, especially if it is taken into account the kinetic mean temperature value.
The application of predictive model has allowed to obtain a good fitting with the observed curves of Group 4°C (RMSE = 0.4312), Group 8°C (RMSE = 0.4322) and Group F (RMSE = 0.5906) (Figure 3). Particularly, the prediction for samples stored under a fluctuating temperature profile has been obtained by the dynamical resolution of the equations 1 and 2 (numerical resolution step by step with the Eulero techniques), allowing to take into account the instantaneous modification of environmental parameters.
Concerning the other predictions obtained with mean value of temperature fluctuations, kinetic mean value of temperature fluctuations and 75th percentile of temperature fluctuations (Figure 4), the best reproduction has been obtained with the kinetic mean temperature (RMSE = 0.5612) in respect of mean fluctuating temperature (RMSE = 0.8623) and the 75th percentile of fluctuating temperature (RMSE = 1.0855). This result show that the kinetic mean temperature could be considered a useful method to represent the fluctuating temperature regime of the retail and domestic storage or when it is necessary to summary several studies about the storage temperature during distribution in order to individuate a representative value.
Figure 3.

Predicted growth curves against observed ones for Pseudomonas spp. at 4°C (A), 8°C (B) and under fluctuating regime (C).
Conclusions
The characterization of seafood shelflife is a complex matter that have to take into account several variables such as food characteristics, specific spoilage agents and environmental parameters with particular regard to the storage temperature, as well as the using natural or synthetic additives (Khalafalla et al., 2015; Giarratana et al., 2015; Giarratana et al., 2016; Muscolino et al., 2016; Aponte et al., 2018). Predictive microbiology could represent an interesting method for the characterization of these variables and their influence on product shelf life. Concerning the seafood, several mathematical methods have been proposed for the shelf life predicting (Dalgaard, 1995; Dalgaard et al., 1997; Giuffrida et al., 2007; Giuffrida et al., 2013; Koutsoumanis and Nychas, 2000; McClure et al., 1994; Pin and Baranyi, 1998; Ratkowsky et al., 1983; Ratkowsky et al., 1996). Some studies have explored the possibility to simulate, with an appropriate dynamic model, the combined influence of environmental parameter fluctuations and presence of natural preservative agents (Giuffrida et al., 2017; Mejlholm and Dalgaard, 2002).
In the present study, the using of a dynamic predictive model has allowed to show that the kinetic mean temperature is the best method to represent a fluctuating temperature regime of storage while the using of the mean temperature underestimates the spoilage bacteria growth. On the other hand, the application of 75th percentile of temperature fluctuations has provided an overestimation of the bacterial growth and a significative reduction of the predicted shelf life. In this regard, note that the use of the 75th percentile of temperature is suggested in the EURL Lm Guidance Document for implementing challenge tests and durability studies related to Listeria monocytogenes in ready-to-eat foods (v2, 07/05/2018), where, probably, a more precautionary approach is preferred.
Generally, we found the using of kinetic mean temperature more useful for the planning of shelf life studies, but this finding needs to a more robust validation in order to explore the effect of frequency and amplitude of fluctuations on the bacterial behaviour. At the same time, the development of probabilistic predictive models (Giuffrida et al., 2009) that allow to take into account the temperature fluctuation as a stochastic variable, could represent an interesting method to consider the fluctuating temperature during the storage at retail and domestic level.
Figure 4.

Observed growth curves of Pseudomonas spp. under fluctuating regime against mean temperature (A), kinetic mean temperature (B) and 75th percentile of temperature (C).
Funding Statement
Funding: None.
References
- Aponte M, Anastasio A, Marrone R, Mercogliano R, Peruzy M, Murru N, 2018. Impact of gaseous ozone coupled to passive refrigeration system to maximize shelf-life and quality of four different fresh fish products. LWT Food Sci Technol 93:412-9. [Google Scholar]
- Baranyi J, Roberts TA, 1994. A dynamic approach to predicting microbial growth in food. Int J Food Microbiol 23:277-94. [DOI] [PubMed] [Google Scholar]
- Corradini MG, 2018. Shelf Life of Food Products: From Open Labeling to Real- Time Measurements. Annu Rev Food Sci T 9:251-69. [DOI] [PubMed] [Google Scholar]
- Dalgaard P, 1995. Modelling of microbial activity and prediction of shelf life of packed fresh fish. Int J Food Microbiol 19:305-18. [DOI] [PubMed] [Google Scholar]
- Dalgaard P, Mejlholm O, Huss HH, 1997. Application of an iterative approach for development of a microbial model predicting the shelf life of packed fish. Int J Food Microbiol 19:169-79. [DOI] [PubMed] [Google Scholar]
- European Commission, 2005. Commission Regulation (EC) No 2073/2005 of 15 November 2005 on microbiological criteria for foodstuffs. In: Official Journal, L 338/1, 22.12.2005. [Google Scholar]
- European Parliament and of the Council, 2011. Regulation of 25 October 2011 on the provision of food information to consumers, amending Regulations (EC) No 1924/2006 and (EC) No 1925/2006 of the European Parliament and of the Council, and repealing Commission Directive 87/250/EEC, Council Directive 90/496/EEC, Commission Directive 1999/10/EC, Directive 2000/13/EC of the European Parliament and of the Council, Commission Directives 2002/67/EC and 2008/5/EC and Commission Regulation (EC) No 608/2004, 1169/2011/EU. In: Official Journal, L 304/18, 22.11.2011 [Google Scholar]
- Fu B, Labuza TP, 1993. Shelf-life prediction: theory and application. Food Control 4:125-33. [Google Scholar]
- Giarratana F, Crinò C, Muscolino D, Beninati C, Ziino G, Giuffrida A, Panebianco A, 2015. Preliminary investigation on the use of allyl isothiocyanate to increase the shelf-life of gilthead sea bream (Sparus aurata) fillets. Ital J Food Saf 4:172-4. [DOI] [PMC free article] [PubMed] [Google Scholar]
- Giarratana F, Muscolino D, Beninati C, Ziino G, Giuffrida A, Panebianco A, 2016. Activity of R(+) limonene on the maximum growth rate of fish spoilage organisms and related effects on shelflife prolongation of fresh gilthead sea bream fillets. Int J Food Microbiol 237:109-13. [DOI] [PubMed] [Google Scholar]
- Giuffrida A, Valenti D, Giarratana F, Ziino G, Panebianco A, 2013. A new approach to modelling the shelf life of Gilthead seabream (Sparus aurata). Int J Food Sci Technol 48:1235-42. [Google Scholar]
- Giuffrida A, Ziino G, Valenti D, Donato G, Panebianco A, 2007. Application of an interspecific competition model to predict the growth of Aeromonas hydrophila on fish surfaces during refrigerated storage. Archiv Lebensmittelhyg 58:136-41. [Google Scholar]
- Giuffrida A, Giarratana F, Valenti D, Muscolino D, Parisi R, Parco A, Marotta S, Ziino G, Panebianco A, 2017. A new approach to predict the fish fillet shelf-life in presence of natural preservative agents. Ital J Food Saf 6:88-92. [DOI] [PMC free article] [PubMed] [Google Scholar]
- Giuffrida A, Valenti D, Ziino G, Spagnolo B, Panebianco A, 2009. A stochastic interspecific competition model to predict the behaviour of Listeria monocytogenes in the fermentation process of a traditional Sicilian salami. Euro Food Res Technol 228:767-75. [Google Scholar]
- Gram L, Trolle G, Huss HH, 1987. Detection of specific spoilage bacteria from fish stored at low (0°C) and high (20°C) temperatures. Int J Food Microbiol 4:65-72. [Google Scholar]
- ISO, 2010. Meat and meat products - Enumeration of presumptive Pseudomonas spp. ISO Norm 13720:2010. International Standardization Organization Geneva, Switzerland. [Google Scholar]
- ISO, 2017. Microbiology of the food chain - Horizontal methods for the detection and enumeration of Enterobacteriaceae Part 2: Colony-count method. ISO Norm 21528-2:2017. International Standardization Organization Geneva, Switzerland. [Google Scholar]
- James C, Onarinde BA, James SJ, 2017. The Use and Performance of Household Refrigerators: A Review. Compr Rev Food Sci S 16:160-79. [DOI] [PubMed] [Google Scholar]
- Khalafalla FA, Ali F, Hassan HA. 2015. Quality improvement and shelf-life extension of refrigerated Nile tilapia (Oreochromis niloticus) fillets using natural herbs. Beni-Seuf Univ J Appl Sci 4:33-40. [Google Scholar]
- Koutsoumanis K, Nychas GJE, 2000. Application of a systematic experimental procedure to develop a microbial model for rapid fish shelf life predictions. Int J Food Microbiol 60:171-84. [DOI] [PubMed] [Google Scholar]
- Martinez-Rios V, Bjerre Østergaard N, Gkogka E, Sand Rosshaug P, Dalgaard P, 2016. Modelling and predicting growth of psychrotolerant pseudomonads in milk and cottage cheese. Int J Food Microbool 216:110-20. [DOI] [PubMed] [Google Scholar]
- McClure PJ, Cole MB, Davies KW, 1994. An example of the stages in the development of a predictive mathematical model for microbial growth: the effects of NaCl, pH and temperature on the growth of Aeromonas hydrophila. Int J Food Microbiol 23:359-75. [DOI] [PubMed] [Google Scholar]
- Mejlholm O, Dalgaard P, 2002. Antimicrobial effect of essential oils on the seafood spoilage micro-organism Photobacterium phosphoreum in liquid media and fish products. Lett App Microbiol 34:27-31. [DOI] [PubMed] [Google Scholar]
- Muscolino D, Giarratana F, Beninati C, Ziino G, Giuffrida A, Panebianco A, 2016. Effects of allyl isothiocyanate on the shelf-life of gilthead sea bream (Sparus aurata) fillets. Czech J Food Sci 34:160-5. [DOI] [PMC free article] [PubMed] [Google Scholar]
- Nunes MCN, Nicometo M, ´Emond JP, Melis RB, Uysal I. 2014. Improvement in fresh fruit and vegetable logistics quality: Berry logistics field studies. Philos Trans R Soc A: Math Phys Eng Sci 372:20130307. [DOI] [PubMed] [Google Scholar]
- Pelletier W, Brecht JK, Nunes MCN, Emond JP, 2011. Quality of strawberries shipped by truck from California to Florida as influenced by postharvest temperature management practices. Hort Technol 21:482-93. [Google Scholar]
- Pin C, Baranyi J, 1998. Predictive models as means to quantify the interactions of spoilage organisms. Int J Food Microbiol 41:59-72. [DOI] [PubMed] [Google Scholar]
- Raab V, Bruckner S, Beierle E, Kampmann Y, Petersen B, Kreyenschmidt J, 2008. Generic model for the prediction of remaining shelf life in support of cold chain management in pork and poultry supply chain. J Chain Netw Sci 8:59-73. [Google Scholar]
- Ratkowsky DA, Lowry RK, McMeekin TA, Stokes AN, Chandler RE. 1983. Model for bacterial culture growth rate throughout the entire biokinetic temperature range. J Bacteriol 154:1222-6. [DOI] [PMC free article] [PubMed] [Google Scholar]
- Ratkowsky DA, Ross T, Macario N, Dommett TW, Kamperman L, 1996. Choosing probability distributions for modelling generation time variability. J Appl Bacteriol 80:131-7. [Google Scholar]
- Renard CM, Ginies C, Gouble B, Bureau S, Causse M. 2013. Home conservation strategies for tomato (Solanum lycopersicum): storage temperature vs. duration – is there a compromise for better aroma preservation? Food Chem 139:825-36. [DOI] [PubMed] [Google Scholar]
- Roccato A, Uyttendaele M, Membré JM, 2017. Analysis of domestic refrigerator temperatures and home storage time distributions for shelf-life studies and food safety risk assessment. Food Res Int 96:171-81. [DOI] [PubMed] [Google Scholar]
- Vergara A, Festino AR, Di Ciccio P, Costanzo C, Pennisi L, Ianieri A, 2014. The management of the domestic refrigeration: Microbiological status and temperature. Br Food J 116:1047-57. [Google Scholar]