Abstract
Scope
To predict gut microbial metabolism of xenobiotics and the resulting plasma concentrations of metabolites formed, an in vitro–in silico‐based testing strategy is developed using the isoflavone daidzein and its gut microbial metabolite S‐equol as model compounds.
Methods and results
Anaerobic rat fecal incubations are optimized and performed to derive the apparent maximum velocities (V max) and Michaelis–Menten constants (K m) for gut microbial conversion of daidzein to dihydrodaidzein, S‐equol, and O‐desmethylangolensin, which are input as parameters for a physiologically based kinetic (PBK) model. The inclusion of gut microbiota in the PBK model allows prediction of S‐equol concentrations and slightly reduced predicted maximal daidzein concentrations from 2.19 to 2.16 µm. The resulting predicted concentrations of daidzein and S‐equol are comparable to in vivo concentrations reported.
Conclusion
The optimized in vitro approach to quantify kinetics for gut microbial conversions, and the newly developed PBK model for rats that includes gut microbial metabolism, provide a unique tool to predict the in vivo consequences of daidzein microbial metabolism for systemic exposure of the host to daidzein and its metabolite S‐equol. The predictions reveal a dominant role for daidzein in ERα‐mediated estrogenicity despite the higher estrogenic potency of its microbial metabolite S‐equol.
Keywords: daidzein, gut microbiota, in vitro–in silico strategy, physiologically based kinetic modeling, S‐equol
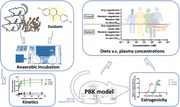
In vitro anaerobic incubations of rat feces are optimized, and kinetic parameters of microbial metabolism of daidzein to dihydrodaidzein, S‐equol, and O‐desmethylangolensin are derived. A physiologically based kinetic model including a gut microbial compartment is developed, and plasma concentrations of daidzein and S‐equol following daidzein ingestion are predicted. Results show that daidzein likely dominates ERα‐mediated estrogenicity in rats, despite its lower potency than S‐equol.
1. Introduction
The human intestinal tract is host to a diverse microbial community consisting of bacteria, yeasts, viruses, archaea, fungi, and protozoa, of which anaerobic bacteria are dominating in number especially in the distal colon where the microbial density is the highest.[ 1 ] The gut microbiota is known to play an important role in the health of the host, among others through metabolism of indigestible food components, formation of vitamins, and protection of the host from pathogens.[ 2 , 3 ] While there are significant interindividual differences in the composition of the microbiota, these do not necessarily translate to functional differences.[ 4 ] Yet, dysbiosis of the gut microbiota is associated with various diseases, such as nonalcoholic fatty liver disease, metabolic disorders, inflammatory bowel disease, and autism.[ 5 , 6 , 7 , 8 , 9 ] The gut microbiota can further affect the susceptibility of its host to adverse effects caused by foodborne chemicals and pharmaceuticals by modifying their toxicity through a broad range of reactions, such as reduction, hydrolysis, dehydroxylation, acetylation, deacetylation, and N‐oxide cleavage.[ 10 , 11 ]
To reduce the use of animal experimentation, toxicity testing is currently undergoing a paradigm shift away from the use of experimental animals toward the use of human‐based in vitro experimentation combined with in silico modeling. At the heart of these testing strategies, physiologically based kinetic (PBK) models are used to describe the absorption, distribution, metabolism, and excretion (ADME) to make sure kinetics are taken into account when using in vitro data to conclude on the in vivo situation.[ 12 ] With PBK modeling based reverse dosimetry, in vitro concentration–response curves can be translated to in vivo dose–response curves that allow definition of points of departure that are required in risk assessment. In previous work we have shown proofs‐of‐principle for predicting, for example, liver toxicity of the pyrrolizidine alkaloids lasiocarpine and riddelliine in rats[ 13 ] and human,[ 14 ] kidney toxicity of aristolochic acid I,[ 15 ] and developmental toxicity of glycol ethers,[ 16 ] phenols,[ 17 , 18 ] and all‐trans‐retinoic acid.[ 19 ] Currently established PBK models, however, entirely ignore the gut microbiota, which may turn out an issue for compounds where metabolism by gut microbiota plays an important role in their ADME characteristics and/or toxicity.[ 12 , 20 ] Currently established PBK models focus on the use of mammalian cell lines and tissue samples, yet entirely ignore the gut microbiota.
The isoflavone daidzein is an extensively studied example of a phytochemical that is affected by gut microbial metabolism. Daidzein is present in high levels in soybeans and soy products and is commonly consumed especially in Asian and vegetarian diets.[ 21 ] Microbial metabolism of daidzein yields dihydrodaidzein (DHD), which is subsequently further metabolized to S‐equol and O‐desmethylangolensin (O‐DMA) by the gut microbiota (Figure 1 ).[ 22 , 23 ] The metabolite S‐equol is reported to have a higher bioavailability and slower clearance than daidzein,[ 24 ] and to be a more potent inducer of estrogen receptors (ERs) than daidzein.[ 25 ] S‐equol is reported to preferentially bind to ERβ over ERα.[ 26 ] Opposite to ERα activation, which is associated with adverse health effects through induction of cell proliferation, ERβ activation is associated with beneficial health effects through anti‐proliferative activities.[ 27 ] The microbial metabolite S‐equol, however, is only produced by 20–35% of the Western adult population and 50–55% of the Asian adult population.[ 22 , 28 , 29 ] Most animal species are reported to be capable of producing S‐equol,[ 30 ] which indicates that studies in laboratory animals might overestimate the effect of isoflavone ingestion when compared to the general human population. Importantly, S‐equol‐producing individuals are reported to benefit more from isoflavone ingestion than nonproducers.[ 31 ] Some previous studies have isolated and characterized different bacterial strains from human and animal feces capable of converting daidzein to S‐equol or intermediates.[ 32 , 33 , 34 , 35 ] The conversion of daidzein to S‐equol is catalyzed by three reductases, i.e., daidzein reductase, dihydrodaidzein reductase, and tetrahydrodaidzein reductase, possibly involving NAD(P)H, flavin adenine dinucleotide, and flavin mononucleotide as cofactors.[ 36 , 37 , 38 , 39 , 40 , 41 ] However, these previous studies with isolated bacteria did not enable quantification of kinetic parameters required to include the gut microbial conversion of daidzein in PBK models.
Figure 1.
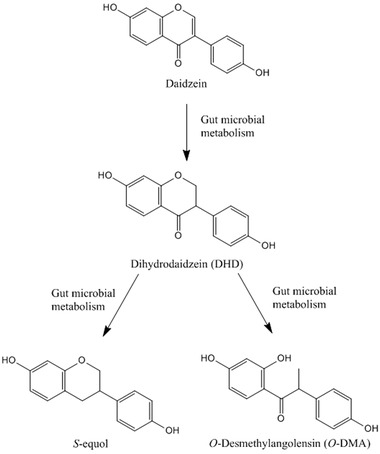
Schematic of daidzein metabolism by gut microbiota.
In the present study, the metabolic rates of gut microbial metabolism of the model compound daidzein in rats were derived using anaerobic fecal incubations. Based on the kinetic data obtained, a PBK model described by Boonpawa et al.[ 42 ] was adapted to contain a gut microbial compartment, allowing to predict plasma concentrations not only of the isoflavone daidzein but also of its most important metabolite S‐equol and relevant phase II metabolites. The predicted concentrations of these metabolites are compared to in vivo concentrations reported in literature.
2. Experimental Section
2.1. Materials and Standard Chemicals
Pooled Sprague Dawley (SD) male rat liver S9 was obtained from Corning (MA, USA). Daidzein, S‐equol, 17β‐estradiol (E2), DMSO, glycerol, alamethicin, uridine 5′‐diphosphoglucuronic acid (UDPGA), Tris, trans‐1,2‐diaminocyclohexane‐N,N,N′,N′‐tetracetic acid monohydrate (CDTA), tricine, (MgCO3)4Mg(OH)2·5H2O, luciferin Na‐salt, adenosine triphosphate (ATP), and 1,4‐dithiothreitol (DTT) were purchased from Sigma‐Aldrich (Zwijndrecht, The Netherlands) at the highest purity available. DHD was obtained from Cayman Chemical (AA, USA) and O‐DMA was purchased from Plantech (Reading, UK). Ethanol, trifluoroacetic acid (TFA), MgCl2, CuSO4, 37% HCl, MgSO4·7H2O, NaOH, ethylenedinitrotetraacetic acid (EDTA·2H2O; Titriplex III), and KCl were purchased from VWR International (Amsterdam, The Netherlands). Ultra‐performance liquid chromatography (UPLC) grade solvents ACN and methanol were obtained from Biosolve BV (Valkenswaard, The Netherlands). The human osteosarcoma U‐2 OS ERα cell line and the U‐2 OS Cytotox cell line were kindly provided by BioDetection Systems (Amsterdam, The Netherlands). Fetal calf serum (FCS) was obtained from Bodinco (Alkmaar, The Netherlands). PBS, fetal calf serum treated with dextran coated charcoal (DCC‐FCS), DMEM/F‐12 (catalog number 31331‐028) and DMEM/F‐12 (catalog number 21041‐025) were supplied by Gibco (Paisley, UK). Nonessential amino acids (NEAA), trypsin (0.025%), and G418 disulfate salt (geneticin) were obtained from Invitrogen Life Technologies (Breda, The Netherlands). Ninety‐six‐well plates were purchased from Greiner Bio‐One (Frickenhausen, Germany) and polystyrene cell culture flasks were purchased from Corning (Amsterdam, The Netherlands). 5 × 9 cm sterile medical gauze dressing was purchased from HEKApres (Venray, The Netherlands; catalog number KO 0036).
2.2. Anaerobic Incubation of Rat Feces
Fresh fecal samples from Wistar rats (20 males and 20 females) were kindly provided by BASF (Ludwigshafen, Germany). Feces were obtained by physical stimulation, weighed, and immediately transferred into an anaerobic solution of 10% v/v glycerol in PBS and diluted to a final fecal concentration of 20% w/v. Pooled samples were homogenized using a sterile glass wand, tubes flushed with N2 gas, and stored at −80 °C until further use. Subsequently, samples were filtered using sterile gauze under anaerobic conditions, and aliquoted samples of resulting fecal slurry were stored at −80 °C until use.
Conditions for anaerobic incubation of rat feces were optimized to achieve linear depletion of the substrate and linear formation of metabolites over time and concentration of feces. Incubation solutions of 100 µL were prepared in anaerobic PBS containing 0.3% to 8% feces (v/v), and 0.5% daidzein added from 200 times concentrated stock solutions in DMSO (final concentration 17.5 µm). Samples were prepared in an anaerobic chamber (Sheldon, Cornelius, USA) with an atmosphere of 85% N2, 10% CO2, and 5% H2, and incubated in the same atmosphere at 37 °C. After incubation, 1 volume of ice‐cold methanol was added to terminate the reaction. Subsequently, samples were put on ice for 10 min and centrifuged at 21 500 × g for 15 min at 4 °C to precipitate microorganisms, particles, and proteins. Quantification of the substrate and metabolites in supernatants was subsequently done using UPLC analysis performed as described below. For the kinetic incubations, 6% of feces (v/v) and an incubation duration of 35 min were chosen as optimal conditions.
To obtain the kinetics of rat microbial conversion of daidzein, incubations were carried out with a range of daidzein concentrations from 2.2 to 70 µm. Incubation solutions of 100 µL were prepared containing 30% (v/v) fecal slurry (i.e., 6% (w/v) final concentration of feces in reactions), 69.5% anaerobic PBS (v/v), and 0.5% daidzein (v/v) added from 200 times concentrated stock solutions in DMSO resulting in final concentrations as indicated. Solvent control and negative control samples were prepared either without daidzein (replaced by 0.5% volume of DMSO) or without fecal slurries (replaced by 30% volume of anaerobic PBS), respectively. These samples were prepared and processed in the same way as stated above. Incubations were repeated three times.
2.3. Glucuronidation of S‐Equol by Rat Liver S9
Incubations with pooled liver S9 fractions from male SD rats were performed as described by Islam et al.[ 43 ] with some modifications. Incubation mixtures of 100 µL were prepared containing 10 mm UDPGA, 0.025 mg mL−1 alamethicin (added from a 200‐time concentrated stock solution in methanol), and 0.5 mg protein mL−1 rat liver S9 fractions in 50 mm Tris‐HCl (pH 7.4) with 10 mm of MgCl2. After pre‐incubation in a shaking water bath at 37 °C for 1 min, reactions were initiated by adding 0.5 µL of the substrate S‐equol (from 200 times concentrated stock solutions in DMSO) resulting in final concentrations ranging from 1 to 200 µm. After incubation in a shaking water bath at 37 °C for 5 min, reactions were terminated by adding 25 µL of ice‐cold ACN. Under these conditions, glucuronidation of S‐equol was linear in time and with protein concentration (data not shown). Negative and blank controls were performed in the absence of either the substrate or UDPGA. Samples were subsequently centrifuged at 21 500 × g for 15 min at 4 °C to precipitate proteins. Supernatants were stored at −80 °C until UPLC analysis. Incubations were repeated three times.
2.4. UPLC Analysis
UPLC analysis was performed to quantify the concentrations of daidzein and its metabolites. The Waters ACQUITY UPLC system (Etten‐Leur, The Netherlands) was equipped with a guard column and a Waters Acquity UPLC BEH C18 (1.7 µm, 2.1 × 50 mm) column. 0.1% TFA in nanopure water (v/v) was used as solvent A and ACN as solvent B. The injection volume was 3.5 µL and wavelengths of 190–320 nm were recorded using a Waters photodiode array detector.
For analysis of gut microbial metabolites, a flow rate of 0.3 mL min−1 was applied, and elution was performed using the following gradient: 0% B in 0–1.00 min; 0–25% B in 1.00‐1.30 min; 25–30% B in 1.30–2.70 min; 30–80% B in 2.70–3.70 min, 80–100% in 3.70–4.00 min, 100% B for 4.00–5.00, 100–0% B in 5.00–6.00 min, and 0% B between 6.00–7.00 min. Identification and quantification of daidzein and its microbial metabolites, that is, DHD, S‐equol, and O‐DMA, were achieved using commercially available standards at a wavelength of 280 nm.
For the detection of rat liver S9 incubation products, a flow rate of 0.4 mL min−1 was applied, and elution was performed using the following gradient: 0–18% B in 0.20–0.40 min; 18% B for 0.20–3.00 min; 18–30% B in 3.00–3.50 min; 30–80% B in 3.50–5.00 min, 80–100% in 5.00–5.50 min, 100% B for 5.50–6.00, 100–0% B in 6.00–6.50 min, and 0% B between 6.50 and 7.00 min. To verify the type of conjugation, non‐terminated samples were incubated with beta‐glucuronidase standard S‐equol was used as a reference to allow quantification at the wavelength of 280 nm.
2.5. Kinetic Analysis
Kinetic constants, including the apparent maximum velocity (V max) expressed in µmol h−1 g−1 feces and µmol h−1 g−1 protein, and the apparent Michaelis–Menten constant (K m) expressed in µm, were derived to describe the gut microbial conversion of daidzein and the glucuronidation of S‐equol, using GraphPad Prism 5.04 (GraphPad Software, CA, USA). Data from rat fecal anaerobic incubations of daidzein and rat liver S9 incubations of S‐equol were fitted to the standard Michaelis–Menten equation.
| (1) |
where v is the conversion rate and [S] represents the substrate concentration.
2.6. PBK Model Development
The schematic structure of the PBK model for daidzein and S‐equol is shown in Figure 2 . This newly defined conceptual PBK model includes a main model for the parent compound daidzein, which involves separate compartments for blood, liver, fat, rapidly perfused tissue (e.g., heart, lung, and brain), and slowly perfused tissue (e.g., skin, muscle, and bone). This model was based on the model previously reported and validated for the related isoflavone genistein.[ 42 ] To simulate reactions in the intestine, the small intestinal lumen, small intestinal tissue, and the large intestinal lumen were described as separate compartments, where the gut microbial metabolic activities were described in the large intestinal lumen. The conversion of daidzein by the gut microbiota resulted in the formation of three metabolites, DHD, S‐equol, and O‐DMA. S‐equol was modeled to directly enter the liver from the large intestinal lumen with the rate constant of 3.43 h−1, as the phase II metabolism of large intestinal tissue was considered negligible compared to that of the liver. To be able to predict the plasma concentrations of S‐equol, being the most important metabolite due to its biological activity, a sub‐model was prepared to describe its distribution and metabolism.
Figure 2.
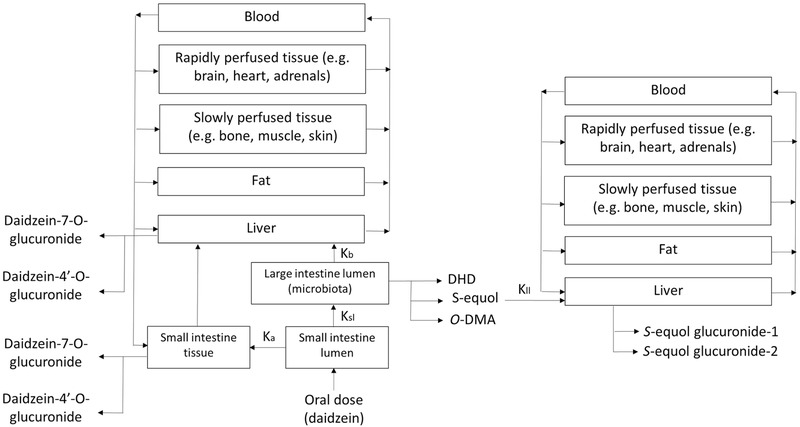
Schematic structure of the PBK model. The left part is the part that describes the metabolism of daidzein, which partly converts to S‐equol in the large intestinal lumen by gut microbiota and is then imported in the right part of the model which describes the metabolism of S‐equol. All compartments including blood, rapidly and slowly perfused tissues, fat and liver are identical in the two parts of the model.
In order to develop a PBK model, three types of parameters are needed: i) physiological and anatomical descriptors, ii) physico‐chemical parameters such as partition coefficients of the compound, and iii) kinetic parameters which describe the metabolic reactions.[ 20 ] Values for the first two classes of parameters are presented in Table 1 . Physiological parameter values such as tissue volumes and blood flows, were obtained from literature.[ 44 ] Tissue/blood partition coefficients were calculated based on the method reported by DeJongh et al.[ 45 ] using the octanol‐water partition coefficient (Log P) of 2.51 and 3.20 for daidzein and S‐equol,[ 46 ] respectively.
Table 1.
Parameters used for the PBK model of daidzein and S‐equol in rats
| Physiological parameters[ 44 ] | Tissue: Blood partition coefficients[ 45 , 46 ] | ||||||
|---|---|---|---|---|---|---|---|
| Body weight [kg] | 0.25 | Cardiac output [L h−1] | 5.38 | Daidzein | S‐equol | ||
| Percentage of body weight | Percentage of cardiac output | Intestine | 1.62 | Intestine | 2.44 | ||
| Small intestine | 1.4 | Intestine | 15.1 | Liver | 1.62 | Liver | 2.44 |
| Liver | 3.4 | Liver | 9.9 | Rapidly perfused tissue | 1.62 | Rapidly perfused tissue | 2.44 |
| Rapidly perfused tissue | 6.8 | Rapidly perfused tissue | 51.0 | Slowly perfused tissue | 0.58 | Slowly perfused tissue | 0.72 |
| Slowly perfused tissue | 66.7 | Slowly perfused tissue | 17.0 | Fat | 44.75 | Fat | 96.29 |
| Fat | 7.0 | Fat | 7.0 | ||||
| Blood | 7.4 | ||||||
| Non‐perfused tissue | 5.7 | ||||||
| GI tract contents | 5.0 | ||||||
Kinetic parameters V max and K m defined in rat fecal anaerobic incubations as described above were used to describe gut microbial conversions from daidzein to DHD, S‐equol, and O‐DMA, as was required for model development. To this end, rat fecal anaerobic incubations were carried out as described above. The obtained apparent V max values expressed in µmol h−1 g−1 feces were scaled to the whole body using a fecal fraction of body weight 0.0164.[ 47 ]
Kinetic constants of daidzein glucuronidation by liver and small intestinal tissue samples were taken from published literature,[ 43 ] whereas formation of sulfated metabolites was considered to be negligible, since previous studies showed the catalytic efficiencies (V max/K m) for sulfation to be at least two orders of magnitude lower than glucuronidation.[ 43 ] Kinetic constants for rat liver glucuronidation of S‐equol were obtained by performing incubations with pooled SD male rat liver S9 fractions, carried out as described above.
V max values (nmol min−1 mg−1 protein) of glucuronidation in small intestine and liver were scaled to in vivo V max values, using an S9 protein yield of 38.6 and 143 mg g−1 tissue for small intestine and liver, respectively. These values were obtained from the sum of cytosolic protein yield of 18 and 108 mg g−1 tissue and microsomal protein yield of 20.6 and 35 mg g−1 tissue for small intestine and liver, respectively.[ 48 , 49 ] The scaled V max values and the catalytic efficiencies were calculated as follows:
Large intestinal lumen:
| (2) |
Small intestine:
| (3) |
Liver:
| (4) |
Catalytic efficiency:
In vitro catalytic efficiency (mL h−1 g−1 feces) = V max (µmol h−1 g−1 feces) K m −1 (µm)*1000 (mL L−1)
In vitro catalytic efficiency (mL min−1 mg−1 S9 protein) = V max (nmol min−1mg−1 S9 protein) K m −1 (µm)
Scaled catalytic efficiency (L h−1) = scaled V max (µmol h−1) K m −1 (µm)
The PBK model equations were coded and numerically integrated in Berkeley Madonna 8.3.18 (UC Berkeley, CA, USA) using Rosenbrock's algorithms for stiff systems. The model code is presented in Section S1, Supporting Information.
2.7. Sensitivity Analysis
A sensitivity analysis was performed using a relatively simple linear method[ 50 ] to assess which parameters of the PBK model have the largest impact on predicted maximum plasma concentrations (C max) of daidzein and S‐equol. Normalized sensitivity coefficients (SCs) were calculated according to the following equation.[ 50 ]
| (5) |
where C stands for the initial value of model output; C′ is the modified value of model output with a 5% increase of an input parameter; P is the initial parameter value; and P′ is the parameter value with an increase of 5%. For sensitivity analysis, only one parameter is changed each time, while other parameters are kept at their initial values. A large SC value indicates a large impact of this parameter on predicted plasma C max of daidzein and S‐equol. Oral doses of 2, 38, and 80 mg kg−1 bw daidzein were used to carry out the sensitivity analysis, which are the reported highest daily intake in a Western diet, average daily intake in an Asian diet, and the highest dose when consuming soy supplements, respectively.[ 51 ]
The linear sensitivity analysis now performed was a simple first tier approach aiming to provide initial information about which parameters influence the predicted C max values most, while a more extended analysis of variability in the thus identified most influential parameters, for example via example Monte Carlo modeling, might provide additional insight in intraspecies differences.[ 52 , 53 , 54 ]
To further assess how gut microbial related kinetic parameters V max and K m affect plasma C max of daidzein and S‐equol, a sensitivity analysis was performed using K m and V max values amounting to their mean value plus or minus the standard deviation (P′ in the formula equals P plus or P minus the respective standard deviation).
2.8. Estrogen Receptor‐Mediated Chemical‐Activated Luciferase Gene Expression Assay of Daidzein and S‐Equol
To assess the estrogenic potency of daidzein and S‐equol, the reporter gene assay ERα‐CALUX was performed, using the human osteosarcoma U‐2 OS ERα cell line which is stably expressing ERα in addition to a 3× estrogen response element (ERE) and TATA box binding protein combined with a luciferase gene as reporter.[ 55 ]
Cells were cultured at 37 °C in a humidified atmosphere and 5% CO2. Cell culture medium used was DMEM/F‐12 (with phenol red) supplemented with 5% DCC‐FCS (v/v), 1% NEAA (v/v), and 1% penicillin streptomycin. Cultures were trypsinized and subcultured at a ratio of 1:6 to 1:8 twice per week, when grown to 70–80% confluence. 2 days before plating of the cells to perform the assay, cells were exposed to 0.2 mm geneticin in the cell culture medium to exert selection pressure.
To perform the assay, cells were trypsinized and plated in the inner 60 wells of 96‐well plates with a density of 1 × 10⁴ cells per well in 100 µL per well of assay medium. Assay medium used was DMEM/F‐12 (without phenol red) supplemented with 10% FCS (v/v) and 1% NEAA (v/v). The outer 36 wells were filled only with 200 µL PBS. After 24 h, the assay medium was carefully aspirated and replaced by 100 µL fresh assay medium per well. After another 24 h of incubation, assay medium was aspirated and 100 µL exposure medium was added. Exposure medium consisted of test compounds in DMSO (0.5% final concentration) prepared from 200 times concentrated stocks in assay medium, and cells were exposed to 0.01–1000 pm E2, 0.1–100 000 nm daidzein, or 0.1–100 000 nm S‐equol, 1000 pm of E2 (positive control for ERα activation), 1 mm of CuSO4 (positive control for cytotoxicity), and 0.5% DMSO as solvent control in each plate. Every condition was tested in six replicates per plate. Cells were incubated with test chemicals for 24 h, after which cells were washed with 100 µL PBS, and 30 µL low salt buffer (LSB) were subsequently added to each well to lyze the cells. LSB contained 0.12% Tris, 0.03% DTT, and 0.07% CDTA in nanopure water (w/w). Plates were placed on ice for 15 min and frozen at −80 °C overnight before measurement. Experiments were repeated three times.
For measurement, plates were thawed on a plate shaker at room temperature for 1 h, and then luciferase activity was measured using flash mix in a GloMax Multi+ luminometer (Promega, CA, USA) at room temperature. Flash mix consisted of 20 mm tricine, 1.07 mm (MgCO3)4Mg(OH)2, 2.67 mm MgSO4, 0.1 mm EDTA, 2 mm DTT, 0.47 mm luciferin, and 5 mm ATP in nanopure water (pH 7.8). The resulting relative light units (RLUs) were standardized by subtracting the background of the solvent control, and expressing results relative to the maximum luciferase response of E2 set at 100%.
Flavonoids are known to exert post‐translational effects on luciferase.[ 56 , 57 ] To be able to correct the results of the ERα‐CALUX for these effects, the post‐translational effects of daidzein and S‐equol on luciferase were studied in U‐2 OS Cytotox cells constitutively expressing luciferase.[ 58 ] In this assay, post‐translational stabilization of luciferase leads to increased luciferase activity, and cytotoxicity leads to reduced luciferase activity. Cell culturing, plating, and exposure conditions were identical to the ERα‐CALUX assay described above. Experiments were also repeated three times.
The results of the ERα‐CALUX assay were corrected for post‐translational effects of the test chemicals on the reporter enzyme. To this end, chemical‐induced changes to luciferase activity in the Cytotox assay relative to the solvent control were calculated, and the results of the ERα‐CALUX were divided by the respective factors. A nonlinear regression was fitted to the data (three‐parameter dose–response curve with a Hill slope of 1.0) to the corrected data to obtain the concentration–response curves for each compound, using GraphPad Prism 5.04.
3. Results
3.1. Clearance of Daidzein in Rat Fecal Anaerobic Incubations
To assess gut microbial metabolism of daidzein, anaerobic incubations of daidzein with rat feces were performed. Figure 3 shows the depletion of daidzein at different concentrations of feces. It can be seen that at low concentrations of feces (i.e., 0.3%, 0.6%, 0.9%, and 1.2%), there is no or very low metabolism due to lag phases, while at high concentrations of feces (i.e., 4%, 6%, and 8%), metabolism starts immediately. At high concentrations of feces, there are linear increases in the rate of daidzein depletion over fecal concentrations, and from that linear range 6% feces was selected for subsequent experiments. The rates of daidzein depletion were linear over time for at least 1 h, and thus, the incubation time of 35 min was selected for subsequent experiments.
Figure 3.
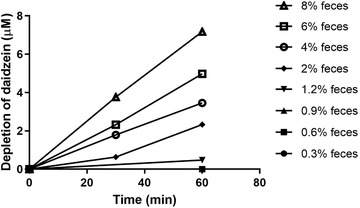
Depletion of daidzein (starting concentration 17.5 µm) in anaerobic incubations containing increasing concentrations of rat feces.
3.2. Kinetic Constants of Metabolite Formation from Daidzein in Rat Fecal Incubations
Figure 4 presents the daidzein concentration dependent apparent formation rates of DHD, S‐equol, and O‐DMA in rat fecal incubations. The metabolite formation followed Michaelis–Menten kinetics and allowed definition of apparent V max and K m values. Catalytic efficiencies (calculated as V max/Km) for the formation of DHD, S‐equol, and O‐DMA derived from these kinetic parameters were calculated, and are shown in Table 2 . Of the three microbial metabolites, S‐equol is formed with the highest catalytic efficiency, which is 1.3‐ and 15.7‐fold as high as that of DHD and O‐DMA, respectively.
Figure 4.
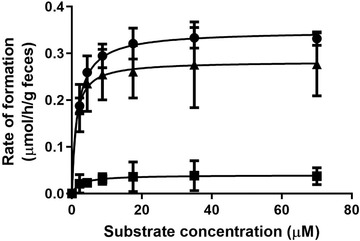
Concentration‐dependent formation of DHD (circles), S‐equol (triangles), and O‐DMA (squares) in rat fecal incubations with daidzein under anaerobic conditions. Data are presented as mean ± SD of triplicate experiments.
Table 2.
Kinetic parameters for formation of daidzein gut microbial metabolites
| DHD | S‐equol | O‐DMA | |
|---|---|---|---|
| V max [µmol h−1 g−1 feces] | 0.35 ± 0.01 | 0.28 ± 0.02 | 0.04 ± 0.01 |
| K m [µm] | 1.69 ± 0.21 | 1.08 ± 0.55 | 2.42 ± 2.31 |
| Catalytic efficiency [mL h−1 g−1 feces] | 207.10 ± 31.65 | 259.26 ± 150.55 | 16.53 ± 19.9 |
3.3. Enzymatic Conjugation of S‐Equol in Incubations with Pooled Rat Liver S9 Fractions
Kinetic parameters for liver phase II glucuronidation of S‐equol were determined by in vitro incubations of pooled rat liver S9 fractions, as glucuronidation is the major pathway of host phase II conjugation of S‐equol. Two glucuronides of S‐equol were formed at similar rates in these incubations (Figure 5 ). Due to the molecular structure of S‐equol, only having hydroxyl groups available for glucuronidation at the 4′ and 7 positions, the formed metabolites are likely S‐equol‐4′‐O‐glucuronide and S‐equol‐7‐O‐glucuronide. The formation of the glucuronides followed Michaelis–Menten kinetics, resulting in V max values of 11.0 and 10.6 nmol min−1 mg−1 S9 protein, and K m values of 22.5 and 13.7 µm for formation of S‐equol glucuronide‐1 and glucuronide‐2, respectively (Table 3 ). The catalytic efficiency for the formation of S‐equol glucuronide‐2 is 1.6 times higher than that for formation of glucuronide‐1, especially because of a 1.6‐fold lower K m.
Figure 5.
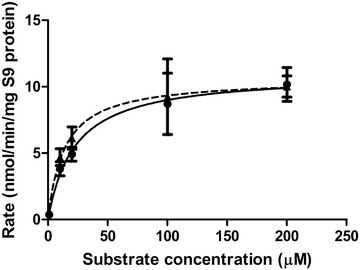
Concentration‐dependent formation of S‐equol glucuronide‐1 (circles with solid line) and glucuronide‐2 (triangles with dashed line) in incubations with pooled liver S9 fractions from male SD rats. Data are presented as mean ± SD of triplicate experiments.
Table 3.
Kinetic parameters for formation of S‐equol phase II metabolites by pooled rat liver S9 fractions
| S‐equol glucuronide‐1 | S‐equol glucuronide‐2 | |
|---|---|---|
| V max [nmol min−1 mg−1 S9 protein] | 11.0 | 10.6 |
| K m [µm] | 22.5 | 13.7 |
| Catalytic efficiency [mL min−1 mg−1 S9 protein] | 0.49 | 0.77 |
| Scaled V max [µmol h−1] | 802.23 | 773.06 |
| Scaled catalytic efficiency [L h−1] | 35.65 | 56.43 |
3.4. PBK Modeling
3.4.1. Influence of Microbial Metabolism on Plasma Concentrations of Daidzein and S‐Equol
PBK modeling was used to predict the effect of gut microbial metabolism on the plasma concentrations of daidzein and its metabolite S‐equol in the host.
The results obtained provide a first proof‐of‐concept for including the gut microbiota as a separate compartment in the PBK model structure, confirming that only in this way occurrence of S‐equol in host plasma can be predicted. This is clearly shown in Figure 6A which presents the predicted time‐dependent plasma concentration of S‐equol for both the PBK model without and with the gut microbiota included. It can be seen that upon oral dosing of 20 mg kg−1 bw daidzein, S‐equol is not present in the circulation when microbial metabolism is not included in the PBK model, since its plasma concentration remains zero. Once microbial activity is introduced into the model, S‐equol concentrations show a typical pharmacokinetic curve with a C max of 0.007 µm. This is a proof‐of‐concept that the current developed PBK model including microbiota as a separate compartment works.
Figure 6.
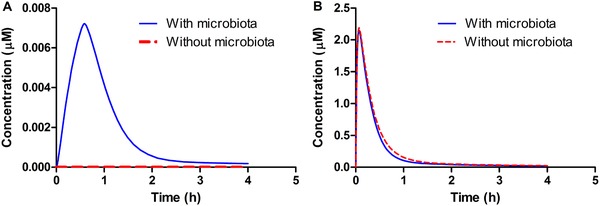
PBK model predicted plasma concentrations of A) S‐equol and B) daidzein upon oral dosing of 20 mg kg−1 bw daidzein. The red dashed line represents the predicted plasma concentrations without inclusion of the gut microbial compartment and the solid blue line represents the predicted plasma concentrations including the gut microbial compartment in PBK modeling.
The metabolic activity of gut microbiota marginally affects the plasma levels of daidzein (Figure 6B), where plasma C max of daidzein decreases from 2.19 to 2.16 µm, and the area under the concentration‐time curve (AUC0‐4h) reduces from 0.018 to 0.016 µmol h L−1 when microbial activity is introduced into the system.
3.4.2. Comparison of Model Predictions and In Vivo Data on Daidzein and S‐Equol Plasma Concentrations
The plasma C max of unconjugated daidzein and S‐equol predicted by the model were compared with in vivo plasma concentrations upon oral administration of 1.14–30 mg kg−1 bw daidzein reported in literature.[ 59 , 60 , 61 , 62 , 63 , 64 , 65 , 66 , 67 , 68 ] For the literature data reporting the concentrations of daidzein and S‐equol after hydrolysis, these data were corrected for the fractions of unconjugated daidzein and S‐equol in the circulation (i.e., 8.1% and 1.1%, for daidzein and S‐equol, respectively).[ 69 ] Figure 7 shows the ratio between the predicted plasma concentrations and the values reported in literature (details are presented in Tables S1 and S2, Supporting Information). There is considerable variation between the in vivo studies, and the predicted plasma C max of daidzein is on average 1.22 times the reported in vivo plasma C max. For S‐equol, only two studies were found that could be included in this comparison, and based on these data the predicted plasma C max of equol is on average 1.07 times the predicted in vivo plasma C max.
Figure 7.
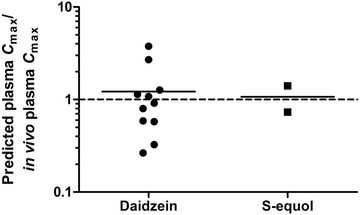
Ratio between the predicted plasma C max and the in vivo C max of unconjugated daidzein and S‐equol upon oral dosing of 1.14–30 mg kg−1 bw daidzein.[ 59 , 60 , 61 , 62 , 63 , 64 , 65 , 66 , 67 , 68 ] Each data point represents a separate study reported in the literature. If different doses were tested, each dose is represented by a data point.
3.5. Sensitivity Analysis
To assess key parameters that influence the model output, in this case the plasma C max of daidzein and S‐equol, a sensitivity analysis was carried out. Upon oral dosing of daidzein at 2, 38, and 80 mg kg−1 bw, parameters that appeared to have absolute normalized sensitivity coefficients (SCs) higher than 0.1 for at least one dose are presented in Figure 8 .
Figure 8.
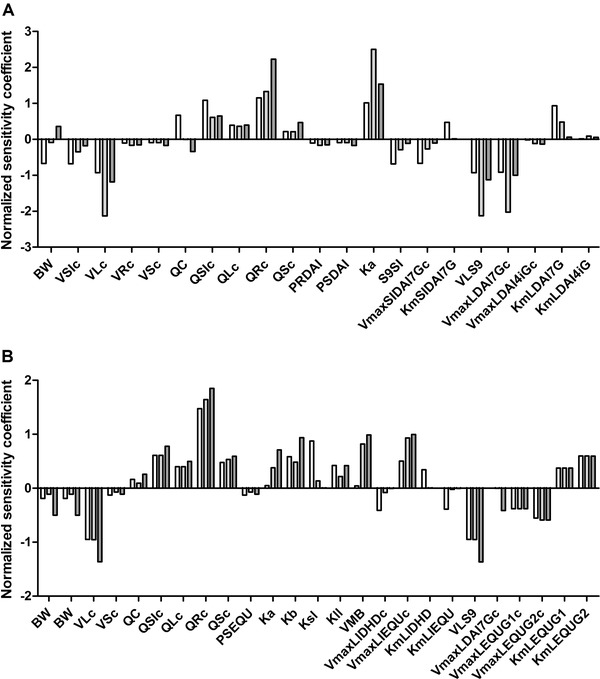
Sensitivity analysis of predicted plasma C max of A) daidzein and B) S‐equol upon oral dosing of daidzein at dose levels of 2 (white bars), 38 (light gray bars), and 80 (dark gray bars) mg kg−1 bw. Parameters stand for: BW, body weight; VSIc, fraction of small intestine; VLc, fraction of liver; VRc, fraction of rapidly perfused tissue; VSc, fraction of slowly perfused tissue; QC, cardiac output; QSIc, fraction of blood flow to small intestine; QLc, fraction of blood flow to liver; QRc, fraction of blood flow to rapidly perfused tissue; QSc, fraction of blood flow to slowly perfused tissue; PRDAI, rapidly perfused tissue/blood partition coefficient of daidzein; PSDAI, slowly perfused tissue/blood partition coefficient of daidzein, Ka, absorption rate of daidzein to intestinal tissue; S9SI, small intestinal S9 protein yield; VmaxSIDAI7Gc, V max of daidzein‐7‐O‐glucuronide by small intestine; KmSIDAI7G, K m for formation of daidzein‐7‐O‐glucuronide by small intestine; VLS9, liver S9 protein yield; VmaxLDAI7Gc, V max of daidzein‐7‐O‐glucuronide by liver; VmaxLDAI4iGc, V max of daidzein‐4′‐O‐glucuronide by liver; KmLDAI7G, K m for formation of daidzein‐7‐O‐glucuronide by liver; KmLDAI4iG, K m for formation of daidzein‐4′‐O‐glucuronide by liver; PSEQU, slowly perfused tissue/blood partition coefficient of S‐equol; Kb, transfer rate of daidzein to feces; Ksl, transfer rate of daidzein to feces; Kll, absorption rate of S‐equol from intestine to liver; VMB, fraction of feces of body weight; VmaxLIDHDc, V max of DHD by large intestine lumen; VmaxLIEQUc, V max of S‐equol by large intestine lumen; KmLIDHD, K m for formation of DHD by large intestine lumen; KmLIEQU, K m for formation of S‐equol by large intestine lumen; VmaxLEQU1c, V max of S‐equol glucuronide‐1 by liver; VmaxLEQU2c, V max of S‐equol glucuronide‐2 by liver; KmLEQU1, K m for formation of S‐equol glucuronide‐1 by liver; KmLEQU2, K m for formation of S‐equol glucuronide‐2 by liver.
Results reveal that the normalized SCs for most of the PBK model parameters are dose‐dependent. The predicted plasma C max of daidzein is predominantly influenced by the absorption rate of daidzein to small intestinal tissue (Ka), the fraction of blood flow to rapidly perfused tissue (QRc), the fraction of liver tissue (VLc), the liver S9 protein yield (VLS9), and the V max for daidzein‐7‐O‐glucuronide formation by the liver (VmaxLDAI7Gc).
Similarly, for S‐equol, parameters including QRc, VLS9, and VLc affect its predicted plasma C max to the largest extent. The parameters related to gut microbial activities have small effects on the plasma C max of daidzein, but considerable influence on the C max of S‐equol. Especially the V max and K m for formation of S‐equol in the large intestine (VmaxLIEQUc and KmLIEQU) are of influence on the C max of S‐equol.
Further analysis also confirmed that gut microbial kinetics V max and K m are influential parameters, where Table S3, Supporting Information, shows that plasma C max of daidzein and S‐equol change, albeit still to a limited extent, when changing kinetic parameters according to their standard deviations.
3.6. Estrogenicity of Daidzein and S‐Equol
The ERα‐CALUX assay was performed to assess the estrogenic potency of daidzein and S‐equol. Figure 9 shows the concentration–response curves of 17β‐estradiol (E2), daidzein, and S‐equol. The respective effective concentrations to reach a 10% (EC10) and 50% (EC50) induction of ERα‐mediated gene expression derived from these curves are listed in Table 4 . The curves of daidzein and S‐equol were corrected for post‐translational effects on the luciferase enzyme quantified using the U‐2 OS Cytotox cells. The results obtained show that the gut microbial metabolite S‐equol is a more potent estrogen than its parent compound daidzein, having a 6.3‐ and 12.7‐fold higher potency when comparing EC10 and EC 50 values, respectively.
Figure 9.
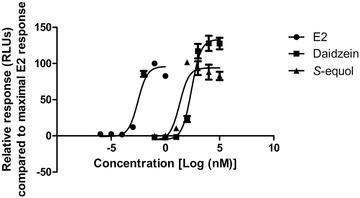
Concentration–response curves of E2, daidzein, and S‐equol in the ERα‐CALUX assay.
Table 4.
EC values of E2, daidzein, and S‐ equol obtained in the ERα‐CALUX assay
| EC10 [nm] | EC50 [nm] | |
|---|---|---|
| E2 | 0.001 | 0.003 |
| Daidzein | 62.5 | 261.6 |
| S‐equol | 9.9 | 20.6 |
3.7. Comparison of In Vitro EC10 and Dietary Resulting Plasma Concentrations
To obtain insight in the physiological relevance of the in vitro detected estrogenic activity of daidzein and S‐equol the EC10 values for ERα activation derived from the ERα‐CALUX assay were compared to predicted rat plasma C max of daidzein and S‐equol resulting from different dietary exposure scenarios. To this end, plasma C max values of daidzein and S‐equol as a result of a typical Western diet (daily isoflavone consumption <2 mg kg−1 bw),[ 70 ] a Western vegetarian diet (daily isoflavone consumption ≈12 mg kg−1 bw),[ 71 ] an Asian diet (daily isoflavone consumption 15–61 mg kg−1 bw),[ 72 , 73 , 74 ] and isoflavone supplement consumption (daily isoflavone consumption 20–80 mg kg−1 bw)[ 75 , 76 , 77 , 78 ] were predicted using the developed PBK model. Predicted C max values obtained were converted to unbound concentrations by correcting for the protein unbound fractions in plasma, which are reported to be 12%[ 70 ] and 3.5%[ 79 ] for daidzein and S‐equol, respectively. Figure 10 shows that for daidzein, predicted unbound plasma C max values resulting from all diets, except for the Western diet, were predicted to be generally higher than the EC10 value of daidzein for ERα activation. Predicted unbound plasma C max values of S‐equol resulting from different dietary intakes were generally lower than the EC10 value of S‐equol for ERα activation.
Figure 10.
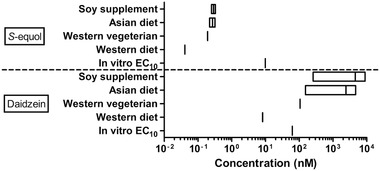
Comparison of in vitro–derived EC10 values for induction of ERα mediated gene expression and predicted unbound C max plasma levels of S‐equol (upper part) and daidzein (lower part) resulting from different dietary intake levels.
4. Discussion
The aim of the present study was to create an in vitro‐in silico based testing strategy to predict gut microbial metabolism of xenobiotics and the resulting plasma concentrations of the metabolites formed, using the isoflavone daidzein and its gut microbial metabolite S‐equol as model compounds. The anaerobic fecal incubations were optimized to establish a linear relationship of metabolites formed over fecal concentrations and time, to allow adequate kinetic experiments and definition of Michaelis–Menten parameters. To our knowledge, this is the first time that apparent V max and K m values are derived to describe the metabolism of a chemical by the gut microbiota, which are subsequently used for PBK modeling. Previous in vitro fecal incubations have reported microbial metabolism of daidzein and formation of S‐equol.[ 32 , 33 , 34 , 80 , 81 ] However, from those studies no kinetic parameters could be derived, as the long incubation times in the reported studies lead to nonlinear kinetics, which are in part due to microbial adaptation, usually resulting in exponential increases in metabolite degradation after a lag phase and/or depletion of the substrate at longer incubation times.[ 32 , 33 , 34 ] In the present study it was shown that nonlinear kinetics could be avoided with use of diluted fecal slurries and only relatively short‐incubation times. Fecal samples were used as a representative matrix for the colonic microbiota, since fecal communities are reported to be highly comparable to colonic ones in composition and function.[ 82 , 83 , 84 , 86 ] While there are certain differences in the microbial composition along the intestinal tract, the colon is housing the vast majority of microbes and is considered to be the most important contributor to the metabolic activity of the gut microbiota. Lagkouvardos et al.[ 85 ] performed a thorough review on the cultivation of bacteria from the intestine of mammals, and drew the conclusion that up to 65% of molecular species detected by sequencing have representative strains in culture under common culture conditions. In addition, the culture conditions in our study were designed to be as short as possible with as little enrichment as possible to be most representative of the intestinal communities and conditions when sampled, and were not intended to establish stable cultures. Thus, using fecal incubations to describe intestinal microbial metabolism provides a reasonable first tier approach, which, based on the result of the present study appeared to result in adequate predictions of the PBK model.
Using the kinetic parameters derived for intestinal microbial conversion of daidzein to S‐equol and for subsequent glucuronidation of S‐equol in the liver, a PBK model able to predict plasma C max of daidzein and S‐equol in rats was developed. The PBK model was developed for rats because this enabled comparison of model based predictions to in vivo data available in the literature. Comparison of the PBK model based predictions to these in vivo data revealed that the predictions matched the available in vivo C max data well, with the predicted plasma C max being on average 1.22 and 1.07 times the in vivo plasma C max of daidzein and S‐equol, respectively.
The analysis also revealed that both the reported and predicted plasma levels of S‐equol are substantially lower than those of daidzein. In line with this, inclusion of gut microbial metabolism in the PBK model appeared to have only a marginal effect on the daidzein C max values, which leads to the suggestion that, in the case of isoflavones, models omitting the gut microbiota[ 42 , 87 ] can still adequately predict concentrations of the parent isoflavone. However, when metabolites with an increased toxicity or biological activity are formed, these potentially highly relevant and bioactive metabolites are overlooked. While animal studies are still the standard in toxicity testing, the described inclusion of microbial metabolism in in vitro‐in silico methods can improve the predictions of QIVIVE and thereby contribute to their applicability and acceptance. The results of the present study provide a proof‐of‐principle on how formation of metabolites by the intestinal microbiota can be included in PBK model predictions. The PBK model including microbial S‐equol formation in the intestinal compartment adequately predicted plasma S‐equol concentrations in the host.
In line with literature, it was shown that S‐equol is a more potent estrogen than daidzein (Figure 9), so that the formation of S‐equol is generally considered to be relevant for health effects associated with daidzein ingestion in humans.[ 81 , 88 ] However, the results of the present study, comparing predicted plasma concentrations of unconjugated daidzein and S‐equol with EC10 values for ERα activation obtained in the ERα‐CALUX assay, indicate that in rats the ERα‐mediated estrogenicity is likely to be dominated by daidzein in spite of its microbial metabolite S‐equol being more potent. It shall be noted that potential differences in protein binding between culture medium used in the ERα‐CALUX assay and in plasma were not taken into account for this comparison, which might cause differences in free concentrations of daidzein and S‐equol between these two systems. The free fraction in plasma of daidzein is reported to be 12%[ 70 ] while that for S‐equol is 3.5%,[ 79 ] which further supports the conclusion that the contribution of S‐equol to the in vivo estrogenicity of daidzein may be limited.
It is important to note that the PBK model developed in the present study relates to rats. This was done because for rats there are data on dose‐dependent C max values of both daidzein and S‐equol available, enabling evaluation of the model predictions. It should be kept in mind that although the model predictions appear to be comparable to in vivo data from literature, the current developed PBK model still needs further validations and poses some challenges. For example, the model describes body structures by dividing them into different independent compartments, but in reality, the living organism is far more complex with potential interactions between compartments. Furthermore, the model does not take interindividual differences in the many parameters used in the equations into account. This might be achieved by performing Monte Carlo modeling, based on distributions describing the variability in either all model parameters, or, alternatively, especially the parameters that appear to be most influential on the predicted outcomes for C max of daidzein and S‐equol. This would also allow to take into account the fact that in contrast to rats, within the human population there are also individuals who do not produce S‐equol. Thus, when interpreting the model results, these limitations should be kept in mind, while future research may consider addressing these aspects presently ignored. Based on this validated model a PBK model for humans can be developed using human fecal materials and human tissue fractions, although this remains a topic for further research.
In the current study, proof‐of‐principle for an in vitro‐in silico based testing strategy to predict gut microbial metabolism of xenobiotics was developed, which could successfully be applied to predict the resulting plasma concentrations of an intestinal microbial metabolite in the host. This is a relevant addition to current QIVIVE strategies which are a key element of the twenty‐first century toxicity testing strategies.
Conflict of Interest
The authors declare no conflict of interest.
Author Contributions
Q.W. and B.S. performed experiments. Q.W., R.B., K.B. and I.M.C.M.R. developed the PBK model. Q.W. interpreted data and wrote the manuscript. K.B. and I.M.C.M.R. designed the scope of the manuscript and revised the manuscript. All authors read and approved the final manuscript.
Supporting information
Supporting Information
Supporting Information
Acknowledgements
This work was part of Q.W.’s Ph.D. project and was financially supported by China Scholarship Council (No. 201707720022, Q.W.). The authors acknowledge the grant from SOIT (Stimulation of Innovation in Toxicology) foundation. The authors also thank Diana Mendez Catala and Quirine ten Kate for helping start general lab/computational work.
Wang Q., Spenkelink B., Boonpawa R., Rietjens I. M. C. M., Beekmann K., Use of Physiologically Based Kinetic Modeling to Predict Rat Gut Microbial Metabolism of the Isoflavone Daidzein to S‐Equol and Its Consequences for ERα Activation. Mol. Nutr. Food Res. 2020, 64, 1900912 10.1002/mnfr.201900912
References
- 1. Le Chatelier E., Nielsen T., Qin J., Prifti E., Hildebrand F., Falony G., Almeida M., Arumugam M., Batto J. M., Kennedy S., Leonard P., Li J., Burgdorf K., Grarup N., Jorgensen T., Brandslund I., Nielsen H. B., Juncker A. S., Bertalan M., Levenez F., Pons N., Rasmussen S., Sunagawa S., Tap J., Tims S., Zoetendal E. G., Brunak S., Clement K., Dore J., Kleerebezem M., et al., Nature 2013, 500, 541. [DOI] [PubMed] [Google Scholar]
- 2. Maier L., Pruteanu M., Kuhn M., Zeller G., Telzerow A., Anderson E. E., Brochado A. R., Fernandez K. C., Dose H., Mori H., Patil K. R., Bork P., Typas A., Nature 2018, 555, 623. [DOI] [PMC free article] [PubMed] [Google Scholar]
- 3. Smith K., McCoy K. D., Macpherson A. J., Semin. Immunol. 2007, 19, 59. [DOI] [PubMed] [Google Scholar]
- 4. Huttenhower C., Gevers D., Knight R., Abubucker S., Badger J. H., Chinwalla A. T., Creasy H. H., Earl A. M., FitzGerald M. G., Fulton R. S., Giglio M. G., Hallsworth‐Pepin K., Lobos E. A., Madupu R., Magrini V., Martin J. C., Mitreva M., Muzny D. M., Sodergren E. J., Versalovic J., Wollam A. M., Worley K. C., Wortman J. R., Young S. K., Zeng Q., Aagaard K. M., Abolude O. O., Allen‐Vercoe E., Alm E. J., Alvarado L., et al., Human Microbiome Project Consortium , Nature 2012, 486, 207.22699609 [Google Scholar]
- 5. Qin J., Li R., Raes J., Arumugam M., Burgdorf K. S., Manichanh C., Nielsen T., Pons N., Levenez F., Yamada T., Mende D. R., Li J., Xu J., Li S., Li D., Cao J., Wang B., Liang H., Zheng H., Xie Y., Tap J., Lepage P., Bertalan M., Batto J. M., Hansen T., Le Paslier D., Linneberg A., Nielsen H. B., Pelletier E., Renault P., et al., Nature 2010, 464, 59. [DOI] [PMC free article] [PubMed] [Google Scholar]
- 6. Greenblum S., Turnbaugh P. J., Borenstein E., Proc. Natl. Acad. Sci. USA 2012, 109, 594. [DOI] [PMC free article] [PubMed] [Google Scholar]
- 7. Karlsson F. H., Tremaroli V., Nookaew I., Bergstrom G., Behre C. J., Fagerberg B., Nielsen J., Backhed F., Nature 2013, 498, 99. [DOI] [PubMed] [Google Scholar]
- 8. Larsen N., Vogensen F. K., van den Berg F. W., Nielsen D. S., Andreasen A. S., Pedersen B. K., Al‐Soud W. A., Sorensen S. J., Hansen L. H., Jakobsen M., PLoS One 2010, 5, e9085. [DOI] [PMC free article] [PubMed] [Google Scholar]
- 9. Million M., Lagier J. C., Yahav D., Paul M., Clin. Microbiol. Infect. 2013, 19, 305. [DOI] [PubMed] [Google Scholar]
- 10. Sousa T., Paterson R., Moore V., Carlsson A., Abrahamsson B., Basit A. W., Int. J. Pharm. 2008, 363, 1. [DOI] [PubMed] [Google Scholar]
- 11. Haiser H. J., Turnbaugh P. J., Pharmacol. Res. 2013, 69, 21. [DOI] [PMC free article] [PubMed] [Google Scholar]
- 12. Louisse J., Beekmann K., Rietjens I. M., Chem. Res. Toxicol. 2017, 30, 114. [DOI] [PubMed] [Google Scholar]
- 13. Chen L., Ning J., Louisse J., Wesseling S., Rietjens I., Food Chem. Toxicol. 2018, 116, 216. [DOI] [PubMed] [Google Scholar]
- 14. Ning J., Chen L., Strikwold M., Louisse J., Wesseling S., Rietjens I., Arch. Toxicol. 2019, 93, 801. [DOI] [PubMed] [Google Scholar]
- 15. Abdullah R., Alhusainy W., Woutersen J., Rietjens I. M., Punt A., Food Chem. Toxicol. 2016, 92, 104. [DOI] [PubMed] [Google Scholar]
- 16. de Jong E., Louisse J., Verwei M., Blaauboer B. J., van de Sandt J. J., Woutersen R. A., Rietjens I. M., Piersma A. H., Toxicol. Sci. 2009, 110, 117. [DOI] [PubMed] [Google Scholar]
- 17. Strikwold M., Spenkelink B., Woutersen R. A., Rietjens I. M., Punt A., Arch. Toxicol. 2013, 87, 1709. [DOI] [PubMed] [Google Scholar]
- 18. Strikwold M., Spenkelink B., de Haan L. H. J., Woutersen R. A., Punt A., Rietjens I., Arch. Toxicol. 2017, 91, 2119. [DOI] [PMC free article] [PubMed] [Google Scholar]
- 19. Louisse J., Bosgra S., Blaauboer B. J., Rietjens I. M., Verwei M., Arch. Toxicol. 2015, 89, 1135. [DOI] [PubMed] [Google Scholar]
- 20. Rietjens I. M., Louisse J., Punt A., Mol. Nutr. Food Res. 2011, 55, 941. [DOI] [PubMed] [Google Scholar]
- 21. Gardana C., Simonetti P., Int. J. Food Sci. Nutr. 2017, 68, 496. [DOI] [PubMed] [Google Scholar]
- 22. Atkinson C., Frankenfeld C. L., Lampe J. W., Exp. Biol. Med. 2005, 230, 155. [DOI] [PubMed] [Google Scholar]
- 23. Kobayashi S., Shinohara M., Nagai T., Konishi Y., Biosci. Biotechnol. Biochem. 2013, 77, 2210. [DOI] [PubMed] [Google Scholar]
- 24. Setchell K. D., Clerici C., J. Nutr. 2010, 140, 1355S. [DOI] [PMC free article] [PubMed] [Google Scholar]
- 25. Morito K., Hirose T., Kinjo J., Hirakawa T., Okawa M., Nohara T., Ogawa S., Inoue S., Muramatsu M., Masamune Y., Biol. Pharm. Bull. 2001, 24, 351. [DOI] [PubMed] [Google Scholar]
- 26. Muthyala R. S., Ju Y. H., Sheng S., Williams L. D., Doerge D. R., Katzenellenbogen B. S., Helferich W. G., Katzenellenbogen J. A., Bioorg. Med. Chem. 2004, 12, 1559. [DOI] [PubMed] [Google Scholar]
- 27. Kostelac D., Rechkemmer G., Briviba K., J. Agric. Food Chem. 2003, 51, 7632. [DOI] [PubMed] [Google Scholar]
- 28. Arai Y., Uehara M., Sato Y., Kimira M., Eboshida A., Adlercreutz H., Watanabe S., J. Epidemiol. 2000, 10, 127. [DOI] [PubMed] [Google Scholar]
- 29. Setchell K. D., Cole S. J., J. Nutr. 2006, 136, 2188. [DOI] [PubMed] [Google Scholar]
- 30. Setchell K. D., Brown N. M., Lydeking‐Olsen E., J. Nutr. 2002, 132, 3577. [DOI] [PubMed] [Google Scholar]
- 31. Crawford S. L., Jackson E. A., Churchill L., Lampe J. W., Leung K., Ockene J. K., Menopause 2013, 20, 936. [DOI] [PMC free article] [PubMed] [Google Scholar]
- 32. Matthies A., Blaut M., Braune A., Appl. Environ. Microbiol. 2009, 75, 1740. [DOI] [PMC free article] [PubMed] [Google Scholar]
- 33. Matthies A., Clavel T., Gutschow M., Engst W., Haller D., Blaut M., Braune A., Appl. Environ. Microbiol. 2008, 74, 4847. [DOI] [PMC free article] [PubMed] [Google Scholar]
- 34. Wang X. L., Kim H. J., Kang S. I., Kim S. I., Hur H. G., Arch. Microbiol. 2007, 187, 155. [DOI] [PubMed] [Google Scholar]
- 35. Rafii F., Jackson L. D., Ross I., Heinze T. M., Lewis S. M., Aidoo A., Lyn‐Cook L., Manjanatha M., Comp. Med. 2007, 57, 282. [PubMed] [Google Scholar]
- 36. Shimada Y., Yasuda S., Takahashi M., Hayashi T., Miyazawa N., Sato I., Abiru Y., Uchiyama S., Hishigaki H., Appl. Environ. Microbiol. 2010, 76, 5892. [DOI] [PMC free article] [PubMed] [Google Scholar]
- 37. Toh H., Oshima K., Suzuki T., Hattori M., Morita H., Genome Announc. 2013, 1, 00742. [DOI] [PMC free article] [PubMed] [Google Scholar]
- 38. Schroder C., Matthies A., Engst W., Blaut M., Braune A., Appl. Environ. Microbiol. 2013, 79, 3494. [DOI] [PMC free article] [PubMed] [Google Scholar]
- 39. Shimada Y., Takahashi M., Miyazawa N., Abiru Y., Braunea A., Appl. Environ. Microbiol. 2012, 78, 4902. [DOI] [PMC free article] [PubMed] [Google Scholar]
- 40. Tsuji H., Moriyama K., Nomoto K., Akaza H., Appl. Environ. Microbiol. 2012, 78, 1228. [DOI] [PMC free article] [PubMed] [Google Scholar]
- 41. Mayo B., Vazquez L., Florez A. B., Nutrients 2019, 11, 2231. [DOI] [PMC free article] [PubMed] [Google Scholar]
- 42. Boonpawa R., Spenkelink A., Punt A., Rietjens I., Br. J. Pharmacol. 2017, 174, 2739. [DOI] [PMC free article] [PubMed] [Google Scholar]
- 43. Islam M. A., Punt A., Spenkelink B., Murk A. J., Rolaf van Leeuwen F. X., Rietjens I. M., Mol. Nutr. Food Res. 2014, 58, 503. [DOI] [PubMed] [Google Scholar]
- 44. Brown R. P., Delp M. D., Lindstedt S. L., Rhomberg L. R., Beliles R. P., Toxicol. Ind. Health 1997, 13, 407. [DOI] [PubMed] [Google Scholar]
- 45. DeJongh J., Verhaar H. J. M., Hermens J. L. M., Arch. Toxicol. 1997, 72, 17. [DOI] [PubMed] [Google Scholar]
- 46. Rothwell J. A., Day A. J., Morgan M. R., J. Agric. Food Chem. 2005, 53, 4355. [DOI] [PubMed] [Google Scholar]
- 47. Hoskins L. C., Zamcheck N., Gastroenterology 1968, 54, 210. [PubMed] [Google Scholar]
- 48. Cubitt H. E., Houston J. B., Galetin A., Drug Metab. Dispos. 2011, 39, 864. [DOI] [PubMed] [Google Scholar]
- 49. Medinsky M. A., Leavens T. L., Csanády G. A., Gargas M. L., Bond J. A., Carcinogenesis 1994, 15, 1329. [DOI] [PubMed] [Google Scholar]
- 50. Evans M. V., Andersen M. E., Toxicol. Sci. 2000, 54, 71. [DOI] [PubMed] [Google Scholar]
- 51. Eisenbrand G., Mol. Nutr. Food Res. 2007, 51, 1305. [DOI] [PubMed] [Google Scholar]
- 52. Al‐Subeihi A. A., Alhusainy W., Kiwamoto R., Spenkelink B., van Bladeren P. J., Rietjens I. M., Punt A., Toxicol. Appl. Pharmacol. 2015, 283, 117. [DOI] [PubMed] [Google Scholar]
- 53. Punt A., Paini A., Spenkelink A., Scholz G., Schilter B., van Bladeren P. J., Rietjens I. M., Chem. Res. Toxicol. 2016, 29, 659. [DOI] [PubMed] [Google Scholar]
- 54. Strikwold M., Spenkelink B., Woutersen R. A., Rietjens I., Punt A., Toxicol. Sci. 2017, 157, 365. [DOI] [PubMed] [Google Scholar]
- 55. Sotoca A. M., Ratman D., van der Saag P., Strom A., Gustafsson J. A., Vervoort J., Rietjens I. M., Murk A. J., J. Steroid Biochem. Mol. Biol. 2008, 112, 171. [DOI] [PubMed] [Google Scholar]
- 56. Beekmann K., Rubio L., de Haan L. H., Actis‐Goretta L., van der Burg B., van Bladeren P. J., Rietjens I. M., Food Funct. 2015, 6, 1098. [DOI] [PubMed] [Google Scholar]
- 57. Sotoca A. M., Bovee T. F., Brand W., Velikova N., Boeren S., Murk A. J., Vervoort J., Rietjens I. M., J. Steroid Biochem. Mol. Biol. 2010, 122, 204. [DOI] [PubMed] [Google Scholar]
- 58. van der Linden S. C., von Bergh A. R., van Vught‐Lussenburg B. M., Jonker L. R., Teunis M., Krul C. A., van der Burg B., Mutat. Res. Genet. Toxicol. Environ. Mutagen. 2014, 760, 23. [DOI] [PubMed] [Google Scholar]
- 59. Islam M. A., Hooiveld G., van den Berg J. H. J., Boekschoten M. V., van der Velpen V., Murk A. J., Rietjens I., van Leeuwen F. X. R., Toxicol. Rep. 2015, 2, 308. [DOI] [PMC free article] [PubMed] [Google Scholar]
- 60. Janning P., Schuhmacher U. S., Upmeier A., Diel P., Michna H., Degen G. H., Bolt H. M., Arch. Toxicol. 2000, 74, 421. [DOI] [PubMed] [Google Scholar]
- 61. Bai Y., Wen H., Zhou H., Qiu Y., Shan C., Chin. Pharmacol. Bull. 2010, 26, 1512. [Google Scholar]
- 62. Chen X., Feng Q., Dafang Z., Xiaotao D., Changxiao L., Pharmazie 2005, 60, 334.15918580 [Google Scholar]
- 63. Sepehr E., Cooke G., Robertson P., Gilani G. S., Mol. Nutr. Food Res. 2007, 51, 799. [DOI] [PubMed] [Google Scholar]
- 64. Mallis L., Sarkahian A., Harris H., Zhang M., McConnell O., J. Chromatogr. B 2003, 796, 71. [DOI] [PubMed] [Google Scholar]
- 65. Qiu F., Chen X. Y., Song B., Zhong D. F., Liu C. X., Acta Pharmacol. Sin. 2005, 26, 1145. [DOI] [PubMed] [Google Scholar]
- 66. Shen Q., Li X., Li W., Zhao X., AAPS PharmSciTech 2011, 12, 1044. [DOI] [PMC free article] [PubMed] [Google Scholar]
- 67. Zhang Y., Yuan J., Wang Y., Wang Y., An R., Wang X., Pharmacogn. Mag. 2014, 10, 241. [DOI] [PMC free article] [PubMed] [Google Scholar]
- 68. King R. A., Am. J. Clin. Nutr. 1998, 68, 1496S. [DOI] [PubMed] [Google Scholar]
- 69. Setchell K. D., Brown N. M., Zhao X., Lindley S. L., Heubi J. E., King E. C., Messina M. J., Am. J. Clin. Nutr. 2011, 94, 1284. [DOI] [PMC free article] [PubMed] [Google Scholar]
- 70. Csanady G. A., Oberste‐Frielinghaus H. R., Semder B., Baur C., Schneider K. T., Filser J. G., Arch. Toxicol. 2002, 76, 299. [DOI] [PubMed] [Google Scholar]
- 71. Clarke D. B., Lloyd A. S., Food Addit. Contam. 2004, 21, 305. [DOI] [PubMed] [Google Scholar]
- 72. van Erp‐Baart M. A., Brants H. A., Kiely M., Mulligan A., Turrini A., Sermoneta C., Kilkkinen A., Valsta L. M., Br. J. Nutr. 2003, 89, S25. [DOI] [PubMed] [Google Scholar]
- 73. de Kleijn M. J., van der Schouw Y. T., Wilson P. W., Adlercreutz H., Mazur W., Grobbee D. E., Jacques P. F., J. Nutr. 2001, 131, 1826. [DOI] [PubMed] [Google Scholar]
- 74. Horn‐Ross P. L., Hoggatt K. J., West D. W., Krone M. R., Stewart S. L., Anton‐Culver H., Bernstein L., Deapen D., Peel D., Pinder R., Reynolds P., Cancer Causes Control 2002, 13, 407. [DOI] [PubMed] [Google Scholar]
- 75. Kim J. S., Kwon C. S., Nutr. Res. 2001, 21, 947. [DOI] [PubMed] [Google Scholar]
- 76. Mei J., Yeung S. S., Kung A. W., J. Clin. Endocrinol. Metab. 2001, 86, 5217. [DOI] [PubMed] [Google Scholar]
- 77. Arai Y., Watanabe S., Kimira M., Shimoi K., Mochizuki R., Kinae N., J. Nutr. 2000, 130, 2243. [DOI] [PubMed] [Google Scholar]
- 78. Franke A. A., Hankin J. H., Yu M. C., Maskarinec G., Low S.‐H., Custer L. J., J. Agric. Food Chem. 1999, 47, 977. [DOI] [PubMed] [Google Scholar]
- 79. Schwen R. J., Nguyen L., Plomley J. B., Jackson R. L., Food Chem. Toxicol. 2012, 50, 1741. [DOI] [PubMed] [Google Scholar]
- 80. Schwen R. J., Nguyen L., Jackson R. L., Food Chem. Toxicol. 2012, 50, 2074. [DOI] [PubMed] [Google Scholar]
- 81. Yuan J. P., Wang J. H., Liu X., Mol. Nutr. Food Res. 2007, 51, 765. [DOI] [PubMed] [Google Scholar]
- 82. Hold G. L., Pryde S. E., Russell V. J., Furrie E., Flint H. J., FEMS Microbiol. Ecol. 2002, 39, 33. [DOI] [PubMed] [Google Scholar]
- 83. Hillman E. T., Lu H., Yao T., Nakatsu C. H., Microbes Environ. 2017, 32, 300. [DOI] [PMC free article] [PubMed] [Google Scholar]
- 84. Behr C., Kamp H., Fabian E., Krennrich G., Mellert W., Peter E., Strauss V., Walk T., Rietjens I., van Ravenzwaay B., Arch. Toxicol. 2017, 91, 3439. [DOI] [PubMed] [Google Scholar]
- 85. Lagkouvardos I., Overmann J., Clavel T., Gut Microbes 2017, 8, 493. [DOI] [PMC free article] [PubMed] [Google Scholar]
- 86. Behr C., Sperber S., Jiang X., Strauss V., Kamp H., Walk T., Herold M., Beekmann K., Rietjens I., van Ravenzwaay B., Toxicol. Appl. Pharmacol. 2018, 355, 198. [DOI] [PubMed] [Google Scholar]
- 87. Zhang M., van Ravenzwaay B., Fabian E., Rietjens I., Louisse J., Arch. Toxicol. 2018, 92, 1075. [DOI] [PMC free article] [PubMed] [Google Scholar]
- 88. Vergne S., Titier K., Bernard V., Asselineau J., Durand M., Lamothe V., Potier M., Perez P., Demotes‐Mainard J., Chantre P., Moore N., Bennetau‐Pelissero C., Sauvant P., J. Pharm. Biomed. Anal. 2007, 43, 1488. [DOI] [PubMed] [Google Scholar]
Associated Data
This section collects any data citations, data availability statements, or supplementary materials included in this article.
Supplementary Materials
Supporting Information
Supporting Information


