

Summary
Background
Non‐alcoholic fatty liver disease (NAFLD) and non‐alcoholic steatohepatitis (NASH) account for an increasing proportion of liver disease in the Asia‐Pacific region. Many areas in the region are experiencing epidemics of metabolic syndrome among rapidly ageing populations.
Aims
To estimate using modelling the growth in NAFLD populations, including cases with significant fibrosis that are most likely to experience advanced liver disease and related mortality.
Methods
A disease progression model was used to summarise and project fibrosis progression among the NAFLD populations of Hong Kong, Singapore, South Korea and Taiwan. For each area, changes in the adult prevalence of obesity was used to extrapolate long‐term trends in NAFLD incidence.
Results
In the areas studied, prevalent NAFLD cases were projected to increase 6%‐20% during 2019‐2030, while prevalent NASH cases increase 20%‐35%. Incident cases of hepatocellular carcinoma are projected to increase by 65%‐85%, while incident decompensated cirrhosis cases increase 65%‐100% by 2030. Likewise, NAFLD‐related mortality is projected to increase between 65% and 100% from 2019 to 2030. NAFLD disease burden is expected to increase alongside rising trends in metabolic syndrome and obesity among populations in the region. This leads to more cases of advanced liver disease and associated mortality.
Conclusions
Preventing the growth of diabetic and obese populations will be a key factor in reducing ongoing increases in NAFLD‐related disease burden in the Asia‐Pacific region.
1. INTRODUCTION
Non‐alcoholic fatty liver disease (NAFLD) is now globally accepted as a cause of advanced liver disease and is defined as the existence of excessive liver fat without other known aetiological causes.1 In the Asia‐Pacific region, increased incidence of NAFLD is attributed to the recent adoption of Western dietary and lifestyle habits and pre‐disposing genetic factors in many community groups.2 While well‐known risk factors of obesity and diabetes3, 4 are predictive of disease, a substantial portion of individuals with normal body mass index (BMI) experience NAFLD in the region.5 Cases of NAFLD and non‐alcoholic steatohepatitis (NASH) in Asia are projected to continue increasing, particularly among populations who are rapidly ageing6 who are more prone to develop chronic lifestyle‐related conditions.
Non‐alcoholic steatohepatitis is characterised by histological hepatic inflammation, hepatocyte ballooning and progression of fibrosis, ultimately progressing to advanced liver disease and associated mortality.7, 8 Advanced age in combination with metabolic syndrome, diabetes and obesity are associated with progression to advanced fibrosis9, 10 followed by end‐stage disease and mortality. Cirrhotic NASH patients are at highest risk for NASH‐related hepatocellular carcinoma (HCC); however, a significant proportion of HCC occurs among noncirrhotic NASH patients.11 Current research focuses on the global disease burden and economic costs related to NASH12, 13; however, limitations in data availability exist, particularly for country‐specific prevalence estimates.14 One study of liver biopsy series in the region identified NASH in 63.5% of cases.2
As of 2017, guidelines have been developed to address NAFLD in Asia,15 demonstrating an acknowledgement of the increasing disease burden and need for thorough assessment. This study leverages past modelling and epidemiological work to project future disease burden in Asia and ultimately advise decision making and inform effective resource allocation to decrease NAFLD and NASH‐related morbidity.
2. METHODS
This analysis utilised previously published techniques16 to build Markov disease progression models for Hong Kong, Singapore, South Korea and Taiwan. Briefly, the process involved a literature search to identify area‐level disease burden data (including data on prevalence, disease progression, mortality), which were then evaluated for use in consultation with area experts (Table S1). Input data were available over different time frames and were entered into the models in the reported years of data collection.
Markov modelling has been used to project disease burden in multiple areas.17 Each patient in a Markov model is assumed to be in one of a limited number of health states, with events represented as transitions between states.18 The current model considered the transition of an area's population from non‐NAFLD to NAFLD, transitions between fibrosis stages and advanced disease and transitions for background and liver‐related mortality.
2.1. Model
The model tracked each area's NAFLD population annually by age, sex, fibrosis stage and NASH status (steatosis only or NASH). Progression of disease through fibrosis and liver disease stages (Figure S1) was estimated with adjustment for all‐cause mortality (including general background mortality, excess nonliver mortality and liver‐related mortality). Fibrosis progression rates (Table 1) were previously calibrated using data for advanced disease,16 and then extrapolated to other areas with adjustment for varied levels of overweight, obesity and diabetes,19, 20 using reported odds of disease progression.9 Transition rates to HCC, decompensated cirrhosis and liver‐related death were based on reported estimates,16, 21, 22 while NAFLD‐related liver deaths were calculated based on transition rates among prevalent HCC and decompensated cirrhosis cases.22, 23, 24, 25
Table 1.
Transition probabilities by disease stage
| Disease Stage Transition | All Cases | Hong Kong | Singapore | South Korea | Taiwan |
|---|---|---|---|---|---|
| F0 to F1 | 0.38%‐1.19% | 0.42%‐1.33% | 0.31%‐0.98% | 0.30%‐0.96% | |
| F1 to F2 | 2.32%‐7.33% | 2.58%‐8.18% | 1.89%‐5.99% | 1.86%‐5.89% | |
| F2 to F3 | 2.32%‐7.33% | 2.58%‐8.18% | 1.89%‐5.99% | 1.86%‐5.89% | |
| F3 to Cirr | 2.80%‐5.48% | 3.12%‐6.11% | 2.29%‐4.47% | 2.25%‐4.40% | |
| Cirr to DCC | 3.71% | ||||
| DCC to Liver Rel. Death | 20.0% | ||||
| F0 to HCC | 0.00013% | ||||
| F1 to HCC | 0.0027% | ||||
| F2 to HCC | 0.005% | ||||
| F3 to HCC | 0.011% | ||||
| Cirr to HCC | 0.59% | ||||
| HCC to Liver Rel. Death (Yr 1) | 61.0% | ||||
| HCC to LR Death (Sub Yrs) | 16.20% |
Abbreviation: HCC, hepatocellular carcinoma.
The prevalence of NASH was based on time‐ and age‐dependent fibrosis progression modelling. It was assumed that the sum proportion of regressed NAFLD cases in stages F1‐F4 would not exceed 5%, with most NASH regressors having no fibrosis (F0 stage). A relatively small number of fibrotic cases (F1‐F4) were classified as non‐NASH NAFLD, with the vast majority of modelled fibrotic cases (F1‐F4) assumed to be NASH.
2.2. New NAFLD cases
In the areas included in this analysis, accurate longitudinal estimates of NAFLD incidence were limited. Recent estimates from Hong Kong report an incidence 13.5% over 3‐5 years of follow‐up among community subjects without NAFLD at baseline using proton magnetic resonance spectroscopy.26 For each model, annual changes in the number of new cases were back‐calculated based on extrapolation of long‐term trends for adult prevalence of obesity.19 The definition of obesity using BMI varies across populations.27 Based on expert consensus, BMI cutoffs of ≥25 for Hong Kong, Singapore and South Korea, and BMI ≥27 for Taiwan were considered. Available data for Asian populations do not demonstrate single cut‐off values for overweight and obesity that are predictive of health risks, but instead that cut‐off values exist on a continuum that will vary in predictive value among different Asian populations.28 Temporal changes in adult obesity were estimated by trending prevalence data from the NCD Risk Factor Collaboration (NCD‐RisC) meta‐analysis for Hong Kong, Singapore and South Korea,19 and the Nutrition and Health Survey for Taiwan29 (Figure S2). In this analysis, the changes in NAFLD prevalence were assumed to occur simultaneous to changes in adult obesity prevalence. While other metabolic risk factors such as diabetes are more predictive of disease progression,30 obesity was selected as an indicator for NAFLD incidence due to the availability of data over long periods and relatively constant levels of diagnosis and awareness.
2.3. Prevalence
Estimates of NAFLD prevalence in the general population vary based on population studied, diagnostic technique and even inter‐observer variation. For example, the Korean Association for the Study of the Liver notes studies in South Korea where the prevalence has varied between 16.1% and 33.3% based on ultrasound.1 As a result, input prevalence values for the models were based on data review and expert consensus obtained through extensive discussions around data limitations.
NAFLD prevalence of 25% among individuals aged ≥20 years in 2015 was input for Hong Kong, South Korea and Taiwan with uncertainty range of 20%‐30%. In Singapore, the NAFLD prevalence rate of 29.3% was applied among individuals aged ≥20 years in 2015 assuming different prevalence estimates for the ethnic Chinese population and the non‐Chinese population. Approximately 23.8% of the Singapore population is non‐Chinese,31 and the portion of the population classified as Malay and Indian is expected to experience NAFLD at rates that are 1.63 and 1.68 times higher than the Chinese population, respectively.32 Beginning with a starting prevalence of 25% in the ethnic Chinese population, the weighted average prevalence was calculated to reach a country‐level prevalence of 29.3%. A prevalence range of ±5% was applied for uncertainty analysis.
For the age and gender distribution of the NAFLD population in Singapore, South Korea and Taiwan, a modified distribution based on previously published analyses14 was applied. This distribution assumed that prevalence would increase with age and would be marginally higher among males prior to age 50 years. Although parity by sex was assumed among people ≥50 years of age, higher mortality rates among males meant that female NAFLD cases outnumbered males in the oldest age groups. Additionally, it was assumed that prevalence would naturally decline in the oldest age groups as a result of competing mortality risks among NAFLD populations. For Hong Kong, prevalence rates by age group were calculated as an average based on two large studies.33, 34 Prevalence studies did not include children or adolescents, so a decline was assumed among the youngest age groups not included in prevalence estimates.
2.4. Mortality
For each area, background mortality rates by age and gender were based on historical and medium fertility variant projected estimates for total deaths from the United Nations population database6 divided by population estimates by age group and gender from the same database.6
Background rates were adjusted to account for incremental increased mortality related to cardiovascular disease (CVD) and nonliver cancers. While excess CVD mortality may increase with NAFLD severity, data for this are sparse, so a constant multiplier was applied to all stages of disease. For Hong Kong, Singapore and Taiwan, there was an assumed 1.15 standard mortality ratio (SMR) for all disease stages and ages based on expert consensus. For the South Korea model, there was an assumed SMR of 1.09 for all disease stages and ages based on reported CVD mortality hazard ratio for BMI 25.0‐27.4 in a pooled study of East Asian populations from the Asia Cohort Consortium.35 For all areas, a range from 1.00 (no excess mortality) to 1.3836 was utilised for uncertainty analysis.
2.5. Transplants
Annual liver transplantations by area were reported by national and international databases for Hong Kong,37 Singapore,38 South Korea39 and Taiwan.40 In the region, data for liver transplants attributable to NAFLD/NASH are sparse. Expert consensus was used to estimate the portion of liver transplants related to NAFLD which ranged from 1.0% (Hong Kong) to 2.5% (South Korea) and 5.0% (Taiwan). In Singapore, published estimates were used to estimate that 9.8% of liver transplants were NAFLD‐related.41
2.6. Uncertainty analysis
For each model, uncertainty intervals (UIs) were defined for key uncertain inputs including total NAFLD prevalence, excess nonliver mortality multipliers and fibrosis transition probabilities. For all uncertain inputs, Beta‐PERT distributions were used. Monte Carlo simulation and sensitivity analysis were conducted using an Excel® add‐in (Crystal Ball® 11.1.3708.0 by Oracle®) to estimate 95% UIs. The sensitivity analysis was conducted to identify the inputs that accounted for the greatest variation in modelled outcomes. The number of prevalent NASH cases was selected as a forecast for sensitivity analysis as it represents a spectrum of cases in more advanced stages. In each area studied, ranges around three variables accounted for ≥99% of forecast uncertainty for prevalent NASH cases in 2030 (Figure S3). The range of transition probabilities from F0 to F1 was the leading driver of uncertainty as the F0 populations are very large, and small changes in model outflows in this population have a substantial impact. The second and third leading drivers of uncertainty around prevalent NASH in 2030 were the base starting prevalence of NAFLD among adults in 2015 and the range around SMR. Background mortality is an important driver of overall disease burden, due to high competing mortality risks among older NAFLD patients who have greater likelihood of advanced disease.
3. RESULTS
3.1. NAFLD population
Between 2019 and 2030, NAFLD cases are expected to increase 6%‐20% in the areas studied (Figure 1). During 2019 and 2030, the greatest relative increase in prevalent NAFLD cases was projected for Singapore where prevalent NAFLD cases increase from 1 492 000 (1 279 000‐1 704 000) to 1 799 000 (1 532 000‐2 054 000), a change of 20%. Meanwhile, the smallest relative increase was in South Korea where cases increase from 10 948 000 (9 339 000‐12 449 000) to 11 643 000 (9 933 000‐13 237 000), a change of 6% (Table 2). By 2030, NAFLD prevalence (all ages) ranged from 22.5% (19.0%‐25.7%) in Hong Kong to 28.7% (24.5%‐32.8%) in Singapore.
Figure 1.
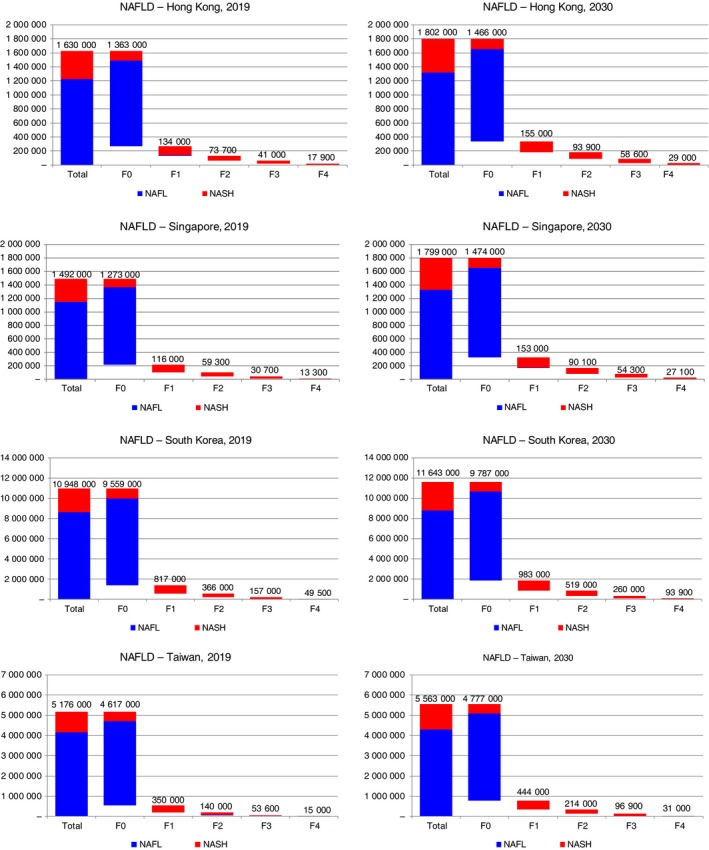
NAFLD‐related prevalent cases—Hong Kong, Singapore, South Korea and Taiwan, 2019‐2030. NAFLD, non‐alcoholic fatty liver disease
Table 2.
NAFLD disease burden with 95% uncertainty intervals—Hong Kong, Singapore, South Korea and Taiwan, 2019 & 2030
| Hong Kong | Singapore | South Korea | Taiwan | |||||
|---|---|---|---|---|---|---|---|---|
| Year | 2019 | 2030 | 2019 | 2030 | 2019 | 2030 | 2019 | 2030 |
| Population | 7 436 000 | 8 019 000 | 5 804 000 | 6 262 000 | 51 225 000 | 51 152 000 | 23 774 000 | 24 011 000 |
| Prevalent cases | ||||||||
| NAFLD | 1 630 000 (1 388 000‐1 862 000) | 1 802 000 (1 527 000‐2 060 000) | 1 492 000 (1 279 000‐1 704 000) | 1 799 000 (1 532 000‐2 054 000) | 10 948 000 (9 339 000‐12 449 000) | 11 643 000 (9 933 000‐13 237 000) | 5 176 000 (4 424 000‐5 943 000) | 5 563 000 (4 750 000‐6 401 000) |
| NAFLD prevalence rate (all ages) | 21.9% (18.7%‐25.0%) | 22.5% (19.0%‐25.7%) | 25.7% (22.0%‐29.4%) | 28.7% (24.5%‐32.8%) | 21.4% (18.2%‐24.3%) | 22.8% (19.4%‐25.9%) | 21.8% (18.6%‐25.0%) | 23.2% (19.8%‐26.7%) |
| F0 | 1 363 000 (1 138 000‐1 585 000) | 1 466 000 (1 212 000‐1 716 000) | 1 273 000 (1 069 000‐1 473 000) | 1 474 000 (1 218 000‐1 729 000) | 9 559 000 (8 043 000‐10 957 000) | 9 787 000 (8 152 000‐11 267 000) | 4 617 000 (3 917 000‐5 347 000) | 4 777 000 (4 006 000‐5 576 000) |
| F1 | 134 000 (89 800‐184 000) | 155 000 (104 000‐215 000) | 116 000 (78 400‐160 000) | 153 000 (102 000‐212 000) | 817 000 (554 000‐1 126 000) | 983 000 (659 000‐1 355 000) | 350 000 (241 000‐485 000) | 444 000 (303 000‐614 000) |
| F2 | 73 700 (47 000‐109 000) | 93 900 (59 600‐137 000) | 59 300 (37 700‐87 800) | 90 100 (57 700‐132 000) | 366 000 (231 000‐551 000) | 519 000 (328 000‐765 000) | 140 000 (87 700‐211 000) | 214 000 (135 000‐318 000) |
| F3 | 41 000 (24 200‐62 600) | 58 600 (34 700‐88 400) | 30 700 (18 100‐46 900) | 54 300 (32 300‐82 400) | 157 000 (91 500‐246 000) | 260 000 (152 000‐402 000) | 53 600 (31 000‐85 200) | 96 900 (56 000‐152 000) |
| Compensated cirrhosis | 15 700 (8600‐27 800) | 25 400 (14 200‐43 300) | 11 700 (6500‐20 800) | 23 800 (13 400‐41 000) | 43 700 (23 600‐81 700) | 82 500 (44 900‐150 000) | 13 000 (6700‐25 200) | 26 800 (14 100‐50 400) |
| Decompensated cirrhosis, HCC and liver transplant | 2100 (1400‐4200) | 3600 (2400‐6000) | 1600 (1000‐2900) | 3300 (2200‐6200) | 5800 (3800‐9900) | 11 400 (7100‐19 500) | 2000 (1200‐3600) | 4200 (2300‐8100) |
| NASH | 400 000 (318 000‐495 000) | 480 000 (379 000‐594 000) | 345 000 (276 000‐424 000) | 469 000 (371 000‐581 000) | 2 331 000 (1 866 000‐2 858 000) | 2 818 000 (2 230 000‐3 483 000) | 1 015 000 (825 000‐1 247 000) | 1 256 000 (1 005 000‐1 553 000) |
| NASH prevalence rate (all ages) | 5.4% (4.3%‐6.7%) | 6.0% (4.7%‐7.4%) | 5.9% (4.8%‐7.3%) | 7.5% (5.9%‐9.3%) | 4.6% (3.6%‐5.6%) | 5.5% (4.4%‐6.8%) | 4.3% (3.5%‐5.2%) | 5.2% (4.2%‐6.5%) |
| Incident cases | ||||||||
| Decompensated cirrhosis | 530 (300‐970) | 880 (500‐1500) | 390 (220‐710) | 810 (460‐1400) | 1500 (780‐2800) | 2800 (1500‐5200) | 430 (230‐840) | 900 (490‐1700) |
| HCC | 90 (50‐160) | 150 (90‐250) | 90 (60‐140) | 160 (110‐250) | 290 (170‐500) | 520 (300‐900) | 250 (160‐410) | 460 (290‐770) |
| Liver death | 430 (240‐770) | 750 (420‐1300) | 320 (190‐560) | 680 (400‐1200) | 1200 (620‐2100) | 2300 (1300‐4200) | 470 (270‐830) | 970 (560‐1700) |
Abbreviations: HCC, hepatocellular carcinoma; NAFLD, non‐alcoholic fatty liver disease; NASH, non‐alcoholic steatohepatitis.
Combined, prevalent F0/F1 cases are projected to increase 4%‐17%, with the greatest increase expected in Singapore. Prevalent F2 and F3 cases are projected to increase the most in Taiwan, with 55% and 80% increases projected, respectively, during 2019‐2030. For compensated cirrhosis, the greatest increases were projected for Singapore and Taiwan where prevalent cases are estimated to double. Prevalent cases of decompensated cirrhosis, HCC and liver transplants are expected to increase ≥ 70% in all areas studied, and more than double in Singapore and South Korea.
Prevalent NAFLD cases by age group and gender were compared to the distribution of the non‐NAFLD population (Figure 2). In 2019, the median age of the prevalent NAFLD population was calculated as 50.3 (Singapore), 52.5 (Taiwan), 53.4 (South Korea) and 55.5 years (Hong Kong). By 2030, the median age had increased in all areas studied to 57.2 (Singapore), 58.0 (Taiwan), 59.4 (South Korea) and 59.8 years (Hong Kong). In all areas, male cases outnumbered female cases through late‐middle age (≤65 years), while female cases outnumbered male cases in the oldest age groups (≥65 years).
Figure 2.
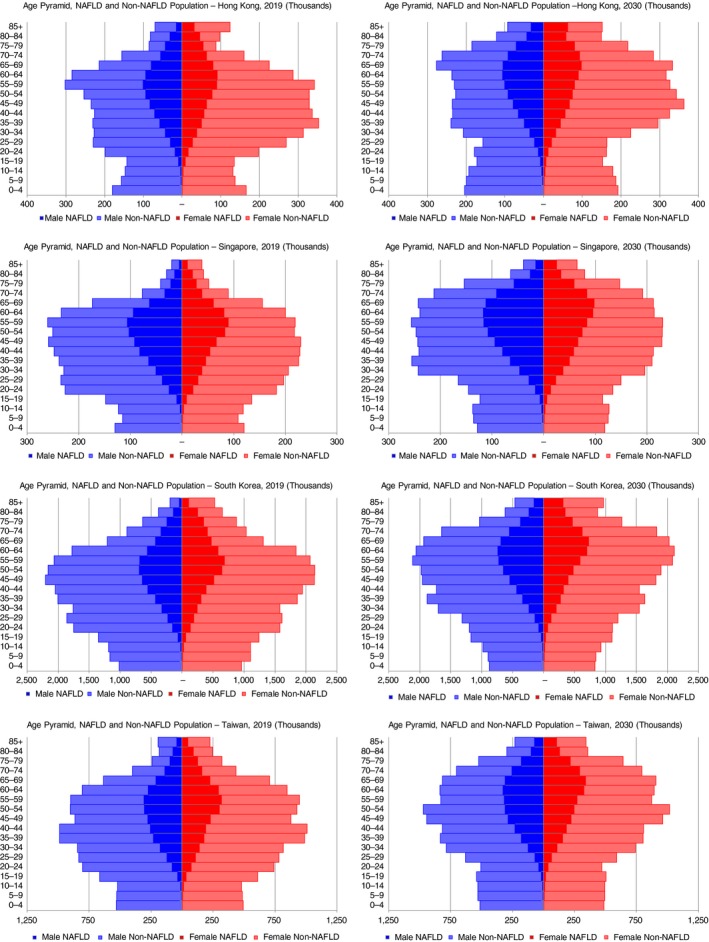
Age distribution of prevalent NAFLD cases—Hong Kong, Singapore, South Korea and Taiwan, 2019‐2030. NAFLD, non‐alcoholic fatty liver disease
3.2. NAFL population
The NAFL population was assumed to be cases with simple steatosis that never progressed to NASH, with a relatively small number of cases that were formerly NASH and experienced disease regression. In 2019, the NAFL population ranged from 75% (Hong Kong) of total NAFLD cases to 80% of cases (Taiwan). By 2030, the number of NAFL cases increased by 2% (South Korea)‐16% (Singapore). By 2030, all areas were estimated to have <80% of total NAFLD cases classified as simple steatosis or regressed NAFLD.
3.3. NASH population
In 2019, NASH cases were projected to comprise 20%‐25% of all NAFLD cases, with prevalence in the general population (all ages) ranging from 4.3% (3.5%‐5.2%) in Taiwan to 5.9% (4.8%‐7.3%) in Singapore. The number of prevalent NASH cases was projected to increase 20% in Hong Kong and South Korea, 25% in Taiwan and 35% in Singapore during the 2019‐2030 timeframe (Figure 1). By 2030, NASH cases were estimated to comprise >25% of the total NAFLD populations in Hong Kong and Singapore. Meanwhile, prevalence in 2030 was projected to range from 5.5% (4.4%‐6.8%) in South Korea to 7.5% (5.9%‐9.3%) in Singapore.
3.4. NAFLD‐related decompensated cirrhosis and HCC
Incident decompensated cirrhosis cases were projected to increase 65% (Hong Kong), 85% (South Korea) and 100% (Singapore and Taiwan) during 2019‐2030 (Figure 3). Incident cases in 2030 ranged from 810 (460‐1400) in Singapore to 2800 (1500‐5200) in South Korea.
Figure 3.
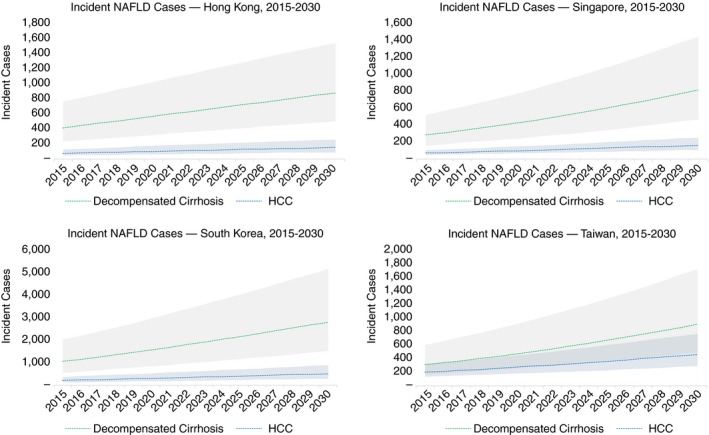
NAFLD‐related incident cases with 95% uncertainty interval—Hong Kong, Singapore, South Korea and Taiwan, 2015‐2030. NAFLD, non‐alcoholic fatty liver disease
Cases of incident HCC were forecast to increase by 65% (Hong Kong), 80% (Singapore and South Korea) and 85% (Taiwan) during the time period. By 2030, incident cases ranged from 150 (90‐250) cases in Hong Kong to 520 (300‐900) cases in South Korea.
3.5. Mortality
In the NAFLD population, annual liver‐related deaths are estimated to increase 75% (Hong Kong), 90% (South Korea) and 100% (Singapore and Taiwan) (Table 2). Total deaths in the NAFLD population in 2030 (background and NAFLD‐related) ranged from 20 500 deaths in Singapore to 170 000 in South Korea. As a proportion of total deaths, NAFLD liver deaths accounted for an increasing proportion over time in all areas ranging from 1% to 3% of total deaths.
4. DISCUSSION
This analysis shows that NAFLD will continue to represent a growing threat to liver health in the Asia Pacific region. Given both advancing age and increased duration of the obesity epidemic among Asian populations, NAFLD, NASH and other facets of metabolic syndrome will present an increasing burden on health systems. Already, over half of the global population aged ≥60 years resides in Asia.42 Obesity rates may be stabilising,43 but young people in the region are experiencing historically unprecedented levels of obesity.44 In the four areas studied, the population with diabetes is projected to increase 17% (Taiwan)‐24% (Singapore) between 2019 and 2030.45 In Singapore, the adult prevalence of diabetes was projected to more than double from during a longer time period from 7.3% in 1990 to 15% in 2050.46 Individuals in the region develop diabetes at lower obesity levels and at younger ages as compared to Western populations,47 leading to increased duration of disease and resulting complications.48 NASH may already be increasing as an aetiology of HCC in the region.49 While some of this change is due to decreases or stabilisation in the number of individuals impacted by viral hepatitis, the growth is also driven by demographic factors as well as the epidemic of metabolic syndrome.
The current analysis utilised both literature review and expert interviews to design the model and validate model outputs. Longitudinal trends in adult obesity levels, including estimates from national health surveys29 and NCD‐RisC were used.19 Among the populations included in this analysis, the period of fastest growth in obesity has already passed and future growth in at‐risk populations including obese and diabetic persons remains uncertain.
Even if further increases in obesity are halted, morbidity and mortality related to NAFLD will continue to increase for decades. By 2050, over 40% of the population in these areas will be aged ≥60 years,42 and will experience greater overall risk for advanced liver disease.9 The number of HCC cases identified as NAFLD‐related has been increasing in countries where the obesity epidemic began earlier25; however, patients face high rates of nonsurveillance for HCC. In Hong Kong, fewer than 20% of HCC cases are identified pre‐symptomatically and median survival is less than two years.50 Identifying NAFLD cases at greatest risk for disease progression is critical for reducing disease burden in the region. Better diagnostic technologies are also needed to differentiate the aetiology of fibrotic liver changes. In Singapore, it was estimated that approximately 90% of cirrhosis cases classified as cryptogenic could be NAFLD‐related,51 and an unknown number of advanced liver disease cases attributed to viral hepatitis could have NAFLD as an unrecognised contributor.
The NAFLD epidemic in the Asia‐Pacific region differs from Western countries, in that a greater portion of cases may be classified as non‐obese NAFLD (BMI <25) and lean NAFLD (BMI <23) while still exhibiting the characteristics of obese NAFLD, including metabolic disease and insulin resistance.52 Among persons in the region with BMI <25, an estimated 7%‐19% have NAFLD.5 Differences in the pathophysiology and prognosis of NAFLD cases should be further researched to better identify cases that are most at risk of disease progression. Persons with diabetes represent a substantial portion of the NASH population53 and should be a focus of screening and diagnostic efforts. Projected increases in total modelled NAFLD cases are lower than estimated growth in the diabetic population in the areas studied,45 while modelled increases in late‐stage disease are higher than estimated growth of diabetes. More research should be done to correlate increased rates of diabetes in general populations with late stage liver outcomes.
Disease risk varies between groups within the areas studied and should be a focus of further research. Differences between groups may partially be the result of genetic factors, including additive effects from risky variants of PNPLA3 and TM6SF2 that influence metabolic phenotype and the severity of NAFLD.54 Taiwan's reported NAFLD prevalence ranks as one of the highest among Asian countries,55 but the population includes both indigenous people and other ethnic groups including Minnan and Hakka, as well as mainland Chinese. Minnan and Hakka have potential risk profiles similar to southern Asian populations, based on phylogenetic trees and analysis of HLA allele frequencies.55 These heterogenous populations will have different risk profiles with BMI cut‐off levels predictive of health risks that vary between ethnic groups.28 In this analysis, a higher BMI cut‐off level was selected for Taiwan than for the other areas based on national survey guidelines29. As NAFLD incidence trends were extrapolated based on prevalence of adults above the cut‐off level, using a higher threshold resulted in relatively greater increases in NAFLD incidence in recent years as the prevalence of more severe obesity has increased faster than overall obesity and overweight (Figure 2).
One challenge to modelling NAFLD is inconsistent definitions of disease across studies conducted in general populations,2 with potential failure to identify large portions of NAFLD cases.56 Estimates of disease burden are usually based on historical data that do not represent the current situation in an epidemic of increasing obesity and diabetes, and ongoing increase in childhood obesity.57 A lack of consistent diagnostic measures mean that reported NAFLD prevalence rates vary between studies,2 NASH can be histologically detected in some NAFLD cases with normal liver enzyme measures.58 However staging of fibrosis alone is predictive of long‐term outcomes 59 and non‐invasive tests such as transient elastography have been used to estimate fibrosis stage among general populations in the region.33
Results of analyses demonstrate growing disease burden associated with NAFLD and NASH, following the trajectory of increasing obesity both regionally and globally.60 The World Health Organization has called for a halting of further increases in the prevalence of diabetes and obesity,61 and have set a development goal to reduce premature mortality from noncommunicable diseases by one third before 2030. Intervention is needed to slow the growth in obesity and metabolic syndrome, especially among young people. While lifestyle modifications among adults can result in remission of NASH and fibrosis regression,4 further research into therapeutic options52; should be considered to avert the coming epidemic of NAFLD‐related liver disease.
AUTHORSHIP
Guarantor of the article: Chris Estes is guarantor of the article.
Author contributions: Homie Razavi and Chris Estes conceived and designed the analysis. George Boon‐Bee Goh, Henry Lik Yuen Chan, Rong Nan Chien, Wan‐Long Chuang, Chris Estes, James Fung, Tsung Hui Hu, Jee‐Fu Huang, Byoung Kuk Jang, Dae Won Jun, Jia Horng Kao, Jin‐Woo Lee, Han‐Chieh Lin, Homie Razavi, Kathryn Razavi‐Shearer, Wai‐Kay Seto, Grace Lai‐Hung Wong and Vincent Wai‐Sun Wong contributed data, provided data analysis and interpretation and provided critical revision of the work. All authors approved the final version of the manuscript.
Supporting information
Acknowledgements
Declaration of personal interests: The authors declare that there is no conflict of interest.
Appendix 1. THE AUTHORS COMPLETE AFFILIATION LIST.
Chris Estes: Center for Disease Analysis Foundation, Lafayette, Colorado, USA. Henry L. Y. Chan: Department of Medicine and Therapeutics, The Chinese University of Hong Kong, Hong Kong; State Key Laboratory of Digestive Disease, The Chinese University of Hong Kong, Hong Kong. Rong N. Chien: Department of Gastroenterology and Hepatology, Chang‐Gung Memorial Hospital and University at Keelung, Keelung, Taiwan; Community Medicine Research Center, Chang‐Gung Memorial Hospital, Keelung, Taiwan. Wan‐Long Chuang: Kaohsiung Medical University Hospital, Kaohsiung Medical University, Kaohsiung, Taiwan. James Fung: Department of Medicine, Queen Mary Hospital, The University of Hong Kong, Hong Kong; State Key Laboratory for Liver Research, The University of Hong Kong, Hong Kong. George G. B. Bee: Department of Gastroenterology and Hepatology, Singapore General Hospital, Singapore; Duke‐National University of Singapore Medical School, Singapore. Tsung H. Hu: Division of Hepatogastroenterology, Department of Internal Medicine, Kaohsiung Chang Gung Memorial Hospital, Kaohsiung, Taiwan. Jee‐Fu Huang: Hepatobiliary Division, Department of Internal Medicine, Kaohsiung Medical University Hospital, Kaohsiung Medical University, Kaohsiung, Taiwan; Faculty of Internal Medicine and Hepatitis Research Center, School of Medicine, College of Medicine, and Center for Cancer Research and Liquid Biopsy, Kaohsiung Medical University, Kaohsiung, Taiwan. Byoung K. Jang: Department of Internal Medicine, Keimyung University School of Medicine, Daegu, Korea. Dae W. Jun: Department of Internal Medicine, Hanyang University College of Medicine, Seoul, Korea. Jia H. Kao: National Taiwan University College of Medicine, and National Taiwan University Hospital, Taipei, Taiwan. Jin‐Woo Lee: Department of Internal Medicine, Inha University School of Medicine, Incheon, Korea. Han‐Chieh Lin: Division of Gastroenterology and Hepatology, Department of Medicine, Taipei Veterans General Hospital, Taipei, Taiwan; Faculty of Medicine, School of Medicine, National Yang‐Ming University, Taipei, Taiwan. Kathryn Razavi‐Shearer: Center for Disease Analysis Foundation, Lafayette, Colorado, USA. Wai‐Kay Seto: Department of Medicine, The University of Hong Kong, Queen Mary Hospital, Hong Kong. Grace L.‐H. Wong: Department of Medicine and Therapeutics, The Chinese University of Hong Kong; State Key Laboratory of Digestive Disease, The Chinese University of Hong Kong. Vincent W.‐S. Wong: Department of Medicine and Therapeutics, The Chinese University of Hong Kong; State Key Laboratory of Digestive Disease, The Chinese University of Hong Kong. Homie Razavi: Center for Disease Analysis Foundation, Lafayette, Colorado, USA.
Estes C, Chan HLY, Chien RN, et al. Modelling NAFLD disease burden in four Asian regions—2019‐2030. Aliment Pharmacol Ther. 2020;51:801–811. 10.1111/apt.15673
The Handling Editor for this article was Professor Stephen Ryder, and it was accepted for publication after full peer‐review.
See Appendix 1 for complete list of authors’ affiliations.
Funding information
Funding for this project was provided by Gilead Sciences. The sponsor had no role in the study design, data collection, analysis, interpretation of data or preparation of the manuscript.
REFERENCES
- 1. Korean Association for the Study of the Liver . Liver Disease White Paper 2013; 2013; http://www.kasl.org/bbs/index.html?code=ency%26category=%26gubun=%26idx=%26page=1%26number=55%26mode=view%26order=%26sort=%26keyfield=%26key. Accessed 29 August, 2019.
- 2. Wong VW, Chan WK, Chitturi S, et al. Asia‐Pacific Working Party on Non‐alcoholic Fatty Liver Disease guidelines 2017‐Part 1: definition, risk factors and assessment. J Gastroenterol Hepatol. 2018;33(1):70‐85. [DOI] [PubMed] [Google Scholar]
- 3. Chan WK, Treeprasertsuk S, Imajo K, et al. Clinical features and treatment of nonalcoholic fatty liver disease across the Asia Pacific region‐the GO ASIA initiative. Aliment Pharmacol Ther. 2018;47(6):816‐825. [DOI] [PubMed] [Google Scholar]
- 4. Korean Association for the Study of the Liver . KASL clinical practice guidelines: management of nonalcoholic fatty liver disease. Clin Mol Hepatol. 2013;19(4):325‐348. [DOI] [PMC free article] [PubMed] [Google Scholar]
- 5. Fan JG, Kim SU, Wong VW. New trends on obesity and NAFLD in Asia. J Hepatol. 2017;67(4):862‐873. [DOI] [PubMed] [Google Scholar]
- 6. United Nations. Department of Economic Social Affairs Population Division . World population prospects: the 2019 revision. New York, NY: United Nations; 2019. [Google Scholar]
- 7. Singh S, Allen AM, Wang Z, Prokop LJ, Murad MH, Loomba R. Fibrosis progression in nonalcoholic fatty liver vs nonalcoholic steatohepatitis: a systematic review and meta‐analysis of paired‐biopsy studies. Clin Gastroenterol Hepatol. 2015;13(4):643‐654.e9. [DOI] [PMC free article] [PubMed] [Google Scholar]
- 8. Dulai PS, Singh S, Patel J, et al. Increased risk of mortality by fibrosis stage in nonalcoholic fatty liver disease: systematic review and meta‐analysis. Hepatology. 2017;65(5):1557‐1565. [DOI] [PMC free article] [PubMed] [Google Scholar]
- 9. Angulo P, Hui JM, Marchesini G, et al. The NAFLD fibrosis score: a noninvasive system that identifies liver fibrosis in patients with NAFLD. Hepatology. 2007;45(4):846‐854. [DOI] [PubMed] [Google Scholar]
- 10. McPherson S, Hardy T, Henderson E, Burt AD, Day CP, Anstee QM. Evidence of NAFLD progression from steatosis to fibrosing‐steatohepatitis using paired biopsies: implications for prognosis and clinical management. J Hepatol. 2015;62(5):1148‐1155. [DOI] [PubMed] [Google Scholar]
- 11. White DL, Kanwal F, El‐Serag HB. Association between nonalcoholic fatty liver disease and risk for hepatocellular cancer, based on systematic review. Clin Gastroenterol Hepatol. 2012;10(12):1342‐59.e2. [DOI] [PMC free article] [PubMed] [Google Scholar]
- 12. Younossi ZM, Koenig AB, Abdelatif D, Fazel Y, Henry L, Wymer M. Global epidemiology of non‐alcoholic fatty liver disease‐meta‐analytic assessment of prevalence, incidence and outcomes. Hepatology. 2016;64:73‐84. [DOI] [PubMed] [Google Scholar]
- 13. Younossi ZM, Henry L. Economic and quality‐of‐life implications of non‐alcoholic fatty liver disease. Pharmacoeconomics. 2015;33(12):1245‐1253. [DOI] [PubMed] [Google Scholar]
- 14. Estes C, Anstee QM, Arias‐Loste MT, et al. Modeling NAFLD disease burden in China, France, Germany, Italy, Japan, Spain, United Kingdom, and United States for the period 2016–2030. J Hepatol. 2018;69(4):896‐904. [DOI] [PubMed] [Google Scholar]
- 15. Chitturi S, Wong VW, Chan WK, et al. The Asia‐Pacific Working Party on Non‐alcoholic Fatty Liver Disease guidelines 2017‐Part 2: management and special groups. J Gastroenterol Hepatol. 2018;33(1):86‐98. [DOI] [PubMed] [Google Scholar]
- 16. Estes C, Razavi H, Loomba R, Younossi Z, Sanyal AJ. Modeling the epidemic of nonalcoholic fatty liver disease demonstrates an exponential increase in burden of disease. Hepatology. 2018;67:123‐133. [DOI] [PMC free article] [PubMed] [Google Scholar]
- 17. Blach S, Zeuzem S, Manns M, et al. Global prevalence and genotype distribution of hepatitis C virus infection in 2015: a modelling study. Lancet Gastroenterol Hepatol. 2017;2(3):161‐176. [DOI] [PubMed] [Google Scholar]
- 18. Sonnenberg FA, Beck JR. Markov models in medical decision making: a practical guide. Med Decis Making. 1993;13(4):322‐338. [DOI] [PubMed] [Google Scholar]
- 19. NCD Risk Factor Collaboration (NCD-RisC) . Trends in adult body‐mass index in 200 countries from 1975 to 2014: a pooled analysis of 1698 population‐based measurement studies with 19.2 million participants. Lancet. 2016;387(10026):1377‐1396. [DOI] [PMC free article] [PubMed] [Google Scholar]
- 20. International Diabetes Federation . Diabetes Atlas. 8th ed.; 2017. https://diabetesasia.org/content/diabetes_guidelines/IDF_guidelines.pdf. Accessed 09 September, 2019.
- 21. Bernfort L, Sennfalt K, Reichard O. Cost‐effectiveness of peginterferon alfa‐2b in combination with ribavirin as initial treatment for chronic hepatitis C in Sweden. Scand J Infect Dis. 2006;38(6‐7):497‐505. [DOI] [PubMed] [Google Scholar]
- 22. Ries L, Young G, Keel G, Eisner M, Lin Y, Horner M. SEER Survival Monograph: Cancer Survival Among Adults: U.S. SEER Program, 1988–2001, Patient and Tumor Characteristics. Bethesda, MD: National Cancer Institute, SEER Program; 2007. [Google Scholar]
- 23. Sanyal AJ, Banas C, Sargeant C, et al. Similarities and differences in outcomes of cirrhosis due to nonalcoholic steatohepatitis and hepatitis C. Hepatology. 2006;43(4):682‐689. [DOI] [PubMed] [Google Scholar]
- 24. Rahman RN, Ibdah JA. Nonalcoholic fatty liver disease without cirrhosis is an emergent and independent risk factor of hepatocellular carcinoma: a population based study. Hepatology. 2012;56:241A. [Google Scholar]
- 25. Younossi ZM, Otgonsuren M, Henry L, et al. Association of nonalcoholic fatty liver disease (NAFLD) with hepatocellular carcinoma (HCC) in the United States from 2004 to 2009. Hepatology. 2015;62(6):1723‐1730. [DOI] [PubMed] [Google Scholar]
- 26. Wong VW, Wong GL, Yeung DK, et al. Incidence of non‐alcoholic fatty liver disease in Hong Kong: a population study with paired proton‐magnetic resonance spectroscopy. J Hepatol. 2015;62(1):182‐189. [DOI] [PubMed] [Google Scholar]
- 27. Deurenberg P, Yap M, van Staveren WA. Body mass index and percent body fat: a meta analysis among different ethnic groups. Int J Obes Relat Metab Disord. 1998;22(12):1164‐1171. [DOI] [PubMed] [Google Scholar]
- 28. WHO Expert Consultation . Appropriate body‐mass index for Asian populations and its implications for policy and intervention strategies. Lancet. 2004;363(9403):157‐163. [DOI] [PubMed] [Google Scholar]
- 29. Taiwan Ministry of Health and Welfare . Nutrition and Health Survey in Taiwan (NAHSIT); 2019. https://www.hpa.gov.tw/EngPages/Detail.aspx?nodexml:id=1077%26pxml:id=6201. 24, September, 2019.
- 30. Adams LA, Lymp JF, St Sauver J, et al. The natural history of nonalcoholic fatty liver disease: a population‐based cohort study. Gastroenterology. 2005;129(1):113‐121. [DOI] [PubMed] [Google Scholar]
- 31. Singapore Department of Statistics . Population in Brief; 2019. http://www.nptd.gov.sg/portals/0/news/population-in-brief-2014.pdf. 19 September, 2019.
- 32. Goh SC, Ho EL, Goh KL. Prevalence and risk factors of non‐alcoholic fatty liver disease in a multiracial suburban Asian population in Malaysia. Hepatol Int. 2013;7(2):548‐554. [DOI] [PubMed] [Google Scholar]
- 33. Wong VW, Chu WC, Wong GL, et al. Prevalence of non‐alcoholic fatty liver disease and advanced fibrosis in Hong Kong Chinese: a population study using proton‐magnetic resonance spectroscopy and transient elastography. Gut. 2012;61(3):409‐415. [DOI] [PubMed] [Google Scholar]
- 34. Fung J, Lee CK, Chan M, Seto WK, Lai CL, Yuen MF. High prevalence of non‐alcoholic fatty liver disease in the Chinese ‐ results from the Hong Kong liver health census. Liver Int. 2015;35(2):542‐549. [DOI] [PubMed] [Google Scholar]
- 35. Chen Y, Copeland WK, Vedanthan R, et al. Association between body mass index and cardiovascular disease mortality in east Asians and south Asians: pooled analysis of prospective data from the Asia Cohort Consortium. BMJ. 2013;347:f5446. [DOI] [PMC free article] [PubMed] [Google Scholar]
- 36. Chang Y, Ryu S, Sung KC, et al. Alcoholic and non‐alcoholic fatty liver disease and associations with coronary artery calcification: evidence from the Kangbuk Samsung Health Study. Gut. 2019;68(9):1667‐1675. [DOI] [PubMed] [Google Scholar]
- 37. Hong Kong Department of Health . Number of organ/tissue donation & patient waiting for transplantation under Hong Kong Hospital Authority (1.1.2007‐30.6.2018); 2018. https://www.organdonation.gov.hk/eng/statistics.html. Accessed 08 January, 2020.
- 38. Singapore Ministry of Health . Live On; 2019. http://www.liveon.sg/docs/info_booklets/LiveOn_stats.pdf. Accessed 08 January, 2020.
- 39. The Korean Organ Transplant Registry . 2016 KOTRY Annual Data Report; 2017. http://www.cdc.go.kr/CDC/cms/cmsFileDownload.jsp?fxml:id=60%26cxml:id=136677%26fieldName=attachGrp%26index=1. Accessed 08 January, 2020.
- 40. IRODaT . International Registry on Organ Donation and Transplantation; 2019. http://www.irodat.org/?p=database. Accessed 08 January, 2020.
- 41. Tan EK, Goh BKP, Lee SY, Krishnamoorthy TL, Tan CK, Jeyaraj PR. Liver transplant waitlist outcomes and the allocation of hepatocellular carcinoma model for end‐stage liver disease exception points at a low‐volume center. Transplant Proc. 2018;50(10):3564‐3570. [DOI] [PubMed] [Google Scholar]
- 42. United Nations. Department of Economic and Social Affairs . World Population Ageing, 2017. New York, NY: United Nations; 2017. [Google Scholar]
- 43. Bahk J, Khang YH. Trends in measures of childhood obesity in Korea from 1998 to 2012. J Epidemiol. 2016;26(4):199‐207. [DOI] [PMC free article] [PubMed] [Google Scholar]
- 44. NCD Risk Factor Collaboration (NCD-RisC) . Worldwide trends in body‐mass index, underweight, overweight, and obesity from 1975 to 2016: a pooled analysis of 2416 population‐based measurement studies in 128.9 million children, adolescents, and adults. Lancet. 2017;390(10113):2627‐2642. [DOI] [PMC free article] [PubMed] [Google Scholar]
- 45. International Diabetes Federation . IDF Diabetes Atlas 9th edition 2019 ‐ Diabetes Data Portal; 2020. https://diabetesatlas.org/data/en/country/. Accessed January 17, 2020.
- 46. Phan TP, Alkema L, Tai ES, et al. Forecasting the burden of type 2 diabetes in Singapore using a demographic epidemiological model of Singapore. BMJ Open Diabetes Res Care. 2014;2(1):e000012. [DOI] [PMC free article] [PubMed] [Google Scholar]
- 47. Yoon KH, Lee JH, Kim JW, et al. Epidemic obesity and type 2 diabetes in Asia. Lancet. 2006;368(9548):1681‐1688. [DOI] [PubMed] [Google Scholar]
- 48. Ratziu V, Marchesini G. When the journey from obesity to cirrhosis takes an early start. J Hepatol. 2016;65(2):249‐251. [DOI] [PubMed] [Google Scholar]
- 49. Cho EJ, Kwack MS, Jang ES, et al. Relative etiological role of prior hepatitis B virus infection and nonalcoholic fatty liver disease in the development of non‐B non‐C hepatocellular carcinoma in a hepatitis B‐endemic area. Digestion. 2011;84(Suppl 1):17‐22. [DOI] [PubMed] [Google Scholar]
- 50. Johnson P, Berhane S, Kagebayashi C, et al. Impact of disease stage and aetiology on survival in hepatocellular carcinoma: implications for surveillance. Br J Cancer. 2017;116(4):441‐447. [DOI] [PMC free article] [PubMed] [Google Scholar]
- 51. Chang PE, Wong GW, Li JW, Lui HF, Chow WC, Tan CK. Epidemiology and clinical evolution of liver cirrhosis in Singapore. Ann Acad Med Singapore. 2015;44(6):218‐225. [PubMed] [Google Scholar]
- 52. Yoo JJ, Kim W, Kim MY, et al. Recent research trends and updates on nonalcoholic fatty liver disease. Clin Mol Hepatol. 2018. [DOI] [PMC free article] [PubMed] [Google Scholar]
- 53. Younossi ZM. The epidemiology of nonalcoholic steatohepatitis. Clin Liv Dis. 2018;11(4):92‐94. [DOI] [PMC free article] [PubMed] [Google Scholar]
- 54. Liu DJ, Peloso GM, Yu H, et al. Exome‐wide association study of plasma lipids in >300,000 individuals. Nat Genet. 2017;49(12):1758‐1766. [DOI] [PMC free article] [PubMed] [Google Scholar]
- 55. Lin M, Chu CC, Chang SL, et al. The origin of Minnan and Hakka, the so‐called "Taiwanese", inferred by HLA study. Tissue Antigens. 2001;57(3):192‐199. [DOI] [PubMed] [Google Scholar]
- 56. European Association for the Study of the Liver (EASL) , European Association for the Study of Diabetes (EASD) , European Association for the Study of Obesity (EASO) . EASL‐EASD‐EASO Clinical Practice Guidelines for the management of non‐alcoholic fatty liver disease. Diabetologia. 2016;59(6):1121‐1140. [DOI] [PubMed] [Google Scholar]
- 57. Alberti G, Zimmet P, Shaw J, Bloomgarden Z, Kaufman F, Silink M. Type 2 diabetes in the young: the evolving epidemic: the international diabetes federation consensus workshop. Diabetes Care. 2004;27(7):1798‐1811. [DOI] [PubMed] [Google Scholar]
- 58. Fracanzani AL, Valenti L, Bugianesi E, et al. Risk of severe liver disease in nonalcoholic fatty liver disease with normal aminotransferase levels: a role for insulin resistance and diabetes. Hepatology. 2008;48(3):792‐798. [DOI] [PubMed] [Google Scholar]
- 59. Angulo P, Kleiner DE, Dam‐Larsen S, et al. Liver fibrosis, but no other histologic features, is associated with long‐term outcomes of patients with nonalcoholic fatty liver disease. Gastroenterology. 2015;149(2):389‐97.e10. [DOI] [PMC free article] [PubMed] [Google Scholar]
- 60. Afshin A, Forouzanfar MH, Reitsma MB, et al. Health effects of overweight and obesity in 195 countries over 25 years. New Engl J Med. 2017;377(1):13‐27. [DOI] [PMC free article] [PubMed] [Google Scholar]
- 61. World Health Organization . Global action plan for the prevention and control of noncommunicable diseases 2013–2020. Geneva, Switzerland: World Health Organization; 2013. [Google Scholar]
Associated Data
This section collects any data citations, data availability statements, or supplementary materials included in this article.
Supplementary Materials