Abstract
To investigate the possible mechanisms for biological effects of 1,800 MHz mobile radiofrequency radiation (RFR), the radiation‐specific absorption rate was applied at 2 and 4 W/kg, and the exposure mode was 5 min on and 10 min off (conversation mode). Exposure time was 24 h short‐term exposure. Following exposure, to detect cell DNA damage, cell apoptosis, and reactive oxygen species (ROS) generation, the Comet assay test, flow cytometry, DAPI (4′,6‐diamidino‐2‐phenylindole dihydrochloride) staining, and a fluorescent probe were used, respectively. Our experiments revealed that mobile phone RFR did not cause DNA damage in marginal cells, and the rate of cell apoptosis did not increase (P > 0.05). However, the production of ROS in the 4 W/kg exposure group was greater than that in the control group (P < 0.05). In conclusion, these results suggest that mobile phone energy was insufficient to cause cell DNA damage and cell apoptosis following short‐term exposure, but the cumulative effect of mobile phone radiation still requires further confirmation. Activation of the ROS system plays a significant role in the biological effects of RFR. Bioelectromagnetics. © 2020 The Authors. Bioelectromagnetics published by Wiley Periodicals, Inc.
Keywords: radiofrequency radiation, cochlear stria marginal cells, DNA damage, cell apoptosis, reactive oxygen species
INTRODUCTION
With the development of technology in recent years, the percentage of the general population exposed to radiofrequency radiation (RFR) has markedly increased. The International Agency for Research on Cancer (IARC) has defined RFR emitted from mobile phones as a possible carcinogen for humans [IARC Working Group on the Evaluation of Carcinogenic Risks to Humans, 2013]. The mobile phone has become an indispensable part of modern communication. More than 50% of the population uses mobile phones in many countries, and in some parts of the world, mobile phones are the most reliable or the only phones available; thus, possible health effects of RFR have attracted considerable public attention.
Frequency bands vary in different countries; however, in general, the Global System of Mobile Communications (GSM) for mobile phones uses 900/1,800 MHz frequency bands [Kesari et al., 2013b]. The appropriate biologically effective quantity is defined as the specific absorption rate (SAR), measured in watts per kilogram (W/kg). The current guidelines for European and the United States’ microwave exposure indicate that exposure should not exceed 2 W/kg [Vecchia, 2007]. The bio‐effects of RFR have been investigated and are related to an increase in temperature upon radiation exposure rather than electromotive force [Alfieri et al., 2006; Bernardini et al., 2007; Verschaeve et al., 2010]. Due to these thermal effects, the value of 4 W/kg is universally accepted as the threshold for the induction of biological thermal effects [Bernardi et al., 2003]. With regard to the bio‐effects of RFR emanating from mobile phones on the human body, much work has recently been reported in this field, including impaired male fertility and a decrease in the number of neuronal cells, which impacts brain activity and increases the chance of neuropsychological disorders such as anxiety, headache, drowsiness, hypomnesis, and an increased risk of glioma and acoustic neuroma [Salford et al., 2003; Agarwal et al., 2009; Jing et al., 2012; Hardell et al., 2013; Pall, 2016]. RFR is classified as non‐ionizing radiation, and unlike ionizing radiation such as X‐rays or γ rays, RFR can neither break chemical bonds nor cause ionization in the human body. The target organs at risk also vary with respect to the type and nature of exposure; observable effects in body scale and public health may be very complicated, thus gaining considerable attention [Galloni et al., 2005].
The ear and its function, due to its closeness to mobile phones, could be the first biological target of interactions, but controversies still exist in many of these reports. Some studies have reported that long‐term exposure to 900 MHz RFR did not affect the cochlear function of rats by using distortion product otoacoustic emissions, but the ultrastructure of the organ of corti had significant cellular destruction [Yorgancilar et al., 2012; Seckin et al., 2014]. Additionally, in vitro, there were changes in the ultrastructure of spiral ganglion neurons following exposure to 1,800 MHz, 4 W/kg after lipopolysaccharide treatment; the expression of autophagy bio‐markers significantly increased [Zuo et al., 2015]. Previous reports also demonstrated that auditory hair cells after exposure to 1,763 MHz did not induce cellular responses such as changes in cell cycle, DNA damage, gene expression, or stress response [Huang et al., 2008].
The generation of reactive oxygen species (ROS), which is mediated by RFR, is considered to be one of the primary bio‐effect mechanisms [Kesari et al., 2013a]. With many more mitochondria in stria marginal cells (MCs) than in other cells, MCs are extremely sensitive to ROS attack, and are considered to be highly vulnerable to oxidative damage [Silva and Larsson, 2002]. In the present study, we established a model to investigate whether 1,800 MHz mobile phone RFR at 2 and 4 W/kg caused DNA damage, cell apoptosis, and ROS generation in MCs.
MATERIALS AND METHODS
Animals
Forty newborn (1–3‐day‐old male or female) Sprague–Dawley (SD) rats were purchased from the Animal Center of Chongqing Medical University, ChongQing, China. The animal center is qualified for raising and breeding research animals. Animals were fed according to the standard protocols (temperature 20–22°C and humidity 55 ± 10%) approved by the Statute of Laboratory Animal Management Administration of China. All experiments were approved by the Ethics Committee of the Chongqing Medical University of China.
Primary Culture and Identification
After receiving ethyl ether inhaled anesthesia, the newborn SD rats were treated with 75% ethanol for about 10 min. The bilateral temporal bones were dissected and removed, and the stria vascularis (SV) was separated from basement membrane, cut into pieces, and digested with 0.1% type II collagenase at 37°C for 30 min. After the cell samples were centrifuged at 1,000 rpm for 5 min, the cells were resuspended and planted in 35 mm cell culture plates containing epithelial cell medium‐animal (EpiCM‐animal) (ScienCell, San Diego, CA), and were placed in an incubator at 37°C in 5% CO2 and 95% air. The MCs attached to the well‐plate after 24 h. The typical morphology of MCs was observed under an inverted microscope (Ix 53; Olympus, Tokyo, Japan) (Fig. 1A). The purified cell suspension was placed in a sterile six‐well plate coated with polylysine. Cytokeratin‐18 (CK18), a marker of MCs, was detected by immunofluorescence. The culture medium was discarded when the MCs merged into a single layer. The MCs were then washed with phosphate‐buffered saline (PBS, pH 7.4) and fixed in 4% paraformaldehyde for 15 min. The MCs were then permeabilized in 0.3% Triton X‐100 (Sigma‐Aldrich, St. Louis, MO) for 20 min and blocked with 5% bovine serum albumin for 10 min. The specimens were incubated overnight in an anti‐CK18 solution (Santa Cruz Biotechnology, Dallas, TX). The MCs were subsequently incubated with anti‐rabbit IgG (1:100) in a dark environment for 30 min and washed with PBS, dyed with DAPI (4′,6‐diamidino‐2‐phenylindole dihydrochloride; Beyotime Biotechnology, Shanghai, China), and sealed with anti‐fluorescence quenching agent, and then the slides were observed under a fluorescence electron microscope (DM2700M; Leica, Tengrant, Frankfurt, Germany) (Fig. 1B).
Figure 1.
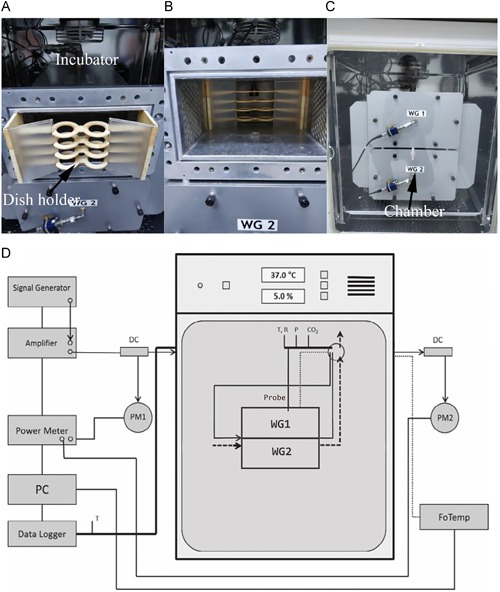
Exposure system. (A and B) Eight 35‐mm Petri dishes could be placed in the exposure and sham waveguide (WG). (C) Two waveguides were placed in the cell culture incubator; one waveguide was used for radiation‐exposure groups and the other one for sham‐exposure groups. (D) Schematic diagram of experimental setup of radiofrequency radiation exposure system.
RFR Exposure System
The RFR exposure system (Fig. 1) was purchased from the Foundation for Information Technologies in Society (IT'IS Foundation, Zurich, Switzerland) [Schonborn et al., 2000; Zuo et al., 2015]. It consisted of two 128.5 × 65 × 424 mm3 brass single‐mode waveguide resonators operating at a carrier radiofrequency of 1,800 MHz and placed inside a Forma incubator (HERAcell 150i; Thermo Fisher Scientific, Waltham, MA). Each resonator was equipped with a plastic holder hosting eight 35 mm Petri dishes arranged in two stacks. The dishes were placed in the H‐field maximum of the standing wave inside the waveguide (E‐polarization). To guarantee sufficient air circulation for the incubator, the waveguides were equipped with DC ventilators (Ebm‐papst, St. Georgen, Germany), which take in air through two slots near the end of the waveguide. The driving currents of the ventilators were continuously monitored by computer in order to control their process. The air temperature in the waveguides was monitored with Pt100 probes (Pt100; Seneca, Milan, Italy), which were fixed outside the waveguides in the air flow produced by the fans. The carrier frequency, modulation, periodically repeated on‐ and off‐time of exposure, and SAR level were controlled by a computer. In particular, the waveform and exposure/sham condition were assigned to the two waveguides by the computer‐controlled signal unit. One waveguide was used for radiation‐exposure groups, whereas the other one was for sham‐exposure groups. All exposure conditions and monitor data were encrypted in a file, which was decoded only after data analysis in order to ensure blind conditions for the experiment. The system was characterized using a finite difference time domain simulation program (SEMCAD, Zurich, Switzerland). The simulation results were extensively verified using a near‐field scanner DASY3 (SPEAG, Zurich, Switzerland) equipped with dosimetric field and temperature probes [Schuderer et al., 2004]. The results showed that (i) the temperature of the monolayer cells is uniformly distributed without localized temperature “hot spots” [Schuderer et al., 2004]; (ii) the increase in temperature due to the RFR is well below 0.1°C per unit SAR, with a thermal time constant of 280 s for 3.1 ml medium in the petri dishes; (iii) the temperature differences between sham and exposed cells are less than 0.1°C.
Direct temperature measurements were routinely performed using a temperature probe inserted in the medium (T1V3; SPEAG), which confirmed the results of previous simulations [Schuderer et al., 2004].
Experimental Design
After cell seeding for 24 h, the culture medium was replaced, and the cells were subjected to 24 h exposure to 1,800 MHz “conversation mode” signals with an intermittent cycle of 5 min on and 10 min off. To study the SAR‐related effects of RFR exposure, dishes were randomly divided into the following groups: (i) control group, (ii) 2 W/kg (either exposure or sham‐exposure), (iii) 4 W/kg (either exposure or sham‐exposure), and (iv) hydrogen peroxide (H2O2) positive control group.
To detect DNA damage levels in MCs, H2O2 treatment was used to establish a positive control. In brief, a 10 mM (mmol/L) stock solution was obtained by adding 1 μM (μmol/L) H2O2 (30 wt.% in H2O) (Sigma‐Aldrich) to 1 ml serum‐free Dulbecco's modified Eagle's medium (DMEM). Both the experimental cells that were exposed to RFR and positive control cells came from the same batch. Under the same culture conditions that were used for the experimental cells (37°C, 5% CO2/95% atmospheric air), the positive control cells were incubated for 15 min in DMEM serum‐free medium containing 30 μM H2O2. The 30 μM H2O2 concentration was chosen because it represented a point on a dose–response curve over the range of 10–100 μM H2O2 at which cell viability was above 90% but DNA strand breaks and base damage were significantly induced.
Evaluation of DNA Damage
Comet assay is the most commonly used method for detecting cellular DNA damage. According to Comet assay kit's (Trevigen, Gaithersburg, MD) instructions and protocols, the test was performed under alkaline in an alkaline condition. Within 1 h after exposure to RFR and H2O2, the cells were washed with PBS, digested with trypsin, and resuspended in PBS for the Comet assay. The cell suspension (10 μl: 10,000 cells) was embedded in 60 μl LMPA (0.65% low‐melting‐point agarose) and immediately pipetted onto Comet Slides (Trevigen). After the slides had been prechilled at 4°C for 30 min and agarose had solidified, they were immersed in lysis solution (2.5 M NaCl, 100 mM Na 2 EDTA, 10 mM Tris, 1% Triton X‐100, 10% DMSO, pH 10) for 2 h at 4°C. Subsequently, the slides were transferred to the electrophoresis chamber and allowed to rest in alkaline buffer (300 mM sodium hydroxide, 1 mM EDTA) at room temperature, and electrophoresis was run at 25 V/300 mA for 30 min. After electrophoresis, the slides were washed with dH2O (distilled water) dehydrated in ethanol, and air‐dried at 4°C. The slides were stained with attenuated SYBR Green I (Invitrogen, Waltham, MA), and analysis was carried out using a fluorescence microscope (Leica Microsystems, Wetzlar, Germany). The level of DNA damage was analyzed using the tail DNA (%), tail moment (arbitrary units), and tail length (μm) [Zuo et al., 2015]. Images of 200 randomly selected cells were analyzed from each slide. All the Comet parameters were analyzed with a computer‐based image analysis system (Comet Assay Software Project; CASP Lab, Wroclaw, Poland). The damaged cells showed a Comet‐like appearance, presenting a “tail” shape, which did not occur in normal cells. All of the experiments were repeated at least three times on independent samples.
Detection of Apoptosis
Apoptosis was measured by the Annexin V‐FITC apoptosis detection kit (Beyotime Biotechnology) and DAPI nuclear staining. In brief, the cells were collected after each treatment, washed with PBS, and incubated with trypsin. Cell suspensions were collected and centrifuged, the supernatant was discarded, the pellets were washed with PBS, and the final concentrations were adjusted to 1 × 10⁶–1 × 10⁷ cells/ml. Cells were resuspended in 200 μl of 1× binding buffer (5 μl Annexin V‐FITC, 10 μl PI), incubated on ice for 15 min in the dark, and then analyzed by flow cytometry (FACSVantage SE; BD Biosciences, Carlsbad, CA). At least 10,000 event cells were counted and gated in four categories: live (Annexin‐V–/PI–), early apoptotic (Annexin‐V+PI−), late apoptotic (Annexin‐V+PI+), and necrotic (Annexin‐V–/PI+) cells. In addition, partial cells were fixed with 4% paraformaldehyde for 30 min after each treatment and stained with DAPI for 5 min in dark. After DAPI (Beyotime Biotechnology) nuclear staining, the cells were monitored under a fluorescence microscope (Leica Microsystems) for nuclear change. All of the experiments were repeated at least three times on independent samples.
Determination of Caspase‐3 Activity
As activated caspase‐3 plays a critical role in the final classical pathway in caspase‐dependent apoptosis, the activity of caspase‐3 was determined using a chemical self‐illumination technique that employs Ac‐DEVD‐AFC (ENZO Life Sciences, Farmingdale, NY), a specific fluorogenic substrate for caspase‐3. The activity of caspase‐3 was determined on a multifunctional microplate reader (DX711; Xunda Medical Instrument, Shanghai, China) equipped with a 400‐nm excitation filter and a 505‐nm emission filter. The results were expressed as fold change relative to the control group, and all of the experiments were repeated at least three times on independent samples.
Assay of Intracellular ROS
Intracellular ROS was detected by dichloro‐dihydro‐fluorescein diacetate (DCFH‐DA) (Beyotime Biotechnology). In brief, after exposure, the MCs were collected and loaded with the fluorescent probe, the cell culture medium was discarded, and the cells were incubated with 1 ml of DCFH‐DA (1:1,000) for 20 min at 37°C. The MCs were washed three times with serum‐free medium containing 10 μmol/L DCFH‐DA for 5 min each time. The amount of fluorescence was relative to the quantity of ROS in the MCs. Cells were analyzed by using an Infinite M200 microplate reader (Tecan, Männedorf, Switzerland), and the fluorescence wavelengths used were 488 nm for excitation and 525 nm for emission. All of the experiments were repeated at least three times on independent samples.
Statistics
The data were analyzed by SPSS 17.0 (SPSS, Chicago, IL). According to previous studies [Lee et al., 2004; Seidel et al., 2012], median values of DNA damage were selected to represent the amount of DNA damage. Therefore, the two‐tailed Student's t test was used to contrast the averages of the median DNA damage between the exposed, sham‐exposed, and control groups. Other data were analyzed by one‐way analysis of variance. Differences with a P‐value of <0.05 were considered statistically significant. All the results were expressed as means ± standard error of the mean.
RESULTS
Primary Culture and Identification
As shown in Figure 2, the MCs with a clear boundary had a pleomorphic growth pattern. MCs assumed a “cobblestone‐like” appearance when they were closely connected and grew into a monolayer, while presenting a “dome” appearance when they accumulated into a multilayer under inverted phase contrast microscopy (Fig. 1A). Fluorescent signals indicative of cytokeratin‐18 were strong in the cultured cells (Fig. 1B).
Figure 2.
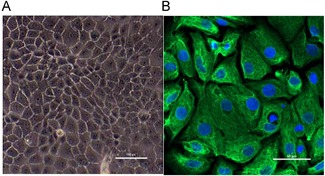
Morphology and identification of MCs. (A) The cultured primary cells showed clear boundaries and presented a cobblestone‐like appearance (shown at ×20 magnification). (B) Immunofluorescence of cytokeratin‐18 (green) expressed in the cytoplasm (shown at ×200 magnification). MC = marginal cell.
Detection of DNA Damage
The body of normal cells present intact, undamaged DNA that remains in the region of the nuclear matrix. The damaged cells assume a Comet‐like appearance, including a “tail” shape (Fig. 3). Two hundred cells in each group were randomly selected for analysis. A Comet assay image analysis system (CASP Lab) was used to measure all the Comet parameters. The results revealed that all the Comet parameters were significantly increased after exposure to H2O2, which suggested that the dose of H2O2 effectively induced DNA strand breaks. However, there were no significant differences in the Comet parameters among any of the groups after exposure to 2, 4 W/kg (P > 0.05) (Fig. 4), demonstrating that radiofrequency electromagnetic radiation (RF‐EMR) energy was insufficient to induce DNA damage in MCs (Fig. 5).
Figure 3.
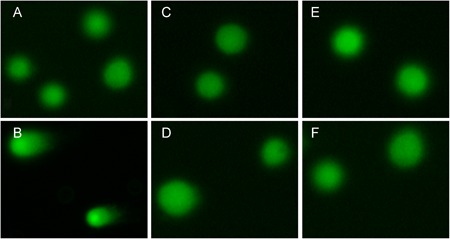
Evaluation of DNA damage by the Comet assay. (A) Control group, (B) H2O2 positive control group, (C) 2 W/kg exposure group, (D) 2 W/kg sham‐exposure group, (E) 4 W/kg exposure group, (F) 4 W/kg sham‐exposure group (shown at ×200 magnification). The H2O2 positive control group assumed a Comet‐like appearance, while cells in the other groups were intact with no evidence of DNA damage following exposure to radiofrequency radiation. H2O = hydrogen peroxide; RFR = radiofrequency radiation.
Figure 4.
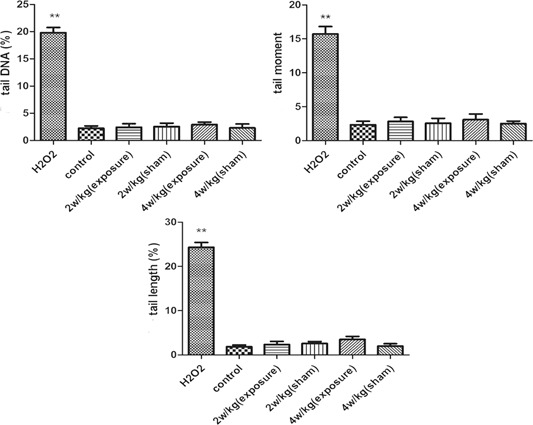
RFR did not induce DNA damage. The levels of DNA base damage are expressed as the tail DNA (%), tail moment, and tail length (μm). Bars represent the means ± standard error of the mean of three independent experiments. Two hundred nuclei were analyzed for each group of each experiment. **P < 0.01 versus control group. RFR = radiofrequency radiation; SEM = standard error of the mean.
Figure 5.
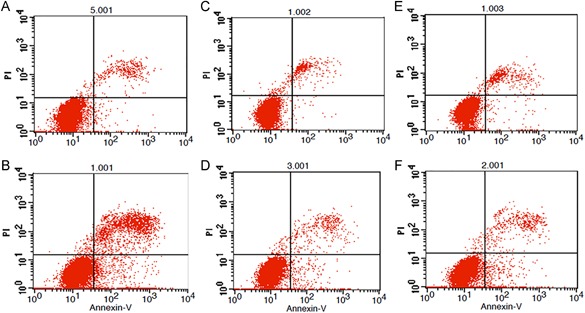
Detection of apoptosis by flow cytometry. (A) Control group, (B) H2O2 positive control group, (C) 2 W/kg exposure group, (D) 2 W/kg sham‐exposure group, (E) 4 W/kg exposure group, (F) 4 W/kg sham‐exposure group. The apoptosis rate was evaluated by flow cytometry after Annexin V‐APC/PI staining. The upper left quadrants include the necrotic cells (AV−/PI+); the lower left quadrants include the viable cells (AV−/PI−); the upper right quadrants include the late apoptotic cells (AV+/PI+); and the lower right quadrants include the early apoptotic cells (AV+/PI−). Compared with the control group, the rate of total apoptosis in the H2O2 positive control group was significantly increased, but there were no significant changes in the other groups. H2O2 = hydrogen peroxide.
Evaluation of Apoptosis
As shown in Figure 6, the apoptosis rate of MCs in the H2O2 group was much higher than that in the control group (P < 0.05). However, following exposure to RFR at 2 and 4 W/kg, the rate of apoptosis was similar to that in the control group (P > 0.05). DAPI staining revealed that the nuclei of the MCs were condensed and fragmented after treatment with H2O2 (Fig. 7B–C), suggesting that the cells were apoptotic, while other groups presented a normal regular and oval shape. In addition, the activity of caspase‐3 was detected; Figure 8 shows that caspase‐3 activity increased in the H2O2 group compared with the control group (P < 0.05). However, there were no significant differences in caspase‐3 activity among any of the groups after exposure to 2 and 4 W/kg, and the findings were consistent with the results of flow cytometry. All the results demonstrate that RFR could not increase the apoptosis rate of MCs.
Figure 6.
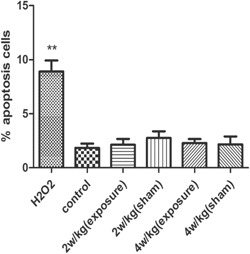
The rate of cell apoptosis did not increase. Detection of cell apoptosis by flow cytometry was seen in the H2O2 group; **P < 0.01 compared with the control group, whereas there were no significant changes in the other groups; P > 0.05 compared with the control group. The percentage of apoptotic cells was represented as the mean ± SEM of three independent experiments. H2O2 = hydrogen peroxide; SEM = standard error of the mean.
Figure 7.
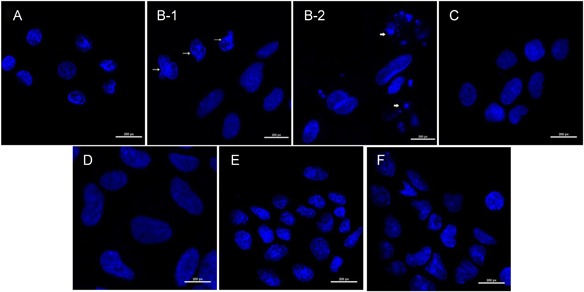
Assessment of marginal cells’ morphology by DAPI staining. Nuclear condensation (long arrows) and nuclear fragmentation (short arrows) were observed in H2O2 group, while other groups presented a normal regular and oval shape. (A) Control, (B‐1) H2O2 nuclear condensation, (B‐2) H2O2 nuclear fragmentation, (C) 2 W/kg exposure group, (D) 2 W/kg sham‐exposure group, (E) 4 W/kg exposure group, (F) 4 W/kg sham‐exposure group. DAPI = 4′,6‐diamidino‐2‐phenylindole dihydrochloride; H2O2 = hydrogen peroxide.
Figure 8.
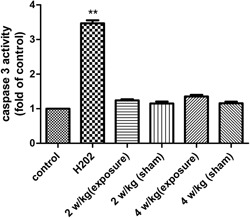
The activity of caspase‐3 was measured by using a multifunctional microplate reader. Caspase‐3 activity increased in the H2O2 group compared with the control group (P < 0.05), whereas there were no significant changes in the other groups; P > 0.05 compared with the control group. H2O2 = hydrogen peroxide.
Measurement of Intracellular ROS Level
To further investigate the effects of RFR, intracellular ROS was also detected by using DCFH‐DA. As shown in Figure 9, after exposure to H2O2 or RFR at 4 W/kg, the levels of ROS were significantly increased compared with the control group and 4 W/kg sham‐exposed group (P < 0.05). However, exposure to RFR at 2 W/kg showed no differences between the RFR‐exposed and sham‐exposed conditions.
Figure 9.
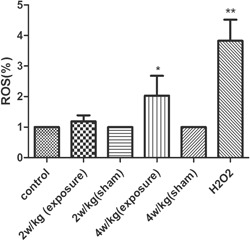
ROS levels were detected by using DCFH‐DA. Cellular fluorescence intensity was significantly increased after exposure to RFR at 4 W/kg compared with the control group. **P < 0.01 compared with the control group, *P < 0.05 compared with the control group. Values are means ± SEM of three independent experiments. DCFH‐DA = dichloro‐dihydro‐fluorescein diacetate; RFR = radiofrequency radiation; ROS = reactive oxygen species; SEM = standard error of the mean.
DISCUSSION
Previous studies have shown that the generation of ROS was increased by RFR both in vivo and in vitro, which induced DNA oxidative damage; thus, activation of the ROS system is deemed to be the main mechanism of the bio‐effects of RFR [Yao et al., 2008; Avci et al., 2012].
The cochlea has high aerobic metabolism, which can generate a high level of adenosine triphosphate (ATP) and a large number of ROS; thus it is particularly vulnerable to ROS attack. In terms of maintaining cochlear fluid homeostasis, preserving organ of corti function, generating the endocochlear potential (EP) and so on, the SV of the cochlear lateral wall plays a critical role [Takeuchi et al., 2000]. The structural characteristics of the SV are summarized as follows: (i) the interior of the SV is isolated by two distinct cell layers, the MC layer, and the basal cell layer, each connected by tight junctions; and (ii) intermediate cells and capillaries are located between these two cell layers. MCs that possess Na/K‐ATPase and Na/K channels in the plasma membrane are thought to be mainly responsible for maintaining the balance of the endolymphatic ion environment and maintenance of EP [Kakigi et al., 2008]; thus, the energy supply of the inner ear will be affected when MCs are damaged by ROS.
The International Commission on Non‐Ionizing Radiation Protection (ICNIRP) has suggested that exposure due to mobile phones should not exceed 2 W/kg [Hardell and Sage, 2008]. However, the radiation intensity of a mobile phone will increase significantly if the signal is insufficient or at the moment of turn‐on. The value of 4 W/kg, which is defined as the threshold for the induction of biological thermal effects, is accepted worldwide. In our study, according to the above international standards, the 1,800 MHz RF‐EMR exposure system at SAR 2 and 4 W/kg was used to research the bio‐effects of RFR. Our exposure mode was 5 min on and 10 min off (conversation mode), which may be better for investigating the main mechanism of RFR bio‐effects and its influence on the human body.
Theoretically, the energy of RFR emitted from a mobile phone is insufficient to break the bonds between biomolecules. In our study, we found that 1,800 MHz RFR did not directly cause DNA damage of MCs in the groups studied, which is in accordance with most previous studies. On the contrary, Akdag et al. [2018] reported that exposure to RFR has the potential to induce DNA damage in follicle cells of hair in the ear canal. Different cells and parameters of electromagnetic fields such as exposure time, frequency, and intensity may cause different results.
It is well‐known that ATP is primarily produced by mitochondrial DNA (mtDNA), which can be damaged by the overproduction of ROS. Severe consequences, including decreased ATP synthesis, damage to the respiratory chain, impairment of mitochondrial membrane potential, and even cell apoptosis, may occur when mtDNA is destroyed [Ma et al., 1999; Lin et al., 2010]. Several studies have demonstrated that overproduction of ROS can activate DNA damage, Ca2+ channels, and the expression of heat shock proteins. DCFH‐DA was applied to detect intracellular oxidant production, and a higher level of ROS was observed following exposure to 4 W/kg compared with the control group. However, this did not cause DNA damage or apoptosis following short‐term exposure in our study, which was probably due to compensation by MCs. Long‐term exposure to a high level of ROS may result in damage to MCs. Previous research has indicated that different cells exposed to RFR may suffer various degrees of damage. For example, exposure to RF‐EMR induced protein oxidation of brain tissue and increased serum nitric oxide but had no effect on eye tissue [Avci et al., 2012; Demirel et al., 2012].
In our study, short‐term exposure was adopted to assess the effect of RFR on MCs in vivo. We found that the 1,800 MHz RFR exposure system at SAR 2 and 4 W/kg cannot induce DNA damage and cell apoptosis in MCs. However, studies have reported that occupational or long‐time exposure to electromagnetic radiation fields can lead to sensorineural hearing loss [Oktay et al., 2004; Oktay and Dasdag, 2006]. We intend to further demonstrate the effects of long‐time exposure to electromagnetic radiation fields on the auditory system in vivo model.
CONCLUSION
The RFR emitted from mobile phones was insufficient to cause cell DNA damage and cell apoptosis following short‐term exposure, but intracellular ROS levels in the 4 W/kg exposure group were significantly increased than in the control group, indicating that activation of the ROS system plays a crucial role in the biological effects of RFR. The cumulative effect of mobile phone radiation requires investigation.
AUTHORS CONTRIBUTIONS
Wenqi Zuo designed the study, wrote the protocol and supervised the data collection. Honghong Yang and Yuanyuan Zhang performed the experiments and did the statistical analyses. All of the authors participated in the data analysis, manuscript discussion and editing. All authors contributed to and have approved the final manuscript.
Honghong Yang and Yuanyuan Zhang are the co‐first authors and have contributed equally to the work.
Grant sponsor: The Foundation and Frontier Research Project, Science and Technology Commission, grant number: 20180105; Grant sponsor: Science and Technology Research Program of Chongqing Municipal Education Commission, grant number: KJQN201900433; Grant sponsor: National Nature Science Foundation of China, grant number: 81700916.
Conflicts of interest: None.
REFERENCES
- Agarwal A, Desai N‐R, Makker K, Varghese A, Mouradi R, Sabanegh E, Sharma R. 2009. Effects of radiofrequency electromagnetic waves (RF‐EMW) from cellular phones on human ejaculated semen: An in vitro pilot study. Fertil Steril 92:1318–1325. [DOI] [PubMed] [Google Scholar]
- Akdag M, Dasdag S, Canturk F, Akdag M‐Z. 2018. Exposure to non‐ionizing electromagnetic fields emitted from mobile phones induced DNA damage in human ear canal hair follicle cells. Electromagn Biol Med 37:66–75. [DOI] [PubMed] [Google Scholar]
- Alfieri R‐R, Bonelli M‐A, Pedrazzi G, Desenzani S, Ghillani M, Fumarola C, Ghibelli L, Borghetti A‐F, Petronini P‐G. 2006. Increased levels of inducible HSP70 in cells exposed to electromagnetic fields. Radiat Res 165:95–104. [DOI] [PubMed] [Google Scholar]
- Avci B, Akar A, Bilgici B, Tunçel Ö‐K. 2012. Oxidative stress induced by 1.8 GHz radio frequency electromagnetic radiation and effects of garlic extract in rats. Int J Radiat Biol 88:799–805. [DOI] [PubMed] [Google Scholar]
- Bernardi P, Cavagnaro M, Pisa S, Piuzzi E. 2003. Specific absorption rate and temperature elevation in a subject exposed in the far‐field of radio‐frequency sources operating in the 10‐900‐MHz range. IEEE Trans Biomed Eng 50:295–304. [DOI] [PubMed] [Google Scholar]
- Bernardini C, Zannoni A, Turba M‐E, Bacci M‐L, Forni M, Mesirca P, Remondini D, Castellani G, Bersani F. 2007. Effects of 50 Hz sinusoidal magnetic fields on Hsp27, Hsp70, Hsp90 expression in porcine aortic endothelial cells (PAEC). Bioelectromagnetics 28:231–237. [DOI] [PubMed] [Google Scholar]
- Demirel S, Doganay S, Turkoz Y, Dogan Z, Turan B, Firat P‐G. 2012. Effects of third generation mobile phone‐emitted electromagnetic radiation on oxidative stress parameters in eye tissue and blood of rats. Cutaneous Ocul Toxicol 31:89–94. [DOI] [PubMed] [Google Scholar]
- Galloni P, Lovisolo G‐A, Mancini S, Parazzini M, Pinto R, Piscitelli M, Ravazzani P, Marino C. 2005. Effects of 900 MHz electromagnetic fields exposure on cochlear cells' functionality in rats: Evaluation of distortion product otoacoustic emissions. Bioelectromagnetics 26:536–547. [DOI] [PubMed] [Google Scholar]
- Hardell L, Carlberg M, Mild K‐H. 2013. Use of mobile phones and cordless phones is associated with increased risk for glioma and acoustic neuroma. Pathophysiology 20:85–110. [DOI] [PubMed] [Google Scholar]
- Hardell L, Sage C. 2008. Biological effects from electromagnetic field exposure and public exposure standards. Biomed Pharmacother 62:104–109. [DOI] [PubMed] [Google Scholar]
- Huang T‐Q, Lee M‐S, Oh E‐H, Kalinec F, Zhang B‐T, Seo J‐S, Park W‐Y. 2008. Characterization of biological effect of 1763 MHz radiofrequency exposure on auditory hair cells. Int J Radiat Biol 84:909–915. [DOI] [PubMed] [Google Scholar]
- IARC Working Group on the Evaluation of Carcinogenic Risks to Humans . 2013. Non‐ionizing radiation, Part 2: Radiofrequency electromagnetic fields IARC monographs on the evaluation of carcinogenic risks to humans, Vol. 103 Lyon: International Agency for Research on Cancer; p 1. [PMC free article] [PubMed] [Google Scholar]
- Jing J, Yuhua Z, Xiao‐Qian Y, Rongping J, Dong‐Mei G, Xi C. 2012. The influence of microwave radiation from cellular phone on fetal rat brain. Electromagn Biol Med 31:57–66. [DOI] [PubMed] [Google Scholar]
- Kakigi A, Okada T, Takeda T, Taguchi D, Nishioka R. 2008. Presence and regulation of epithelial sodium channels in the marginal cells of stria vascularis. Acta Otolaryngol 128:233–238. [DOI] [PubMed] [Google Scholar]
- Kesari K‐K, Kumar S, Nirala J, Siddiqui M‐H, Behari J. 2013a. Biophysical evaluation of radiofrequency electromagnetic field effects on male reproductive pattern. Cell Biochem Biophys 65:85–96. [DOI] [PubMed] [Google Scholar]
- Kesari K‐K, Siddiqui M, Meena R, Verma H, Kumar S. 2013b. Cell phone radiation exposure on brain and associated biological systems. Indian J Exp Biol 51:187–200. [PubMed] [Google Scholar]
- Lee E, Oh E, Lee J, Sul D, Lee J. 2004. Use of the tail moment of the lymphocytes to evaluate DNA damage in human biomonitoring studies. Toxicol Sci 81:121–132. [DOI] [PubMed] [Google Scholar]
- Lin C‐J, Ho H‐Y, Cheng M‐L, Cheng T‐H, Yu J‐S, Chiu DT‐Y. 2010. Impaired dephosphorylation renders G6PD‐knockdown HepG2 cells more susceptible to H2O2‐induced apoptosis. Free Radic Biol Med 49:361–373. [DOI] [PubMed] [Google Scholar]
- Ma Y, Ogino T, Kawabata T, Li J, Eguchi K, Okada S. 1999. Cupric nitrilotriacetate‐induced apoptosis in HL‐60 cells: Association with lipid peroxidation, release of cytochrome C from mitochondria, and activation of caspase‐3. Free Radic Biol Med 27:227–233. [DOI] [PubMed] [Google Scholar]
- Oktay MF, Dasdag S. 2006. Effects of intensive and moderate cellular phone use on hearing function. Electromagn Biol Med 25:13–21. [DOI] [PubMed] [Google Scholar]
- Oktay M‐F, Dasdag S, Akdere M, Cureoglu S, Cebe M, Yazicioglu M, Topcu I, Meric F. 2004. Occupational safety: effects of workplace radiofrequencies on hearing function. Arch Med Res 35:517–521. [DOI] [PubMed] [Google Scholar]
- Pall M‐L. 2016. Microwave frequency electromagnetic fields (EMFs) produce widespread neuropsychiatric effects including depression. J Chem Neuroanat 75:43–51. [DOI] [PubMed] [Google Scholar]
- Salford L‐G, Brun A‐E, Eberhardt J‐L, Malmgren L, Persson B‐R. 2003. Nerve cell damage in mammalian brain after exposure to microwaves from GSM mobile phones. Environ Health Perspect 111:881–883. [DOI] [PMC free article] [PubMed] [Google Scholar]
- Schonborn F, Pokovic K, Wobus A‐M, Kuster N. 2000. Design, opyimization, realization, and analysis of an vitro system for the exposure of embryonic stem cells at 1.71 GHz. Bioelectromagnetics 21:372–384. [PubMed] [Google Scholar]
- Schuderer J, Samaras T, Oesch W, Spat D, Kuster N. 2004. High peak SAR exposuer unit with tight exposure and environmental control for in vitro experiments at 1800 MHz. IEEE Trans Microwave Theory Tech 52:2057–2066. [Google Scholar]
- Seckin E, Basar F‐S, Atmaca S, Kaymaz F, Suzer A, Akar A, Sunan E, Koyuncu M. 2014. The effect of radiofrequency radiation generated by a Global System for Mobile Communications source on cochlear development in a rat model. J Laryngol Otol 128:400–405. [DOI] [PubMed] [Google Scholar]
- Seidel C, Lautenschläger C, Dunst J, Müller A‐C. 2012. Factors influencing heterogeneity of radiation‐induced DNA‐damage measured by the alkaline comet assay. Radiat Oncol 7:61. [DOI] [PMC free article] [PubMed] [Google Scholar]
- Silva J‐P, Larsson N‐G. 2002. Manipulation of mitochondrial DNA gene expression in the mouse. Biochim Biophys Acta—Bioenerg 1555:106–110. [DOI] [PubMed] [Google Scholar]
- Takeuchi S, Ando M, Kakigi A. 2000. Mechanism generating endocochlear potential: Role played by intermediate cells in stria vascularis. Biophys J 79:2572–2582. [DOI] [PMC free article] [PubMed] [Google Scholar]
- Vecchia P. 2007. Exposure of humans to electromagnetic fields. Standards and regulations. Ann Ist Super Sanita 43:260–267. [PubMed] [Google Scholar]
- Verschaeve L, Juutilainen J, Lagroye I, Miyakoshi J, Saunders R, De Seze R, Tenforde T, Van Rongen E, Veyret B, Xu Z. 2010. In vitro and in vivo genotoxicity of radiofrequency fields. Mutat Res 705:252–268. [DOI] [PubMed] [Google Scholar]
- Yao K, Wu W, Yu Y, Zeng Q, He J, Lu D, Wang K. 2008. Effect of superposed electromagnetic noise on DNA damage of lens epithelial cells induced by microwave radiation. Invest Ophthalmol Vis Sci 49:2009–2015. [DOI] [PubMed] [Google Scholar]
- Yorgancilar E, Dasdag S, Akdag M‐Z, Gun R, Meric F. 2012. Long‐term effect of 900 MHz radiofrequency radiation exposure on cochlear functions. Biotechnol Biotech Equip 26:3397–3401. [Google Scholar]
- Zuo W‐Q, Hu Y‐J, Yang Y, Zhao X‐Y, Zhang Y‐Y, Kong W, Kong W‐J. 2015. Sensitivity of spiral ganglion neurons to damage caused by mobile phone electromagnetic radiation will increase in lipopolysaccharide‐induced inflammation in vitro model. J Neuroinflammation 12:105. [DOI] [PMC free article] [PubMed] [Google Scholar]


