

Summary
The actin cytoskeleton is required for cell expansion and implicated in cellular responses to the phytohormone auxin. However, the mechanisms that coordinate auxin signaling, cytoskeletal remodeling and cell expansion are poorly understood. Previous studies examined long‐term actin cytoskeleton responses to auxin, but plants respond to auxin within minutes. Before this work, an extracellular auxin receptor – rather than the auxin transporter AUXIN RESISTANT 1 (AUX1) – was considered to precede auxin‐induced cytoskeleton reorganization.
In order to correlate actin array organization and dynamics with degree of cell expansion, quantitative imaging tools established baseline actin organization and illuminated individual filament behaviors in root epidermal cells under control conditions and after indole‐3‐acetic acid (IAA) application. We evaluated aux1 mutant actin organization responses to IAA and the membrane‐permeable auxin 1‐naphthylacetic acid (NAA).
Cell length predicted actin organization and dynamics in control roots; short‐term IAA treatments stimulated denser and more parallel, longitudinal arrays by inducing filament unbundling within minutes. Although AUX1 is necessary for full actin rearrangements in response to auxin, cytoplasmic auxin (i.e. NAA) stimulated a lesser response.
Actin filaments became more ‘organized’ after IAA stopped elongation, refuting the hypothesis that ‘more organized’ actin arrays universally correlate with rapid growth. Short‐term actin cytoskeleton response to auxin requires AUX1 and/or cytoplasmic auxin.
Keywords: actin, Arabidopsis, AUX1, auxin, cell expansion, cytoskeleton, signaling
Introduction
Despite human dependence on plants, we do not fully understand the molecular mechanisms controlling plant growth. Many plant cells expand isotropically but, during development, establish polar growth where deposition of cell wall materials is restricted to specific cell axes, producing mature cells with myriad shapes and sizes. Turgor pressure drives expansion within the confines of cell wall flexibility: plant cell wall flexibility is not uniform; looser regions are more susceptible to turgor pressure (Szymanski & Cosgrove, 2009; Guerriero et al., 2014). Vesicles are incorporated into certain areas of the plasma membrane (PM) and deposit new cell wall material, increasing cell surface area and conducting cell growth into specific shapes. Vesicle delivery and exocytosis depend on the actin cytoskeleton, a dynamic array of filamentous structures in the cytoplasm of cells (Ketelaar et al., 2003; Hussey et al., 2006; Leucci et al., 2007; Zhang et al., 2019). Although the actin cytoskeleton is required for plant cell expansion (Baluška et al., 2001; Gilliland et al., 2003; Mathur, 2004; Hussey et al., 2006; Rahman et al., 2007; Kandasamy et al., 2009; Yang et al., 2011; Guerriero et al., 2014), actin's function in this process is not well understood. Actin is accepted to provide tracks for vesicle delivery (Mathur, 2004; Hussey et al., 2006), but connections also have been made between certain actin arrays and plant growth (Nick et al., 2009; Higaki et al., 2010a; Smertenko et al., 2010; Dyachok et al., 2011; Yang et al., 2011, Yanagisawa et al., 2015), resulting in various hypotheses about actin's role and/or the significance of specific actin arrays, each with supporting evidence, much of it circumstantial (Li et al., 2015a; Szymanski & Staiger, 2017).
Actin arrays form an apparently ‘organized’ orientation, with actin bundles roughly parallel to the cell's longitudinal axis in rapidly growing root epidermal cells in the light (Dyachok et al., 2011). In the dark, where cell expansion slows substantially, actin exhibits apparent ‘disorganization’: filaments are less aligned to the longitudinal axis of root cells (Dyachok et al., 2011). However, the literature does not present data substantiating cause‐and‐effect. Whether a longitudinal array is necessary for, coincides with, promotes, or (conversely) is the product of, cell expansion – or whether the ‘disorganized’ array inhibits or coincides with a cessation of expansion – is not understood and remains largely unexamined.
In addition to longitudinal orientation, other actin arrays have been correlated with cell length or expansion. However, there is no consensus on whether longitudinal bundles inhibit (Gilliland et al., 2003; Holweg et al., 2004; Rahman et al., 2007) or stimulate (Kandasamy et al., 2009; Yang et al., 2011; G. Li et al., 2014) axial cell expansion. Many previous studies linking specific actin organizations with growth or growth inhibition are based on actin or actin‐binding protein mutant phenotypes (Gilliland et al., 2003, Kandasamy et al., 2009, Yang et al., 2011; G. Li et al., 2014). Others are based on actin responses to drug or long‐term hormone treatments (Holweg et al., 2004; Rahman et al., 2007). Therefore, some actin–cell growth models may be generalized from potentially more discrete responses: cytoskeletal response to an external stimulus that affects growth via downstream mechanisms; or filament array changes due to a missing or deficient actin‐binding protein whose role could be only one of many aspects of growth.
What tasks, exactly, actin undertakes during cell expansion and how these tasks drive or participate in expansion are unclear. Bundles potentially inhibit growth by inhibiting transport of growth hormone‐related proteins (Nick, 2010). Alternatively, long actin bundles presumably stimulate growth because they provide tracks for vesicle delivery (Szymanski & Cosgrove, 2009; Thomas, 2012). Actin bundles could contribute to vacuolar osmotic pressure regulation by altering turgor pressure (Higaki et al., 2010a,b, 2011), the main driver of plant cell expansion (Szymanski & Cosgrove, 2009). A recent paper shows that auxin, a known plant growth modulator with rapid, opposing effects on root or shoot growth (inhibition and stimulation, respectively), constricts vacuolar shape in long‐term treatments (6+ h) on root cells by inducing altered actin arrays (Scheuring et al., 2016). Interactions between auxin signaling pathways and actin are abundant in the literature (reviewed in Zhu & Geisler, 2015), but the mechanics of how auxin affects the cytoskeleton within minutes, and how these interactions alter growth, are largely unknown.
The molecular players that connect the actin cytoskeleton to auxin perception during short‐term responses are unidentified. Auxin perception by AUXIN BINDING PROTEIN 1 (ABP1) was suspected to precede cytoskeletal changes in roots (Chen et al., 2012; Lin et al., 2012) and epidermal pavement cells (Xu et al., 2010; Nagawa et al., 2012; Xu et al., 2014). However, recent works demonstrate that, like wild‐type (WT) plants, a CRISPR abp1‐c1 mutant exhibited root growth inhibition by both the natural auxin indole‐3‐acetic acid (IAA) and the highly membrane‐permeable, lipophilic synthetic auxin, 1‐naphthylacetic acid (NAA; Delbarre et al., 1996; Carrier et al., 2008), indicating that ABP1 likely plays no role in auxin signaling (Dai et al., 2015; Gao et al., 2015). AUXIN RESISTANT 1 (AUX1) is a PM‐bound auxin/H+ symporter in the amino acid/auxin permease (AAAP) family that is ubiquitous among Eukaryotes. AUX1 appears in all plants and some algae, indicating that it evolved before land plants (reviewed in Swarup & Péret, 2012). Unlike WT, aux1 plants grow in the presence of IAA but undergo growth inhibition by NAA (Marchant et al., 1999); AUX1 binds both IAA and NAA with high affinity (Yang et al., 2006; Carrier et al., 2008) and is responsible for 80% of IAA uptake by root hairs (Dindas et al., 2018). The loss of auxin uptake by aux1 roots enables growth in the presence of moderate IAA doses, but NAA inhibits aux1 growth within seconds, in a similar way to the WT (Fendrych et al., 2018). AUX1 contributes to short‐term, auxin‐induced increases in cytosolic H+ and, with the intracellular auxin receptor complex SCFTIR1/AFB (which perceives auxin molecules, Kepinski & Leyser, 2005), increases in cytosolic Ca2+ (Dindas et al., 2018), ultimately inducing transcriptional reprogramming (Ulmasov et al., 1999). For years, AUX1's contribution to auxin uptake was deemed insignificant: IAAH diffuses from the acidic apoplast through the PM, so intracellular auxin concentrations and polar auxin transport must be controlled solely by export (Zhu & Geisler, 2015). We wanted to revisit AUX1’s role in short‐term auxin signaling and determine whether cytoplasmic auxin plays a role in signaling to the actin cytoskeleton.
In order to correlate actin arrays with cell expansion, we used quantitative tools to establish a baseline of actin organization and individual filament behaviors in root epidermal cells under control circumstances. By plotting measurements of each cell's actin array against its length, we found that cell length was highly predictive of actin organization and dynamics. We then used acute IAA treatments to determine the actin response in presumed non‐ or very slow‐growing cells and documented the first short‐term actin responses to exogenous IAA. Upon analyzing the actin arrays in two aux1 alleles (the T‐DNA insertion mutant aux1‐100 and the null point mutant aux1‐22), we found that actin failed to reorganize in response to IAA and reorganization was only partially restored by NAA. Our data substantiate that AUX1 and cytosolic auxin play significant roles upstream of actin reorganization in auxin signaling.
Materials and Methods
Plant material and growth conditions
All experiments were conducted on roots from 6‐d‐old, light‐grown Arabidopsis thaliana seedlings expressing GFP‐fABD2 (green fluorescent protein fused to the second actin‐binding domain of Arabidopsis FIMBRIN1): Col‐0, Wassilewskija (WS), aux1‐100 and aux1‐22. Seeds were surface‐sterilized and stratified at 4°C for 2 d. Unless specified otherwise, experiments were conducted using Col‐0; WS was used as the wild‐type (WT) for aux1‐100 because the aux1‐100 mutation is in the WS background. All plants were grown on ½ Murashige & Skoog (½MS) medium solidified with 0.6% (w/v) agar and no sucrose, as described previously (Sheahan et al., 2004; Dyachok et al., 2011; Henty et al., 2011; Cai et al., 2014; J. Li et al., 2014). For the light sheet fluorescence microscopy (LSFM), plants were grown in capillary tubes in ½MS medium solidified with 0.6% (w/v) agar and no sucrose. Detailed methods for LSFM are in Supporting Information Methods S1. All seedlings were grown vertically at 21°C with a light intensity of 117 μM photons m−2 s−1, under long‐day conditions (16 h : 8 h, light : dark).
The T‐DNA insertion mutant aux1‐100 (CS2360) and ethyl methanesulphonate (EMS) point mutant aux1‐22 (CS9585) were obtained from the ABRC stock center and, with WS‐0 and Col‐0, transformed with GFP‐fABD2 (Sheahan et al., 2004) using the floral dip method (Zhang et al., 2006). T1 plants were screened on plates with hygromycin. PCR genotyping confirmed aux1‐100 plant homozygosity; primers (Krysan et al., 1996) appear in Methods S2. aux1‐22 mutants were identified by their agravitropic phenotype. T2 plants were used for experiments.
VAEM imaging, measuring cell lengths and quantitative analysis of cortical actin array organization
In order to measure cell sizes and obtain a corresponding measurement of each actin organization parameter, we collected overlapping variable angle epifluorescence microscopy (VAEM) images (single optical sections) of cortical cytoplasm from the outer periclinal face of root epidermal cells expressing GFP‐fABD2. Images were collected from the root elongation zone: root apex (i.e. root cap) to the first obviously visible root hair initiations (end of the elongation zone/beginning of the differentiation zone).
VAEM used a total internal reflection fluorescence (TIRF) illuminator mounted on an IX‐71 microscope equipped with a 60 × 1.45–numerical aperture PlanApo TIRF objective (Olympus Corp., Waltham, MA, USA). Illumination was from a solid‐state 50 mW laser (Intelligent Imaging Innovations, Denver, CO, USA) at 3–5% power and kept constant for a single experiment/replicate. An electron multiplying charge‐coupled device camera (ORCA‐EM C9100‐12; Hamamatsu Photonics, Hamamatsu, Japan) captured 488‐nm laser emission. The microscope platform was operated and images collected with slidebook software (v.6; Intelligent Imaging Innovations). Fixed exposure and gain were selected so individual actin filaments were visible but higher order filament structures were not intensity‐saturated. Detailed methods for actin organization analysis are in Methods S3.
Auxin treatments
IAA (I2886) and NAA (N0640) were obtained from Sigma‐Aldrich and diluted to a 10 mM stock concentration in ultrapure ethanol (BP2818500; FisherScientific, Waltham, MA, USA). For experiments, each stock was diluted to appropriate concentrations into ½MS liquid medium without sucrose; for control solution, ultrapure ethanol was added to ½MS liquid medium without sucrose to match the highest auxin concentration used. Because light degrades auxin (Nissen & Sutter, 1990), blinded solutions were kept wrapped in foil throughout an experiment. To ensure even treatment during 20–30 min treatments, whole seedlings were cut from agar plates and treated by soaking their agar block in a 24‐well plate. For 100‐s timelapse movies, plants were treated on slides by being mounted in either control or IAA solution. Imaging began almost immediately; timelapse movies from both Regions 2 and 3 were collected within 7 min. For 20–30 min treatments, imaging concluded within 30 min. Because darkness can stimulate degradation of cytoskeletal organizing proteins (Dyachok et al., 2011) and a reorientation of actin filaments in hypocotyls (Breuer et al., 2014), plants were left under grow lights (40 μM photons m−2 s−1) while soaking during 20‐min treatments, and slides were prepared in the light. All IAA and NAA experiments were performed and analyzed double blind.
Individual actin filament dynamics
Individual actin filaments were captured in Col‐0 root epidermal cells with 100‐s timelapse (one frame per s) VAEM using a 150 × 1.45 NA UApoN TIRF objective (Olympus). Timelapse movies and regions of interest (ROI) were analyzed in fiji is just imagej (FIJI, Madison, WI, USA, https://fiji.sc). To best display filaments and their dynamics, brightness and contrast were enhanced in the final montages of Fig. 2(b,c). Occasionally, minimal adjustments to brightness and contrast were made during analysis to more definitively follow some filaments or events. Filament severing frequency, maximum filament length, filament lifetime and elongation rates were measured as described previously (Staiger et al., 2009; Henty et al., 2011; Cai et al., 2014; Henty‐Ridilla et al., 2014). To measure bundling, unbundling and end‐to‐end annealing frequencies, we cropped c. 15 μm × 15 μm ROIs at random locations throughout a cell. For measuring individual filament responses to IAA, we used c. 7 μm × 7 μm randomly selected ROIs. To account for differences in filament density in short and long cells, bundling, unbundling and annealing frequencies were normalized against filament numbers in each ROI. For detailed methods, see Methods S4.
Figure 2.

Timelapse imaging of cortical actin filaments in root epidermal cells shows differences in the dynamic behavior between short and long cells. (a, c) The cortical actin cytoskeleton in 6‐d‐old light‐grown Arabidopsis thaliana root epidermal cells expressing green fluorescent protein fused to the second actin‐binding domain of Arabidopsis FIMBRIN1 (GFP‐fABD2) was imaged with timelapse variable angle epifluorescence microscopy (VAEM). Representative images of individual filament dynamics in short cells (≤ 85 μm long, Region 2) and long cells (> 94 μm long, Region 3). On average, filaments in short cells (a; filament highlighted in purple) elongated over 25% more slowly and grew to be nearly 30% shorter than filaments in long cells (c; filament highlighted in blue). Severing frequencies and filament lifetimes did not vary between regions; see Table 1. Bars in (a) and (c), 5 μm. (b, d) Regions of interest (ROI; 227.7 μm2) were selected from the same movies as (a, c). Annealing occurs c. 10‐fold more frequently in short cells (b; filaments highlighted in purple) compared with long cells (d; filament highlighted in blue). Note that four annealing events (white arrowheads) occurred within 6 s in (b) compared with only one event in (d). Dots indicate fragments involved in annealing events. Quantification of annealing frequencies as well as bundling and unbundling frequencies are shown in Table 1. Although actin filament arrays in long cells were substantially more bundled compared with short cells (see Fig. 1), there were no differences in bundling or unbundling frequencies when event frequencies were calculated on a per‐minute, per‐filament basis. Bars in (b, d), 2 μm. 100‐s timelapse movies were collected from short and long cells in the same 30 roots. Note: brightness and contrast were enhanced in the montages of (b, c) to better show the filament and its changes.
Accession numbers
Sequence data relevant to this article appear in the Arabidopsis Information Resource database (https://www.arabidopsis.org/) under: AUX1 (At2G38120).
Results
Actin organization correlates with cell length
Actin organization in living epidermal cells of the root cap and elongation zone, examined with VAEM, displayed a consistent and previously observed pattern of organization (Baluška et al., 1997; Baluška & Mancuso, 2013; Figs 1a, S1a). We wondered whether there were quantitative differences in actin organization that correlated with cell size and developmental stage. After plant cells are generated in the root meristem, they spend c. 4 d progressing through the meristematic region and the transition zone before entering the rapid elongation zone, where they spend only hours (Beemster & Baskin, 1998, 2000; van der Weele et al., 2003). The consistent progression of aging, growing cells allows quantification and comparison of actin arrays in both the slower‐growing late meristematic/transition zone and the rapid elongation zone. Whether actin bundles inhibit (Gilliland et al., 2003; Holweg et al., 2004; Rahman et al., 2007) or promote (Kandasamy et al., 2009; Yang et al., 2011; G. Li et al., 2014) cell expansion remains controversial. We sought insight to the role of actin bundling in root epidermal cell expansion, because the epidermis drives tissue expansion (Savaldi‐Goldstein et al., 2007 (shoots); Hacham et al., 2011).
Figure 1.
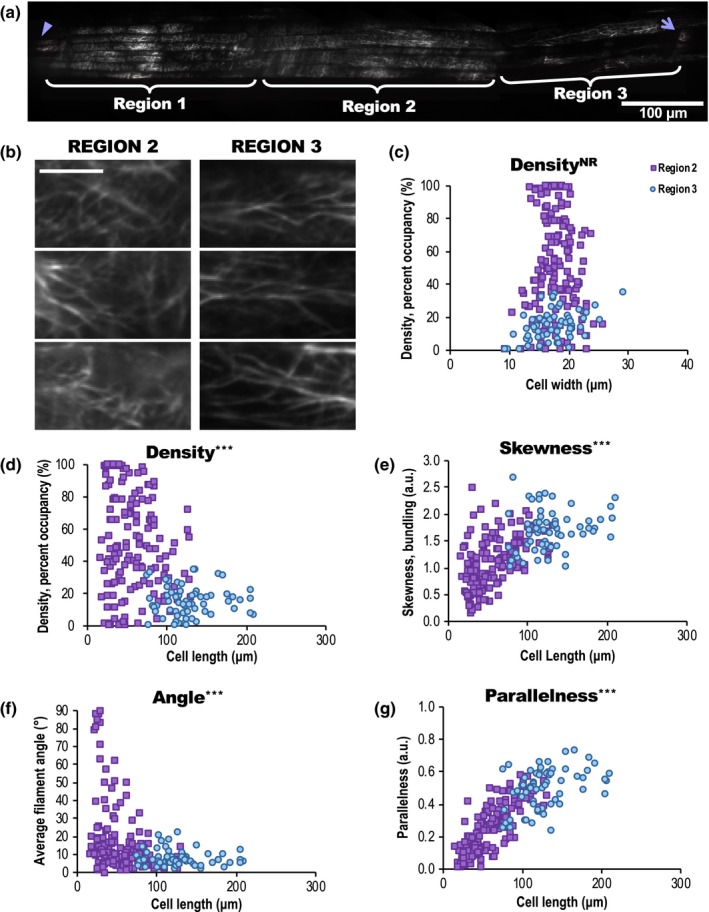
Actin organization is predictive of epidermal cell length in the root elongation zone. (a) Mosaic of root cap and elongation zone in an Arabidopsis thaliana seedling expressing green fluorescent protein fused to the second actin‐binding domain of Arabidopsis FIMBRIN1 (GFP‐fABD2) imaged with variable angle epifluorescence microscopy (VAEM). Arrowhead, root apex; arrow, first root hair initiation. mosaicj was used to compile 13 original VAEM images. Region 1 encompasses the root cap (root apex to c. 300 μm from the apex); Region 2 begins c. 300 μm from the apex and ends c. 625 μm from the apex; Region 3 begins c. 625 μm from the apex and ends at the first clearly visible root hair initiations, c. 860 μm from the apex. Bar, 100 μm. (b) Representative images of actin organization in two root regions. Bar, 10 μm. (c–g) Quantification of actin architecture or orientation in the root elongation zone, metrics plotted with respect to corresponding epidermal cell length (d–g), or cell width (c). Filament architecture and orientation were not predictable based on cell width but were highly correlated with cell length. Supporting Information Fig. S2 shows results for skewness, angle and parallelness vs cell width, which also showed no relationship, and Fig. S1 shows comparisons of mean measurements of actin from Region 2 (purple squares) and Region 3 (blue circles). Mean cell length ± 1 SD: Region 2 = 57 ± 28 μm, Region 3 = 128 ± 34 μm. n = 60–150 cells per region from 20 roots. a.u., arbitrary units. NR, no predictive relationship; ***, P ≤ 0.0001, Bivariate fit/ANOVA for all data points for each parameter. Results are from one experiment.
In order to quantitate whether actin array organization varies with cell size, we collected overlapping VAEM images of GFP‐fABD2‐labeled actin filaments from the root apex through the elongation zone in Col‐0 plants. The demarcation between the root cap (here called ‘Region 1’) and what appeared to be the visible transition zone (‘Region 2’) was drastic. Isotropic cells that delineate the late meristematic/early transition zone (i.e. Region 2) clearly emerge from under the rectangular cells of the root cap (i.e. Region 1). We preliminarily delineated Region 3 by an observable decrease in actin filament abundance (admittedly, a subjective criterion, but characteristics are best analyzed en masse). Region 1 encompassed the root apex through c. 300 μm from the apex; Region 2 began c. 300 μm from the apex through c. 625 μm from the apex; Region 3 began c. 625 μm from the apex through the first clearly visible root hair initiations, c. 860 μm from the apex. These regions are very close to root measurements for the root cap, transition zone and rapid elongation zone reported in Verbelen et al. (2006). Representative images showed conspicuous array differences between regions (Figs 1b, S1a). Aspects of actin organization, including percentage occupancy or density (100% density = an image where all pixels contain fluorescence), extent of actin filament bundling (measured as ‘skewness’ of an image's pixel intensity distribution), average filament angle relative to a cell's longitudinal axis (angle), and parallelness of filaments to each other, were quantified as described previously (Higaki et al., 2010b; Ueda et al., 2010; Henty et al., 2011; Li et al., 2012; Cai et al, 2014; Cao et al., 2016). These analyses showed (Fig. S1b–e) that the cortical actin array in Region 2 was significantly denser and less bundled than in Region 3 (i.e. Region 2 exhibited a more ‘normal’ distribution of pixel intensities, whereas the distribution of pixel intensities from images of Region 3 was skewed towards more higher intensity pixels). Region 1 was similar in density to Region 2, but more bundled. Filaments and bundles in Region 3 cells were substantially more longitudinal than those in regions 1 or 2. Because root cap cells neither belong to the same epidermal cell lineage nor follow the same cell expansion gradient as regions 2 and 3, we eliminated Region 1 from further analysis.
Because of the substantial differences in actin organization among epidermal cells within the elongation zone, we hypothesized that if certain actin arrays correlate with expanding cells, cell size should predict actin organization and vice versa. Although there was no predictive relationship between cell widths and actin filament density, skewness/bundling, angle or parallelness (Figs 1c, S2), cell lengths were highly predictive of each actin metric (Figs 1d–g, S3). Short cells (Region 2) exhibited higher actin density (Fig. 1d), lower bundling (Fig. 1e) and what might be perceived as ‘disorganized’ actin, with higher average filament angles (Fig. 1f) and lower parallelness (Fig. 1g) compared with long cells (Region 3). These highly predictive relationships between cell length and each aspect of actin organization also were apparent in the WS ecotype expressing GPF‐fABD2, and in aux1‐100 (WS background; Fig. S7, see later), whose average root epidermal cell lengths were significantly longer than WT. Although we could not consistently measure cell growth rates (based on literature such as Beemster & Baskin, 1998; van der Weele et al., 2003) and capture simultaneous actin dynamics, and did not determine whether bundles promote or precede expansion, more bundling clearly occurred as cell lengths increased (Figs S3, S7, S9), demonstrating that bundles did not inhibit cell growth under control conditions.
Although adherence to a fairly linear relationship does not reveal cause‐and‐effect, actin filament parallelness was most directly correlated with cell length (R 2 = 0.68; Figs 1g, S3d). To determine whether any actin parameter explains the most variance from the mean for each cell, we performed principal component analysis (PCA) on each dataset, finding that interactions between cell length, filament parallelness and to a lesser extent, skewness, explained most of our observations for both WT ecotypes (Col‐0 and WS) and aux1‐100 (Tables S1–S6).
Aside from correlations between actin organization and cell size, we needed to more objectively categorize WT cells into ‘Region 2’ or ‘Region 3’. By plotting each cell's specific actin metrics against its length or width, we defined maximum cell sizes for each region. We categorized cells up to 85 µm (i.e. mean cell length (57 µm) plus one SD, 28 µm) in Region 2; we categorized cells longer than 94 µm (i.e. the mean cell length (128 µm) minus 1 SD, 34 µm) as being in Region 3. Cells whose lengths fell between 85 and 94 μm were counted in both Regions 2 and 3. These cutoffs, based on our VAEM images, assigned ‘Region’ in further experiments on the Col‐0 GFP‐fABD2 lines (see the Materials and Methods section; Methods S3; Figs 3, S5–S6).
Figure 3.

Short‐term indole‐3‐acetic acid (IAA) treatments induce changes in actin filament organization. (a) Representative variable angle epifluorescence microscopy (VAEM) images of green fluorescent protein fused to the second actin‐binding domain of Arabidopsis FIMBRIN1 (GFP‐fABD2)‐labeled actin in Arabidopsis thaliana epidermal cells from Region 2 (≤ 85 μm long) and Region 3 (≥ 94 μm long), treated for 20–30 min with indicated doses of IAA or control. Bars, 10 μm. (b–e) Quantification of actin architecture and orientation in root epidermal cells: IAA triggered an increase in actin filament density (b) and decrease in skewness (c). Region 2 measurements are shown in purple; Region 3 in blue. (d,e) After IAA treatments, actin arrays in both regions were more ‘organized,’ with lower average filament angle (d) relative to the longitudinal axis of the cell and filaments generally more parallel to each other (e). Changes in actin orientation (d) and (e) were dose‐dependent, see Supporting Information Fig. S5. Cells whose lengths fell between 85 and 94 μm were counted in both regions. n = 8–12 cells per region per root from ≥ 10 roots per treatment. Error bars represent ± 1 SE; a.u., arbitrary units. ND, no statistical differences; *, P ≤ 0.05; **, P ≤ 0.01; ***, P ≤ 0.0001, one‐way ANOVA, compared with Dunnett's Method, comparing doses to control in each Region, in JMP. Results are from one representative experiment of three similar experiments with similar results. All IAA experiments were performed and analyzed double blind.
We used LSFM during an on‐campus demo to image elongation of an individual root every 15 min for 10 h (Video S1), and from that dataset, measured individual cell elongation rates from 27 cells representing both regions 2 and 3 (Fig. S11, see later). We found that cells in the root elongation zone exhibited triphasic growth. Cells < 30 μm expanded slowly, at c. 0.015 ± 0.004 μm min−1 (mean ± SE). The elongation rate of cells between 30 and 100 μm long was nearly 10× faster (c. 0.145 ± 0.007 μm min−1). Growth in cells > 100 μm appeared to slow or cease (Fig. S11, see later). Drastically different plant growth conditions (overnight inside a capillary tube for LSFM vs during the day on the agar surface for VAEM), sample size (Video S1; Fig. S11 (see later) feature a single root), and our inability to definitively discern short epidermal vs cortical cells in the LSFM movie could account for differences in region boundaries between our LSFM and VAEM data. Root hairs emerged (arrowheads, Fig. S11, see later) as cell expansion slowed, but some trichoblast elongation (cells 16, 19, and 26) continued after emergence, indicating that developmental ‘regions’ and ‘zones’ might overlap. LSFM resolution was insufficient to measure precise changes in actin organization concurrent to cell elongation, but Video S1 shows that actin arrays appear to become more bundled and longitudinal as cells elongate. Taken with our previous results, these data demonstrated that cell elongation rates accelerated along the root elongation zone where actin filament bundling and parallelness also increased (Figs 1, S3).
Short cells are characterized by high filament end‐to‐end annealing frequencies
Cortical actin arrays constantly remodel depending on a cell's needs (Staiger et al., 2009; Smertenko et al., 2010; Henty et al., 2011; Henty‐Ridilla et al., 2013; Henty‐Ridilla et al., 2014; Cao et al., 2016). For example, arrays in isotropically growing cotyledon pavement cells exhibit ‘more random’ and ‘more dynamic’ arrays than the anisotropically growing cells of the root elongation zone (Smertenko et al., 2010). We hypothesized that the Region 2 actin network would be more dynamic than Region 3's. We collected 100‐s timelapse movies (at one frame per s) from short and long cells in the same roots and calculated the pairwise correlation coefficient among all possible temporal intervals (Vidali et al., 2010), finding that actin array dynamicity in Region 2 was significantly reduced compared to Region 3 (Fig. S4), opposite to our hypothesis. Region 2 arrays were dense, so we considered that a gross comparison of pixel intensities and occupancies among intervals of timelapse movies might not account for all dynamic behaviors.
In order to determine what specific properties build filament arrays in cells, we quantified individual actin filament behaviors (Li et al., 2015b). We expected increased turnover in short cells and more frequent bundling in long cells. On average, filaments in short and long cells behaved in a similar way, except that long cells exhibited significantly longer, faster‐growing filaments (Fig. 2; Table 1). Actin filaments can grow by polymerization (i.e. incorporation of ATP‐loaded actin monomers) or through end‐to‐end annealing of filament segments, which is a purportedly faster, lower energy process to build filaments (Smertenko et al., 2010; Li et al., 2012). Upon measuring bundling, unbundling and annealing frequencies (see Methods S4), we observed no differences in bundling or unbundling frequencies, but shorter cells exhibited a multifold increase in annealing (Fig. 2; Table 1). Our results demonstrate that filament end‐to‐end annealing plays a role in the slow, isotropic expansion that occurs in short cells, but is downregulated in faster‐growing cells toward the end of the elongation zone.
Table 1.
Individual actin filament behaviors in Arabidopsis thaliana root regions 2 and 3.
| Parameter | Region 2 | Region 3 |
|---|---|---|
| Maximum filament length (μm) | 5.7 ± 0.3 | 8.1 ± 0.4*** |
| Filament lifetime (s) | 23.5 ± 1.5 | 23.5 ± 1.2ND |
| Elongation rate (μm s−1) | 0.96 ± 0.05 | 1.32 ± 0.08*** |
| Severing frequency (breaks per μm s−1) | 0.04 ± 0.004 | 0.04 ± 0.0032ND |
| Event frequency per min per filament | ||
| Bundlinga | 0.111 ± 0.009 | 0.103 ± 0.0092ND |
| Unbundling | 0.030 ± 0.004 | 0.032 ± 0.0042ND |
| Annealing | 0.100 ± 0.009 | 0.012 ± 0.003*** |
Bold highlights parameters with statistically significant differences.
Values are means ± 1 SE.
Average number of actin filaments and bundles per 227.7 μm2 region of interest (ROI): Region 2, 98.7 ± 4.1; Region 3, 64.6 ± 2.4.
Per region, n ≥ 50 filaments from > 25 cells from ≥ 15 roots.
Bundling, unbundling, and annealing events: per root region, n = ROI (227.7 μm2) from a total of 30–37 cells from 30 roots. ND, no statistical differences; ***, P ≤ 0.001 (Student's t‐test).
Bundling includes both zippering (c. 90% of observed bundling events) and ‘other’ (remaining c. 10% of observed bundling events); see the Materials and Methods section for more information.
Actin organization responds to short‐term IAA treatments
In order to decipher which actin parameter(s) coincided with cell expansion, and find stronger indicators of causality, we treated roots with the natural auxin IAA, which inhibits root growth within minutes (Hejnowicz & Erickson, 1968; Fendrych et al., 2018). Auxin affects actin organization and dynamics, and inhibits root growth (reviewed in Zhu & Geisler, 2015; Fendrych et al., 2018), known to depend on an intact cytoskeleton (reviewed in Hussey et al., 2006, and Li et al., 2015a). Yet, actin response following short‐term auxin treatments – that is, a direct link – remains undetermined. If decreased actin density and increased bundling (i.e. ‘organized’ actin filaments) are growth hallmarks, and if auxin modulates the actin cytoskeleton, then growth inhibitory IAA should induce the opposite actin phenotype: increased density and decreased bundling. Further, if lower average filament angle and higher parallelness correlate with rapidly growing cells (described in Dyachok et al., 2011), IAA should increase filament angle and decrease parallelness.
As expected, 20–30 min IAA treatments significantly increased filament density and decreased bundling (Fig. 3a–c), but simultaneously induced higher levels of actin organization in the presumably nongrowing cells – we observed a dose‐dependent increase in longitudinal, parallel filaments (Figs 3a,d–e, S5). A timeseries experiment established that cells maintained the IAA‐induced increase in organization for ≥ 60 min from initial treatment (Fig. S6; Table S7). Increased filament density appeared before strong changes in angle and parallelness; the 30 s timeframe of IAA‐induced root growth inhibition reported in Fendrych et al. (2018) is much faster than gross actin reorganization was discernable, at least by current methods. Still, these are the first data that quantitatively document actin's short‐term response to moderate doses of IAA, showing that actin becomes more ‘organized’ in response to a treatment that inhibits growth.
IAA stimulates actin filament unbundling
Links between auxin and actin clearly exist (reviewed in Zhu & Geisler, 2015) but the specific components of these pathways – and actin's role in them – are unresolved, so we evaluated actin's role in IAA response by measuring whether individual filament behaviors change in the minutes following IAA treatment.
Because 20–30 min IAA treatments triggered increased actin density and longitudinal, parallel filaments, we hypothesized that individual filaments would quickly respond by elongating faster and increasing severing, unbundling and/or end‐to‐end annealing (a result of decreased end‐capping; Li et al., 2012). We quantified actin dynamics in Col‐0 epidermal cells in regions 2 and 3 within 7 min of 10 nM IAA treatment. We observed no changes in most individual filament behaviors in either region within this 7‐min timeframe (Table 2), although the differences in filament elongation rates and maximum filament length we observed previously between regions (Table 1) were reproduced. However, we observed an IAA‐induced doubling of unbundling events in both short (Region 2) and long cells (Region 3; Fig. 4; Table 2). In long cells, IAA induced a nearly five‐fold increase in annealing (Fig. 4d; Table 2). Actin participates in short‐term responses to IAA by unbundling filaments and altering annealing frequencies within 7 min. These changes likely contribute to the gross increase in filament density observed at 20–30 min (Fig. 3).
Table 2.
Actin filament dynamics in Arabidopsis thaliana roots after treatment with indole‐3‐acetic acid (IAA).
| Item | Region 2 | Region 3 | ||
|---|---|---|---|---|
| Parameter/treatment | Control | IAA | Control | IAA |
| Maximum filament length (μm) | 5.2 ± 0.2 | 4.6 ± 0.2ND | 9.8 ± 0.6 | 9.7 ± 0.4ND |
| Filament lifetime (s) | 27.4 ± 1.9 | 24.9 ± 1.2ND | 28.8 ± 2.2 | 33.9 ± 2.1ND |
| Elongation rate (μm s−1) | 0.97 ± 0.14 | 0.88 ± 0.05ND | 1.63 ± 0.06 | 1.62 ± 0.07ND |
| Severing frequency (breaks per μm s−1) | 0.05 ± 0.003 | 0.06 ± 0.003ND | 0.03 ± 0.002 | 0.03 ± 0.002ND |
| Event frequency per min per filament | ||||
| Bundlinga | 0.216 ± 0.023 | 0.170 ± 0.015ND | 0.239 ± 0.023 | 0.187 ± 0.015ND |
| Unbundling | 0.092 ± 0.010 | 0.218 ± 0.017*** | 0.104 ± 0.012 | 0.208 ± 0.025** |
| Annealing | 0.172 ± 0.009 | 0.133 ± 0.013* | 0.034 ± 0.006 | 0.147 ± 0.020*** |
Bold highlights parameters with statistically significant differences.
Values are means ± 1 SE.
Average number of actin filaments and bundles per 57.8 μm2 region of interest (ROI): Region 2, 48.6 ± 2.1; Region 2 + IAA, 48.4 ± 1.6; Region 3, 26.9 ± 1.1; Region 3 + IAA, 28 ± 1.3; see the Materials and Methods section.
Six‐day‐old roots were treated with 10 nM IAA or control and epidermal cells were imaged for ≤ 7 min after treatment.
Per region per treatment, n ≥ 50 filaments from ≥ 20 cells from ≥ 12 roots. ND, no statistical differences, Student's t‐test compared with control for that region.
Bundling, unbundling, and annealing events: per root region per treatment, n = ROI (57.8 μm2) from a total of 21–23 cells from 18–22 roots. *, P ≤ 0.05; **, P ≤ 0.001; ***, P ≤ 0.0001; ND, no statistical differences, Student's t‐test vs same region control‐treated.
Bundling includes both zippering (c. 90% of observed bundling events) and ‘other’ (remaining c. 10% of observed bundling events); see the Materials and Methods section for more information. These percentages hold for both control‐ and IAA‐treated plants. All auxin experiments were performed and analyzed double blind.
Figure 4.
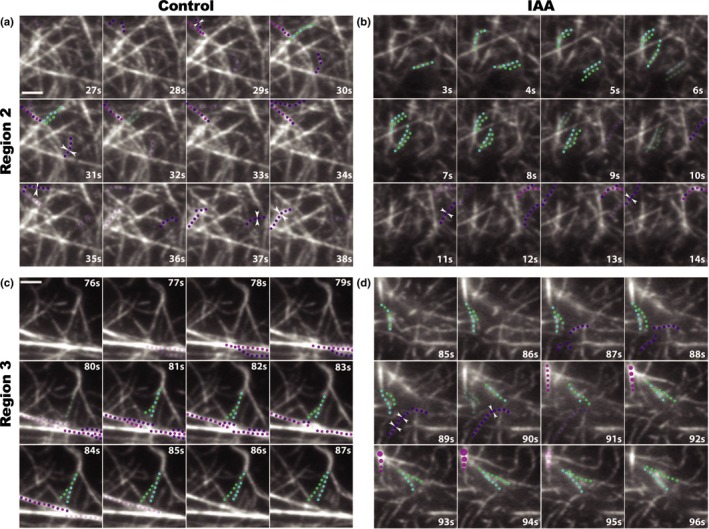
Short‐term auxin treatments cause actin filament unbundling. Representative images of individual filament bundling, unbundling, and annealing in Arabidopsis thaliana root Region 2 cells (a, b) and Region 3 cells (c, d); control (a, c) vs 10 nM indole‐3‐acetic acid (IAA) (b, d). Bars, 2 μm. (a, b) Timelapse series of variable angle epifluorescence microscopy (VAEM) images show that 10 nM IAA (b) increased actin filament unbundling in Region 2 within 7 min compared with control (a). Note that one unbundling event (filament unbundling shown as blue and green dots separating) occurred in (a), whereas three occurred in the same timespan in (b). There also was a small but statistically significant decrease in annealing events (white arrowheads) after IAA treatment. Other aspects of individual filament behaviors did not significantly change after treatment; for complete quantification of all measured individual filament dynamics, see Table 2. (c, d) Treatment with 10 nM IAA (d) increased actin filament unbundling and filament end annealing in Region 3 within 7 min compared with control (c). As in Region 2, IAA stimulated unbundling of actin filaments: two unbundling events are shown in (d) compared with only one event in (c). IAA also stimulated an increase in annealing in Region 3, where three annealing events are shown by white arrowheads (d). Bundling events are shown by either purple and magenta dots coming together (zippering of two independent filaments) or a series of magenta dots increasing in size (fluorescence intensity increase with no visible filament zippering). 100‐s timelapse movies were collected from short and long cells in the same 28 6‐d‐old, light‐grown roots. All auxin experiments were performed and analyzed double blind.
Actin arrays in aux1 mutants are insensitive to IAA but partially respond to NAA
The auxin importer AUX1 was identified in an EMS mutant screen for resistance to auxins (Maher & Martindale, 1980; Pickett et al., 1990), and the protein binds IAA with extremely high affinity (Yang et al., 2006; Carrier et al., 2008). AUX1 mutants are agravitropic and exhibit root elongation in the presence of IAA (which inhibits WT root growth), but the synthetic, membrane‐permeable auxin NAA inhibits aux1 root growth to WT levels (Maher & Martindale, 1980; Pickett et al., 1990; Bennett et al., 1996; Marchant et al., 1999; Fendrych et al., 2018). Root cells in aux1 mutants take up significantly less IAA (Rashotte et al., 2003; Band et al., 2014; Hayashi et al., 2014; Rutschow et al., 2014; Dindas et al., 2018) and are larger than WT cells (Ugartechea‐Chirino et al., 2010; Figs S7, S9). Intracellular auxin concentrations are higher further from the meristem, in long WT root epidermal cells (Brunoud et al., 2012), possibly because IAA concentration regulates the amount of time cells spend in the elongation zone (Rahman et al., 2007). We hypothesized that AUX1 might play a previously uncharacterized role in short‐term auxin signaling to the cytoskeleton.
We expressed GFP‐fABD2 in aux1‐100 (WS background) and in aux1‐22 (Col‐0 background; Feldmann, 1991; Roman et al., 1995; Bennett et al., 1996), to test the hypothesis that if AUX1 were upstream of cytoskeletal rearrangements in response to auxin, the mutants’ actin cytoskeletons would not respond to 20–30 min IAA treatments but would respond to NAA, which reaches the cytoplasm in high quantities because it is highly membrane permeable, and need not rely on an influx carrier (Delbarre et al., 1996; Carrier et al., 2008). Because root epidermal cells in aux1 plants were significantly longer than WT (Figs S7, S9), analyzing actin response by ‘regions’ seemed imprecise. For example, a 120 μm‐long WT cell that will grow to a final length of 140 μm is at a different point in development than a 120 μm‐long aux1‐100 cell that will ultimately grow to 290 μm. Therefore, we quantified differences in actin array on a per‐cell basis (computing one measurement per actin parameter per cell), rather than by region (see the Materials and Methods section; Methods S3; Figs S7, S9).
Both aux1 mutants had mean cell lengths longer than WT, and actin organization that differed from WT under control conditions (Figs 5, S7–S9). When compared to its respective WT ecotype, each aux1 mutant allele exhibited significantly lower average filament density and increased skewness. Filaments were more longitudinal and parallel to one another. Mutants' longer cells and ‘more organized’ actin filament organization fits the model that higher levels of apparent ‘organization’ coincide with cell expansion under control conditions.
Figure 5.

Actin organization in aux1‐100 fails to respond to short‐term indole‐3‐acetic acid (IAA) treatments but responds partially to the membrane‐permeable auxin 1‐naphthylacetic acid (NAA). (a–c) Representative VAEM images of green fluorescent protein fused to the second actin‐binding domain of Arabidopsis FIMBRIN1 (GFP‐fABD2)–labeled actin in Arabidopsis thaliana epidermal cells from wild‐type (ecotype Wassilewskija, WS) and aux1‐100, treated for 20–30 min with control (a), 10 nM IAA (b), or 100 nM NAA (c). Bar, 5 μm. (d–g) Quantification of actin organization in root epidermal cells. Wild‐type response is shown in blue and aux1‐100 in green; control, solid; 10 nM IAA, dots; 100 nM NAA, stripes. IAA failed to trigger an increase in actin filament density in aux1‐100 (d) but actin density in aux1‐100 increased in response to NAA. Skewness in both genotypes did not significantly respond to either treatment (e). After IAA and NAA treatments, actin arrays in WS plants were more ‘organized,’ with lower average filament angle (f) relative to the longitudinal axis of the cell and filaments generally more parallel to each other (g). Average actin filament angle and parallelness in aux1‐100 failed to reorganize in response to either IAA (dots) or the membrane‐permeable auxin NAA (stripes). n = 7–32 cells per root; 9–11 roots per genotype per treatment. Error bars represent ± 1 SE; a.u., arbitrary units. Different letters indicate statistically significant differences, oneway ANOVA, compared with Tukey–Kramer honest significant difference in JMP. Actin measurements were quantified on a per‐cell basis; see the Materials and Methods section for description and Supporting Information Fig. S7 for scatter plots. Results are from one representative experiment of two similar experiments with similar results. All auxin experiments were performed and analyzed double blind.
Actin organization in WS plants expressing GFP‐fABD2 responded to short‐term IAA treatments almost identically as had Col‐0. Actin filament density and parallelness significantly increased, and average filament angle significantly decreased (Fig. 5). When quantified on a per‐cell basis, WS did not exhibit the small but statistically significant decrease in skewness (Figs 5e, S7) previously observed in Col‐0 (Fig. 3), perhaps because the ecotype itself is slightly resistant to auxin (Dharmasiri et al., 2005b). The aux1‐100 mutant's actin array did not significantly reorganize after IAA treatment (Fig. 5), indicating that actin cytoskeleton response to IAA required the transporter. To confirm the importance of AUX1 in IAA‐triggered actin cytoskeleton rearrangements, we tested a second allele, aux1‐22, whose actin array also failed to reorganize after IAA treatment (Fig. S8).
In order to understand whether the auxin hormone itself drives cytoskeletal reorganization, or if there is an intermediary between auxin, AUX1, and actin response, we tested the mutant's response to the highly membrane‐permeable auxin NAA. If AUX1's role is restricted to transporting IAA into the cell and auxin merely needs to enter cells to stimulate actin reorganization, NAA should suffice to induce a WT response in aux1‐100 and should induce denser, more longitudinal, parallel arrays. But if NAA should fail to induce reorganization, we could deduce that the presence of auxin inside the cell is insufficient, and short‐term auxin‐to‐actin signaling requires AUX1 protein. Fig. 5 shows that WS responds in a similar way to NAA and IAA. However, compared to IAA on WT, NAA only partially restored actin organization in aux1‐100: the highly membrane permeable auxin stimulated only increased actin filament density (Fig. 5d) in aux1‐100, and did not affect filament angle or parallelness (Fig. 5f,g).
In order to confirm AUX1's importance in cytoskeletal responses to NAA, we tested NAA's effects on actin organization in aux1‐22 and its WT, Col‐0. Recapitulating aux1‐22's lack of response to IAA, actin organization in this mutant was largely impervious to NAA, and exhibited only a sizeable but statistically insignificant reduction in average filament angle and no changes in density or parallelness. Upon testing the effect of NAA on actin reorganization in Col‐0, we found that NAA stimulated increased filament density in Col‐0, but, when measured on a per‐cell basis, Col‐0 exhibited no changes in average filament angle or parallelness (Fig. S8). The Col‐0 and WS ecotypes are likely genetically divergent enough to explain why NAA provoked dissimilar actin reorganization; previous work identified ecotype‐specific transcriptional responses (e.g. for proteins involved in hormone signaling) to various environmental conditions (Schultz et al., 2017). Actin organization in both aux1‐100 and aux1‐22 failed to respond to IAA and only partially responded to NAA. These results are the first that place AUX1 upstream of actin in short‐term auxin signaling events, as well as demonstrate that the import protein itself is required for complete actin responses to auxin.
Discussion
We correlated actin architecture and orientation to cell lengths in expanding root epidermal cells and report the first quantitative assessment of actin responses to short‐term indole‐3‐acetic acid (IAA) treatments, establishing a baseline to enable further testing of auxin–actin signaling. We measured cell expansion rates on a growing root imaged with light sheet fluorescence microscopy (LSFM) and found that under control conditions, short epidermal cells (Region 2) grew at a rate of c. 0.015 μm min−1 and that long cells (Region 3) grew nearly 10 times as fast – at a rate of c. 0.145 μm min−1. Under control conditions and imaged with variable angle epifluorescence microscopy (VAEM), slow‐growing cells (Region 2) were characterized by dense actin arrays with high end‐to‐end annealing frequencies; fast‐growing cells (Region 3) exhibited more bundled, more parallel, more longitudinal actin arrays in which filaments elongated faster and grew longer. We found this same pattern of actin organization in the Wasilewskija (WS) ecotype and aux1 (AUX1, AUXIN RESISTANT 1) mutants, indicating a possible causal relationship among cell length, skewness/bundling and filament parallelness.
Although auxin is a known root growth inhibitor with ties to the actin cytoskeleton (Hejnowicz & Erickson, 1968; Fendrych et al., 2018; reviewed in Zhu & Geisler, 2015), its short‐term effects on actin organization were unknown previously. We documented actin responses to growth‐inhibitory IAA, and found that filaments unbundled to become more dense, longitudinal and parallel within 20–30 min, demonstrating that increased actin ‘organization’ and increased cell expansion are not directly causal. The natural auxin IAA doubled the frequency of unbundling events and stimulated region‐specific changes in end‐to‐end annealing frequencies within 7 min (Table 2). Our data appear to indicate that auxin‐induced increased filament density is a product of unbundling and end‐to‐end annealing; we did not investigate whether new actin monomers are translated within this 7 min timeframe.
We provide the first evidence that rapid actin reorganization in response to auxin requires the auxin transporter AUX1 and that cytoplasmic auxin contributes to actin reorganization. Actin arrays in aux1 mutants are impervious to exogenous IAA – likely because auxin cannot enter cells in sufficient quantities – and only partially respond to the highly membrane‐permeable 1‐naphthylacetic acid (NAA), indicating that whereas auxin elicits some actin rearrangements, AUX1 itself is necessary for the full response. Although we do not establish a cause‐and‐effect relationship between increased actin bundling and elongating cells, our results disprove the hypothesis that actin bundles inherently inhibit cell expansion. Whether changes in actin organization precede or merely correlate with growth inhibition awaits access to new technologies that permit simultaneous visualization of actin dynamics and cell elongation at high spatiotemporal resolutions. In this regard, light sheet fluorescence microscopy seems quite promising based on preliminary results (Video S1; Fig. S11; Ovečka et al., 2015).
Actin array organization and filament behaviors correlate with cell length
It has been accepted that cell expansion requires observable actin ‘organization’ (Smertenko et al., 2010; Dyachok et al., 2011). However, ‘organization’ can take many forms and what form drives growth is unknown. Indeed, we found in two ecotypes – and in the significantly longer cells of aux1‐100 – that filament parallelness, cell length and skewness affect one another to similar extents, producing predictable actin organization across the root elongation zone. Under control conditions, actin bundling increases as cell length increases (Figs 1, S11), and longer cells exhibit faster elongation rates along the elongation zone (Video S1; Fig. S11). Together, these data demonstrate that filament bundles do not inhibit expansion.
Although aspects of individual filament dynamics have been measured in Arabidopsis root epidermal cells (Smertenko et al., 2010), we quantified additional behaviors, aiming to discern what behaviors might contribute to axial cell expansion. Actin arrays in Region 2 were significantly denser than in Region 3, so we expected a higher rate of filament turnover: increased severing, shorter filaments and filament lifetimes, and faster elongation rates. We had previously seen (Figs 1, S1) that filament arrays in Region 3 were more bundled than in Region 2 (Figs 1, S1), so we expected higher bundling or lower unbundling frequencies in longer cells, or higher unbundling frequencies in shorter cells. Both short and long cells exhibited similar individual filament behaviors (Table 1), the only major differences being shorter cells’ reduced maximum filament lengths and elongation rates, and multifold‐increased end‐to‐end annealing frequencies. In etiolated hypocotyls, increased filament lengths and lifetimes correlate with longer cells and occur in cells at the hypocotyl base, which have ceased expanding (Henty‐Ridilla et al., 2013; J. Li et al., 2014). Although shorter root epidermal cells have shorter average filament lengths, filament lifetimes are statistically equivalent in both regions (Table 1), and longer root cells are actually growing faster (Fig. S11; Video S1); therefore, a connection between longer lifetime and increased cell length is not evident in roots.
The most marked filament behavior difference between short and long cells was the ≤ 10‐fold higher end‐to‐end annealing frequency (i.e. number of incidents min−1 per filament) observed in shorter cells. Short cells exhibited higher annealing frequencies than long cells (and auxin increased annealing frequencies in long cells), suggesting that annealing serves a purpose related to growth control and/or signaling. Annealing in vitro is generally a function of actin concentration, filament length and/or filament end availability (Andrianantoandro et al., 2001), and in vivo is downregulated by capping protein (CP; Li et al., 2012; Henty‐Ridilla et al., 2014; Li et al., 2015b). Annealing builds filaments quickly and without intensive energy inputs (Smertenko et al., 2010; Li et al., 2012). Because maximum filament length is reduced in short cells, which also exhibit higher annealing frequencies under control conditions, and because these events seem transient, mostly annealing for only a few frames, they do not appear to build longer filaments. Perhaps shorter cells, located in the transition zone subsection of the elongation zone, undergo more cytoplasmic changes (e.g. in trafficking or vesicle distribution) in preparation for rapid elongation. Cytoplasmic changes, potentially including redistribution of auxin transporters, could also explain why auxin induces increased annealing in long cells. Our data support the possibility that an increase in end capping by CP (i.e. a decrease in the frequency of end‐to‐end annealing events) correlates with rapid growth (Region 3), whereas a downregulation of CP (and accordant increases in end‐to‐end annealing) correlates with slow growth (Region 2 exhibited high annealing frequencies under control conditions) or growth cessation (IAA induced a significant increase in the frequency of end‐to‐end annealing events).
Actin organization predicts cell length under control conditions but not otherwise
The effect of actin bundles on growth as well as auxin's short‐term effects on actin organization were unknown previously. Studies report that long‐term, high auxin doses bundle actin filaments (G. Li et al., 2014; Scheuring et al., 2016), whereas short‐term, high doses stimulate growth and induce filament unbundling of mTalin–bundled actin filaments in dark‐grown rice coleoptiles (Holweg et al., 2004; Nick et al., 2009). Auxin transport inhibitors (e.g. 2,3,5‐triiodobenzoic acid) have the opposite effect, inducing bundling within minutes (Dhonukshe et al., 2008) and inhibiting cell elongation (Rahman et al., 2007). Here, we demonstrated that short‐term, growth‐inhibitory IAA treatments at doses closer to endogenous levels (Hejnowicz & Erickson, 1968; Band et al., 2012; Fendrych et al., 2018), decreased extent of overall filament bundling and induced increased density, longitudinality, and parallelness within 20–30 min. That the cytoskeleton looks ‘organized’ – more longitudinal and parallel – in response to IAA, which inhibits growth within minutes (Hejnowicz & Erickson, 1968; Fendrych et al., 2018), definitively demonstrates that increased ‘organization’ does not inherently contribute to expansion. By showing that as cell lengths and elongation rates increase, so too does extent of actin bundling (Figs 1, S1, S3), we have disproven the hypothesis that bundles inhibit expansion (Gilliland et al., 2003; Holweg et al., 2004; Rahman et al., 2007). The converse of the idea that bundles inhibit growth is that an absence of bundles coincides with growth. This notion is posited in studies that show that auxin inhibitors bundle filaments and inhibit growth (e.g. Dhonukshe et al., 2008), and that growing cells in the hypocotyl apex have denser actin arrays than the nongrowing cells in the hypocotyl base, whose actin is more bundled (e.g. Henty et al., 2011). Auxin inhibits root growth; by finding that auxin rapidly induces actin unbundling (Table 2) and overall denser filament arrays (Figs 3, 5, S5–S9), we demonstrate that an absence of bundles does not coincide with growth. Our correlative study has determined that there is no absolute relationship between actin bundling and cell expansion. Establishing cause‐and‐effect will require simultaneously capturing actin dynamics and cell elongation.
AUX1 is necessary for actin response to auxin
Multiple auxin–actin pathways (reviewed in Overvoorde et al., 2010, and Grones & Friml, 2015) assign various roles to actin in auxin response (e.g. repositioning auxin transport proteins, or inhibiting endocytosis of auxin transporters), and the short‐term pathway linking auxin and actin was thought to be the extracellular auxin receptor AUXIN BINDING PROTEIN 1 (ABP1) (Xu et al., 2010, 2011; Nagawa et al., 2012). The ABP1 model posits that the extracellular protein, with its coreceptor TRANSMEMBRANE KINASE, binds auxin molecules and transduces the extracellular auxin signal to Rho‐like GTPase of plants (ROPs) (Lin et al., 2012; Nagawa et al., 2012), inducing dose‐dependent ROP activation (Xu et al., 2014). Activated ROPs then regulate actin polymerization towards growth‐related effects by inhibiting PIN endocytosis to maintain auxin export (Sauer & Kleine‐Vehn, 2011; Lin et al., 2012; Nagawa et al., 2012; Xu et al., 2014; Zhu & Geisler, 2015). Now that ABP1's role in auxin–actin signaling is in doubt (Dai et al., 2015; Gao et al., 2015), the mechanism of how actin rapidly perceives auxin requires reanalysis.
Before this work, AUX1 was not suspected of being a ‘transceptor’ upstream of actin organization. AUX1 transports auxin (Bennett et al., 1996; Dindas et al., 2018), has homologs in all plants (reviewed in Swarup & Péret, 2012), is necessary for root gravitropism (Maher & Martindale, 1980; Marchant et al., 1999; Swarup et al., 2004), and is responsible for 80% of IAA uptake in root hairs (Dindas et al., 2018) and rapid growth inhibition by IAA (Fendrych et al., 2018). Auxin‐induced transcriptional regulation requires the SCFTIR1/AFB complex, which also participates in short‐term intracellular responses to auxin (Dharmasiri et al., 2005a,b; Calderón Villalobos et al., 2012). Within 10 min of an auxin signal, an H+ influx depolarizes the plasma membrane (PM) and reduces cytosolic pH; shortly thereafter, increased intracellular Ca2+ propagates through the root (Dindas et al., 2018).
Differences in response to IAA vs NAA, observed in both wild‐type (WT) and aux1 roots, emphasize a role for cytoplasmic auxin in cytoskeletal reorganization. Both IAA and NAA are substrates of AUX1 (Yang et al., 2006; Carrier et al., 2008) and SCFTIR1/AFB, and protein affinity is higher for IAA than NAA (Dharmasiri et al., 2005b; Calderón Villalobos et al., 2012; Dindas et al., 2018). Both auxins increase actin filament density in WT cells, likely through filament unbundling and, perhaps, end‐to‐end annealing. NAA stimulated disparate, ecotype‐dependent effects on actin reorganization: whereas WS responded in a similar way to NAA and IAA, Col‐0 exhibited no changes in extent of longitudinal, parallel filaments at 20–30 min. Col‐0 possibly responds to NAA more slowly than to IAA. Natural and synthetic auxins inhibit root elongation to different extents, depending on ecotype (Delker et al., 2010). Differential responses to NAA have been detected across ecotypes; for example, NAA stimulates more lateral roots in 9‐d‐old Col‐0 plants vs WS or Landsberg erecta (Falasca & Altamura, 2003). Additionally, IAA and NAA can induce in Col‐0 different levels of downstream gene expression (Yoshimitsu et al., 2011). Ecotype differences in signaling and physiological responses may be more prevalent than previously appreciated.
Actin reorganization in both alleles of aux1 was resistant to IAA and exhibited only partial responses to NAA, implicating AUX1 and cytoplasmic auxin as major players in auxin signaling to actin. After NAA treatments, density increased in aux1‐100 and angle appeared somewhat (c. 14%), although not statistically significantly, decreased in aux1‐22. Attenuated actin reorganization of aux1 in response to NAA supports the Dindas et al. (2018) model of an AUX1‐reliant intracellular feedback loop. IAA and NAA typically alter intracellular pH and Ca2+ concentrations via AUX1; these responses are reduced or absent in aux1 mutants (Dindas et al., 2018). Both H+ and Ca2+ can regulate actin binding proteins. Perhaps IAA transport through AUX1 regulates intracellular players which drive, separately, each aspect of actin reorganization (density, angle, parallelness; Fig. 6, discussed below). Alternatively, actin reorganization might be delayed in the mutants. Regardless, Dindas et al. (2018) and our data showing aux1 mutants' partial actin responses to NAA demonstrate that cytoplasmic auxin itself acts as an intracellular signaling molecule that stimulates rapid cellular responses including substantial actin reorganization, deviating from the ABP1 model that relied on auxin perception at the PM and subsequent signal amplification.
Figure 6.

Hypothetical model of auxin perception by AUXIN RESISTANT 1 (AUX1) upstream of actin cytoskeleton reorganization. (a) Control conditions: unidentified actin binding proteins (ABP) ‐X and ‐Y are active and maintain actin array; an unidentified intermediary that differs between Col‐0 and WS is inactive. (b) Auxin is transported into a cell by AUX1, activating the unknown intermediary, inactivating both ABP‐X and ABP‐Y, and inducing increased actin filament abundance, decreased filament angle, and increased parallelness. (c) In the absence of AUX1, large quantities of indole‐3‐acetic acid (IAA) cannot enter cells. The membrane permeable auxin 1‐naphthylacetic acid (NAA) enters a cell, possibly activating the unknown intermediary; ABP‐X and ABP‐Y are differentially regulated and only either an increase in actin abundance or decrease in filament angle occurs.
Potential players in the actin–auxin connection
Actin bundling proteins, through their ability to alter activity in response to intracellular second messengers, are likely transducers of auxin signals into cytoskeletal changes. Long‐term auxin responses in rice require the actin binding protein RMD (Rice Morphology Determinant; FORMIN5, Arabidopsis homolog FORMIN14), which is downstream of AUXIN RESPONSE FACTORS (Zhang et al., 2011; G. Li et al., 2014). Less is known about auxin's effect on actin during cellular activities that occur within minutes, such as polarized growth or gravitropism (Xu et al., 2014; Zhu et al., 2016). Auxin stimulates short‐term intracellular responses (e.g. H+ and Ca2+ influx) that occur independent of transcriptional responses and are AUX1‐dependent (Monshausen et al., 2011; Dindas et al., 2018). Specific actin binding proteins whose activity is modulated by these second messengers, such as the severing/bundling factors ADF or villin (Zou et al., 2019), could be targets of auxin signaling. Guided by specific features of actin response to auxin (e.g. increased unbundling and end‐to‐end annealing), actin binding protein mutants could be evaluated for altered growth or actin responses in response to IAA. Auxin‐induced actin reorganization could require more than one actin binding protein; ecotype‐specific differences might explain Col‐0 and WS's dissimilar responses to NAA (Fig. 6 proposes a tentative model). The model proposes that second messengers taken up with (H+) or shortly after (Ca2+) IAA modulate activity of two actin binding proteins, leading to filament unbundling and changes in annealing frequency that cause overall increases in filament density, longitudinality and parallelness (Fig. 6b). An unidentified protein that differs in Col‐0 and WS – or slight differences in the target actin binding protein itself – may cause the ecotype‐specific responses to NAA that occur in the absence of AUX1. In the absence of AUX1, the unidentified protein and/or differences in H+ import, differentially regulate downstream actin binding protein(s). Due to its role in regulating end‐to‐end annealing, we suspect that CP is one of the unidentified actin binding proteins acting in our hypothetical model (Fig. 6). Under control conditions, annealing frequency is high in Region 2 and low in Region 3, implying a growth‐related gradient of CP or CP regulation. IAA stimulates increased annealing in Region 3 but less significant changes in annealing in Region 2.
Extracellular pH affects auxin uptake, where cells take up less IAA or NAA as external solution pH increases (Raven, 1975; Shinohara et al., 2006; Yang et al., 2006; Dindas et al., 2018). By applying 20–30 min auxin treatments in high pH (pH > 10) ½ Murashige & Skoog solution, we found that WS actin reorganization in responses to both IAA and NAA were substantially reduced compared to actin responses in our other experiments (cf Fig. S10 with WS responses to IAA and NAA at c. pH 5.8, shown in blue in Fig. 5), although we did not test the effect of different pH solutions head‐to‐head. This result implies that cytoplasmic auxin is a key instigator of actin reorganization, which could be due to direct or indirect action on actin, particular actin binding proteins, and/or their effectors.
The actin–auxin connection and cell expansion
The mechanisms by which auxin and actin control growth remain enigmatic. Actin could provide tracks for trafficking or prevent endocytosis of auxin transporters, alter vacuole morphology, and/or operate through another mechanism. Root cells newly differentiated from the meristem (where intracellular auxin levels are low; Brunoud et al., 2012) expand isotropically. Using VAEM, we were unable to visualize actin in these youngest cells because they are covered by the root cap (Region 1). We found that actin in WT Region 2 cells – the visible epidermal cells having most recently undergone isoptropic expansion – was very dense and haphazard with few bundles, and that as cell lengths increased, their actin arrays became sparser and more bundled, longitudinal, and parallel (Figs 1, S1–S3). Very likely increased actin bundling and parallelness occur coincident with rapid axial cell elongation (Video S1; Fig. S11). Auxin regulates how long a cell spends in the elongation zone (Rahman et al., 2007), and therefore how long it elongates. An initial, low, endogenous auxin signal could force young cells to break symmetry, with actin filaments becoming more longitudinal and parallel to direct vesicles to end walls for incorporation into anticlinal walls causing, ultimately, cell elongation. Whether diffusely growing cells elongate by depositing material along the entire length of the cell or primarily towards anticlinal end walls is currently unknown but could explain the purpose of longitudinal bundles.
Turgor pressure exerted by the vacuole is a primary driver of cell expansion (Cosgrove, 2005; Kroeger et al., 2011; Braidwood et al., 2014; Guerriero et al., 2014). Six‐hour NAA treatments cause actin‐dependent vacuole constriction that ultimately reduces cell lengths (Scheuring et al., 2016). If the same mechanism impels rapid growth cessation, a denser, more longitudinal actin array might effect vacuole constriction. Alternatively, cytoplasmic streaming and vesicle delivery could require an equilibrium of available tracks and space, and any actin array that disrupts that balance (i.e. unbundling to build a denser array) quickly alters cell expansion. Toward this idea, Tominaga et al. (2013) showed that chimeric myosins that drive faster intracellular activity grow larger plants with longer cells. We found that exogenous auxin treatments of WT plants rapidly increased actin filament density via filament unbundling. Substantial increases in filament density occur in response to other exogenous stimuli, which are also correlated with growth cessation, such as microbe‐associated molecular pattern (MAMPs) These results indicate that, like MAMP perception (Cárdenas et al., 1998; Henty‐Ridilla et al., 2014; Li et al., 2015b), actin filaments are first responders to extracellular signals. Coping with exogenous stimuli requires cells to undertake new tasks (e.g. receptor internalization, transporter trafficking, or callose deposition) and could require increased actin density to meet them.
The hormone AUX1 and auxin efflux carriers (PINs) require actin for targeted subcellular localization (Kleine‐Vehn et al., 2006, 2008). However, AUX1 is not redistributed in response to NAA (Kleine‐Vehn et al., 2006), which stimulates at least partial actin reorganization in Col‐0, WS and both aux1 mutants. Use of a photoconvertible PIN2 shows that it is not maintained at root epidermal cell PMs after auxin treatments, and most PIN2 in brefeldin A compartments is newly synthesized, not recycled (Jásik et al., 2016). This complicates actin's role in auxin response. Initial auxin‐induced actin reorganization could primarily transduce an auxin signal (i.e. provide tracks to transport signaling elements into the nucleus), and be incidental to altered growth rates rather than drive growth per se. Wild‐type roots cease elongating within 30 s of IAA, IAA does not significantly affect aux1‐100 elongation, but NAA reduces mutant growth rates to WT levels (Fendrych et al., 2018). We found NAA induced in each aux1 allele partial, divergent, actin reorganization. If overall actin organization and cell expansion were directly causative, NAA should have induced in aux1 the complete reorganization observed in WT cells, or at least similar responses in both mutant alleles.
Our IAA treatments evidence that the actin cytoskeleton in root elongation zone cells responds to the growth cessation signal within minutes by significantly increasing filament abundance plus longitudinal, parallel filaments, opposing the view that organization coincides with expansion. We show that IAA‐induced actin rearrangements require AUX1, whereas our NAA results show that auxin itself acts as a cytoplasmic signal to modulate actin cytoskeleton organization. However auxin is acting, the relationship between actin organization and cell expansion cannot be explained by a simple model of ‘organized’ or ‘disorganized’ actin, or by the presence/absence of longitudinal bundles.
Author contributions
RSA and CJS conceived the project and designed the experiments; RSA performed the experiments and data analysis; and RSA and CJS wrote the article.
Supporting information
Please note: Wiley‐Blackwell are not responsible for the content or functionality of any Supporting Information supplied by the authors. Any queries (other than missing material) should be directed to the New Phytologist Central Office.
Fig. S1 Arabidopsis thaliana epidermal cells in different root regions exhibit distinct actin filament arrays.
Fig. S2 Actin filament arrays are not predictive of cell width.
Fig. S3 Actin filament arrays are predictive of cell length.
Fig. S4 Actin arrays in A. thaliana root Region 3 are more dynamic than in Region 2.
Fig. S5 Short‐term IAA treatments induce dose‐dependent changes in actin filament organization.
Fig. S6 Short‐term IAA treatments induce a time‐dependent increase in actin filament density and longitudinal orientation.
Fig. S7 Actin filament organization plotted with respect to corresponding cell length in WS and aux1‐100.
Fig. S8 Actin organization in aux1‐22 fails to respond to short‐term IAA treatments but partially responds to the membrane‐permeable auxin NAA.
Fig. S9 Actin filament organization plotted with respect to corresponding cell length in Col‐0 and aux1‐22.
Fig. S10 Actin organization in WT WS fails to respond to short‐term auxin treatments at high pH.
Fig. S11 Epidermal cell elongation rate increases as cells undergo axial expansion in the A. thaliana root elongation zone.
Methods S1 LSFM imaging and analysis.
Methods S2 Genotyping primers.
Methods S3 Detailed methods for quantitative analysis of cortical actin array organization.
Methods S4 Detailed methods for individual actin filament dynamics.
Table S1 Eigenvectors for principal component analysis of cell size vs actin parameters in A. thaliana Col‐0.
Table S2 Eigenvalues for principal component analysis of cell size vs actin parameters in A. thaliana Col‐0.
Table S3 Eigenvectors for principal component analysis of cell size vs actin parameters in A. thaliana WS.
Table S4 Eigenvalues for principal component analysis of cell size vs actin parameters in A. thaliana WS.
Table S5 Eigenvectors for principal component analysis of cell size vs actin parameters in A. thaliana aux1‐100.
Table S6 Eigenvalues for principal component analysis of cell size vs actin parameters in A. thaliana aux1‐100.
Table S7 Actin organization measurements in A. thaliana roots after IAA treatments.
Video S1 Maximum projection of root epidermal cell elongation within the elongation zone over 10 h.
Acknowledgements
This work was supported, in part, by an award from the Office of Science at the US Department of Energy, Physical Biosciences Program, under contract number DE‐FG02‐09ER15526 to CJS. We thank Chris English (Bruker) for assistance with collecting light sheet fluorescence microscopy (LSFM) images on the MuVi SPIM platform. We owe special thanks to our colleague Samy Belteton, Jr. from the Szymanski Lab (Purdue) for sharing his registration macro, which facilitated analysis of LSFM Video S1.
References
- Andrianantoandro E, Blanchoin L, Sept D, McCammon JA, Pollard TD. 2001. Kinetic mechanism of end‐to‐end annealing of actin filaments. Journal of Molecular Biology 312: 721–730. [DOI] [PubMed] [Google Scholar]
- Baluška F, Jasik J, Edelmann HG, Salajová T, Volkmann D. 2001. Latrunculin B‐induced plant dwarfism: plant cell elongation is F‐actin‐dependent. Developmental Biology 231: 113–124. [DOI] [PubMed] [Google Scholar]
- Baluška F, Mancuso S. 2013. Root apex transition zone as oscillatory zone. Frontiers in Plant Science 4: e354. [DOI] [PMC free article] [PubMed] [Google Scholar]
- Baluška F, Vitha S, Barlow PW, Volkmann D. 1997. Rearrangements of F‐actin arrays in growing cells of intact maize root apex tissues: a major developmental switch occurs in the postmitotic transition region. European Journal of Cell Biology 72: 113–121. [PubMed] [Google Scholar]
- Band LR, Wells DM, Fozard JA, Ghetiu T, French AP, Pound MP, Wilson MH, Yu L, Li W, Hijazi HI et al 2014. Systems analysis of auxin transport in the Arabidopsis root apex. Plant Cell 26: 862–875. [DOI] [PMC free article] [PubMed] [Google Scholar]
- Band LR, Wells DM, Larrieu A, Sun J, Middleton AM, French AP, Brunoud G, Sato EM, Wilson MH, Péret B et al 2012. Root gravitropism is regulated by a transient lateral auxin gradient controlled by a tipping‐point mechanism. Proceedings of the National Academy of Sciences, USA 109: 4668–4673. [DOI] [PMC free article] [PubMed] [Google Scholar]
- Beemster GTS, Baskin TI. 1998. Analysis of cell division and elongation underlying the developmental acceleration of root growth in Arabidopsis thaliana . Plant Physiology 116: 1515–1526. [DOI] [PMC free article] [PubMed] [Google Scholar]
- Beemster GTS, Baskin TI. 2000. STUNTED PLANT 1 mediates effects of cytokinin, but not of auxin, on cell division and expansion in the root of Arabidopsis . Plant Physiology 124: 1718–1727. [DOI] [PMC free article] [PubMed] [Google Scholar]
- Bennett MJ, Marchant A, Green HG, May ST, Ward SP, Millner PA, Walker AR, Schulz B, Feldmann KA. 1996. Arabidopsis AUX1 gene: a permease‐like regulator of root gravitropism. Science 273: 948–950. [DOI] [PubMed] [Google Scholar]
- Braidwood L, Breuer C, Sugimoto K. 2014. My body is a cage: mechanisms and modulation of plant cell growth. New Phytologist 201: 388–402. [DOI] [PubMed] [Google Scholar]
- Breuer D, Ivakov A, Sampathkumar A, Hollandt F, Persson S, Nikoloski Z. 2014. Quantitative analyses of the plant cytoskeleton reveal underlying organizational principles. Journal of the Royal Society Interface 11: e20140362. [DOI] [PMC free article] [PubMed] [Google Scholar]
- Brunoud G, Wells DM, Oliva M, Larrieu A, Mirabet V, Burrow AH, Beeckman T, Kepinski S, Traas J, Bennett MJ et al 2012. A novel sensor to map auxin response and distribution at high spatio‐temporal resolution. Nature 482: 103–106. [DOI] [PubMed] [Google Scholar]
- Cai C, Henty‐Ridilla JL, Szymanski DB, Staiger CJ. 2014. Arabidopsis myosin XI: a motor rules the tracks. Plant Physiology 166: 1359–1370. [DOI] [PMC free article] [PubMed] [Google Scholar]
- Calderón Villalobos LIA, Lee S, De Oliveira C, Ivetac A, Brandt W, Armitage L, Sheard LB, Tan X, Parry G, Mao H et al 2012. A combinatorial TIR1/AFB‐Aux/IAA co‐receptor system for differential sensing of auxin. Nature Chemical Biology 8: 477–485. [DOI] [PMC free article] [PubMed] [Google Scholar]
- Cao L, Henty‐Ridilla JL, Blanchoin L, Staiger CJ. 2016. Profilin‐dependent nucleation and assembly of actin filaments controls cell elongation in Arabidopsis . Plant Physiology 170: 220–233. [DOI] [PMC free article] [PubMed] [Google Scholar]
- Cárdenas L, Vidali L, Domínguez J, Pérez H, Sánchez F, Hepler PK, Quinto C. 1998. Rearrangement of actin microfilaments in plant root hairs responding to rhizobium ETLI nodulation signals. Plant Physiology 116: 871–877. [DOI] [PMC free article] [PubMed] [Google Scholar]
- Carrier DJ, Bakar NTA, Swarup R, Callaghan R, Napier RM, Bennett MJ, Kerr ID. 2008. The binding of auxin to the Arabidopsis auxin influx transporter AUX1. Plant Physiology 148: 529–535. [DOI] [PMC free article] [PubMed] [Google Scholar]
- Chen X, Naramoto S, Robert S, Tejos R, Löfke C, Lin D, Yang Z, Friml J. 2012. ABP1 and ROP6 GTPase signaling regulate clathrin‐mediated endocytosis in Arabidopsis roots. Current Biology 22: 1326–1332. [DOI] [PubMed] [Google Scholar]
- Cosgrove DJ. 2005. Growth of the plant cell wall. Nature Reviews Molecular Cell Biology 6: 850–861. [DOI] [PubMed] [Google Scholar]
- Dai X, Zhang Y, Zhang D, Chen J, Gao X, Estelle M, Zhao Y. 2015. Embryonic lethality of Arabidopsis abp1‐1 is caused by deletion of the adjacent BSM gene. Nature Plants 1: e15183. [DOI] [PMC free article] [PubMed] [Google Scholar]
- Delbarre A, Muller P, Imhoff V, Guern J. 1996. Comparison of mechanisms controlling uptake and accumulation of 2,4‐dichlorophenoxy acetic acid, naphthalene‐1‐acetic acid, and indole‐3‐acetic acid in suspension‐cultured tobacco cells. Planta 198: 532–541. [DOI] [PubMed] [Google Scholar]
- Delker C, Pöschl Y, Raschke A, Ullrich K, Ettingshausen S, Hauptmann V, Grosse I, Quint M. 2010. Natural variation of transcriptional auxin response networks in Arabidopsis thaliana . Plant Cell 22: 2184–2200. [DOI] [PMC free article] [PubMed] [Google Scholar]
- Dharmasiri N, Dharmasiri S, Estelle M. 2005a. The F‐box protein TIR1 is an auxin receptor. Nature 435: 441–445. [DOI] [PubMed] [Google Scholar]
- Dharmasiri N, Dharmasiri S, Weijers D, Lechner E, Yamada M, Hobbie L, Ehrismann JS, Jürgens G, Estelle M. 2005b. Plant development is regulated by a family of auxin receptor F‐box proteins. Developmental Cell 9: 109–119. [DOI] [PubMed] [Google Scholar]
- Dhonukshe P, Grigoriev I, Fischer R, Tominaga M, Robinson DG, Hašek J, Paciorek T, Petrášek J, Seifertová D, Tejos R et al 2008. Auxin transport inhibitors impair vesicle motility and actin cytoskeleton dynamics in diverse eukaryotes. Proceedings of the National Academy of Sciences, USA 105: 4489–4494. [DOI] [PMC free article] [PubMed] [Google Scholar]
- Dindas J, Scherzer S, Roelfsema MRG, Von Meyer K, Müller HM, Al‐Rasheid KAS, Palme K, Dietrich P, Becker D, Bennett MJ et al 2018. AUX1‐mediated root hair auxin influx governs SCFTIR1/AFB‐type Ca2+ signaling. Nature Communications 9: e1174. [DOI] [PMC free article] [PubMed] [Google Scholar]
- Dyachok J, Zhu L, Liao F, He J, Huq E, Blancaflor EB. 2011. SCAR mediates light‐induced root elongation in Arabidopsis through photoreceptors and proteasomes. Plant Cell 23: 3610–3626. [DOI] [PMC free article] [PubMed] [Google Scholar]
- Falasca G, Altamura MM. 2003. Histological analysis of adventitious rooting in Arabidopsis thaliana (L.) Heynh seedlings. Plant Biosystems 137: 265–273. [Google Scholar]
- Feldmann KA. 1991. T‐DNA insertion mutagenesis in Arabidopsis: mutational spectrum. The Plant Journal 1: 71–82. [Google Scholar]
- Fendrych M, Akhmanova M, Merrin J, Glanc M, Hagihara S, Takahashi K, Uchida N, Torii KU, Friml J. 2018. Rapid and reversible root growth inhibition by TIR1 auxin signalling. Nature Plants 4: 453–459. [DOI] [PMC free article] [PubMed] [Google Scholar]
- Gao Y, Zhang Y, Zhang D, Dai X, Estelle M, Zhao Y. 2015. AUXIN BINDING PROTEIN 1 (ABP1) is not required for either auxin signaling or Arabidopsis development. Proceedings of the National Academy of Sciences, USA 112: 2275–2280. [DOI] [PMC free article] [PubMed] [Google Scholar]
- Gilliland LU, Pawloski LC, Kandasamy MK, Meagher RB. 2003. Arabidopsis actin gene ACT7 plays an essential role in germination and root growth. The Plant Journal 33: 319–328. [DOI] [PubMed] [Google Scholar]
- Grones P, Friml J. 2015. Auxin transporters and binding proteins at a glance. Journal of Cell Science 128: 1–7. [DOI] [PubMed] [Google Scholar]
- Guerriero G, Hausman J‐F, Cai G. 2014. No stress! Relax! Mechanisms governing growth and shape in plant cells. International Journal of Molecular Sciences 15: 5094–5114. [DOI] [PMC free article] [PubMed] [Google Scholar]
- Hacham Y, Holland N, Butterfield C, Ubeda‐Tomas S, Bennett MJ, Chory J, Savaldi‐Goldstein S. 2011. Brassinosteroid perception in the epidermis controls root meristem size. Development 138: 839–848. [DOI] [PMC free article] [PubMed] [Google Scholar]
- Hayashi K‐I, Nakamura S, Fukunaga S, Nishimura T, Jenness MK, Murphy AS, Motose H, Nozaki H, Furutani M, Aoyama T. 2014. Auxin transport sites are visualized in planta using fluorescent auxin analogs. Proceedings of the National Academy of Sciences, USA 111: 11557–11562. [DOI] [PMC free article] [PubMed] [Google Scholar]
- Hejnowicz Z, Erickson RO. 1968. Growth inhibition and recovery in roots following temporary treatment with auxin. Physiologia Plantarum 21: 302–313. [Google Scholar]
- Henty JL, Bledsoe SW, Khurana P, Meagher RB, Day B, Blanchoin L, Staiger CJ. 2011. Arabidopsis ACTIN DEPOLYMERIZING FACTOR4 modulates the stochastic dynamic behavior of actin filaments in the cortical array of epidermal cells. Plant Cell 23: 3711–3726. [DOI] [PMC free article] [PubMed] [Google Scholar]
- Henty‐Ridilla JL, Li J, Blanchoin L, Staiger CJ. 2013. Actin dynamics in the cortical array of plant cells. Current Opinion in Plant Biology 16: 678–687. [DOI] [PubMed] [Google Scholar]
- Henty‐Ridilla JL, Li J, Day B, Staiger CJ. 2014. ACTIN DEPOLYMERIZING FACTOR4 Regulates actin dynamics during innate immune signaling in Arabidopsis . Plant Cell 26: 340–352. [DOI] [PMC free article] [PubMed] [Google Scholar]
- Higaki T, Kojo KH, Hasezawa S. 2010a. Critical role of actin bundling in plant cell morphogenesis. Plant Signaling and Behavior 5: 484–488. [DOI] [PMC free article] [PubMed] [Google Scholar]
- Higaki T, Kurusu T, Hasezawa S, Kuchitsu K. 2011. Dynamic intracellular reorganization of cytoskeletons and the vacuole in defense responses and hypersensitive cell death in plants. Journal of Plant Research 124: 315–324. [DOI] [PubMed] [Google Scholar]
- Higaki T, Kutsuna N, Sano T, Kondo N, Hasezawa S. 2010b. Quantification and cluster analysis of actin cytoskeletal structures in plant cells: role of actin bundling in stomatal movement during diurnal cycles in Arabidopsis guard cells. The Plant Journal 61: 156–165. [DOI] [PubMed] [Google Scholar]
- Holweg C, Süßlin C, Nick P. 2004. Capturing in vivo dynamics of the actin cytoskeleton stimulated by auxin or light. Plant and Cell Physiology 45: 855–863. [DOI] [PubMed] [Google Scholar]
- Hussey PJ, Ketelaar T, Deeks MJ. 2006. Control of the actin cytoskeleton in plant cell growth. Annual Review of Plant Biology 57: 109–125. [DOI] [PubMed] [Google Scholar]
- Jásik J, Bokor B, Stuchlík S, Mičieta K, Turňa J, Schmelzer E. 2016. Effects of auxins on PIN‐FORMED2 (PIN2) dynamics are not mediated by inhibiting PIN2 endocytosis. Plant Physiology 172: 1019–1031. [DOI] [PMC free article] [PubMed] [Google Scholar]
- Kandasamy MK, McKinney EC, Meagher RB. 2009. A single vegetative actin isovariant overexpressed under the control of multiple regulatory sequences is sufficient for normal Arabidopsis development. Plant Cell 21: 701–718. [DOI] [PMC free article] [PubMed] [Google Scholar]
- Kepinski S, Leyser O. 2005. The Arabidopsis F‐box protein TIR1 is an auxin receptor. Nature 435: 446–451. [DOI] [PubMed] [Google Scholar]
- Ketelaar T, De Ruijter NCA, Emons AMC. 2003. Unstable F‐actin specifies the area and microtubule direction of cell expansion in Arabidopsis root hairs. Plant Cell 15: 285–292. [DOI] [PMC free article] [PubMed] [Google Scholar]
- Kleine‐Vehn J, Dhonukshe P, Sauer M, Brewer PB, Wiśniewska J, Paciorek T, Benková E, Friml J. 2008. ARF GEF‐dependent transcytosis and polar delivery of PIN auxin carriers in Arabidopsis . Current Biology 18: 526–531. [DOI] [PubMed] [Google Scholar]
- Kleine‐Vehn J, Dhonukshe P, Swarup R, Bennett M, Friml J. 2006. Subcellular trafficking of the Arabidopsis auxin influx carrier AUX1 uses a novel pathway distinct from PIN1. Plant Cell 18: 3171–3181. [DOI] [PMC free article] [PubMed] [Google Scholar]
- Kroeger JH, Zerzour R, Geitmann A. 2011. Regulator or driving force? The role of turgor pressure in oscillatory plant cell growth. PLoS ONE 6: e18549. [DOI] [PMC free article] [PubMed] [Google Scholar]
- Krysan PJ, Young JC, Tax F, Sussman MR. 1996. Identification of transferred DNA insertions within Arabidopsis genes involved in signal transduction and ion transport. Proceedings of the National Academy of Sciences, USA 93: 8145–8150. [DOI] [PMC free article] [PubMed] [Google Scholar]
- Leucci MR, Di Sansebastiano G‐P, Gigante M, Dalessandro G, Piro G. 2007. Secretion marker proteins and cell‐wall polysaccharides move through different secretory pathways. Planta 225: 1001–1017. [DOI] [PubMed] [Google Scholar]
- Li G, Liang W, Zhang X, Ren H, Hu J, Bennett MJ, Zhang D. 2014. Rice actin‐binding protein RMD is a key link in the auxin‐actin regulatory loop that controls cell growth. Proceedings of the National Academy of Sciences, USA 111: 10377–10382. [DOI] [PMC free article] [PubMed] [Google Scholar]
- Li J, Arieti R, Staiger CJ. 2015a. Actin filament dynamics and their role in plant cell expansion In: Fukuda H, ed. Plant cell wall patterning and cell shape. Hoboken, NJ, USA: Wiley‐Blackwell, 127–162. [Google Scholar]
- Li J, Henty‐Ridilla JL, Huang S, Wang X, Blanchoin L, Staiger CJ. 2012. Capping protein modulates the dynamic behavior of actin filaments in response to phosphatidic acid in Arabidopsis . Plant Cell 24: 3742–3754. [DOI] [PMC free article] [PubMed] [Google Scholar]
- Li J, Henty‐Ridilla JL, Staiger BH, Day B, Staiger CJ. 2015b. Capping protein integrates multiple MAMP signalling pathways to modulate actin dynamics during plant innate immunity. Nature Communications 6: 7206. [DOI] [PMC free article] [PubMed] [Google Scholar]
- Li J, Staiger BH, Henty‐Ridilla JL, Abu‐Abied M, Sadot E, Blanchoin L, Staiger CJ. 2014. The availability of filament ends modulates actin stochastic dynamics in live plant cells. Molecular Biology of the Cell 25: 1263–1275. [DOI] [PMC free article] [PubMed] [Google Scholar]
- Lin D, Nagawa S, Chen J, Cao L, Chen X, Xu T, Li H, Dhonukshe P, Yamamuro C, Friml J et al 2012. A ROP GTPase‐dependent auxin signaling pathway regulates the subcellular distribution of PIN2 in Arabidopsis roots. Current Biology 22: 1319–1325. [DOI] [PMC free article] [PubMed] [Google Scholar]
- Maher EP, Martindale SJB. 1980. Mutants of Arabidopsis thaliana with altered responses to auxins and gravity. Biochemical Genetics 18: 1041–1053. [DOI] [PubMed] [Google Scholar]
- Marchant A, Kargul J, May ST, Muller P, Delbarre A, Perrot‐Rechenmann C, Bennett MJ. 1999. AUX1 regulates root gravitropism in Arabidopsis by facilitating auxin uptake within root apical tissues. EMBO Journal 18: 2066–2073. [DOI] [PMC free article] [PubMed] [Google Scholar]
- Mathur J. 2004. Cell shape development in plants. Trends in Plant Science 9: 583–590. [DOI] [PubMed] [Google Scholar]
- Monshausen GB, Miller ND, Murphy AS, Gilroy S. 2011. Dynamics of auxin‐dependent Ca2+ and pH signaling in root growth revealed by integrating high‐resolution imaging with automated computer vision‐based analysis. The Plant Journal 65: 309–318. [DOI] [PubMed] [Google Scholar]
- Nagawa S, Xu T, Lin D, Dhonukshe P, Zhang X, Friml J, Scheres B, Fu Y, Yang Z. 2012. ROP GTPase‐dependent actin microfilaments promote PIN1 polarization by localized inhibition of clathrin‐dependent endocytosis. PLoS Biology 10: e1001299. [DOI] [PMC free article] [PubMed] [Google Scholar]
- Nick P. 2010. Probing the actin‐auxin oscillator. Plant Signaling and Behavior 5: 94–98. [DOI] [PMC free article] [PubMed] [Google Scholar]
- Nick P, Han M‐J, An G. 2009. Auxin stimulates its own transport by shaping actin filaments. Plant Physiology 151: 155–167. [DOI] [PMC free article] [PubMed] [Google Scholar]
- Nissen SJ, Sutter EG. 1990. Stability of IAA and IBA in nutrient medium to several tissue culture procedures. HortScience 25: 800–802. [Google Scholar]
- Ovečka M, Vaškebová L, Komis G, Luptovčiak I, Smertenko A, Šamaj J. 2015. Preparation of plants for developmental and cellular imaging by light‐sheet microscopy. Nature Protocols 10: 1234–1247. [DOI] [PubMed] [Google Scholar]
- Overvoorde P, Fukaki H, Beeckman T. 2010. Auxin control of root development. Cold Spring Harbor Perspectives in Biology 2: a001537. [DOI] [PMC free article] [PubMed] [Google Scholar]
- Pickett FB, Wilson AK, Estelle M. 1990. The aux1 mutation of Arabidopsis confers both auxin and ethylene resistance. Plant Physiology 94: 1462–1466. [DOI] [PMC free article] [PubMed] [Google Scholar]
- Rahman A, Bannigan A, Sulaman W, Pechter P, Blancaflor EB, Baskin TI. 2007. Auxin, actin and growth of the Arabidopsis thaliana primary root. The Plant Journal 50: 514–528. [DOI] [PubMed] [Google Scholar]
- Rashotte AM, Poupart J, Waddell CS, Muday GK. 2003. Transport of the two natural auxins, indole‐3‐butyric acid and indole‐3‐acetic acid, in Arabidopsis . Plant Physiology 133: 761–772. [DOI] [PMC free article] [PubMed] [Google Scholar]
- Raven JA. 1975. Transport of indoleacetic acid in plant cells in relation to pH and electrical potential gradients, and its significance for polar IAA transport. New Phytologist 74: 163–172. [Google Scholar]
- Roman G, Lubarsky B, Kieber JJ, Rothenberg M, Ecker JR. 1995. Genetic analysis of ethylene signal transduction in Arabidopsis thaliana: five novel mutant loci integrated into a stress response pathway. Genetics 139: 1393–1409. [DOI] [PMC free article] [PubMed] [Google Scholar]
- Rutschow HL, Baskin TI, Kramer EM. 2014. The carrier AUXIN RESISTANT (AUX1) dominates auxin flux into Arabidopsis protoplasts. New Phytologist 204: 536–544. [DOI] [PubMed] [Google Scholar]
- Sauer M, Kleine‐Vehn J. 2011. AUXIN BINDING PROTEIN1: the outsider. Plant Cell 23: 2033–2043. [DOI] [PMC free article] [PubMed] [Google Scholar]
- Savaldi‐Goldstein S, Peto C, Chory J. 2007. The epidermis both drives and restricts plant shoot growth. Nature 446: 199–202. [DOI] [PubMed] [Google Scholar]
- Scheuring D, Löfke C, Krüger F, Kittelmann M, Eisa A, Hughes L, Smith RS, Hawes C, Schumacher K, Kleine‐Vehn J. 2016. Actin‐dependent vacuolar occupancy of the cell determines auxin‐induced growth repression. Proceedings of the National Academy of Sciences, USA 113: 452–457. [DOI] [PMC free article] [PubMed] [Google Scholar]
- Schultz ER, Zupanska AK, Sng NJ, Paoul A‐L, Ferl RJ. 2017. Skewing in Arabidopsis roots involves disparate environmental signaling pathways. BMC Plant Biology 17: 31. [DOI] [PMC free article] [PubMed] [Google Scholar]
- Sheahan MB, Staiger CJ, Rose RJ, McCurdy DW. 2004. A green fluorescent protein fusion to actin‐binding domain 2 of Arabidopsis fimbrin highlights new features of a dynamic actin cytoskeleton in live plant cells. Plant Physiology 136: 3968–3978. [DOI] [PMC free article] [PubMed] [Google Scholar]
- Shinohara N, Sugiyama M, Fukuda H. 2006. Higher extracellular pH suppresses tracheary element differentiation by affecting auxin uptake. Planta 224: 394–404. [DOI] [PubMed] [Google Scholar]
- Smertenko AP, Deeks MJ, Hussey PJ. 2010. Strategies of actin reorganisation in plant cells. Journal of Cell Science 123: 3019–3028. [DOI] [PubMed] [Google Scholar]
- Staiger CJ, Sheahan MB, Khurana P, Wang X, McCurdy DW, Blanchoin L. 2009. Actin filament dynamics are dominated by rapid growth and severing activity in the Arabidopsis cortical array. Journal of Cell Biology 184: 269–280. [DOI] [PMC free article] [PubMed] [Google Scholar]
- Swarup R, Kargul J, Marchant A, Zadik D, Rahman A, Mills R, Yemm A, May S, Williams L, Millner P et al 2004. Structure‐function analysis of the presumptive Arabidopsis auxin permease AUX1. Plant Cell 16: 3069–3083. [DOI] [PMC free article] [PubMed] [Google Scholar]
- Swarup R, Péret B. 2012. AUX/LAX Family of auxin influx carriers – an overview. Frontiers in Plant Science 3: e225. [DOI] [PMC free article] [PubMed] [Google Scholar]
- Szymanski D, Staiger CJ. 2017. The actin cytoskeleton: functional arrays for cytoplasmic organization and cell shape control. Plant Physiology 176: 106–118. [DOI] [PMC free article] [PubMed] [Google Scholar]
- Szymanski DB, Cosgrove DJ. 2009. Dynamic coordination of cytoskeletal and cell wall systems during plant cell morphogenesis. Current Biology 19: R800–R811. [DOI] [PubMed] [Google Scholar]
- Thomas C. 2012. Bundling Actin filaments from membranes: some novel players. Frontiers in Plant Science 3: e188. [DOI] [PMC free article] [PubMed] [Google Scholar]
- Tominaga M, Kimura A, Yokota E, Haraguchi T, Shimmen T, Yamamoto K, Nakano A, Ito K. 2013. Cytoplasmic streaming velocity as a plant size determinant. Developmental Cell 27: 345–352. [DOI] [PubMed] [Google Scholar]
- Ueda H, Yokota E, Kutsuna N, Shimada T, Tamura K, Shimmen T, Hasezawa S, Dolja VV, Hara‐Nishimuraa I. 2010. Myosin‐dependent endoplasmic reticulum motility and F‐actin organization in plant cells. Proceedings of the National Academy of Sciences, USA 107: 6894–6899. [DOI] [PMC free article] [PubMed] [Google Scholar]
- Ugartechea‐Chirino Y, Swarup R, Swarup K, Péret B, Whitworth M, Bennett M, Bougourd S. 2010. The AUX1 LAX family of auxin influx carriers is required for the establishment of embryonic root cell organization in Arabidopsis thaliana . Annals of Botany 105: 277–289. [DOI] [PMC free article] [PubMed] [Google Scholar]
- Ulmasov T, Hagen G, Guilfoyle TJ. 1999. Activation and repression of transcription by auxin‐response factors. Proceedings of the National Academy of Sciences, USA 96: 5844–5849. [DOI] [PMC free article] [PubMed] [Google Scholar]
- Verbelen JP, De Cnodder T, Le J, Vissenberg K, Baluška F. 2006. The root apex of Arabidopsis thaliana consists of four distinct zones of growth activities: meristematic zone, transition zone, fast elongation zone and growth terminating zone. Plant Signaling & Behavior 1: 296–304. [DOI] [PMC free article] [PubMed] [Google Scholar]
- Vidali L, Burkart GM, Augustine RC, Kerdavid E, Tüzel E, Bezanilla M. 2010. Myosin XI is essential for tip growth in Physcomitrella patens . Plant Cell 22: 1868–1882. [DOI] [PMC free article] [PubMed] [Google Scholar]
- van der Weele CM, Jiang HS, Palaniappan KK, Ivanov VB, Palaniappan K, Baskin TI. 2003. A new algorithm for computational image analysis of deformable motion at high spatial and temporal resolution applied to root growth. Roughly uniform elongation in the meristem and also, after an abrupt acceleration, in the elongation zone. Plant Physiology 132: 1138–1148. [DOI] [PMC free article] [PubMed] [Google Scholar]
- Xu T, Dai N, Chen J, Nagawa S, Cao M, Li H, Zhou Z, Chen X, De Rycke R, Rakusová H et al 2014. Cell surface ABP1‐TMK auxin‐sensing complex activates ROP GTPase signaling. Science 343: 1025–1028. [DOI] [PMC free article] [PubMed] [Google Scholar]
- Xu T, Nagawa S, Yang Z. 2011. Uniform auxin triggers the Rho GTPase‐dependent formation of interdigitation patterns in pavement cells. Small GTPases 2: 227–232. [DOI] [PMC free article] [PubMed] [Google Scholar]
- Xu T, Wen M, Nagawa S, Fu Y, Chen J‐G, Wu M‐J, Perrot‐Rechenmann C, Friml J, Jones AM, Yang Z. 2010. Cell surface‐ and Rho GTPase‐based auxin signaling controls cellular interdigitation in Arabidopsis . Cell 143: 99–110. [DOI] [PMC free article] [PubMed] [Google Scholar]
- Yanagisawa M, Desyatova AS, Belteton SA, Mallery EL, Turner JA, Szymanski DB. 2015. Patterning mechanisms of cytoskeletal and cell wall systems during leaf trichome morphogenesis. Nature Plants 1: e15014. [DOI] [PubMed] [Google Scholar]
- Yang W, Ren S, Zhang X, Gao M, Ye S, Qi Y, Zheng Y, Wang J, Zeng L, Li Q et al 2011. BENT UPPERMOST INTERNODE1 encodes the class II formin FH5 crucial for actin organization and rice development. Plant Cell 23: 661–680. [DOI] [PMC free article] [PubMed] [Google Scholar]
- Yang Y, Hammes UZ, Taylor CG, Schachtman DP, Nielsen E. 2006. High‐affinity auxin transport by the AUX1 influx carrier protein. Current Biology 16: 1160. [DOI] [PubMed] [Google Scholar]
- Yoshimitsu Y, Tanaka K, Fukuda W, Asami T, Yoshida S, Hayashi K‐i, Kamiya Y, Jikumaru Y, Shigeta T, Nakamura Y et al 2011. Transcription of DWARF4 plays a crucial role in auxin‐regulated root elongation in addition to brassinosteroid homeostasis in Arabidopsis thaliana . PLoS ONE 6: e23851. [DOI] [PMC free article] [PubMed] [Google Scholar]
- Zhang W, Cai C, Staiger CJ. 2019. Myosins XI are involved in exocytosis of cellulose synthase complexes. Plant Physiology 179: 1537–1555. [DOI] [PMC free article] [PubMed] [Google Scholar]
- Zhang X, Henriques R, Lin S‐S, Niu QW, Chua N‐H. 2006. Agrobacterium‐mediated transformation of Arabidopsis thaliana using the floral dip method. Nature Protocols 1: 641–646. [DOI] [PubMed] [Google Scholar]
- Zhang Z, Zhang Y, Tan H, Wang Y, Li G, Liang W, Yuan Z, Hu J, Ren H, Zhang D. 2011. RICE MORPHOLOGY DETERMINANT encodes the type II formin FH5 and regulates rice morphogenesis. Plant Cell 23: 681–700. [DOI] [PMC free article] [PubMed] [Google Scholar]
- Zhu J, Bailly A, Zwiewka M, Sovero V, Di Donato M, Ge P, Oehri J, Aryal B, Hao P, Linnert M et al 2016. TWISTED DWARF1 mediates the action of auxin transport inhibitors on actin cytoskeleton dynamics. Plant Cell 28: 930–948. [DOI] [PMC free article] [PubMed] [Google Scholar]
- Zhu J, Geisler M. 2015. Keeping it all together: auxin‐actin crosstalk in plant development. Journal of Experimental Botany 66: 4983–4998. [DOI] [PubMed] [Google Scholar]
- Zou M, Ren H, Li J. 2019. An auxin transport inhibitor targets villin‐mediated actin dynamics to regulate polar auxin transport. Plant Physiology 181: 161–178. [DOI] [PMC free article] [PubMed] [Google Scholar]
Associated Data
This section collects any data citations, data availability statements, or supplementary materials included in this article.
Supplementary Materials
Please note: Wiley‐Blackwell are not responsible for the content or functionality of any Supporting Information supplied by the authors. Any queries (other than missing material) should be directed to the New Phytologist Central Office.
Fig. S1 Arabidopsis thaliana epidermal cells in different root regions exhibit distinct actin filament arrays.
Fig. S2 Actin filament arrays are not predictive of cell width.
Fig. S3 Actin filament arrays are predictive of cell length.
Fig. S4 Actin arrays in A. thaliana root Region 3 are more dynamic than in Region 2.
Fig. S5 Short‐term IAA treatments induce dose‐dependent changes in actin filament organization.
Fig. S6 Short‐term IAA treatments induce a time‐dependent increase in actin filament density and longitudinal orientation.
Fig. S7 Actin filament organization plotted with respect to corresponding cell length in WS and aux1‐100.
Fig. S8 Actin organization in aux1‐22 fails to respond to short‐term IAA treatments but partially responds to the membrane‐permeable auxin NAA.
Fig. S9 Actin filament organization plotted with respect to corresponding cell length in Col‐0 and aux1‐22.
Fig. S10 Actin organization in WT WS fails to respond to short‐term auxin treatments at high pH.
Fig. S11 Epidermal cell elongation rate increases as cells undergo axial expansion in the A. thaliana root elongation zone.
Methods S1 LSFM imaging and analysis.
Methods S2 Genotyping primers.
Methods S3 Detailed methods for quantitative analysis of cortical actin array organization.
Methods S4 Detailed methods for individual actin filament dynamics.
Table S1 Eigenvectors for principal component analysis of cell size vs actin parameters in A. thaliana Col‐0.
Table S2 Eigenvalues for principal component analysis of cell size vs actin parameters in A. thaliana Col‐0.
Table S3 Eigenvectors for principal component analysis of cell size vs actin parameters in A. thaliana WS.
Table S4 Eigenvalues for principal component analysis of cell size vs actin parameters in A. thaliana WS.
Table S5 Eigenvectors for principal component analysis of cell size vs actin parameters in A. thaliana aux1‐100.
Table S6 Eigenvalues for principal component analysis of cell size vs actin parameters in A. thaliana aux1‐100.
Table S7 Actin organization measurements in A. thaliana roots after IAA treatments.
Video S1 Maximum projection of root epidermal cell elongation within the elongation zone over 10 h.