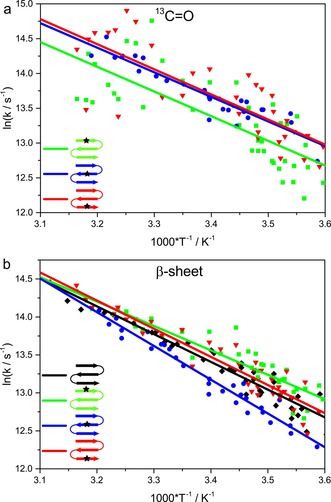
Figure 4.

Relative relaxation behavior of the single‐labeled variants shown as Arrhenius plots. a) 13C=O modes probed at ∼1588 cm−1 for 1W‐4 (green squares) and 1W‐20 (blue circles) and ∼1608 cm−1 for 1W‐13 (red triangles), and b) β‐sheet contribution probed at ∼1629 cm−1, including 1W (black diamonds). The lines represent fits to the Arrhenius equation to provide a qualitative description of the temperature dependence.
