

Abstract
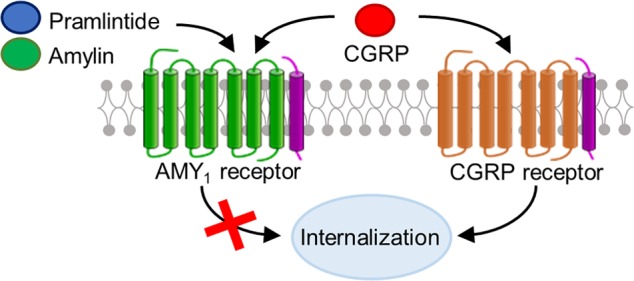
Calcitonin gene-related peptide (CGRP) is a neuropeptide that is involved in the transmission of pain. Drugs targeting CGRP or a CGRP receptor are efficacious in the treatment of migraine. The canonical CGRP receptor is a complex of a G protein-coupled receptor, the calcitonin-like receptor (CLR), with an accessory protein, receptor activity-modifying protein 1 (RAMP1). A second receptor, the AMY1 receptor, a complex of the calcitonin receptor with RAMP1, is a dual high-affinity receptor for CGRP and amylin. Receptor regulatory processes, such as internalization, are crucial for controlling peptide and drug responsiveness. Given the importance of CGRP receptor activity in migraine we compared the internalization profiles of both receptors for CGRP using novel fluorescent probes and a combination of live cell imaging, fixed cell imaging, and ELISA. This revealed stark differences in the regulation of each receptor with the AMY1 receptor unexpectedly showing little internalization.
Keywords: amylin, CGRP, GPCR, internalization, migraine, receptor activity-modifying protein
Migraine is a debilitating illness, which affects approximately 15% of the population.1 Drugs targeting the calcitonin gene-related peptide (CGRP) system have emerged as breakthrough therapies in the treatment of migraine.2
CGRP is a 37 amino acid neuropeptide that is widely expressed in the nervous system, and has an important role in the transmission of pain in migraine.3 Drugs that block CGRP signaling do so either by blocking the CGRP peptide or a CGRP receptor. These drugs have consistently demonstrated efficacy in clinical trials in the treatment of migraine. Currently one monoclonal antibody targeting a CGRP receptor (erenumab) has received clinical approval in addition to three monoclonal antibody drugs targeting the CGRP peptide (galcanezumab, eptinezumab, and fremanezumab). These are also clinically approved.2 Furthermore, several small-molecule drugs that have been designed to target the CGRP receptor are also under development or clinically approved (gepants), including rimegepant, ubrogepant, and atogepant.4
The canonical receptor for CGRP is a heterodimer of a G protein-coupled receptor (GPCR), the calcitonin receptor-like receptor (CLR), with an accessory protein, receptor activity-modifying protein 1 (RAMP1) (Figure 1A).5 Activation of the CGRP receptor results in accumulation of cAMP.6 Following agonist stimulation, the CGRP receptor undergoes internalization in a β-arrestin- and clathrin-dependent manner; chronic stimulation of the CGRP receptor results in trafficking to lysosomes, followed by degradation, whereas transient stimulation results in recycling of the receptor to the cell surface.7,8 The internalization of GPCRs was originally thought to result in the termination of signaling. Several GPCRs including the CGRP receptor have now been observed to signal from endosomes.9,10 In the case of the CGRP receptor, endosomal signaling is reportedly important for CGRP signaling in pain-transmitting neurons.10 Thus, where a receptor resides in a cell potentially represents distinct opportunities or challenges for drug targeting.
Figure 1.
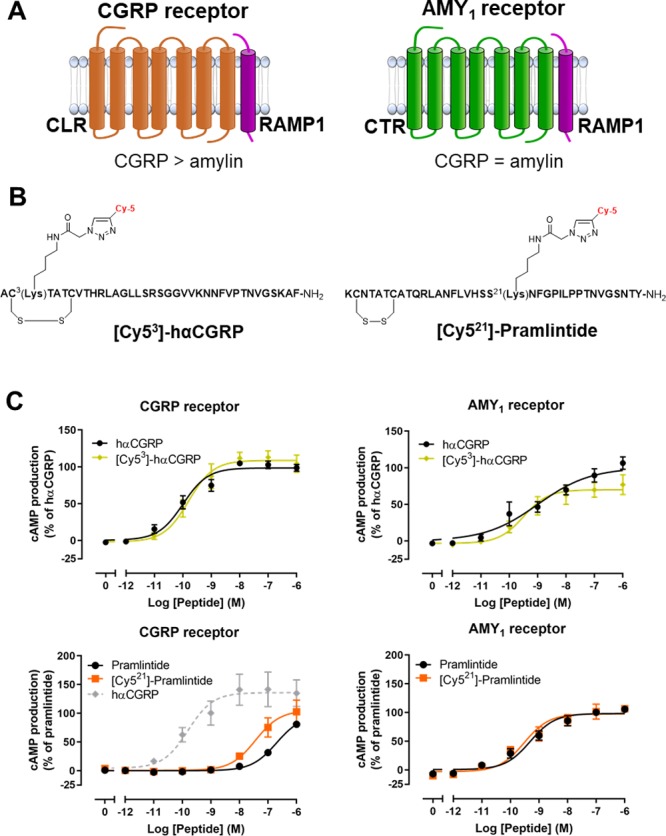
Receptors, fluorescently labeled agonists, and their pharmacology. (A) Overview of CGRP and AMY1 receptors and their pharmacology. In this figure, “>” refers to a difference of ∼100–1000 fold. (B) Peptide sequences, illustrating the position of the Cy5 fluorescent label in CGRP and pramlintide. (C) cAMP production in response to [Cy53]-hαCGRP and [Cy521]-pramlintide at the CGRP and AMY1 receptors, compared to controls in Cos-7 cells. (C) Data points are mean ± the standard error of the mean (s.e.m.), combined from five independent experiments performed in triplicate. Statistical analysis is reported in Table S1.
In addition to the canonical CGRP receptor, there is a second CGRP responsive receptor, the AMY1 receptor, which comprises the calcitonin receptor (CTR) with RAMP15 (Figure 1A). Previous work has found that the AMY1 receptor is also expressed within trigeminal neurons, suggesting it may also be a target for migraine.11 However, this receptor is also a high-affinity receptor for amylin, a peptide that is closely related to CGRP. An amylin analogue, pramlintide is approved for use in insulin-requiring diabetes.12 It is not known what contribution the AMY1 receptor makes, if any, to amylin or CGRP physiology. In contrast to the CGRP receptor, the internalization properties of the AMY1 receptor have not been investigated, although the CTR is reported to undergo internalization.8
To determine how the AMY1 receptor may be regulated and to compare this to CGRP receptor regulation, we developed new fluorescently labeled peptide probes. These have allowed us to investigate the internalization properties of both the AMY1 and CGRP receptors. We observe marked differences in internalization, with the AMY1 receptor undergoing very little internalization in comparison to the CGRP receptor.
Results and Discussion
We developed a series of fluorescent peptides as tools to investigate the internalization properties of the CGRP and AMY1 receptors (Figure 1B and the Supporting Information). hαCGRP labeled at position 3 with a Cy5 fluorophore (Figure 1B), [Cy53]-hαCGRP, was equipotent to unlabeled hαCGRP at stimulating cAMP production at both the CGRP and AMY1 receptors (Figure 1C, S1 and S2, Table S1) consistent with previous results demonstrating that labeling hαCGRP at this position does not affect potency.13 The peptide also had equivalent activity between the CGRP and AMY1 receptors, consistent with the pharmacology of CGRP itself (Table S1).5 This probe was further tested at additional signaling pathways, with similar results (Table S2, Figure S3). We also prepared [Cy521]-hαCGRP, which had a pharmacological profile similar to that of [Cy53]-hαCGRP and hαCGRP at the CGRP and AMY1 receptors (Table S1). The amylin analogue pramlintide was labeled at position 21 with Cy5, resulting in the ligand [Cy521]-pramlintide. Consistent with the pharmacology of amylin and pramlintide, this peptide was ∼100-fold weaker at the CGRP receptor compared to the AMY1 receptor, at which it was a potent agonist that was no different to unlabeled pramlintide (Figure 1C, Table S1). We additionally profiled the activity of all fluorescent peptides at CTR, other amylin receptors (AMY2 and AMY3), and the adrenomedullin receptors (AM1 and AM2), to gain a fuller understanding of effects across the CLR or CTR/RAMP complexes (Figures S1 and S2, Table S1). There was a trend toward increased activity upon peptide labeling. On the basis of these data, between the two CGRP peptides, we selected [Cy53]-hαCGRP for the majority of our experiments because its activity was overall more similar to that of hαCGRP than was the activity of [Cy521]-hαCGRP.
We used [Cy53]-hαCGRP to investigate the internalization properties of the CGRP and AMY1 receptors using live cell imaging. Transiently transfected HEK293S cells were incubated with 100 nM [Cy53]-hαCGRP and imaged. After approximately 15 min, [Cy53]-hαCGRP became visible as puncta within the cytoplasm of CGRP receptor transfected cells (Movie 1). This is similar to our prior observations with a TAMRA-labeled CGRP peptide at this receptor.13 In contrast, in cells transfected with the AMY1 receptor, [Cy53]-hαCGRP staining was clearly visible on the plasma membrane, but very little fluorescence was observed within the cytoplasm in time courses up to 1 h (Movie 2). Movie 3 shows vector-transfected cells incubated with peptide for comparison. In addition, we tested [Cy521]-hαCGRP in live cell imaging, with similar results at both receptors (Figure S4). Imaging of fixed cells was used to quantify the internalization of [Cy53]-hαCGRP at each receptor, by measuring the number of spots within the cytoplasm with the plasma membrane excluded (Figures S5 and S6). For these experiments, transfected HEK293S cells were incubated with [Cy53]-hαCGRP at different time intervals or concentrations up to 4 h (Figures 2A–C and 3A–C).
Figure 2.

CGRP receptor internalizes robustly in response to hαCGRP. (A) Localization of [Cy53]-hαCGRP in CGRP receptor transfected HEK293S cells, which was quantified at (B) varying time points and (C) peptide concentrations. [Cy53]-hαCGRP colocalization with (D) EEA-1 or (E) Myc-RAMP1 and HA-CLR in CGRP receptor transfected HEK293S cells. (F) Changes in cell surface expression of CGRP receptor components by ELISA in HEK293S cells. In panels (A), (D), and (E), the images are representative of five (A, E) or four (D) independent experiments performed in duplicate. White arrows mark examples of spots. Scale bars = 20 μM. Other data are mean ± s.e.m., combined from five to ten (B) or five (C, F) independent experiments performed in duplicate or triplicate. In (B), *, p < 0.05 compared to vector transfected cells by repeated measures two-way ANOVA with a post hoc Bonferroni’s test. In (C), *, p < 0.05 compared to vector transfected cells by Student’s unpaired t-test at 100 nM [Cy53]-hαCGRP. In (F), *, p < 0.05 (myc); †, p < 0.05 (HA) compared to vehicle treated cells (data not shown) at each time point by repeated measures two-way ANOVA with a post hoc Bonferroni’s test. In (A), (B), (D), and (E) 10 nM [Cy53]-hαCGRP was used.
Figure 3.

AMY1 receptor does not internalize robustly in response to hαCGRP. (A) Localization of [Cy53]-hαCGRP in AMY1 receptor transfected HEK293S cells, which was quantified at (B) varying time-points and (C) peptide concentrations (CGRP receptor data are replotted from Figure 2). [Cy53]-hαCGRP localization with (D) EEA-1 or (E) Myc-RAMP1 and HA-CTR in AMY1 receptor transfected HEK293S cells. (F) Cell surface expression of AMY1 receptor components by ELISA in HEK293S cells. In panels (A), (D), and (E), the images are representative of five (A, E) or four (D) independent experiments performed in duplicate. White arrows mark examples of spots. Scale bars = 20 μM. Other data are mean ± s.e.m., combined from five to ten (B), three (C) or five (F) independent experiments performed in duplicate or triplicate. In (B), *, p < 0.05 compared to vector transfected cells; #, p < 0.05 compared to the AMY1 receptor by repeated measures two-way ANOVA with a post hoc Bonferroni’s test. In (C), * p < 0.05 compared to vector transfected cells by Student’s unpaired t-test at 100 nM [Cy53]-hαCGRP. In (F) myc and HA were compared to vehicle control treated cells (data not shown) at each time point by repeated measures two-way ANOVA with a post hoc Bonferroni’s test; there were no significant differences. In (A), (B), (D), and (E) 10 nM [Cy53]-hαCGRP was used.
At the CGRP receptor, there was initially a rapid increase in the number of spots, consistent with agonist-induced receptor internalization, with the maximum level of internalization (mean number of spots per positively transfected cell) being detected after ∼30 min and then remaining stable for up to 4 h (Figure 2B; vector control, Figure S7). This was concentration-dependent with a mean pEC50 for internalization of [Cy53]-hαCGRP being 8.80 ± 0.06 (n = 5; Figure 2C). Quantification of immunofluorescence staining for the early endosomal marker EEA1 revealed colocalization with [Cy53]-hαCGRP (Figures 2D and S8), consistent with previous observations that the CGRP receptor is trafficked to early endosomes following agonist stimulation.7,10,14 We confirmed these results with confocal microscopy (Figure S9). To verify that the [Cy53]-hαCGRP label was found with the CGRP receptor, immunofluorescence staining against the HA tag on CLR was performed and quantified (Figures 2E and S8). To support the immunofluorescence experiments, receptor cell surface expression was also measured using ELISA in HEK293S cells (Figure 2F) and a second cell line (Cos-7; Figure S10). In response to hαCGRP, there was a decrease in the cell surface expression of both CGRP receptor components over time, with a maximum decrease in cell surface expression observed after 60 to 90 min.
When conducting matched experiments at the AMY1 receptor, there was a much smaller increase in the number of spots over time with significantly fewer spots observed at each time point compared to the CGRP receptor (Figure 3A,B). This was an apparent gradual increase over time, compared to the rapid agonist-driven internalization observed at the CGRP receptor (Figure 2B). Approximately 7-fold more [Cy53]-hαCGRP was required to drive AMY1 receptor internalization (pEC50 7.96 ± 0.13; n = 3; *, p < 0.05 vs CGRP receptor by unpaired t-test) (Figure 3C). Even 100 nM peptide produced less internalization at the AMY1 receptor, compared to that at the CGRP receptor; the mean (± s.e.m.; n = 3 or 5) number of spots for each receptor at 100 nM [Cy53]-hαCGRP was 5.64 ± 0.48 (CGRP receptor), compared to 3.15 ± 0.36 (AMY1 receptor; p < 0.05 by unpaired t-test). Higher concentrations of fluorescent ligand were not used due to greater nonspecific binding at 1 μM. EEA1 did not appear to colocalize robustly with [Cy53]-hαCGRP in AMY1 receptor transfected cells (Figures 3D and S8). We confirmed these results with confocal microscopy (Figure S11). [Cy53]-hαCGRP did appear to colocalize with the CTR subunit of the AMY1 receptor but this was mostly on or close to the plasma membrane (Figures 3E and S8). In ELISA experiments at the AMY1 receptor, there was no time-dependent decrease in either receptor component in either cell line in response to hαCGRP (Figures 3F and S12A).
As distinct ligands can differ in their ability to induce receptor internalization,15 we sought to determine whether the lack of internalization observed at the AMY1 receptor was ligand-dependent by measuring the internalization in response to amylin or the fluorescently labeled amylin analogue [Cy521]-pramlintide. In live cell imaging with [Cy521]-pramlintide, clear binding of the ligand to the plasma membrane of AMY1 transfected cells was observed, but very little fluorescence was observed within the cytoplasm (Movie 4). Quantification of the number of [Cy521-pramlintide] spots in fixed cells revealed a gradual increase in the number of spots over time; this was very similar to what we observed with [Cy53]-hαCGRP (Figure 4A,B; vector control Figure S13). Although [Cy521]-pramlintide colocalized with the HA tag on CTR, like [Cy53]-hαCGRP at the AMY1 receptor, there was little colocalization of EEA1 with [Cy521]-pramlintide (Figures 4C and S8). We confirmed these results with confocal microscopy (Figure S14). In ELISA, no decrease in the cell surface expression of either receptor component was observed in response to human amylin in HEK293S or Cos-7 cells, illustrating that these effects are consistent with three different ligands at the AMY1 receptor (Figure 4D, Figure S12B). We performed additional controls showing that CGRP and AMY1 receptor component expression was equivalent (Figure S15) and that the receptor tags were not affecting the outcome (Figure S16). We also developed a potent [Cy514]-human CT probe (pEC50 9.14 ± 0.21; n = 5) which caused accumulation of bright spots in cells (Figures S17 and S18), consistent with the ability of the CTR to internalize.16,17
Figure 4.

AMY1 receptor does not internalize robustly in response to amylin agonists. (A) Localization of 10 nM [Cy521]-pramlintide in AMY1 receptor transfected HEK293S cells, which was quantified at (B) varying time-points ([Cy53]-hαCGRP replotted from Figure 3). [Cy521]-pramlintide (10 nM) localization with (C) EEA-1 in AMY1 receptor transfected HEK293S cells. (D) Cell surface expression of AMY1 receptor components by ELISA in HEK293S cells. In panels (A) and (C), the images are representative of five (A) or three (C) independent experiments performed in duplicate. White arrows mark examples of spots. Scale bars = 20 μM. In (B) and (D), data are mean ± s.e.m., combined from five (B) or three (D) independent experiments performed in duplicate or triplicate. In (B), *, p < 0.05 compared to vector transfected cells; #, p < 0.05 compared to [Cy53]-hαCGRP at the AMY1 receptor by repeated measures two-way ANOVA with post hoc Bonferroni’s test. In (D), myc and HA were compared to vehicle control treated cells (data not shown) at each time point by repeated measures two-way ANOVA with a post hoc Bonferroni’s test; there were no significant differences. hAmy: human amylin.
The duration of agonist stimulation is reported to affect the trafficking profile of the CGRP receptor, with chronic stimulation resulting in trafficking to lysosomes and degradation.8 To determine whether this occurs with the AMY1 receptor, transfected cells were stimulated with 100 nM CGRP or control media for 30 min or 4 h, and receptor degradation was monitored by Western blotting (Figure 5). Stimulation of the CGRP receptor for 4 h was sufficient to induce significant degradation of CLR (with RAMP1). In comparison, no degradation of CTR (with RAMP1) was observed. These data strongly support our findings of the distinct consequences for each receptor in response to ligand stimulation.
Figure 5.
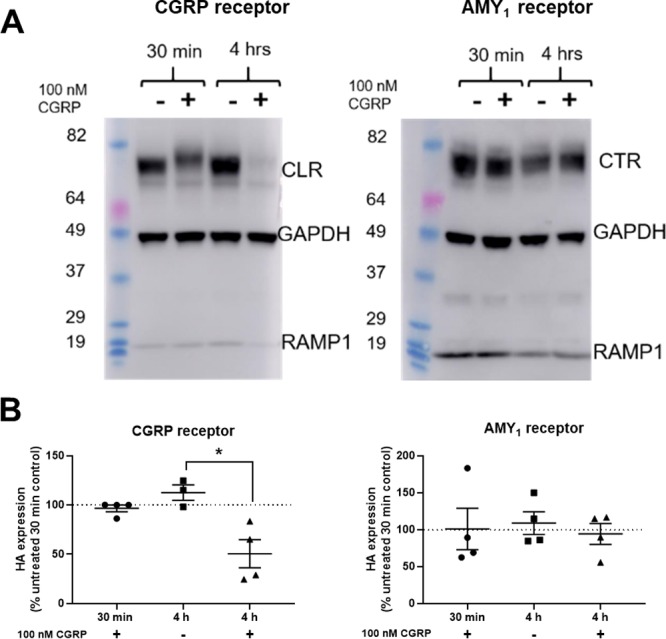
CGRP receptor undergoes agonist-induced degradation, unlike the AMY1 receptor. (A) Western blot of CGRP receptor and AMY1 transfected HEK293S cell lysates treated with 100 nM hαCGRP or vehicle for 30 min or 4 h, probed with anti-HA, anti-GAPDH, and anti-myc antibodies. (B) Quantification of HA-CLR or HA-CTR band intensities from Western blots. In (A), Western blots are representative of four independent experiments. In (B) data are normalized to the untreated 30 min band. *, p < 0.05 by Student’s paired t-test. In (C), the band between the markers at 29 and 37 is consistent with the RAMP1 dimer.
The consequences on signaling are less clear. There is conflicting evidence on whether the CGRP receptor is desensitized in response to agonist stimulation.18,19 CGRP and AMY1 receptors signal through many of the same signaling pathways.20 However, it is not yet known whether CGRP receptor signaling from endosomes results in activation of distinct signaling pathways compared to the AMY1 receptor. Further investigation in native tissues will be required to confirm whether our observed differences in receptor trafficking are a universal difference for these receptors or are cell background-dependent. It would also be useful to better understand the implications on signaling.
A potential mechanistic explanation for our result is that while the overall amino acid sequences of the CLR and CTR are similar (∼70% sequence similarity) there are significant differences within their C-terminal tails. The C-terminal tail is critical for the internalization of the CGRP receptor, with deletion resulting in reduced internalization.21 Many Ser/Thr residues, which are potential phosphorylation sites and likely to drive β-arrestin interactions, are present within the CLR C-terminal tail and intracellular loops. In contrast, CTR has considerably fewer Ser/Thr residues and may therefore be subject to less phosphorylation and be less able to recruit β-arrestins than CLR.8 A similar paradigm has been reported for the β1 and β2 adrenergic receptors, where the β1 adrenergic receptor displays little agonist-induced receptor phosphorylation or internalization compared to the β2 adrenergic receptor.22,23 We speculate that the larger apparent molecular weight of CLR after 30 min of CGRP treatment is due to post-translational modification of the receptor. In contrast, this is not seen with CTR (Figure 5).
Despite the low number of Ser/Thr residues in the intracellular regions of CTR, there are several previous reports of CTR internalization,8 although the mechanisms by which this occurs are unclear as CTR is not reported to interact with arrestins when simulated with peptide agonists.17 It has also been reported that CTR undergoes constitutive agonist-independent recycling.16,17 In our hands, CTR demonstrated some internalization. It is possible that constitutive recycling of CTR accounts for the discrepancy between the limited uptake of labeled peptides and the lack of receptor internalization observed by ELISA in AMY1 receptor transfected cells, although this requires further investigation. Interestingly, it appears that RAMP1 association with CTR reduced its ability to internalize, based on greater internalization of CTR alone compared with CTR co-transfected with RAMP1 (Figure S19). Although the mechanism for this is not known and requires further study, this suggests that RAMP1 is able to affect GPCR regulation. RAMP3 contains a PDZ motif in its C-terminal tail which alters the recycling properties of the AM2 receptor, through its interactions with PDZ domain-containing proteins NHERF and NSF.24,25 An effect of RAMPs on internalization has not previously been reported; therefore, this is a potentially novel function for RAMPs in altering GPCR behavior. We cannot rule out the possibility that AMY1 is undergoing fast recycling or being internalized to a distinct subcellular compartment that is closely associated with the plasma membrane, and this should be investigated in future studies. It will also be important to carefully compare where the ligands and receptors are found in different intracellular pools, including endosomes.
The precise physiological role of CGRP and AMY1 receptors in response to CGRP is unclear, but as both receptors are expressed within the trigeminovascular system,11 both receptors may contribute to CGRP signaling in migraine. Both receptors signal through the same pathways;20 therefore, it has been difficult to determine the role of each receptor. Here we demonstrate a clear functional difference between the CGRP and AMY1 receptors. As the AMY1 receptor appears to be retained at the cell surface in response to CGRP stimulation, under conditions of elevated CGRP such as migraine, it may represent a novel drug target. Furthermore, the potent fluorescently labeled peptides developed in this study have other potential applications, including single-molecule, biodistribution, and binding studies and should enable further investigation of these receptors in native tissues.
Methods
Plasmids
The following DNA constructs were used: human CLR with an N-terminal HA tag in pcDNA3.1, human CTR (a isoform) with an N-terminal HA tag in pcDNA3.1, or untagged CTR. RAMP1 with an N-terminal myc tag, or untagged RAMP1. These constructs have been previously described.26−30 CLR or CTR were transfected in a 1:1 ratio with RAMPs. Where CTR was not transfected with RAMP, pcDNA3.1 was used in its place.
Peptide Chemistry
Unlabeled hαCGRP, hAmylin, or hCT were synthesized in-house as previously described.27,31,32 Human adrenomedullin was from Bachem (Bubendorf, Switzerland). Full details of the synthesis of [Cy53]-hαCGRP, [Cy521]-hαCGRP, [Cy514]-hCT, and[Cy521]-pramlintide are described in the Supporting Information. In all cases, a lysine was incorporated into the sequence in place of the native amino acid to facilitate labeling.
Mammalian Cell Culture and Transfection
HEK293S and Cos-7 cells were cultured as previously described.33 Briefly, cells were cultured in high-glucose DMEM (catalog no. 11965092) (Thermo-fisher, Waltham, MA) supplemented with 8% fetal bovine serum (Life Technologies, Carlsbad, CA) in a 37 °C humidified incubator at 5% CO2.
For live cell imaging and immunofluorescence experiments, HEK293S cells were plated into 96-well cell-carrier or cell-carrier ultra plates (PerkinElmer, Waltham, MA) precoated with poly-d-lysine (catalog no. 354210, Corning, Corning, NY) at a density of 10 000 cells per well. Cells were transfected after 36 h, with 0.25 μg of DNA with polyethylenimine (PEI) as previously described.26 After 24–36 h, cells were used for live cell imaging or immunofluorescence experiments.
For cAMP assays and ELISAs, Cos-7 cells were plated in 96-well SpectraPlates (PerkinElmer) at a density of 20 000 cells per well. HEK293S cells were plated in 96-well CellBind plates (Corning) at a density of 25 000 cells per well. After 24 h, cells were transfected with 0.25 μg of DNA using PEI and cultured for a further 48 h before assays.
For the degradation assays, HEK293S cells were plated into 6-well plates (Greiner, Kremsmuenster, Austria) at a density of ∼500 000 cells per well. After 24 h, cells were transfected with 5 μg of DNA using PEI and cultured for a further 48 h before being assayed.
Live Cell Imaging
Cells were serum-starved in Hank’s Balanced Salt Solution (catalog no. 14025–092, Thermo-Fisher) (HBSS) with 0.1% BSA for 30 min at 37 °C and then placed in the live cell imaging chamber of an Operetta high-content imaging system (PerkinElmer) preincubated at 37 °C and 5% CO2. Cells were imaged once before 100 nM of fluorescently labeled peptide was added. Cells were subsequently imaged every 30 s for 1 h.
Immunofluorescence
Cells were washed and serum-starved for 30 min at 37 °C in DMEM + 0.1% BSA. Cells were incubated with 10 nM of fluorescent peptide, for varying amounts of time at 37 °C. Following incubation cells were washed twice with ice-cold PBS and fixed for 10–20 min with 4% PFA. Following fixation, cells were either permeabilized for staining of intracellular markers and receptors or left as nonpermeabilized for the quantification fluorescent peptide staining.
For nonpermeabilized cells, cells were fixed with 4% PFA for 20 min at room temperature and blocked with PBS containing 10% goat serum for 1 h at room temperature. Cells were then incubated with primary mouse anti-myc antibody at a dilution of 1:250 (catalog no. MABE282, Merck, Darmstadt, Germany) in PBS containing 1% goat serum for 30 min at 37 °C. Cells were then incubated with a secondary anti-mouse Alexa-555 conjugate antibody at a dilution of 1:200 (Life-Technologies catalog no. A32727) in PBS containing 1% goat serum for 30 min at 37 °C. Cells were stained with HCS Cell Mask Blue (Life-technologies catalog no. H32720) in PBS.
For experiments visualizing fluorescent peptides with EEA1, cells were first permeabilized by incubating with TBS-Tween20 in 10% goat serum (Thermo-Fisher) for 30–60 min at room temperature. Cells were then incubated with rabbit anti-HA antibody at a dilution of 1:1000 (catalog no. ab20084, abcam, Cambridge, UK) or anti-EEA1 antibody at 1:500 (catalog no. 610457, BD, Franklin Lakes, NJ), in TBS-T containing 1% goat serum at room temperature for 1 h, followed by staining HCS with HCS Cell Mask (catalog no. H32720) for 30 min at room temperature. For colocalization experiments with anti-HA and anti-myc, antibody incubations were performed at 37 °C for 30 min and anti-rabbit Alexa-555 (Life-Technologies catalog no. A32732) and anti-mouse Alexa-488 (Life-Technologies catalog no. A32723) were used at 1:200 dilutions.
Cells were imaged using an Operetta high-content imaging system in wide-field fluorescence mode using a 40x long WD objective (NA 0.6) (PerkinElmer). Images were stored as 16-bit TIFF files. Images were minimally processed with ImageJ to adjust the color and brightness of images for visualization. Changes were applied consistently across images for comparison.
cAMP Assay
LANCE cAMP assay was performed as previously described.27 All cAMP assays were performed in the presence of 1 mM 3-isobutyl-1-methylxanthine (IBMX) (Sigma-Aldrich, St. Louis, MO) and contained 0.1% DMSO. Briefly, Cos-7 cells were serum starved in cAMP assay media (DMEM + 0.1% BSA + 1 mM IBMX) for 30 min at 37 °C. Peptides were serial diluted in cAMP assay media and cells were incubated with the peptide, media alone or forskolin control for 15 min at 37 °C. Media was then aspirated and the reaction stopped by incubating with ice-cold absolute ethanol. Ethanol was evaporated and cAMP measured using the LANCE cAMP detection kit (PerkinElmer) as previously described.20
Cell-Surface ELISA
ELISA was performed as described previously to determine receptor cell surface expression,34 with the following modification; the secondary antibody step was performed using goat anti-mouse HRP conjugate (catalog no. A16066, Life Technologies) at a 1:500 dilution and incubated for 30 min at 37 °C.
Degradation Assay
HEK293S cells were serum starved with DMEM + 0.1% BSA + 20 μg/mL cyclohexamide (Sigma catalog no. 01810) for 1 h at 37 °C. Cells were stimulated with 100 nM hαCGRP or assay media for either 30 min or 4 h at 37 °C. Following incubation, cells were washed with PBS then detached with a solution of PBS/0.5 mM EDTA. Cells were pelleted by centrifugation at 500 x g. The cell pellet was then resuspended in 1% dodecyl maltoside (DDM) (Anatrace, Maumee, OH), 0.1% Cholesteryl hemisuccinate (Anatrace) supplemented with complete protease inhibitor tablets (Roche, Basel, Switzerland) and incubated for 2 h at 4 °C. The lysate was clarified by centrifugation at 30,000 x g for 20 min. Total protein was determined using a BCA protein assay kit (Pierce, Waltham, MA).
SDS-PAGE and Western Blotting
20–30 μg of whole cell lysates from the degradation assay was loaded on to 4–12% SurePage Bis-Tris gels (GenScript, Piscataway, NJ). An equal amount was loaded in each lane in each individual experiment. There was slight variation between experiments due to variation in the amount of sample obtained. Proteins were transferred to nitrocellulose membranes (Biorad, Hercules, CA) at 100 V for 45 min. Blots were blocked with 5% Milk in TBS-T. Blots were then incubated with mouse anti-HA 1:1000 (catalog no. 901503, Biolegend, San Diego, CA), mouse anti-GAPDH 1:4000 (catalog no. TA802519, Rockville, MD) and mouse anti-myc 1:500 (Merck catalog no. MABE282) antibodies in 5% TBS-T for 1 h at 37 °C. Blots were washed then incubated with goat anti-mouse-HRP conjugate at a dilution of 1:3000 (catalog no. A16066, Life Technologies) for 1 h at room temperature. Blots were developed by incubation with SuperSignal West Pico Plus (Pierce catalog no. 34577) for 5 min. Imaging of blots was performed using an Amersham A600 imager (GE Healthcare, Chicago, IL). Image acquisition was performed using the automated exposure function with the high dynamic range setting.
Image Analysis
All analysis was performed on unprocessed images. Spot counting was performed using Columbus (PerkinElmer). Full details of this analysis are described in Supporting Information (Figure S5, S6). Co-localization analysis was performed in the FIJI distribution of ImageJ using the EzColocalization plugin.35 A cell mask was first applied to cells positive for Cy5 staining, colocalization of Cy5 fluorescence with either HA or EEA1 staining was then determined by measuring Pearson’s correlation coefficient (PCC). A single PCC value was determined for each group from ∼20 cells in each individual experiment. The data were combined to generate a mean value from three to four independent experiments.
Data and Statistical Analysis
All data are the mean ± the standard error of the mean (s.e.m.), combined from three to ten independent experiments. All data were analyzed using Prism GraphPad 8.0.2 (GraphPad Software, La Jolla, CA).
Cell Signaling
For each individual experiment, concentration–response curves were fitted using three or four-parameter nonlinear regression as determined by F-test. Individual pEC50 values were combined to generate mean data. pEC50 values were analyzed using one-way ANOVA with post hoc Dunnett’s test or unpaired Student’s t-test. Data were normalized to the maximum response of the control unmodified peptide in each individual experiment and combined for presentation. Transduction ratios (log(τ/KA)) were quantified using the operational model of agonism as previously described.36 The maximal response window of the system was defined as the largest normalized Emax recorded across the entire data set. All curves were constrained by setting n to 1 and the Emax as the maximal response window of the system. All curves were then fit as “partial agonists” relative to this Emax. Individual log(τ/KA) values were combined to generate mean data. The values of log(τ/KA) were analyzed using one-way ANOVA with post hoc Dunnett’s test or unpaired Student’s t-test.
Spot Counting
For time-course data, five to ten independent experiments were combined, and a repeated two-way ANOVA with a post hoc Bonferroni’s test was carried out comparing spots of fluorescent peptide at each receptor to the vector control at each time-point. For concentration response data, data were analyzed for pEC50 values as described in the “Cell Signaling” section. However, no pEC50 could be generated from vector-transfected cells. Therefore, a Student’s t-test was performed comparing the response at the maximum concentration of fluorescently labeled peptide used.
Cell-Surface ELISA
A total of three to five independent experiments were conducted. In each independent experiment, values were normalized to vector transfected cells (0%) and the receptor component expression in unstimulated cells at 0 min (100%) then combined. Statistical analysis was via repeated measures two-way ANOVA with a post hoc Bonferroni’s test on the combined normalized data comparing receptor component expression in stimulated cells with vehicle-treated cells at each time-point (data not shown).
Western blot images were analyzed in Image Studio Lite v 5.2 (LI-COR biosciences, Lincoln, NE) using the unprocessed TIFF files. The intensity of HA and GAPDH bands was measured by drawing a box around each band. HA band intensity data were normalized to the intensity of the GAPDH loading control, then normalized to the untreated 30 min HA band. Statistical analysis was performed using Student’s unpaired t-test on the raw data.
Supporting Information Available
The Supporting Information is available free of charge at https://pubs.acs.org/doi/10.1021/acsptsci.9b00089.
Additional biology methodology (spot counting: time courses, spot counting: concentration–response curves, confocal microscopy, cell signaling assays: ERK1/2, CREB phosphorylation), cAMP production concentration–response curves and tabulated data with heat map, pERK1/2 and pCREB concentration–response curves and tabulated data, live cell imaging images, spot analysis workflow, cell mask blue and green overlap, vector control data, colocalization data, confocal microscopy images, Cos-7 cell ELISAs, comparison of cell surface expression, untagged receptor ELISAs, and labeled calcitonin data, chemistry general procedure and general methods, synthesis of fluorescent peptides (PDF)
Movies S1–S4: Live cell imaging of [Cy53]-hαCGRP in CGRP receptor transfected HEK293S cells, [Cy53]-hαCGRP in AMY1 receptor transfected HEK293S cells, [Cy53]-hαCGRP in pcDNA transfected HEK293S cells, and [Cy521]-pramlintide in AMY1 transfected HEK293S cells (ZIP)
Author Contributions
# J.J.G. and T.A.R. contributed equally to this work. The manuscript was written through contributions of all authors. All authors have given approval to the final version of the manuscript.
This work was supported by the Marsden Fund (Royal Society of New Zealand) and Auckland Medical Research Foundation. D.L.H. acknowledges receipt of a James Cook Research Fellowship from the Royal Society of New Zealand. C.S.W. acknowledges receipt of a Sir Charles Hercus Health Research Fellowship from the Health Research Council (New Zealand). T.A.R. acknowledges receipt of a Ph.D. scholarship from the University of Auckland. E.R.H. acknowledges receipt of a Ph.D. scholarship from the Auckland Medical Research Foundation.
The authors declare no competing financial interest.
Supplementary Material
References
- (2018) Global, regional, and national burden of migraine and tension-type headache, 1990–2016: a systematic analysis for the Global Burden of Disease Study 2016. Lancet Neurology 17, 954–976. 10.1016/S1474-4422(18)30322-3. [DOI] [PMC free article] [PubMed] [Google Scholar]
- Edvinsson L.; Haanes K. A.; Warfvinge K.; Krause D. N. (2018) CGRP as the target of new migraine therapies - successful translation from bench to clinic. Nat. Rev. Neurol. 14, 338–350. 10.1038/s41582-018-0003-1. [DOI] [PubMed] [Google Scholar]
- Russo A. F. (2015) Calcitonin Gene-Related Peptide (CGRP): A New Target for Migraine. Annu. Rev. Pharmacol. Toxicol. 55, 533–552. 10.1146/annurev-pharmtox-010814-124701. [DOI] [PMC free article] [PubMed] [Google Scholar]
- Negro A.; Martelletti P. (2019) Gepants for the treatment of migraine. Expert Opin. Invest. Drugs 28, 555–567. 10.1080/13543784.2019.1618830. [DOI] [PubMed] [Google Scholar]
- Hay D. L.; Garelja M. L.; Poyner D. R.; Walker C. S. (2018) Update on the pharmacology of calcitonin/CGRP family of peptides: IUPHAR Review 25. Br. J. Pharmacol. 175, 3–17. 10.1111/bph.14075. [DOI] [PMC free article] [PubMed] [Google Scholar]
- Walker C. S.; Conner A. C.; Poyner D. R.; Hay D. L. (2010) Regulation of signal transduction by calcitonin gene-related peptide receptors. Trends Pharmacol. Sci. 31, 476–483. 10.1016/j.tips.2010.06.006. [DOI] [PubMed] [Google Scholar]
- Manoukian R.; Sun H.; Miller S.; Shi D.; Chan B.; Xu C. (2019) Effects of monoclonal antagonist antibodies on calcitonin gene-related peptide receptor function and trafficking. J. Headache Pain 20, 44. 10.1186/s10194-019-0992-1. [DOI] [PMC free article] [PubMed] [Google Scholar]
- Gingell J. J.; Hendrikse E. R.; Hay D. L. (2019) New Insights into the Regulation of CGRP-Family Receptors. Trends Pharmacol. Sci. 40, 71–83. 10.1016/j.tips.2018.11.005. [DOI] [PubMed] [Google Scholar]
- Calebiro D.; Godbole A. (2018) Internalization of G-protein-coupled receptors: Implication in receptor function, physiology and diseases. Best Pract Res. Clin Endocrinol Metab 32, 83–91. 10.1016/j.beem.2018.01.004. [DOI] [PubMed] [Google Scholar]
- Yarwood R. E.; Imlach W. L.; Lieu T.; Veldhuis N. A.; Jensen D. D.; Klein Herenbrink C.; Aurelio L.; Cai Z.; Christie M. J.; Poole D. P.; Porter C. J. H.; McLean P.; Hicks G. A.; Geppetti P.; Halls M. L.; Canals M.; Bunnett N. W. (2017) Endosomal signaling of the receptor for calcitonin gene-related peptide mediates pain transmission. Proc. Natl. Acad. Sci. U. S. A. 114, 12309–12314. 10.1073/pnas.1706656114. [DOI] [PMC free article] [PubMed] [Google Scholar]
- Walker C. S.; Eftekhari S.; Bower R. L.; Wilderman A.; Insel P. A.; Edvinsson L.; Waldvogel H. J.; Jamaluddin M. A.; Russo A. F.; Hay D. L. (2015) A second trigeminal CGRP receptor: function and expression of the AMY1 receptor. Ann. Clin. Transl. Neurol. 2, 595–608. 10.1002/acn3.197. [DOI] [PMC free article] [PubMed] [Google Scholar]
- Hay D. L.; Chen S.; Lutz T. A.; Parkes D. G.; Roth J. D. (2015) Amylin: Pharmacology, Physiology, and Clinical Potential. Pharmacol. Rev. 67, 564–600. 10.1124/pr.115.010629. [DOI] [PubMed] [Google Scholar]
- Yule L. R.; Garelja M. L.; Hendrikse E. R.; Gingell J. J.; Poyner D. R.; Harris P. W. H.; Brimble M. A.; Hay D. L. (2019) A potent fluorescent calcitonin gene-related peptide analogue enables visualization of receptor internalization. Peptide Science 111, e24126. 10.1002/pep2.24126. [DOI] [Google Scholar]
- Padilla B. E.; Cottrell G. S.; Roosterman D.; Pikios S.; Muller L.; Steinhoff M.; Bunnett N. W. (2007) Endothelin-converting enzyme-1 regulates endosomal sorting of calcitonin receptor-like receptor and -arrestins. J. Cell Biol. 179, 981–997. 10.1083/jcb.200704053. [DOI] [PMC free article] [PubMed] [Google Scholar]
- Keith D. E.; Murray S. R.; Zaki P. A.; Chu P. C.; Lissin D. V.; Kang L.; Evans C. J.; von Zastrow M. (1996) Morphine activates opioid receptors without causing their rapid internalization. J. Biol. Chem. 271, 19021–19024. 10.1074/jbc.271.32.19021. [DOI] [PubMed] [Google Scholar]
- Findlay D. M.; Martin T. J. (1984) Relationship between internalization and calcitonin-induced receptor loss in T 47D cells. Endocrinology 115, 78–83. 10.1210/endo-115-1-78. [DOI] [PubMed] [Google Scholar]
- Dal Maso E.; Just R.; Hick C.; Christopoulos A.; Sexton P. M.; Wootten D.; Furness S. G. B. (2018) Characterization of signalling and regulation of common calcitonin receptor splice variants and polymorphisms. Biochem. Pharmacol. 148, 111–129. 10.1016/j.bcp.2017.12.016. [DOI] [PubMed] [Google Scholar]
- Hay D. L.; Poyner D. R.; Smith D. M. (2003) Desensitisation of adrenomedullin and CGRP receptors. Regul. Pept. 112, 139–145. 10.1016/S0167-0115(03)00032-6. [DOI] [PubMed] [Google Scholar]
- Pin S. S.; Xu C.; Bahr B. A. (2007) Desensitization and re-sensitization of CGRP receptor function in human neuroblastoma SK-N-MC cells. Eur. J. Pharmacol. 577, 7–16. 10.1016/j.ejphar.2007.08.014. [DOI] [PubMed] [Google Scholar]
- Walker C. S.; Raddant A. C.; Woolley M. J.; Russo A. F.; Hay D. L. (2018) CGRP receptor antagonist activity of olcegepant depends on the signalling pathway measured. Cephalalgia 38, 437–451. 10.1177/0333102417691762. [DOI] [PMC free article] [PubMed] [Google Scholar]
- Conner M.; Hicks M. R.; Dafforn T.; Knowles T. J.; Ludwig C.; Staddon S.; Overduin M.; Gunther U. L.; Thome J.; Wheatley M.; Poyner D. R.; Conner A. C. (2008) Functional and Biophysical Analysis of the C-Terminus of the CGRP-Receptor; a Family B GPCR†. Biochemistry 47, 8434–8444. 10.1021/bi8004126. [DOI] [PubMed] [Google Scholar]
- Shiina T.; Kawasaki A.; Nagao T.; Kurose H. (2000) Interaction with beta-arrestin determines the difference in internalization behavor between beta1- and beta2-adrenergic receptors. J. Biol. Chem. 275, 29082–29090. 10.1074/jbc.M909757199. [DOI] [PubMed] [Google Scholar]
- Liang W.; Curran P. K.; Hoang Q.; Moreland R. T.; Fishman P. H. (2004) Differences in endosomal targeting of human (beta)1- and (beta)2-adrenergic receptors following clathrin-mediated endocytosis. J. Cell Sci. 117, 723–734. 10.1242/jcs.00878. [DOI] [PubMed] [Google Scholar]
- Bomberger J. M.; Parameswaran N.; Hall C. S.; Aiyar N.; Spielman W. S. (2005) Novel function for receptor activity-modifying proteins (RAMPs) in post-endocytic receptor trafficking. J. Biol. Chem. 280, 9297–9307. 10.1074/jbc.M413786200. [DOI] [PubMed] [Google Scholar]
- Bomberger J. M.; Spielman W. S.; Hall C. S.; Weinman E. J.; Parameswaran N. (2005) Receptor activity-modifying protein (RAMP) isoform-specific regulation of adrenomedullin receptor trafficking by NHERF-1. J. Biol. Chem. 280, 23926–23935. 10.1074/jbc.M501751200. [DOI] [PubMed] [Google Scholar]
- Bailey R. J.; Hay D. L. (2006) Pharmacology of the human CGRP1 receptor in Cos 7 cells. Peptides 27, 1367–1375. 10.1016/j.peptides.2005.11.014. [DOI] [PubMed] [Google Scholar]
- Bower R. L.; Yule L.; Rees T. A.; Deganutti G.; Hendrikse E. R.; Harris P. W. R.; Kowalczyk R.; Ridgway Z.; Wong A. G.; Swierkula K.; Raleigh D. P.; Pioszak A. A.; Brimble M. A.; Reynolds C. A.; Walker C. S.; Hay D. L. (2018) Molecular Signature for Receptor Engagement in the Metabolic Peptide Hormone Amylin. ACS Pharmacology & Translational Science 1, 32–49. 10.1021/acsptsci.8b00002. [DOI] [PMC free article] [PubMed] [Google Scholar]
- McLatchie L. M.; Fraser N. J.; Main M. J.; Wise A.; Brown J.; Thompson N.; Solari R.; Lee M. G.; Foord S. M. (1998) RAMPs regulate the transport and ligand specificity of the calcitonin-receptor-like receptor. Nature 393, 333–339. 10.1038/30666. [DOI] [PubMed] [Google Scholar]
- Qi T.; Dong M.; Watkins H. A.; Wootten D.; Miller L. J.; Hay D. L. (2013) Receptor activity-modifying protein-dependent impairment of calcitonin receptor splice variant Δ(1–47)hCT(a) function. Br. J. Pharmacol. 168, 644–657. 10.1111/j.1476-5381.2012.02197.x. [DOI] [PMC free article] [PubMed] [Google Scholar]
- Kowalczyk R.; Brimble M. A.; Tomabechi Y.; Fairbanks A. J.; Fletcher M.; Hay D. L. (2014) Convergent chemoenzymatic synthesis of a library of glycosylated analogues of pramlintide: structure-activity relationships for amylin receptor agonism. Org. Biomol. Chem. 12, 8142–8151. 10.1039/C4OB01208A. [DOI] [PubMed] [Google Scholar]
- Harris P. W. R.; Kowalczyk R.; Hay D. L.; Brimble M. A. (2013) A Single Pseudoproline and Microwave Solid Phase Peptide Synthesis Facilitates an Efficient Synthesis of Human Amylin 1–37. Int. J. Pept. Res. Ther. 19, 147–155. 10.1007/s10989-012-9325-9. [DOI] [Google Scholar]
- Hay D. L.; Harris P. W.; Kowalczyk R.; Brimble M. A.; Rathbone D. L.; Barwell J.; Conner A. C.; Poyner D. R. (2014) Structure-activity relationships of the N-terminus of calcitonin gene-related peptide: key roles of alanine-5 and threonine-6 in receptor activation. Br. J. Pharmacol. 171, 415–426. 10.1111/bph.12464. [DOI] [PMC free article] [PubMed] [Google Scholar]
- Gingell J. J.; Burns E. R.; Hay D. L. (2014) Activity of Pramlintide, Rat and Human Amylin but not Abeta1–42 at Human Amylin Receptors. Endocrinology 155, 21–26. 10.1210/en.2013-1658. [DOI] [PubMed] [Google Scholar]
- Gingell J. J.; Simms J.; Barwell J.; Poyner D. R; Watkins H. A; Pioszak A. A; Sexton P. M; Hay D. L (2016) An allosteric role for receptor activity-modifying proteins in defining GPCR pharmacology. Cell Discov 2, 16012. 10.1038/celldisc.2016.12. [DOI] [PMC free article] [PubMed] [Google Scholar]
- Stauffer W.; Sheng H.; Lim H. N. (2018) EzColocalization: An ImageJ plugin for visualizing and measuring colocalization in cells and organisms. Sci. Rep. 8, 15764. 10.1038/s41598-018-33592-8. [DOI] [PMC free article] [PubMed] [Google Scholar]
- van der Westhuizen E. T.; Breton B.; Christopoulos A.; Bouvier M. (2014) Quantification of ligand bias for clinically relevant beta2-adrenergic receptor ligands: implications for drug taxonomy. Mol. Pharmacol. 85, 492–509. 10.1124/mol.113.088880. [DOI] [PubMed] [Google Scholar]
Associated Data
This section collects any data citations, data availability statements, or supplementary materials included in this article.