

Summary
Erythroid commitment and differentiation are regulated by the coordinated action of a host of transcription factors, including GATA2 and GATA1. Here, we explored GATA-mediated transcriptional regulation through the integrative analysis of gene expression, chromatin modifications, and GATA factors' binding in human multipotent hematopoietic stem/progenitor cells, early erythroid progenitors, and late precursors. A progressive loss of H3K27 acetylation and a diminished usage of active enhancers and super-enhancers were observed during erythroid commitment and differentiation. GATA factors mediate transcriptional changes through a stage-specific interplay with regulatory elements: GATA1 binds different sets of regulatory elements in erythroid progenitors and precursors and controls the transcription of distinct genes during commitment and differentiation. Importantly, our results highlight a pivotal role of promoters in determining the transcriptional program activated upon erythroid differentiation. Finally, we demonstrated that GATA1 binding to a stage-specific super-enhancer sustains the expression of the KIT receptor in human erythroid progenitors.
Subject Areas: Biological Sciences, Molecular Biology, Molecular Mechanism of Gene Regulation, Cell Biology
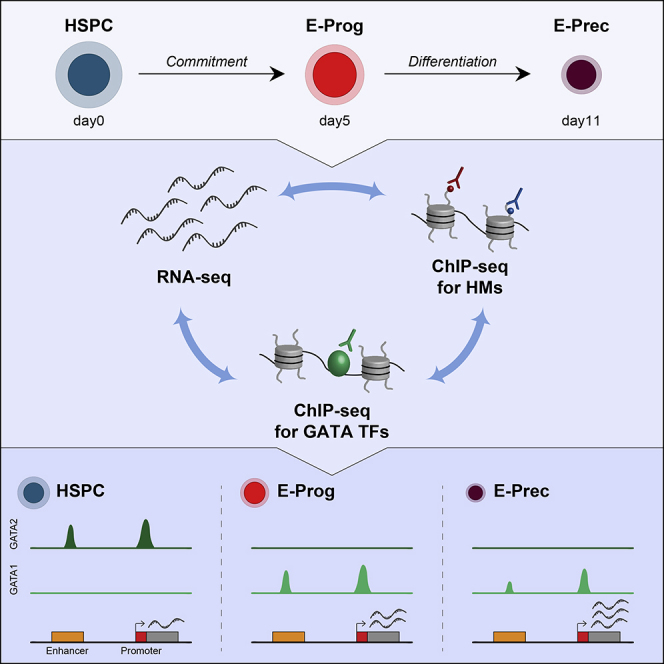
Graphical Abstract
Highlights
-
•
GATA2/1 binding to regulatory regions and transcriptional changes during erythropoiesis
-
•
GATA1 sustains KIT expression in human erythroid progenitors
Biological Sciences; Molecular Biology; Molecular Mechanism of Gene Regulation; Cell Biology
Introduction
The acquisition of cellular identity during stem cell commitment and differentiation relies on a combination of genetic and epigenetic information that ultimately determines cellular transcriptional outputs. Master transcription factors are responsible for the selection of unique enhancer repertoires and activate a cascade of epigenetic events (e.g., modification of histone tails and loss of DNA methylation) that could lead to cell-specific modulation of gene expression (Heinz et al., 2015). Recent advances in genome-wide technologies and bioinformatic data integration allow the elucidation of the molecular mechanisms underlying cell fate decision and lineage development with unprecedented levels of detail by analyzing transcriptional and epigenetic changes occurring at different stages of lineage progression.
Human erythropoiesis is an ideal model for studying mechanisms regulating cell commitment and differentiation as the individual developmental cell stages can be isolated and surface markers as well as the master transcription factors controlling this process are largely known. Erythropoiesis is a multi-step process that includes early erythroid commitment of hematopoietic stem cells (HSC), terminal erythroid differentiation, and reticulocyte maturation (Dzierzak and Philipsen, 2013). During early erythroid commitment, HSC give rise to highly proliferating committed erythroid progenitors, erythroid burst-forming units (BFU-Es), and then erythroid colony-forming units (CFU-Es). Erythroid progenitors subsequently undergo terminal differentiation, sequentially producing different populations of erythroid precursors (proerythroblasts, basophilic, polychromatic, and orthochromatic erythroblasts). During this process, cell size is progressively reduced and the cell membrane is reorganized; the cytoplasm first becomes basophilic, as ribosomes accumulate, and then eosinophilic, due to massive production of hemoglobin, whereas the nucleus becomes smaller, as a result of the progressive chromatin condensation. Finally, orthochromatic erythroblasts extrude their nuclei, endoplasmic reticulum, and mitochondria, generating reticulocytes. During maturation, reticulocytes lose the ribosomes and reorganize the cytoskeleton and cell membrane to acquire the distinctive biconcave shape of red blood cells.
Each developmental stage is characterized by a distinct transcriptional program, with a burst of erythroid-specific genes' expression occurring at the early stage of development, followed by the gradual silencing of the transcriptome in late erythroid precursors (An et al., 2014, Li et al., 2014). These transcriptional changes are governed by complex regulatory networks, consisting of the functional interplay between genomic regulatory regions (i.e., promoters and enhancers) and master transcription factors. In particular, enhancers are the primary determinants of the gene expression program at the early stage of erythropoiesis (Huang et al., 2016, Romano et al., 2016, Xu et al., 2012).
GATA2 and GATA1 transcription factors are essential for hematopoietic development and recognize similar GATA DNA motifs. GATA2 has a fundamental role in the expansion and survival of hematopoietic stem and progenitor cells (HSPC) and has been mainly described as a positive regulator of gene expression (Vicente et al., 2012). GATA1 is the master regulator of erythropoiesis and functions as an activator or repressor depending on the chromatin context and cofactors (Ferreira et al., 2005). During erythropoiesis, the GATA2 locus is shut down, whereas GATA1 levels increase, and this transcriptional change (known as GATA factor switching) is essential for survival and terminal differentiation of erythroid cells (Bresnick et al., 2010, Moriguchi and Yamamoto, 2014, Suzuki et al., 2013). As an example, in murine erythroid progenitors, GATA2 enhances the expression of the stem cell factor receptor KIT, which is essential for their proliferation, whereas GATA1 is responsible for KIT down-regulation, which is required to achieve terminal differentiation (Hong et al., 2005, Jing et al., 2008, Munugalavadla et al., 2005). A GATA2-to-GATA1 exchange takes place at specific genomic sites containing GATA DNA motifs (“GATA switching sites”) and is critical to determine changes in the expression of target genes during erythroid development (Bresnick et al., 2010, Dore et al., 2012, Huang et al., 2016, Moriguchi and Yamamoto, 2014). Several studies investigated GATA2 and GATA1 genome-wide occupancy in both mouse (Cheng et al., 2009, Dore et al., 2012, May et al., 2013, Wu et al., 2011, Yu et al., 2009) and human hematopoietic cells (Beck et al., 2013, Fujiwara et al., 2009, Hu et al., 2011, Huang et al., 2016, Ludwig et al., 2019, Schulz et al., 2019, Su et al., 2013, Xu et al., 2012). However, a comprehensive analysis of the dynamics of GATA factor binding to regulatory elements during erythroid commitment and differentiation is still lacking.
Here, we investigated the epigenetic and transcriptional changes occurring during human erythroid development. Integrating RNA sequencing (RNA-seq) data, chromation immunopreciptation sequencing (ChIP-seq) analysis of histone modifications typical of regulatory elements, and GATA factors' binding profiles in human HSPC, early erythroid progenitors, and late precursors, we shed light on the regulatory mechanisms controlling stage-specific transcriptional programs and on the distinct role of GATA1 in the early and late phases of human erythropoiesis. The novel key points of our study are as follows: (1) a progressive decrease of H3K27 acetylation, a histone mark typical of active regulatory regions, is a major epigenetic change during erythroid development and is associated with a reduction of active enhancers and super-enhancers (SEs) upon differentiation; (2) promoters are the primary determinants of the gene expression program at the late stage of erythropoiesis; (3) integration of the chromatin landscape and GATA1 occupancy revealed that GATA1 plays a crucial role in determining the global transcriptional changes occurring during erythroid development; (4) GATA1 exerts its transcriptional activity by occupying mainly promoters in late precursors; and (5) differently from mouse cells, GATA1 activates KIT gene expression in human erythroid progenitors.
Results
Transcriptional Profiling Reveals Major Changes of Gene Expression upon Erythroid Differentiation
To gain a comprehensive view of gene expression changes occurring during erythroid development, we performed RNA-seq analysis of human HSPC differentiated in vitro into early committed erythroid progenitors (E-Prog; CD34lowCD36+GYPAlow) and late erythroid precursors (E-Prec; CD34−CD36+GYPAhigh) (Figure 1A and S1A–S1C). E-Prog contain BFU-E and CFU-E progenitors (Figure S1C and Romano et al., 2016), and E-Prec population consists mainly of polychromatic erythroid precursors (Figure S1C and data not shown). Overall, most genes displayed a lower expression level in E-Prec compared with HSPC and E-Prog (Figure S1D; An et al., 2014, Wong et al., 2011, Shi et al., 2014). Supervised analysis identified 2,485 differentially expressed genes (DEGs) during commitment (1,203 up-regulated and 1,282 down-regulated in HSPC-to-E-Prog transition; Figure S1E) and 6,496 DEGs upon differentiation (2,983 up-regulated and 3,513 down-regulated genes in E-Prog-to-E-Prec transition; Figure S1E). We classified all 7,469 unique DEGs in eight groups, according to their modulation during erythroid development (Figure 1B). Some DEGs were up- or down-regulated only in one transition (groups 1 and 5 upon commitment and groups 3 and 7 upon differentiation); others were progressively modulated during erythroid development (groups 2 and 6) or showed a non-monotonic expression pattern (groups 4 and 8). Different gene expression patterns reflected specific biological processes (Figure S1F). As reported in other studies (Li et al., 2014, Shi et al., 2014, Wong et al., 2011), genes progressively up-regulated during erythroid development (group 2) were related to hemoglobin synthesis and erythrocyte differentiation. Interestingly, we identified novel classes of genes specifically up-regulated during the differentiation phase (group 3), including genes involved in DNA packaging and chromosome condensation, in accordance with the heterochromatinization known to occur at late stages of erythropoiesis (Ji, 2015). Conversely, HSPC-specific markers (i.e., CD34 and CD133) or genes involved in other blood lineages' biology were down-regulated during commitment (group 5) or progressively down-regulated during erythroid development (group 6), whereas genes related to ribosome biogenesis were down-regulated in the differentiation phase (group 7), consistently with the ribosome loss occurring during terminal maturation (Moras et al., 2017). Interestingly, genes up-regulated upon erythroid commitment and down-regulated during differentiation (group 4) were involved in metal ion transport, cell morphogenesis, cytokine production, and signaling pathways, and included KIT, a gene essential for E-Prog survival and proliferation that must be down-regulated to achieve terminal erythroid maturation (Munugalavadla and Kapur, 2005).
Figure 1.

Changes in the Transcriptomic and Epigenomic Profile during Erythroid Development
(A) Schematic representation of erythroid development. HSPC are committed toward the erythroid lineage giving rise to E-Prog that then differentiate in E-Prec. Gray bars describe the expression of CD34, CD36, and GYPA surface markers during erythroid development. See also Figure S1.
(B) Different groups of DEGs, defined according to their modulation (up- or down-regulation) during erythroid commitment (HSPC to E-Prog) and differentiation (E-Prog to E-Prec). See also Figure S1.
(C–E) Bar plots showing the number of promoters (C), enhancers (D), and super-enhancers (E) identified in each cell population. Promoters and enhancers were classified as active (H3K27ac+H3K27me3-), weak (H3K27ac−H3K27me3-), or bivalent (H3K27ac−H3K27me3+). Active enhancers were used as constituent enhancers to identify super-enhancers. See also Figure S2 and Table S1.
(F–H) Heatmaps showing the dynamic usage of promoters (F), enhancers (G), and super-enhancers (H) during erythroid commitment and differentiation. Each row represents a regulatory region. The color code indicates active, weak, and bivalent regulatory regions at each stage of erythroid development. White color indicates absence of the regulatory region. See also Figures S3 and S4 and Tables S2, S3, and S4.
Active Chromatin Regions Are Lost during Erythroid Commitment and Differentiation
To investigate the chromatin changes occurring during erythroid development, we analyzed the genome-wide distribution of histone modifications typically associated with promoters (H3K4me3) and enhancers (H3K4me1), active regulatory regions (H3K27ac), and Polycomb repression (H3K27me3). The fraction of the genome enriched in H3K4me3 was comparable across all stages, whereas genome coverage for all other histone modifications was reduced in E-Prog and E-Prec compared with HSPC. In particular, the coverage of H3K27ac and the amount of H3 histones harboring this modification progressively decreased during erythroid development (Figures S2A and S2B).
To define the epigenetic landscape in a systematic manner, we exploited a machine learning approach to identify chromatin states using these four histone marks with a resolution of 200 bp. We defined five promoter states (H3K4me3+), four enhancer states (H3K4me1+), a polycomb-repressed state (H3K27me3+), and a quiescent state devoid of any histone mark (Figures S2C and S2D). Based on the presence of H3K27ac or H3K27me3, we classified promoter and enhancer states as active (H3K27ac+H3K27me3-), weak (H3K27ac−H3K27me3-), or bivalent (H3K27ac−H3K27me3+; Ernst et al., 2011, Roadmap Epigenomics Consortium et al., 2015). Finally, we merged contiguous genomic segments (see Methods) to define different sets (active, weak, and bivalent) of promoter and enhancer regions (with a minimum size of 400 bp) for each stage of erythroid development (Tables S1, S2, and S3). Moreover, we defined SEs as clusters of active enhancers (Tables S1 and S4; Whyte et al., 2013, Hnisz et al., 2013). To validate our approach, we analyzed the expression levels of genes associated with different classes of regulatory elements. Genes associated with active regulatory regions showed higher expression levels compared with genes associated with weak or bivalent regions, which were expressed at medium and low levels, respectively (Figures S2E and S2F). We identified around 20,000 promoters in HSPC and E-Prog and 15,868 in E-Prec (Figure 1C), more than 45,000 enhancers in HSPC and E-Prog and only 21,337 in E-Prec Figure 1D, and 497 SEs in HSPC, 436 in E-Prog, and only 135 in E-Prec (Figure 1E). Most of the regulatory elements were active in HSPC, whereas the fraction of active promoters (Figures 1C and S2D), enhancers (Figures 1D and S2D), and SEs (Figure 1E) diminished in E-Prog and E-Prec in accordance with the progressive loss of H3K27ac during erythroid development.
Interestingly, most promoters were shared during erythroid development, with only 10% being stage specific (Figures 1F and S3A). Promoters that maintained an active state throughout erythroid development drove the expression of genes involved in common cell functions, as cell metabolism, cell cycle, and chromatin organization (Figure S3B). Bivalent promoters that maintained their state in both commitment and differentiation or completely lost H3K4me3 were associated with genes involved in non-hematopoietic tissue and organ development that need to be repressed to maintain lineage fidelity (Figure S3B). Interestingly, genes related to erythropoiesis were associated with either active promoters that maintained their state during the entire erythroid development or E-Prec-specific promoters.
Enhancer usage dramatically changed during commitment and differentiation, resulting in almost 40% enhancers being stage-specific in each cell type (Figures 1G and S3C). Genes targeted by active and weak stage-specific enhancers in HSPC were mainly involved in leukocyte differentiation, whereas in E-Prog they were related to chromosome organization, cytoskeleton and plasma membrane organization, and cell cycle, and in E-Prec they were related to erythrocyte differentiation, chromatin organization, and autophagy (Figure S3D).
SEs' usage was almost completely stage specific, with less than 30% SEs identified in a single cell type shared with the other stages (Figures 1H and S4A). HSPC-specific SEs were annotated to genes involved in leukocyte biology (Figure S4B) and to stem cell markers as DNMT3A, CD34, PROM1 (CD133), RUNX2/RUNX3, FLI1, ERG, and GFI1 (Figure S4C). Instead, genes targeted by E-Prog- and E-Prec-specific SEs were mostly related to erythrocyte biology, such as CD55, RHAG, HBS1L, CD36, SLC44A1, SLC40A1, and SPTA1 in E-Prog and RHD RBM38, HEMGN, TMEM56, SLC2A1, SLC22A23, SLC25A37, SLC22A4, and HBE1 (beta-globin locus control region) in E-Prec (Figures S4D and S4E). Only few loci (n = 60; e.g., KIT gene) displayed a combination of common and stage-specific SEs, suggesting a fine modulation of the expression of these genes during erythroid differentiation (see Figure 4).
Figure 4.

Epigenetic Regulation and Chromatin Interactions in the Human KIT Locus during Erythroid Development
(A) KIT mRNA expression levels in HSPC, E-Prog, and E-Prec, as determined by RT-qPCR. Data were plotted as mean with SEM. ∗p < 0.05 (unpaired t test).
(B) Flow cytometry analysis of KIT expression during erythroid commitment and differentiation. The percentage of KIT+ cells and the MFI (median fluorescence intensity) are shown. Data were plotted as mean with SEM. ∗∗p < 0.01; ∗∗∗p < 0.001; ∗∗∗∗p < 0.0001 (unpaired t test).
(C) Regulatory elements and GATA factors BS within the KIT locus. Green boxes indicate SEs. Orange dashed boxes indicate the constituent enhancers within the E-Prog-specific super-enhancer. Enhancer I and II (E-I and E-II) show the highest H3K27ac peaks. Enhancer III (E-III) is homologous to the mouse −114 enhancer. Enhancer IV (E-IV) undergoes GATA2-to-GATA1 switch. SNPs mapping to the E-Prog-specific super-enhancer are indicated.
(D) Chromatin interactions within the KIT locus in undifferentiated (Day 0) and differentiated (Day 7) HUDEP-2 cells. We used as anchor a genomic fragment containing the KIT promoter (flanked by solid black lines). HindIII digestion fragments of interest are flanked by dashed black lines. Distances on the x axis are in kb counting from the transcription start site (TSS) of the KIT gene. KIT promoter interacts with Enhancer I and II only in KIThigh HUDEP-2 undifferentiated cells. See also Figure S8.
GATA Transcription Factors' Occupancy during Erythroid Commitment and Differentiation
To elucidate how GATA factors regulate gene expression during erythroid development, we analyzed GATA2 and GATA1 binding profiles in HSPC, E-Prog, and E-Prec. Although GATA2 mRNA levels were comparable in HSPC and E-Prog (Figure 2A), GATA2 protein was present at high levels in HSPC and decreased during erythroid development (Figure 2B). GATA1 protein was mainly present in E-Prog and substantially reduced in E-Prec (Figures 2B and S5A and Ludwig et al., 2019) despite the progressive increase of GATA1 mRNA expression during differentiation (Figure 2A). The dynamic expression of GATA proteins clearly emerged when analyzing GATA factors' genome-wide occupancy. Indeed, the large number of GATA2-binding sites (BS) identified in HSPC (n = 15,171) drastically decreased in E-Prog cells (n = 419) and was reduced to zero in E-Prec (Figure 2C, Table S5 and Figures S5B and S5C). Similarly, we identified more than 23,000 GATA1 BS in E-Prog and almost half of these in E-Prec (n = 11,005), whereas no GATA1 BS was recovered in HSPC (Figure 2C, Table S5 and Figures S5B and S5C). Virtually all GATA2 BS were HSPC specific, and one-third of them underwent a GATA2-to-GATA1 switch during HSPC-to-E-Prog transition and 40% of these remained bound by GATA1 in E-Prec (Figure 2C). E-Prog and E-Prec shared ∼7,000 GATA1 BS, whereas ∼16,000 and ∼4,000 stage-specific GATA1 BS were identified in E-Prog and E-Prec, respectively (Figure 2C). These data indicate that GATA1 occupies and regulates common and different genes during the early and late stages of erythroid development.
Figure 2.

GATA Factors Occupancy during Erythroid Development
(A) Expression levels of GATA2 and GATA1 in HSPC, E-Prog, and E-Prec by RNA-seq. Data were plotted as mean with SEM.
(B) Western blot analysis of GATA2 and GATA1 in the nuclear fraction of HSPC, E-Prog, and E-Prec. Total H3 was used for normalization. See also Figure S5.
(C) Heatmap showing GATA2 and GATA1 BS dynamics during erythroid commitment and differentiation. Each row represents a GATA factor BS. The number of BS identified in each population is reported below the heatmap. Dashed lines separate common and stage-specific BS. See also Figure S5 and Table S5.
(D) GATA2 and GATA1 BS distribution within regulatory regions in HSPC, E-Prog, and E-Prec. See also Figure S6.
(E) Heatmap showing different groups of GATA2-and GATA1-targeted genes in HSPC, E-Prog, and E-Prec. We defined GATA2- and GATA1-targeted genes as the three nearest genes (with a maximum distance of 100 kb) to each GATA-targeted regulatory region. Each target gene can be associated with one or more GATA BS.
(F) Heatmap showing the enrichment of the different groups of GATA factor target genes, as defined in (E), in genes with different expression patterns (as defined in Figure 1B). Gray-scale indicates enrichment p value. See also Figure S6.
(G) Gene ontology enrichment analysis of GATA2- and GATA1-targeted genes. Enriched Biological Process (BP) terms are shown on the y axis; different groups of GATA factor target genes, as defined in (E), are shown on the x axis. Dots are color coded based on the enrichment q-values; dot size indicates the fraction of genes in each BP term.
Genomic regions targeted by GATA2 were enriched in DNA motifs for ETS and RUNX factors, preferentially expressed in earlier stages of erythroid development, whereas GATA1-targeted regions contained motifs for the erythroid-specific KLF1 factor, and, in E-Prec, for the ubiquitous SP1 and NFY factors that occupy preferentially promoter elements (Figure S5D).
Mapping GATA BS to regulatory regions revealed that the two factors targeted only a small fraction of promoters and enhancers, whereas GATA2 and GATA1 occupied the majority of SEs in HSPC and in E-Prog/E-Prec, respectively (Figures S6A–S6C and Tables S2, S3, and S4). Among BS mapped to regulatory regions, 72% HSPC GATA2 BS were located within enhancers and SEs. GATA1 occupies both enhancers/SEs (58%) and promoters (42%) in E-Prog, whereas in E-Prec, GATA1 mainly targeted promoter regions (72%, Figure 2D). These results indicate that GATA1 may exert its transcriptional activity by occupying both enhancers and promoters in committed erythroid progenitors and mainly promoters in more differentiated precursors.
We then associated GATA-occupied regulatory regions with their target genes. Around half of GATA2-targeted genes in HSPC were targeted by GATA1 in E-Prog (Figure 2E) and more than 75% of them presented at least one GATA switching site. Interestingly, GATA1 occupied common and different sets of genes in E-Prog and E-Prec (Figure 2E). Genes targeted only by GATA2 in HSPC (group A) were down-regulated during erythroid development (Figure 2F) and are involved in immune system biological processes (Figure 2G). This analysis suggests that these genes are activated by GATA2 in HSPC, whereas loss of GATA2 binding during erythroid development leads to their down-regulation. Genes undergoing GATA2-to-GATA1 exchange upon erythroid commitment were either up-regulated or their expression remained stable, suggesting that GATA1 increases or sustains their expression in E-Prog, whereas GATA2 might repress them or maintain their low expression in HSPC. Then, these genes were either turned off during differentiation, when losing GATA1 binding in E-Prec (group B; Figures S6D and S6E), or up-regulated during erythroid development, if still targeted by GATA1 in E-Prec (group C; Figures 2F, S6D, and S6E). Group B was functionally enriched in immune cell activation and hematopoiesis, whereas group C was enriched in erythropoiesis, histone modifications, cell cycle, and autophagy (Figure 2G). In E-Prog and E-Prec (group F), GATA1 occupied genes that were up-regulated during erythroid development (Figures 2F, S6D, and S6E) and related to heme metabolic process, membrane lipid distribution, and chromatin organization (Figure 2G). Finally, genes specifically targeted by GATA1 in E-Prec (group G) were up-regulated upon differentiation and involved in cell cycle and autophagy (Figures 2F and 2G). These results suggest that GATA1 exerts mainly activating functions during human erythroid development.
Transcriptional Changes in Erythropoiesis Are Associated with a Complex Interplay between Regulatory Elements and GATA Factors' Binding
To unveil how the interplay between regulatory elements and GATA factors influences transcriptional regulation during erythropoiesis, we assigned the different regulatory elements to each DEG and evaluated the enrichment in GATA factor BS at each stage of erythroid development (Figure 3). In particular, we generated a gene-centered matrix that contains the total coverage of all promoters and enhancers assigned to each DEG at each cell stage. This procedure allowed grouping of DEGs in 19 clusters based on their different chromatin landscapes. These clusters were either controlled by promoters only (clusters 1, 2, 8, 13, and 17) or by the combined action of promoters and enhancers (Figure 3A). Interestingly, the chromatin landscape of DEGs was more heterogeneous than their transcriptional status, as genes associated with different chromatin landscapes showed the same expression pattern during erythroid development (Figures 3A and 3B). In particular, clusters from 1 to 7 comprised genes that were mostly up-regulated during erythroid commitment and differentiation (e.g., genes involved in erythrocyte biology and chromatin reorganization; Figures 3B and 3C) despite their different chromatin landscapes (Figure 3A). Promoters of these genes were already marked by H3K27ac in HSPC, before erythroid induction, and maintained an active state during the entire development (Figure 3A). These data indicate that promoters of up-regulated genes are bookmarked in earlier stages of erythroid development. Active enhancers, if present, either did not change their state during erythroid development or were even lost, particularly upon terminal differentiation (Figure 3A), indicating that enhancers play a minor role in the transcriptional up-regulation occurring during E-Prog-to-E-Prec transition. On the contrary, genes in clusters from 8 to 16 (e.g., genes related to leukocyte biology and non-hematopoietic development) showed a sharp change in their chromatin landscape, characterized by the loss of active regulatory elements during erythroid development accompanied by the concomitant decrease in the expression levels (Figures 3A–3C).
Figure 3.

Chromatin Landscape Defines Clusters of DEGs
(A) Heatmap representing the clustering of the gene-centered matrix containing the total coverage of the promoters and enhancers annotated to each DEG. DEGs are clustered according to the total extension of the associated regulatory regions. Each column represents a DEG, and each row, the extension (in kb) of the associated regulatory elements in each cell stage. Color scale indicates the total extension as log10(coverage [kb]).
(B) Heatmap showing cluster enrichment in genes with different expression patterns (as defined in Figure 1B). Color scale indicates the statistical significance of the enrichment calculated by a Fisher's exact test.
(C) Biological process terms (BPs) enriched in each group are shown on the y axis; DEG clusters, as defined in Figure 3A, are shown on the x axis. Dots are color coded based on the enrichment q-values; dot size indicates the fraction of genes in each Gene Ontology term. DEGs of clusters 1–7, mostly up-regulated during erythroid commitment and differentiation, are functionally annotated to erythropoiesis, chromatin organization, cell cycle, and autophagy BPs. Genes within clusters from 8 to 19, mostly down-regulated during erythroid development, were related to immune cell biology (12, 14–16) or to the development of unrelated tissues (17–19).
(D and E) Heatmaps showing cluster enrichment in GATA factors BS within promoters (D) and in GATA factor BS within enhancers (E). Color scale indicates the statistical significance of the enrichment calculated by a Fisher's exact test.
See also Figure S7.
To investigate this partial dichotomy between epigenetic and transcriptional profiles, we evaluated the enrichment in GATA factors' BS within promoters and enhancers associated with each cluster of DEGs. As expected, GATA2 targeted mostly enhancers in HSPC, whereas GATA1 binds both promoters and enhancers in E-Prog and mainly promoters in E-Prec (Figures 3D and 3E). Considering clusters of up-regulated genes (from 1 to 7), GATA2 BS were enriched at promoters or enhancers of few clusters in HSPC, whereas in E-Prog and E-Prec, GATA1 binding was enriched within active promoters of virtually all clusters and within active and weak enhancers of some of them (Figures 3D and 3E). These findings indicate that GATA1 plays a role in up-regulating these genes during erythroid development mainly through the binding of active promoters, especially in late precursors, whereas GATA2 likely maintains their low activity in HSPC. Clusters of down-regulated genes (from 8 to 16) were characterized by an enrichment of GATA2 BS at active and weak enhancers in HSPC and by an enrichment of GATA1 BS at weak promoters and active and weak enhancers in E-Prog and at weak and bivalent promoters and weak enhancers in E-Prec (Figures 3D and 3E). This suggests that, in HSPC, GATA2 binding at enhancers might play a role in boosting the expression of these genes, which is still sustained by GATA1 in E-Prog. Then, the loss of GATA1 binding at active enhancers or the binding of GATA1 to weak or bivalent promoters might induce the transcriptional silencing of these genes in E-Prec. In E-Prog, GATA1 BS were also enriched at bivalent promoters of lowly expressed genes involved in the development of unrelated tissues (clusters 17–19; Figure 3C) indicating that, when binding at bivalent promoters, GATA1 might act as a transcriptional repressor.
Overall, virtually all the clusters enriched in GATA2 BS within enhancers in HSPC showed enrichment in GATA1 BS in E-Prog and E-Prec, suggesting that the transition from GATA2- to GATA1-mediated gene regulation occurs mainly at enhancer regions (Figure 3E). Of note, 37% enhancers targeted by GATA2 in HSPC contain GATA switching sites.
GATA1-bound regions associated with induced genes were enriched in motifs for KLF1 and E2F4 factors (Figure S7), which are up-regulated during erythroid development and play a fundamental role in erythroid differentiation and proliferation (Kinross et al., 2006, Siatecka and Bieker, 2011). Conversely, GATA1-occupied regions associated with down-regulated genes contained motifs for ETS factors (e.g., ERG, FLI1, and PU.1; Figure S7), mostly expressed in HSPC and down-regulated during erythroid development, and fundamental for the maintenance of HSC and the development of other hematopoietic lineages (Athanasiou et al., 2000, Calero-Nieto et al., 2010, Knudsen et al., 2015, Nishiyama et al., 1999, Rekhtman et al., 1999, Wontakal et al., 2012). Thus the low expression of ETS factors in erythroid cells and the consequent lack of ETS factor binding to these genes could contribute to the silencing of genes involved in non-erythroid functions (Wontakal et al., 2012). Finally, composite GATA:TAL1 motifs were enriched in GATA-occupied regulatory regions associated with both up- and down-regulated genes (Figure S7), suggesting a role for TAL1 in both gene activation and gene repression (Huang and Brandt, 2000, Pinello et al., 2014, Schuh et al., 2005, Van Handel et al., 2012).
A Novel GATA1-Dependent Super-enhancer Sustains KIT Expression in Erythroid Progenitors
To prove that this interplay between regulatory elements and GATA factors' binding is crucial to control gene expression during erythroid development, we focused on the KIT gene. A precise regulation of KIT expression is required for erythroid progenitor survival and proliferation and to achieve terminal erythroid maturation (Munugalavadla and Kapur, 2005). Indeed, we found that, in HSPC, KIT mRNA levels were relatively low and ∼65% cells poorly expressed KIT on the cell surface (median fluorescence intensity [MFI] = 17) (Figures 4A and 4B). Upon commitment, KIT transcription significantly increased (∼14 fold) and almost all E-Prog (∼93%) expressed KIT at high levels (MFI = 189) (Figures 4A and 4B). In E-Prec, KIT gene was substantially down-regulated with less than 55% cells still expressing low levels of KIT (MFI = 65) (Figures 4A and 4B).
In mouse KIT+ progenitor cells, GATA2 activates KIT expression through the binding of an enhancer located −114 kb upstream of the gene (Jing et al., 2008). Upon erythroid differentiation, this enhancer is occupied by GATA1, which induces KIT down-regulation (Jing et al., 2008). The analysis of regulatory elements during human erythroid development revealed that both KIT promoter and KIT-associated enhancers were active in HSPC and E-Prog and lost H3K27ac upon differentiation (Figure 4C; cluster 9 in Figure 3A). Moreover, KIT regulatory elements were targeted by GATA2 in HSPC and by GATA1 upon erythroid commitment (Figure 4C; group B in Figure 2F and cluster 9 of Figure 3D). In particular, we identified three SEs that could contribute to KIT transcriptional regulation during erythropoiesis, i.e., an SE located within KIT first intron in both HSPC and E-Prog, an HSPC-specific SE located +160/+180 kb downstream of KIT TSS (Aranda-Orgilles et al., 2016), and an E-Prog-specific SE located −118/-70 kb upstream of KIT TSS (Figure 4C). This latter SE comprised two main constituent active enhancers (Enhancer I and II) marked by high H3K27ac levels and bound by GATA1. Interestingly, upon differentiation, both Enhancer I and II lost H3K27ac and Enhancer II lost GATA1 binding (Figure 4C). In addition, the E-Prog-specific SE contains two additional GATA1-occupied active enhancers that show lower H3K27ac levels compared with Enhancers I and II: (1) Enhancer III that is homologous to the murine −114-kb enhancer but is not targeted by GATA2 in KIT+ progenitors as in the mouse system and (2) Enhancer IV that is occupied by GATA2 in HSPC (as a weak enhancer) and is targeted by GATA1 upon erythroid commitment (Figure 4C). Of note, in HSPC, besides Enhancer IV, GATA2 occupies also a weak enhancer upstream of the E-Prog-specific SE, suggesting that it may contribute to sustain KIT expression in HSPC (Figure 4). Interestingly, two SNPs (rs2703485 and rs218264) associated with red blood cell phenotypes map to the GATA1 BS in Enhancer I and Enhancer IV, respectively (Figure 4C; Astle et al., 2016).
To demonstrate that GATA1 binding to the highly acetylated Enhancer I and II is essential to sustain KIT expression in human erythroid progenitors, we performed chromatin conformation capture (3C) and Cas9-mediated genome editing in HUDEP-2 cells. HUDEP-2 is an immortalized erythroid progenitor cell line (Kurita et al., 2013) that, similarly to E-Prog, expresses high levels of KIT when undifferentiated (Day0) and that, as in the E-Prog-to-E-Prec transition, down-regulates KIT upon differentiation (Day 7) (Figures S8A and S8B). Moreover, undifferentiated HUDEP-2 cells present accessible chromatin regions mapping to the E-Prog-specific KIT enhancers (Figure S8C), suggesting that these regulatory elements are active in this cell line (Masuda et al., 2016). 3C experiments evidenced that, only in undifferentiated KIThigh HUDEP-2 cells, the KIT promoter interacts with Enhancer I and II (Figure 4D) and that Enhancer I and II interact with each other (Figures S8D and S8E). This indicates the presence, in human erythroid progenitors, of an active chromatin hub containing the KIT promoter and its active regulatory elements. We then transfected KIThigh HUDEP-2 cells with plasmids expressing a Cas9-GFP fusion protein and guide RNAs deleting Enhancer I or II or specifically disrupting their respective GATA1 BS (Figure 5A). Both the deletion of KIT Enhancer I or II and the disruption of GATA1 BS strongly reduced KIT gene expression, the percentage of KIT-expressing cells, and KIT MFI in the GFP+-edited fraction (Figures 5B–5E and S9), indicating that GATA1 binding at Enhancer I and II plays a crucial role in boosting KIT expression in erythroid progenitor cells. Notably, the lower expression of KIT was accompanied by a marked increase in the expression of the erythroid differentiation marker GYPA, with a trend in decreased GATA2 and increased GATA1 mRNA levels (Figure 5F).
Figure 5.

CRISPR/Cas9-Mediated Disruption of E-Prog-Specific KIT Regulatory Elements
(A) Schematic representation of the genomic regions and GATA1 BS in the KIT locus targeted using the CRISPR/Cas9 system. Red boxes indicate unedited wild-type Enhancer I or II, and white dots indicate unedited wild-type GATA1 BS within the enhancers (Ctr). Black boxes indicate Enhancer I or II deletion (Δ Enh. I and Δ Enh. II). Black dots indicate GATA1 BS disruption (Δ BS I and Δ BS II).
(B) KIT expression levels in control and edited cells, as determined by RT-qPCR. Control samples (Ctr) were transfected with plasmids encoding for Cas9-GFP and a guide RNA targeting the luciferase gene. mRNA levels were expressed as fold change versus control cells. Data were plotted as mean with SEM.
(C–E) Flow cytometry analysis of GFP and KIT expression in control and edited cells. For all the edited samples, both percentage of KIThigh cells (C and D) and KIT MFI (C and E) in the GFP+ populations were reduced compared with control cells. Percentage of KIThigh cells and KIT MFI were expressed as fold change versus control cells. Data were plotted as mean with SEM.
(F) GYPA, GATA2, and GATA1 expression levels by RT-qPCR in control and edited cells. mRNA levels were expressed as fold change versus control cells. Data were plotted as mean with SEM.
(B and D–F) ∗p < 0.05; ∗∗p < 0.01; ∗∗∗p < 0.001; ∗∗∗∗p < 0.0001 (unpaired t test).
Discussion
In this study, we analyzed the usage of regulatory elements and GATA factor dynamic occupancy in multipotent human primary HSPCs and in their erythroid progeny, including human early erythroid progenitors (Romano et al., 2016) and late polychromatic erythroid precursors.
During erythropoiesis, inhibition of histone acetylation and increase in histone deacetylation play a critical role in chromatin condensation and enucleation of erythroid precursors (Ji et al., 2010, Ji et al., 2011, Popova et al., 2009). Our analysis of the epigenetic landscapes of human HSPC, early erythroid progenitors, and late precursors revealed for the first time a progressive decrease of H3K27ac abundance and genome-wide coverage during erythroid development, accompanied by the up-regulation of genes involved in chromatin condensation and by the overall reduction in gene expression upon differentiation. These results suggest that the decrease of H3K27ac during erythropoiesis contributes to the heterochromatin formation and the consequent global gene silencing at late stage of erythroid development. This extensive epigenetic change influences the regulatory mechanisms controlling transcription, in particular in late erythroid precursors. Indeed, we found a reduced number of active H3K27ac+ regulatory elements, in particular enhancers and SEs, upon differentiation, suggesting that enhancer decommissioning occurs at the late stage of erythropoiesis. In accordance, gene expression in late precursors is mainly sustained by promoters and weak H3K27ac− enhancers, and the few SEs identified in E-Prec control the transcription of only a subset of stage-specific highly expressed genes. Our findings are consistent with the decreased number of chromatin accessibility peaks in polychromatic human erythroid precursors (Ludwig et al., 2019, Schulz et al., 2019).
The coordinate action of GATA factors has a fundamental role in the transcriptional regulation of erythropoiesis. The “GATA factor switching” (Bresnick et al., 2010, Moriguchi and Yamamoto, 2014, Suzuki et al., 2013) occurred in E-Prog, where GATA2 protein levels decreased, whereas the amount of GATA1 protein increased, resulting in a prevalent and specific chromatin occupancy of GATA2 in HSPC and GATA1 in E-Prog. Several genes regulated by GATA2 in HSPC were targeted by GATA1 in E-Prog, and the transition from GATA2 to GATA1-mediated gene regulation can occur via a GATA2-to-GATA1 exchange at the same BS (GATA switching sites) and/or through the alternative binding of GATA2 and GATA1 to different sites within the regulatory regions associated with the target gene. Interestingly, for differentially expressed genes, GATA switch occurs mostly at enhancer regions, and either leads to gene up-regulation or does not significantly change gene expression in E-Prog.
However, most GATA1 functions during erythropoiesis occur via de novo binding at open chromatin regions. Interestingly, GATA1 targeted common and distinct sets of genes in E-Prog and E-Prec, displaying different binding preferences. Indeed, in E-Prog, GATA1 occupied both promoters and enhancers (or SEs), whereas in E-Prec GATA1 mainly bound promoters. This change in GATA1 binding preferences during E-Prog-to-E-Prec transition together with the diminished enhancer usage observed in E-Prec highlights a novel pivotal role of promoter regions as determinants of the transcriptional program activated during terminal erythroid differentiation. This novel finding is a unique feature of erythroid precursors, as previous studies indicate that enhancers play a main role in defining cell fate at the early stage of development (Huang et al., 2016, Romano et al., 2016, Xu et al., 2012).
To better investigate the interplay between regulatory elements and GATA factors in determining gene transcription during erythropoiesis, we used an integrative bioinformatics approach. Our results showed that investigating the chromatin landscape dynamic alone is not sufficient to infer the transcriptional modulations that occur during erythroid development, and that integrating the binding profiles of key master regulators, as GATA2 and GATA1, is essential to understand the epigenetic mechanisms governing the transcriptional changes. Moreover, our findings evidenced that GATA1 binding in different chromatin contexts consistently correlates with its dual activity as transcriptional activator or repressor. In fact, GATA1 binding at active regulatory regions (mainly promoters) is associated with a positive transcriptional regulation of the target gene (as for genes related to erythrocyte differentiation and homeostasis). Conversely, GATA1 binding at weak (in E-Prec) or bivalent (in both E-Prog and E-Prec) promoters correlates with the transcriptional silencing of the target genes (as for genes related to leukocyte differentiation or development of unrelated tissues).
Importantly, we performed validation studies of regulatory elements identified in the KIT locus. In mouse erythroid cells, several regulatory elements were identified upstream of the KIT gene or within its introns, and GATA2 is known to activate KIT expression in early progenitors, whereas GATA1 is responsible for KIT down-regulation upon differentiation (Cairns, 2003, Hong et al., 2005, Jing et al., 2008, Munugalavadla et al., 2005). However, little is known about the transcriptional regulation of KIT gene in human cells (Aranda-Orgilles et al., 2016, Romano et al., 2016). Here, we identified an E-Prog-specific SE upstream of KIT gene targeted by GATA1. Our results demonstrate that GATA1 binding at the E-Prog-specific SE is required for high-level KIT expression in human erythroid progenitors. Interestingly, the enhancer homologous to the murine −114-kb regulatory region (which was associated with high KIT expression when occupied by GATA2 in mouse progenitors and to KIT down-regulation when occupied by GATA1 in mouse erythroid precursors; Jing et al., 2008) is not targeted by GATA2 but only by GATA1 in KIT+ E-Prog. Altogether, these data indicate that, differently from mouse erythroid cells, GATA1 activates KIT expression in human erythroid progenitors, supporting its up-regulation during erythroid commitment.
Several genes are known to be differentially regulated in human versus murine erythropoiesis (An et al., 2014). Notably, some genes upregulated during human erythropoiesis and down-regulated during murine erythropoiesis (e.g., RAPGEF2, MAP2K3, and RNF187; An et al., 2014) were indeed associated with active regulatory regions targeted by GATA1 in E-Prog and E-Prec (Figures S6D and S6E).
Overall, our stage-specific analysis of the transcriptional and epigenetic profiles and GATA factors' occupancy at key stages of human erythropoiesis provides new insights into the complex transcriptional regulatory mechanisms that control human erythroid commitment and differentiation, dissecting the pivotal role of GATA1 at both early and late stages of erythropoiesis.
Limitations of the Study
Given the high number of cells required to detect GATA factor binding by ChIP-seq, we analyzed mixed populations of erythroid progenitors (E-Prog: BFU-E, and CFU-E) and precursors (E-Prec: mainly polychromatic precursors). Therefore, our analyses may have a lower definition compared with transcriptomic and epigenomic studies analyzing highly purified erythroid progenitors and precursors (An et al., 2014, Li et al., 2014, Ludwig et al., 2019, Schulz et al., 2019).
Methods
All methods can be found in the accompanying Transparent Methods supplemental file.
Acknowledgments
This work was supported by grants from FIRB-Futuro in Ricerca (2010-RBFR10OS4G to A.M. and C.P.), EPIGEN Epigenomics Flagship Project (to O.R., S.B., C.P., and A.M.), and Agence Nationale de la Recherche (ANR-10-IAHU-01 “Investissements d'avenir” program). This project has received funding from the European Research Council (ERC) under the European Union's Horizon 2020 Research and Innovation Program (grant agreement no. 670126-DENOVOSTEM to O.R. and S.B.). The authors thank Ryo Kurita and Yukio Nakamura for providing the HUDEP-2 cell line and Olivier Alibeau and Christine Bole for the RNA sequencing.
Author Contributions
O.R. designed the experimental strategy and performed experiments, data analysis and interpretation. L.P. performed data analysis and interpretation. T.F., V.M., M.P., and C.A. performed experiments and data analysis. M.A. contributed to the design of the experimental strategy. S.B. contributed to data analysis and interpretation. C.P. designed the experimental strategy and performed experiments, data analysis and interpretation. A.M. conceived the study, designed the experimental strategy, and interpreted data. O.R., S.B., and A.M. wrote the paper.
Declaration of Interests
The Authors declare no competing financial interests.
Published: April 24, 2020
Footnotes
Supplemental Information can be found online at https://doi.org/10.1016/j.isci.2020.101018.
Contributor Information
Clelia Peano, Email: clelia.peano@humanitasresearch.it.
Annarita Miccio, Email: annarita.miccio@institutimagine.org.
Data and Code Availability
The accession number for all RNA-seq and ChIP-seq data reported in this paper is GEO:GSE124165.
Supplemental Information
References
- An X., Schulz V.P., Li J., Wu K., Liu J., Xue F., Hu J., Mohandas N., Gallagher P.G. Global transcriptome analyses of human and murine terminal erythroid differentiation. Blood. 2014;123:3466–3477. doi: 10.1182/blood-2014-01-548305. [DOI] [PMC free article] [PubMed] [Google Scholar]
- Aranda-Orgilles B., Saldaña-Meyer R., Wang E., Trompouki E., Fassl A., Lau S., Mullenders J., Rocha P.P., Raviram R., Guillamot M. MED12 regulates HSC-specific enhancers independently of mediator kinase activity to control hematopoiesis. Cell Stem Cell. 2016;19:784–799. doi: 10.1016/j.stem.2016.08.004. [DOI] [PMC free article] [PubMed] [Google Scholar]
- Astle W.J., Elding H., Jiang T., Allen D., Ruklisa D., Mann A.L., Mead D., Bouman H., Riveros-Mckay F., Kostadima M.A. The allelic landscape of human blood cell trait variation and links to common complex disease. Cell. 2016;167:1415–1429.e19. doi: 10.1016/j.cell.2016.10.042. [DOI] [PMC free article] [PubMed] [Google Scholar]
- Athanasiou M., Mavrothalassitis G., Sun-Hoffman L., Blair D. FLI-1 is a suppressor of erythroid differentiation in human hematopoietic cells. Leukemia. 2000;14:439–445. doi: 10.1038/sj.leu.2401689. [DOI] [PubMed] [Google Scholar]
- Beck D., Thoms J.A.I., Perera D., Schutte J., Unnikrishnan A., Knezevic K., Kinston S.J., Wilson N.K., O’Brien T.A., Gottgens B. Genome-wide analysis of transcriptional regulators in human HSPCs reveals a densely interconnected network of coding and noncoding genes. Blood. 2013;122:e12–e22. doi: 10.1182/blood-2013-03-490425. [DOI] [PubMed] [Google Scholar]
- Bresnick E.H., Lee H.-Y., Fujiwara T., Johnson K.D., Keles S. GATA switches as developmental drivers. J. Biol. Chem. 2010;285:31087–31093. doi: 10.1074/jbc.R110.159079. [DOI] [PMC free article] [PubMed] [Google Scholar]
- Cairns L.A. Kit regulatory elements required for expression in developing hematopoietic and germ cell lineages. Blood. 2003;102:3954–3962. doi: 10.1182/blood-2003-04-1296. [DOI] [PubMed] [Google Scholar]
- Calero-Nieto F.J., Wood A.D., Wilson N.K., Kinston S., Landry J.-R., Göttgens B. Transcriptional regulation of Elf-1: locus-wide analysis reveals four distinct promoters, a tissue-specific enhancer, control by PU.1 and the importance of Elf-1 downregulation for erythroid maturation. Nucleic Acids Res. 2010;38:6363–6374. doi: 10.1093/nar/gkq490. [DOI] [PMC free article] [PubMed] [Google Scholar]
- Cheng Y., Wu W., Ashok Kumar S., Yu D., Deng W., Tripic T., King D.C., Chen K.-B., Zhang Y., Drautz D. Erythroid GATA1 function revealed by genome-wide analysis of transcription factor occupancy, histone modifications, and mRNA expression. Genome Res. 2009;19:2172–2184. doi: 10.1101/gr.098921.109. [DOI] [PMC free article] [PubMed] [Google Scholar]
- Dore L.C., Chlon T.M., Brown C.D., White K.P., Crispino J.D. Chromatin occupancy analysis reveals genome-wide GATA factor switching during hematopoiesis. Blood. 2012;119:3724–3733. doi: 10.1182/blood-2011-09-380634. [DOI] [PMC free article] [PubMed] [Google Scholar]
- Dzierzak E., Philipsen S. Erythropoiesis: development and differentiation. Cold Spring Harb. Perspect. Med. 2013;3:a011601. doi: 10.1101/cshperspect.a011601. [DOI] [PMC free article] [PubMed] [Google Scholar]
- Ernst J., Kheradpour P., Mikkelsen T.S., Shoresh N., Ward L.D., Epstein C.B., Zhang X., Wang L., Issner R., Coyne M. Mapping and analysis of chromatin state dynamics in nine human cell types. Nature. 2011;473:43–49. doi: 10.1038/nature09906. [DOI] [PMC free article] [PubMed] [Google Scholar]
- Ferreira R., Ohneda K., Yamamoto M., Philipsen S. GATA1 function, a paradigm for transcription factors in hematopoiesis. Mol. Cell. Biol. 2005;25:1215–1227. doi: 10.1128/MCB.25.4.1215-1227.2005. [DOI] [PMC free article] [PubMed] [Google Scholar]
- Fujiwara T., O’Geen H., Keles S., Blahnik K., Linnemann A.K., Kang Y.-A., Choi K., Farnham P.J., Bresnick E.H. Discovering hematopoietic mechanisms through genome-wide analysis of GATA factor chromatin occupancy. Mol. Cell. 2009;36:667–681. doi: 10.1016/j.molcel.2009.11.001. [DOI] [PMC free article] [PubMed] [Google Scholar]
- Heinz S., Romanoski C.E., Benner C., Glass C.K. The selection and function of cell type-specific enhancers. Nat. Rev. Mol. Cell Biol. 2015;16:144–154. doi: 10.1038/nrm3949. [DOI] [PMC free article] [PubMed] [Google Scholar]
- Hnisz D., Abraham B.J., Lee T.I., Lau A., Saint-André V., Sigova A.A., Hoke H.A., Young R.A. Super-enhancers in the control of cell identity and disease. Cell. 2013;155:934–947. doi: 10.1016/j.cell.2013.09.053. [DOI] [PMC free article] [PubMed] [Google Scholar]
- Hong W., Nakazawa M., Chen Y.-Y., Kori R., Vakoc C.R., Rakowski C., Blobel G.A. FOG-1 recruits the NuRD repressor complex to mediate transcriptional repression by GATA-1. EMBO J. 2005;24:2367–2378. doi: 10.1038/sj.emboj.7600703. [DOI] [PMC free article] [PubMed] [Google Scholar]
- Hu G., Schones D.E., Cui K., Ybarra R., Northrup D., Tang Q., Gattinoni L., Restifo N.P., Huang S., Zhao K. Regulation of nucleosome landscape and transcription factor targeting at tissue-specific enhancers by BRG1. Genome Res. 2011;21:1650–1658. doi: 10.1101/gr.121145.111. [DOI] [PMC free article] [PubMed] [Google Scholar]
- Huang J., Liu X., Li D., Shao Z., Cao H., Zhang Y., Trompouki E., Bowman T.V., Zon L.I., Yuan G. Dynamic control of enhancer repertoires drives lineage and stage-specific transcription during hematopoiesis. Dev. Cell. 2016;36:9–23. doi: 10.1016/j.devcel.2015.12.014. [DOI] [PMC free article] [PubMed] [Google Scholar]
- Huang S., Brandt S.J. mSin3A regulates murine erythroleukemia cell differentiation through association with the TAL1 (or SCL) transcription factor. Mol. Cell. Biol. 2000;20:2248–2259. doi: 10.1128/mcb.20.6.2248-2259.2000. [DOI] [PMC free article] [PubMed] [Google Scholar]
- Ji P. New insights into the mechanisms of mammalian erythroid chromatin condensation and enucleation. Int. Rev. Cell Mol. Biol. 2015;316:159–182. doi: 10.1016/bs.ircmb.2015.01.006. [DOI] [PubMed] [Google Scholar]
- Ji P., Yeh V., Ramirez T., Murata-Hori M., Lodish H.F. Histone deacetylase 2 is required for chromatin condensation and subsequent enucleation of cultured mouse fetal erythroblasts. Haematologica. 2010;95:2013–2021. doi: 10.3324/haematol.2010.029827. [DOI] [PMC free article] [PubMed] [Google Scholar]
- Ji P., Murata-Hori M., Lodish H.F. Formation of mammalian erythrocytes: chromatin condensation and enucleation. Trends Cell Biol. 2011;21:409–415. doi: 10.1016/j.tcb.2011.04.003. [DOI] [PMC free article] [PubMed] [Google Scholar]
- Jing H., Vakoc C.R., Ying L., Mandat S., Wang H., Zheng X., Blobel G.A. Exchange of GATA factors mediates transitions in looped chromatin organization at a developmentally regulated gene locus. Mol. Cell. 2008;29:232–242. doi: 10.1016/j.molcel.2007.11.020. [DOI] [PMC free article] [PubMed] [Google Scholar]
- Kinross K.M., Clark A.J., Iazzolino R.M., Humbert P.O. E2f4 regulates fetal erythropoiesis through the promotion of cellular proliferation. Blood. 2006;108:886–895. doi: 10.1182/blood-2005-09-008656. [DOI] [PubMed] [Google Scholar]
- Knudsen K.J., Rehn M., Hasemann M.S., Rapin N., Bagger F.O., Ohlsson E., Willer A., Frank A.-K., Søndergaard E., Jendholm J. ERG promotes the maintenance of hematopoietic stem cells by restricting their differentiation. Genes Dev. 2015;29:1915–1929. doi: 10.1101/gad.268409.115. [DOI] [PMC free article] [PubMed] [Google Scholar]
- Kurita R., Suda N., Sudo K., Miharada K., Hiroyama T., Miyoshi H., Tani K., Nakamura Y. Establishment of immortalized human erythroid progenitor cell lines able to produce enucleated red blood cells. PLoS One. 2013;8:e59890. doi: 10.1371/journal.pone.0059890. [DOI] [PMC free article] [PubMed] [Google Scholar]
- Li J., Hale J., Bhagia P., Xue F., Chen L., Jaffray J., Yan H., Lane J., Gallagher P.G., Mohandas N. Isolation and transcriptome analyses of human erythroid progenitors: BFU-E and CFU-E. Blood. 2014;124:3636–3645. doi: 10.1182/blood-2014-07-588806. [DOI] [PMC free article] [PubMed] [Google Scholar]
- Ludwig L.S., Lareau C.A., Bao E.L., Nandakumar S.K., Muus C., Ulirsch J.C., Chowdhary K., Buenrostro J.D., Mohandas N., An X. Transcriptional states and chromatin accessibility underlying human erythropoiesis. Cell Rep. 2019;27:3228–3240.e7. doi: 10.1016/j.celrep.2019.05.046. [DOI] [PMC free article] [PubMed] [Google Scholar]
- Masuda T., Wang X., Maeda M., Canver M.C., Sher F., Funnell A.P.W., Fisher C., Suciu M., Martyn G.E., Norton L.J. Transcription factors LRF and BCL11A independently repress expression of fetal hemoglobin. Science. 2016;351:285–289. doi: 10.1126/science.aad3312. [DOI] [PMC free article] [PubMed] [Google Scholar]
- May G., Soneji S., Tipping A.J., Teles J., McGowan S.J., Wu M., Guo Y., Fugazza C., Brown J., Karlsson G. Dynamic analysis of gene expression and genome-wide transcription factor binding during lineage specification of multipotent progenitors. Cell Stem Cell. 2013;13:754–768. doi: 10.1016/j.stem.2013.09.003. [DOI] [PMC free article] [PubMed] [Google Scholar]
- Moras M., Lefevre S.D., Ostuni M.A. From erythroblasts to mature red blood cells: organelle clearance in mammals. Front. Physiol. 2017;8:1–9. doi: 10.3389/fphys.2017.01076. [DOI] [PMC free article] [PubMed] [Google Scholar]
- Moriguchi T., Yamamoto M. A regulatory network governing Gata1 and Gata2 gene transcription orchestrates erythroid lineage differentiation. Int. J. Hematol. 2014;100:417–424. doi: 10.1007/s12185-014-1568-0. [DOI] [PubMed] [Google Scholar]
- Munugalavadla V., Dore L.C., Tan B.L., Hong L., Vishnu M., Weiss M.J., Kapur R. Repression of c-kit and its downstream substrates by GATA-1 inhibits cell proliferation during erythroid maturation. Mol. Cell. Biol. 2005;25:6747–6759. doi: 10.1128/MCB.25.15.6747-6759.2005. [DOI] [PMC free article] [PubMed] [Google Scholar]
- Munugalavadla V., Kapur R. Role of c-Kit and erythropoietin receptor in erythropoiesis. Crit. Rev. Oncol. Hematol. 2005;54:63–75. doi: 10.1016/j.critrevonc.2004.11.005. [DOI] [PubMed] [Google Scholar]
- Nishiyama C., Yokota T., Okumura K., Ra C. The transcription factors Elf-1 and GATA-1 bind to cell-specific enhancer elements of human high-affinity IgE receptor alpha-chain gene. J. Immunol. 1999;163:623–630. [PubMed] [Google Scholar]
- Pinello L., Xu J., Orkin S.H., Yuan G.-C. Analysis of chromatin-state plasticity identifies cell-type-specific regulators of H3K27me3 patterns. Proc. Natl. Acad. Sci. U S A. 2014;111:E344–E353. doi: 10.1073/pnas.1322570111. [DOI] [PMC free article] [PubMed] [Google Scholar]
- Popova E.Y., Krauss S.W., Short S.A., Lee G., Villalobos J., Etzell J., Koury M.J., Ney P.A., Chasis J.A., Grigoryev S.A. Chromatin condensation in terminally differentiating mouse erythroblasts does not involve special architectural proteins but depends on histone deacetylation. Chromosome Res. 2009;17:47–64. doi: 10.1007/s10577-008-9005-y. [DOI] [PMC free article] [PubMed] [Google Scholar]
- Rekhtman N., Radparvar F., Evans T., Skoultchi A.I. Direct interaction of hematopoietic transcription factors PU.1 and GATA-1: functional antagonism in erythroid cells. Genes Dev. 1999;13:1398–1411. doi: 10.1101/gad.13.11.1398. [DOI] [PMC free article] [PubMed] [Google Scholar]
- Roadmap Epigenomics Consortium, Kundaje A., Meuleman W., Ernst J., Bilenky M., Yen A., Heravi-Moussavi A., Kheradpour P., Zhang Z., Wang J. Integrative analysis of 111 reference human epigenomes. Nature. 2015;518:317–330. doi: 10.1038/nature14248. [DOI] [PMC free article] [PubMed] [Google Scholar]
- Romano O., Peano C., Tagliazucchi G.M., Petiti L., Poletti V., Cocchiarella F., Rizzi E., Severgnini M., Cavazza A., Rossi C. Transcriptional, epigenetic and retroviral signatures identify regulatory regions involved in hematopoietic lineage commitment. Sci. Rep. 2016;6:24724. doi: 10.1038/srep24724. [DOI] [PMC free article] [PubMed] [Google Scholar]
- Schuh A.H., Tipping A.J., Clark A.J., Hamlett I., Guyot B., Iborra F.J., Rodriguez P., Strouboulis J., Enver T., Vyas P., Porcher C. ETO-2 associates with SCL in erythroid cells and megakaryocytes and provides repressor functions in erythropoiesis. Mol. Cell. Biol. 2005;25:10235–10250. doi: 10.1128/MCB.25.23.10235-10250.2005. [DOI] [PMC free article] [PubMed] [Google Scholar]
- Schulz V.P., Yan H., Lezon-Geyda K., An X., Hale J., Hillyer C.D., Mohandas N., Gallagher P.G. A unique epigenomic landscape defines human erythropoiesis. Cell Rep. 2019;28:2996–3009.e7. doi: 10.1016/j.celrep.2019.08.020. [DOI] [PMC free article] [PubMed] [Google Scholar]
- Shi L., Lin Y.-H., Sierant M.C., Zhu F., Cui S., Guan Y., Sartor M.A., Tanabe O., Lim K.-C., Engel J.D. Developmental transcriptome analysis of human erythropoiesis. Hum. Mol. Genet. 2014;23:4528–4542. doi: 10.1093/hmg/ddu167. [DOI] [PMC free article] [PubMed] [Google Scholar]
- Siatecka M., Bieker J.J. The multifunctional role of EKLF/KLF1 during erythropoiesis. Blood. 2011;118:2044–2054. doi: 10.1182/blood-2011-03-331371. [DOI] [PMC free article] [PubMed] [Google Scholar]
- Su M.Y., Steiner L.A., Bogardus H., Mishra T., Schulz V.P., Hardison R.C., Gallagher P.G. Identification of biologically relevant enhancers in human erythroid cells. J. Biol. Chem. 2013;288:8433–8444. doi: 10.1074/jbc.M112.413260. [DOI] [PMC free article] [PubMed] [Google Scholar]
- Suzuki M., Kobayashi-Osaki M., Tsutsumi S., Pan X., Ohmori S., Takai J., Moriguchi T., Ohneda O., Ohneda K., Shimizu R. GATA factor switching from GATA2 to GATA1 contributes to erythroid differentiation. Genes Cells. 2013;18:921–933. doi: 10.1111/gtc.12086. [DOI] [PubMed] [Google Scholar]
- Van Handel B., Montel-Hagen A., Sasidharan R., Nakano H., Ferrari R., Boogerd C.J., Schredelseker J., Wang Y., Hunter S., Org T. Scl represses cardiomyogenesis in prospective hemogenic endothelium and endocardium. Cell. 2012;150:590–605. doi: 10.1016/j.cell.2012.06.026. [DOI] [PMC free article] [PubMed] [Google Scholar]
- Vicente C., Conchillo A., García-Sánchez M.A., Odero M.D. The role of the GATA2 transcription factor in normal and malignant hematopoiesis. Crit. Rev. Oncol. Hematol. 2012;82:1–17. doi: 10.1016/j.critrevonc.2011.04.007. [DOI] [PubMed] [Google Scholar]
- Whyte W.A., Orlando D.A., Hnisz D., Abraham B.J., Lin C.Y., Kagey M.H., Rahl P.B., Lee T.I., Young R.A. Master transcription factors and mediator establish super-enhancers at key cell identity genes. Cell. 2013;153:307–319. doi: 10.1016/j.cell.2013.03.035. [DOI] [PMC free article] [PubMed] [Google Scholar]
- Wong P., Hattangadi S.M., Cheng A.W., Frampton G.M., Young R.A., Lodish H.F. Gene induction and repression during terminal erythropoiesis are mediated by distinct epigenetic changes. Blood. 2011;118:e128–e138. doi: 10.1182/blood-2011-03-341404. [DOI] [PMC free article] [PubMed] [Google Scholar]
- Wontakal S.N., Guo X., Smith C., MacCarthy T., Bresnick E.H., Bergman a., Snyder M.P., Weissman S.M., Zheng D., Skoultchi a.I. A core erythroid transcriptional network is repressed by a master regulator of myelo-lymphoid differentiation. Proc. Natl. Acad. Sci. 2012;109:3832–3837. doi: 10.1073/pnas.1121019109. [DOI] [PMC free article] [PubMed] [Google Scholar]
- Wu W., Cheng Y., Keller C.A., Ernst J., Kumar S.A., Mishra T., Morrissey C., Dorman C.M., Chen K.-B., Drautz D. Dynamics of the epigenetic landscape during erythroid differentiation after GATA1 restoration. Genome Res. 2011;21:1659–1671. doi: 10.1101/gr.125088.111. [DOI] [PMC free article] [PubMed] [Google Scholar]
- Xu J., Shao Z., Glass K., Bauer D.E., Pinello L., Van Handel B., Hou S., Stamatoyannopoulos J.A., Mikkola H.K.A., Yuan G.-C., Orkin S.H. Combinatorial assembly of developmental stage-specific enhancers controls gene expression programs during human erythropoiesis. Dev. Cell. 2012;23:796–811. doi: 10.1016/j.devcel.2012.09.003. [DOI] [PMC free article] [PubMed] [Google Scholar]
- Yu M., Riva L., Xie H., Schindler Y., Moran T.B., Cheng Y., Yu D., Hardison R., Weiss M.J., Orkin S.H. Insights into GATA-1-mediated gene activation versus repression via genome-wide chromatin occupancy analysis. Mol. Cell. 2009;36:682–695. doi: 10.1016/j.molcel.2009.11.002. [DOI] [PMC free article] [PubMed] [Google Scholar]
Associated Data
This section collects any data citations, data availability statements, or supplementary materials included in this article.
Supplementary Materials
Data Availability Statement
The accession number for all RNA-seq and ChIP-seq data reported in this paper is GEO:GSE124165.