

Abstract
Sarcopenia and osteoporosis are two major health problems worldwide, responsible for a serious clinical and financial burden due to the increasing life expectancy. Both when presented as a single entity and, in particular, in the form of “osteosarcopenia”, they lead to an important increased risk of falls, fractures, hospitalization and mortality. In dealing with these two pathological conditions, it is important to understand that between bone and muscle there is not only a functional correlation but also a close relationship in the development and in maintenance, which is well expressed by the concept of “bone-muscle unit”. This close relationship agrees with the existence of a linear association between sarcopenia and osteoporosis, in particular in elderly population. It is mandatory, in the clinical assessment of both diseases, to do an early diagnosis or to delay as far as possible the appearance of an established form in order to prevent the onset of complications. The aim of this review is to present the different imaging modalities available for a non-invasive investigation of bone and muscle mass and quality in osteoporosis and sarcopenia, with their application and limitations.
Keywords: Sarcopenia, Osteoporosis, DXA, QCT, MRI
Introduction
Sarcopenia and osteoporosis are recognized as two major health problems worldwide, responsible for a serious clinical and financial burden due to the increasing life expectancy. Although it can also develop in young adults, loss of bone and muscle affects predominantly elderly patients leading to a huge increase in physical disability, hospitalizations and mortality.
According to the World Health Organization (WHO), osteoporosis is a “systemic skeletal disease, characterized by low mass and micro architectural deterioration of bone tissue, leading to enhanced bone fragility and a consequent increase in fracture risk”[1]. The age-standardized prevalence of osteoporosis in the European population is 12% for women and 12.2% for men aged 50-79 years, with an overall age-standardized incidence of 10.7 per 1000 person-years in women and 5.7 per 1000 person-years in men[2] and it is expected to increase to more than 14 million worldwide by 2020[3].
Sarcopenia is a “syndrome characterized by progressive and generalized loss of skeletal muscle mass and strength with a risk of adverse outcomes such as physical disability, poor quality of life and death”[4]. Sarcopenia is a condition still partly unknown and under-diagnosed in the clinical practice. Even if a univocally accepted definition of sarcopenia has not yet been defined, its prevalence is estimated around 13% in individuals between 60 and 70 years, despite it can reach reaches almost 50% of people over 80 years of age[5].
Bone and muscle are two closely interacting tissues for several reasons. The most intuitive reason is their complementarity in allowing the function of locomotion: the force generated by muscular contraction needs to be anchored on a solid support such as the skeleton and, at the same time, itself stimulates bone growth and remodeling[6].
However, a bidirectional relationship between bone and muscle takes place also at other different levels of cross-talk, in particular through systemic humoral pathways, but also at the cellular and molecular levels. Several studies in the last decades have focused on how muscle tissue and bone tissue coordinate their development and their response to the load by communication through paracrine and endocrine signals[7]. Therefore, between bone and muscle there is not only a functional correlation but also a close relationship in the development and in maintenance, which is well expressed by the concept of “bone-muscle unit”[8].
Consequently, a linear association exist between the two chronic diseases, osteoporosis and sarcopenia[9]. The pathogenic mechanisms underlying both of them are multiple and complex. Certainly aging plays the main role in the loss of both bone and muscle mass and functions[10], but, in addiction to age-related modifications, many other causes can be involved, such as environmental, nutritional, metabolic, endocrine and pharmacological ones (physical inactivity, malnutrition, vitamin D deficiency, corticosteroid treatments, decline in serum estrogen, androgen, IGF-1 or increased level of pro-inflammatory cytokines)[11].
The severity of these disorders lies in the fact that sarcopenia and osteoporosis lead to the state of “frailty” of the elderly, with an important increased risk of falls, fractures, hospitalization, institutionalization and mortality, both when presented as a single entity and in the form of “osteosarcopenia”[12-14].
Therefore, it is mandatory, in the clinical assessment of both diseases, to do an early diagnosis or to delay as far as possible the appearance of an established form in order to prevent the onset of complications. Several techniques are available in this field: the double energy X-ray absorption (DXA) is the reference standard in the diagnosis of both osteoporosis and sarcopenia, but nowadays accurate and reliable techniques such as computed tomography (CT), magnetic resonance imaging (MRI) and ultrasound are available and able to provide further important information on different aspects of the same pathologies.
Imaging of osteoporosis
Conventional radiography represents the most common technique to recognize a generalized osteoporotic condition.
The principal radiographic findings of osteoporosis are increased radiolucency, cortical thinning and changes in the trabecular pattern[15] (Figure 1).
Figure 1.

Side x-ray of lumbar spine in a young patient with osteoporosis.
Radiolucency is the result of the progressive reduction of bone mineral content (BMC) and of the loss of the trabecular microarchitecture; cortical thinning, as the changes in the trabecular pattern, results from the resorption process in the endosteal, periosteal and intracortical layers[16]. All these features, however, can be depicted when the amount of bone loss reaches at least the 30%, so when the disease is in advanced stages[17].
Because the aim of osteoporosis therapy is to prevent fractures, with all their consequences on the quality of life and social costs, it is mandatory to diagnose osteoporosis in early stages. To do that it is necessary to resort to densitometric techniques that give information on subtle variation in bone mineral density (BMD), a factor that influences bone strength for about 70%.
DXA in osteoporosis
According to WHO, Dual-Energy X-ray Absorptiometry (DXA) is currently the standardized method for the diagnosis of osteoporosis. It is a quantitative technique, which allows measurement of bone mineral density (BMD) with high reproducibility, by exposing the patient to a low radiation dose (1-6 µSv)[18]. The BMD can be easily assessed at those sites particularly relevant to osteoporosis fractures (lumbar spine, proximal femur and distal radius) and is expressed in g/cm2 as standard deviation (DS) from the mean value expected in a young (peak mineral density) healthy subject (T-score) or in a person with the same age and sex (Z-score). By current criteria, osteoporosis can be diagnosed when T-score value is below -2.5 SD; when it is between -1.0 and -2.5 SDs the osteopenia, the patient is diagnosed with osteopenia[19,20] (Figure 2).
Figure 2A.

Dual energy X-ray absorptiometry image of a PA lumbar spine. The study includes the L1-L4 vertebral bodies.
Figure 2B.

Dual energy X-ray absorptiometry of the left hip. The area of analysis (ROI) is placed on the femoral neck. This 62 years old female patient was diagnosed with osteoporosis (T-score -3.2).
DXA BMD, moreover, features the 60-80% of the mechanical strength of the bone. For this reason, DXA is considered the gold standard also for the fracture risk assessment[21,22]. Low BMD values (in particular BMD proximal femur measurement) increase low-trauma fracture risk, along with several other risk factors that are included in the clinical practice in the calculation of the Fracture Risk Algorithm (FRAX). The FRAX result indicates the patient’s 10-years probability of fracture at one of the major osteoporotic sites[23].
The osteoporotic fracture risk is linked not only to bone mass but also to bone quality[24]. Furthermore technical factors (errors in patient position or physical artifacts, such as those due to obesity) can affect BMD measurements made by DXA and vertebral diseases (osteoarthritic spondylosis, osteophytes, scoliosis or vertebral fracture) or extrinsic artifacts (from aortic calcifications or surgical clips) can falsely raise the results[25].
For a more accurate evaluation of osteoporotic patients, software was developed to evaluate some geometric parameters related to bone strength.
The Hip Structure Analysis (HSA) allows evaluating geometric variables (the length of the proximal hip axis (HAL), the moment of inertia of the cross-section, the angle of the neck shaft and the area of the cross-section) on the DXA two-dimensional images of the hip. These measurements correlate with similar parameters obtainable with three-dimensional techniques (quantitative computed tomography (QCT)) and are indicative of fracture risk[26,27].
The Trabecular bone score (TBS), instead, provides a measure of the pixel grey-level variations of vertebral bodies in DXA images of the lumbar spine (L1-L4)[28] Compared to HAS, the TBS has a stronger correlation with the corresponding QCT parameters (such as bone volume, tissue volume or trabecular number) and provides accurate indirect information on the trabecular microarchitecture[29].
Recently it has been shown that TBS is a predictor of fracture risk independent of BMD and partly independent of FRAX: low TBS values reflect weaker, fracture-prone microarchitecture[30]. Moreover, TBS undergoes a progressive increase after osteoporosis treatment, but nowadays it, alone, is not yet recommended to evaluate treatment response[31].
Finally, a quantitative vertebral morphometry can be obtained from the DXA with vertebral fracture assessment (VFA) scans. It is mainly performed on images of lateral spine (from T4 to L4), using the semi-quantitative method of Genant[32]. Compared to standard radiography, the quantitative vertebral morphometry allows a more precise assessment of fracture status with of lower radiation exposure[33].
Quantitative Computed Tomography in osteoporosis
In the quantitative skeletal assessment, Quantitative Computed Tomography (qCT) provide a true volumetric measurement of BMD, expressed in g/cm3 , and, unlike the DXA, is able to perform a selective evaluation of trabecular tissue concerning cortical bone.
QCT is usually applied to the lumbar spine or to the proximal femur (axial qCT) with a standard CT scanner and a phantom, which acts as bone mineral reference standard to calibrate each scan[34-36]. The results can be expressed as BMD or in terms of absolute T-score and Z-score values. They provide pertinent information on bone strength and they are highly sensitive in predict fracture risk: a BMD ranging from 80 to 110 mg/cm3 is associated to mild risk of fracture, a BMD value between 80 and mg/cm3 is associated with a moderate risk of fracture, while a BMD value lower than 50 mg/cm3 is associated to severe risk of fracture[37] (Figure 3).
Figure 3.

QCT based volumetric bone mineral density (vBMD) measurements in L1, L2, L3 and L4. Measurements were performed in automatically placed oval regions of interest (yellow marked). The patient, with an Average BMD of 62.4 mg/cm3 had a moderate risk of fracture.
However, due to the high dose of radiation delivered and to the risk that several bone marrow changes may affect the measurements, its application in clinical use has been narrowed[17,38].
These limits are reduced when qCT is applied to the distal radius and tibia (peripheral qCT)[39]. Dedicated scanners provide separate assessment of cortical and trabecular bone at appendicular site and post-processing softwares produce information on the geometric bone stability, related to bone strength[40].
There is also the possibility to apply a high resolution quantitative computed tomography (HR-QCT) to the peripheral bones but the high costs limit its application to few research centers[41].
Magnetic Resonance Imaging in osteoporosis
High-resolution MRI is another technique available for bone assessment in osteoporotic patients, with the great advantage of being ionizing radiation free.
To obtain micro-architectural data of trabecular bone, MRI is particularly applied to the peripheral skeleton (distal radius and calcaneus) although with current progress it is starting to use it to other bone sites like the proximal femur[42,43].
In clinical practice, however, the use of MRI in this sense is limited. It is mainly used in the evaluation of vertebral fractures of dubious significance, as it is able to differentiate with high precision benign fractures from malignant ones. MRI can also provide information on different aspects of bone physiopathology compared to previous methods. In osteoporotic vertebral bodies, fat cells replace the trabecular bone network and edema infiltrates the bone marrow. At lower values of bone mineral density, in fact, corresponds an increased vertebral marrow fat content and a reduced vertebral marrow perfusion[44,45].
Ultrasound in osteoporosis
Quantitative Ultrasound (QUS) is the technique most recently focused on for the evaluation of bone diseases. It has important practical advantages, like being a non-invasive, low cost, real-time and radiation-free method[17,46]. QUS employs ultrasound in a frequency range between 200 kHz and 1.5 MHz to provide indirect information about bone density and bone quality. In particular, it analyzes the interactions between ultrasound and bone at peripheral skeletal sites, especially at the calcaneus, the distal metaphysis of the phalanx, the radius and the tibia[47]. QUS results can be expressed in absolute values or in T-score and Z-score linked to normative reference data (Figure 4).
Figure 4.
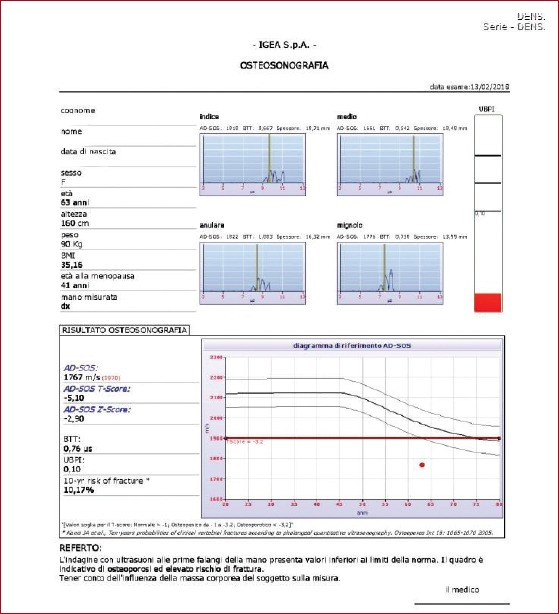
Quantitative Ultrasound of the distal metaphysis of the first phalanges of fingers II-V: osteoporosis with high fracture risk.
The QUS most widely adopted bone parameters are the broadband ultrasound attenuation (BUA, expressed in dB/MHz), a parameter closely related to micro architectural characteristics of trabecular bone, and speed of sound (SoS, expressed in m/s), which is closely related to bone mineral density. Other parameters (Stiffness Index (SI), Quantitative Ultrasound Index (QUI) and Amplitude Dependent-Speed of Sound (AD-SoS)) derive from the combination of BUA and SoS and provide complementary information on bone structural integrity.
Several studies provide that ultrasound are able to give complementary information on bone structure to that provided by DXA and to predict osteoporotic fracture risk. Moreover, the versatility of the method makes it a useful tool in children and all the other cases where it is preferable to avoid the use of ionizing radiation. (48)
However, even if QUS can be a useful screening tool for the estimation of fracture risk, it cannot be used as stand-alone method for the diagnosis of osteoporosis and assessment of treatment response because it’s an operator-employee, scarcely reproducible and it provides just an indirect measurement of bone density[49].
Imaging of sarcopenia
According to the European Working Group on Sarcopenia in Older People (EWGSOP), the diagnosis of sarcopenia needs the presence of low muscle mass with low muscle strength or physical performance. Thus, imaging plays an important role.
Three imaging techniques can be used for estimation of muscle mass: computed tomography (CT scan), magnetic resonance imaging (MRI) and dual-energy X-ray absorptiometry (DXA). A little role can be played also by Ultrasound (US).
DXA in sarcopenia
Despite CT and MRI are considered gold standards methods for estimating muscle mass, high cost and radiation exposure limit their use in the clinical practice[50].
But as demonstrated in several studies, there is a good level of correlation between BC at lower limbs derived by DXA and those derived by CT and MRI, with a little underestimation of the degree of sarcopenia by DXA[51].
For this reason DXA can be considered, according to the EWGSOP, the preferred technique in clinical routine for the assessment of muscle mass[4]. In fact, with its features of low radiation exposure and fast acquisition time, it allows the evaluation of Body Composition (BC) with a single whole-body scan, providing high-resolution images and very accurate and precise data[52].
Particularly, DXA provides a three-component model of body composition, which allows an estimation of fat mass, body mineral content, and lean mass both in a single body region of interest and at whole-body level. The measurements are based on the different degrees of X-ray attenuation by human tissues, distinguishing bone and the remaining soft tissue. Consequently, it doesn’t provide a direct measurement but an estimation of the amount of lean mass (LM) and fat mass (FM) by calculating it in the adjacent areas, assuming that soft tissue BC is similar to bone-free tissues[53].
BC parameters by DXA include Lean Mass Index (LMI= Total LM/height[2]), appendicular lean mass (ALM= arms LM + legs LM), appendicular lean mass index (ALMI= ALM/height[2]), android/gynoid ratio; fat mass index (FMI= fat mass/height[2]). An example of DXA body composition assessment is in [Figure 5].
Figure 5.

DXA body composition report of a 52 years old male patient.
The most used measurement for assessing sarcopenia is ALMI[54] because preservation of appendicular skeletal mass is essential to mobility and functional independence in the elderly[55].
In the ISCD guidelines, “low lean mass” could be defined using ALMI with Z-scores obtained from a young adult, gender and race matched population. A value of ALMI less than 2 Z-score allows the diagnosis of sarcopenia. Some threshold has been proposed but not yet validated.
DXA exposes the patient to minimal radiation, representing an attractive alternative method both for research and for clinical use to distinguish fat, bone mineral and lean tissues. However, the main limit is that the equipment is not portable, precluding its use in large-scale epidemiological studies.
Computed Tomography in sarcopenia
CT and MRI, as already stated, are considered the gold standard to evaluate BC and quantitative and qualitative changes in muscle mass.
CT is a cross-sectional imaging method able to distinguish the different tissues on their specific X-ray attenuation, providing information on muscle quantity and composition[17].
On CT, normal density values for muscle density range from 40 to 100 Hounsfield units (HU); with fatty infiltration, consequent to aging, pathological conditions or disuse, there is a reduction of muscle HU values between 0-30 HU.
Post-processing reconstruction algorithms allow quantitative evaluation of muscle composition and adipose tissue distribution with high accuracy, as demonstrated by Mitsiopoulous et al. that studied the correlation between some CT features (values of upper and lower limbs, adipose tissue-free skeletal muscle, adipose tissue adjacent to muscle, interstitial adipose tissue) in living people and in cadaveric bodies[56].
Muscle segmentation can be performed with specific software using HU density thresholds, usually at the level of L4 vertebra to measure psoas muscle cross-sectional area (CSA) and at T12 level to measure paraspinal muscles CSA.
Nonetheless, the main limitations of CT are the high radiation dose and the high cost[57]. A valid alternative to CT is the pQCT. As CT, in fact, it can provide CSA of soft tissue and estimation of the muscle density, but with lower effective dose (<1 µSv per scan) and cost.
Even if originally designed to assess osteoporosis, so, it can be used for soft tissue evaluation, but the analysis is limited to peripheral limbs, up to the mid-tigh. In pQCT typical muscle density ranges from 65 to 90 mg/cm3 [58]; in case of fatty infiltration the density values are lower. Muscle CSA and muscle density can be obtained with dedicated manufacturer softwares after a semi-automated muscle segmentation[59].
Usually, the image acquisition and analysis are performed at the 66% tibia and 65% radius sites, but there is not yet a validated protocol. This is the main limitation of pQCT.
Magnetic Resonance Imaging in sarcopenia
As CT, MRI produce cross-sectional images allowing for segmental and total measures of fat and lean mass[51,59].
In the study of BC, MRI plays an important role. It differentiates between adipose tissue and fat-free mass without the use of ionizing radiation, but with radiofrequency pulse sequences; in particular adipose tissue is characterized by a short T1 and a long T2 proton relaxation time[60]. The different physical base principles of MRI are the major advantage of MRI, making it suitable for follow-up and for monitoring disease progression and therapy efficacy.
Relying on the different molecular properties of tissues, with MRI is possible to distinguish at the same time qualitative abnormalities such as changes in muscle structure, edema, or intramuscular adipose tissue or fibrosis[61] (Figure 6) and to assess muscle composition by several quantitative techniques. Among these, Dixon MRI and chemical shift sequences offer the possibility for water-fat separated MRI evaluation[62-64], giving measurements of muscle volume and degree of fat infiltration[65].
Figure 6.

T1 weighted MRI images of the thighs of a young girl with Ehlers-Danlos syndrome: severe fatty infiltration of the quadriceps muscles.
Moreover, MRI with diffusion tensor imaging (DTI) evaluates muscle microstructure and fatty infiltration measuring anisotropy in water diffusion[66]. A further possibility is spectroscopy with its precise quantification of the percentage of intracellular fat.
In the last years, many studies focused on the age-related changes in skeletal muscle mass using MRI.
Jansen et al. observed that, with the advancing age, the loss of muscle mass was higher in the lower limbs than in the superiors in both genders[67]; moreover, several studies noted structural difference of muscles of the lower limbs in elderly in comparison with young people[68-70].
A study by Braun et al. documented a larger contractile CSA of the tibialis anterior muscle and smaller amount of intramuscular non-contractile tissue in healthy people between 25 and 45 years old in comparison with older (65-85 years old)[71].
These features make MRI, together with CT, the gold standard in the assessment of sarcopenia, but the high cost, the complexity and the limited availability on the territory limit its use in clinical practice[4,17,72]. Furthermore, also for MRI, the lack of a standardized assessment protocol in image analysis represents a strong weakness, limiting the comparison among different studies.
Ultrasound in sarcopenia
One of the main limit of CT and MRI is the lack of feasibility in the clinical routine, despite they are considered the gold standards in the assessment of BC; ultrasound represents a practical non-invasive alternative technique to evaluate BC and muscle mass[73] as showed in some studies in which the measurements of muscle mass had a good correlation with those found with MRI[74].
The US main advantages are simplicity, low cost, and lack of radiation exposure.
Also for US, the assessment is not standardized and, to the best of our knowledge, it is not included in the diagnostic algorithm of any operative definition of sarcopenia[75].
The parameters most commonly evaluated by ultrasound technique are muscle thickness, CSA, echo intensity, fascicle length and pennation angle of the lower limbs. This last one is the angle between a fascicle’s orientation and the tendon axis; is an important muscle feature that determines the fascicle’s force contribution to skeletal movement[76]. Anyway, all of these parameters provide information about mechanical and contractile proprieties and are affected by aging; however, together with the site-specific cut-off points, they are not validated to be included in diagnostic algorithms for the ultrasound-based assessment of muscle mass in elderly patients.
Conclusion
The concept of Bone-Muscle Unit is a synthesis of the deeply relation in function and development between bone and muscle. In fact, the maintenance and functionality of bone mass and muscle mass are deeply related, and both of them are affected by age and metabolic disease.
The combination of osteoporosis and sarcopenia, with their consequences, has a high impact on quality life and, given the rise in life expectancy, shows an increasing social interest.
It results mandatory to properly diagnose these diseases at the early stages, to prevent their clinical onset and consequences.
For that, this review aims to present the different imaging modalities available for a non-invasive investigation of bone and muscle mass and quality in osteoporosis and sarcopenia, with their application and limitations.
DXA is the reference standard for diagnosis and management of osteoporosis, furthermore, it offers the possibility to assess BC with accurate values compared to CT and MRI (currently considered the Gold Standard for the diagnosis of sarcopenia), but with the advantages of lower costs and wider availability.
For this reasons, DXA is emerging as the new Gold standard for the diagnosis of sarcopenia.
Footnotes
Edited by: George Lyritis
References
- 1.Kanis JA. On behalf of the World Health Organization Scientific Group (2008) Assessment of osteoporosis at the primary health care level:technical Report. WHO Collaborating Centre for Metabolic Bone Diseases, University of Sheffield, UK [Google Scholar]
- 2.Guglielmi G, Muscarella S, Bazzocchi A. Integrated imaging approach to osteoporosis:state-of-the-art review and update. Radiographics. 2011;31(5):1343–64. doi: 10.1148/rg.315105712. [DOI] [PubMed] [Google Scholar]
- 3.National Osteoporosis Foundation. Washington, DC: National Osteoporosis Foundation; 2008. Physician's guide to prevention and treatment of osteoporosis. [Google Scholar]
- 4.Cruz-Jentoft AJ, Baeyens JP, Bauer JM, et al. Sarcopenia:European consensus on definition and diagnosis:Report of the European Working Group on Sarcopenia in Older People. Age and Ageing. 2010;39(4):412–423. doi: 10.1093/ageing/afq034. [DOI] [PMC free article] [PubMed] [Google Scholar]
- 5.Cruz-Jentoft AJ, Landi F, Schneider SM, Zuniga C, Arai H, Boirie Y, et al. Prevalence of and interventions for sarcopenia in ageing adults:a systematic review. Report of the International Sarcopenia Initiative (EWGSOP and IWGS) Age Ageing. 2014;43(6):748–59. doi: 10.1093/ageing/afu115. [DOI] [PMC free article] [PubMed] [Google Scholar]
- 6.Laurent MR, Dubois V, Claessens F, Verschueren SM, Vanderschueren D, Gielen E, et al. Muscle-bone interactions:From experimental models to the clinic? A critical update. Mol Cell Endocrinol. 2016;432:14–36. doi: 10.1016/j.mce.2015.10.017. [DOI] [PubMed] [Google Scholar]
- 7.Kaji H. Interaction between Muscle and Bone. J Bone Metab. 2014;21(1):29–40. doi: 10.11005/jbm.2014.21.1.29. [DOI] [PMC free article] [PubMed] [Google Scholar]
- 8.Tagliaferri C, Wittrant Y, Davicco MJ, Walrand S, Coxam V. Muscle and bone, two interconnected tissues. Ageing Res Rev. 2015;21:55–70. doi: 10.1016/j.arr.2015.03.002. [DOI] [PubMed] [Google Scholar]
- 9.Reginster JY, Beaudart C, Buckinx F, Bruyere O. Osteoporosis and sarcopenia:two diseases or one? Curr Opin Clin Nutr Metab Care. 2016;19(1):31–6. doi: 10.1097/MCO.0000000000000230. [DOI] [PMC free article] [PubMed] [Google Scholar]
- 10.Curtis E, Litwic A, Cooper C, Dennison E. Determinants of Muscle and Bone Aging. J Cell Physiol. 2015;230(11):2618–25. doi: 10.1002/jcp.25001. [DOI] [PMC free article] [PubMed] [Google Scholar]
- 11.Kaji H. Linkage between muscle and bone:common catabolic signals resulting in osteoporosis and sarcopenia. Curr Opin Clin Nutr Metab Care. 2013;16(3):272–7. doi: 10.1097/MCO.0b013e32835fe6a5. [DOI] [PubMed] [Google Scholar]
- 12.Tarantino U, Piccirilli E, Fantini M, Baldi J, Gasbarra E, Bei R. Sarcopenia and fragility fractures:molecular and clinical evidence of the bone-muscle interaction. J Bone Joint Surg Am. 2015;97(5):429–37. doi: 10.2106/JBJS.N.00648. [DOI] [PubMed] [Google Scholar]
- 13.Tarantino U, Baldi J, Celi M, Rao C, Liuni FM, Iundusi R, Gasbarra E. Osteoporosis and sarcopenia:the connections. Aging Clin Exp Res. 2013;25(Suppl 1):S93–5. doi: 10.1007/s40520-013-0097-7. [DOI] [PubMed] [Google Scholar]
- 14.Girgis CM. Integrated therapies for osteoporosis and sarcopenia:from signaling pathways to clinical trials. Calcif Tissue Int. 2015;96(3):243–55. doi: 10.1007/s00223-015-9956-x. [DOI] [PubMed] [Google Scholar]
- 15.Guglielmi G, Muscarella S, Bazzocchi A. Integrated imaging approach to osteoporosis:state-of-the-art review and update. Radiographics. 2011;31(5):1343–64. doi: 10.1148/rg.315105712. [DOI] [PubMed] [Google Scholar]
- 16.Guerri S, Mercatelli D, et al. Quantitative imaging techniques for the assessment of osteoporosis and sarcopenia. Quant Imaging Med Surg 2018. 2018 Jan 17; doi: 10.21037/qims.2018.01.05. [DOI] [PMC free article] [PubMed] [Google Scholar]
- 17.Guglielmi G, Muscarella S, Bazzocchi A. Integrated imaging approach to osteoporosis:state-of-the-art review and update. Radiographics. 2011;31(5):1343–64. doi: 10.1148/rg.315105712. [DOI] [PubMed] [Google Scholar]
- 18.Bazzocchi A, Ponti F, Albisinni U, Battista G, Guglielmi G. DXA:Technical aspects and application. Eur J Radiol. 2016;85(8):1481–92. doi: 10.1016/j.ejrad.2016.04.004. [DOI] [PubMed] [Google Scholar]
- 19.Damilakis J, Guglielmi G. Quality assurance and dosimetry in bone densitometry. Radiol Clin North Am. 2010;48(3):629–640. doi: 10.1016/j.rcl.2010.02.011. [DOI] [PubMed] [Google Scholar]
- 20.Link TM. Osteoporosis Imaging:State of the Art and Advanced Imaging. Radiology. 2012 Apr;263(1):3–17. doi: 10.1148/radiol.12110462. [DOI] [PMC free article] [PubMed] [Google Scholar]
- 21.Assessment of fracture risk and its application to screening for postmenopausal osteoporosis. Report of a WHO Study Group. World Health Organ Tech Rep Ser. 1994;843:1–129. [PubMed] [Google Scholar]
- 22.Wainwright SA, Marshall LM, et al. Study of Osteoporotic Fractures Research Group. Hip fracture in women without osteoporosis. J Clin Endocrinol Metab. 2005;90(5):2787–93. doi: 10.1210/jc.2004-1568. [DOI] [PubMed] [Google Scholar]
- 23.Trombetti A, Herrmann F, Hoffmeyer P, Schurch MA, Bonjour JP, Rizzoli R. Survival and potential years of life lost after hip fracture in men and age-matched women. Osteoporos Int. 2002;13(9):731–7. doi: 10.1007/s001980200100. [DOI] [PubMed] [Google Scholar]
- 24.Broy SB, Cauley JA, Lewiecki ME, Schousboe JT, Shepherd JA, Leslie WD. Fracture Risk Prediction by Non-BMD DXA Measures:the 2015 ISCD Official Positions Part 1:Hip Geometry. J Clin Densitom. 2015;18(3):287–308. doi: 10.1016/j.jocd.2015.06.005. [DOI] [PubMed] [Google Scholar]
- 25.Setiawati R, Di Chio F, Rahardjo P, Nasuto M, Dimpudus FJ, Guglielmi G. Quantitative Assessment of Abdominal Aortic Calcifications Using Lateral Lumbar Radiograph, Dual-Energy X-ray Absorptiometry, and Quantitative Computed Tomography of the Spine. J Clin Densitom. 2016;19(2):242–9. doi: 10.1016/j.jocd.2015.01.007. [DOI] [PubMed] [Google Scholar]
- 26.Prevrhal S, Shepherd JA, Faulkner KG, Gaither KW, Black DM, Lang TF. Comparison of DXA hip structural analysis with volumetric QCT. J Clin Densitom. 2008;11(2):232–6. doi: 10.1016/j.jocd.2007.12.001. [DOI] [PubMed] [Google Scholar]
- 27.Kaptoge S, Beck TJ, Reeve J, Stone KL, Hillier TA, Cauley JA, et al. Prediction of incident hip fracture risk by femur geometry variables measured by hip structural analysis in the study of osteoporotic fractures. J Bone Miner Res. 2008;23(12):1892–904. doi: 10.1359/JBMR.080802. [DOI] [PMC free article] [PubMed] [Google Scholar]
- 28.Silva BC, Leslie WD, Resch H, Lamy O, Lesnyak O, Binkley N, McCloskey EV, Kanis JA, Bilezikian JP. Trabecular bone score:a noninvasive analytical method based upon the DXA image. J Bone Miner Res. 2014;29(3):518–30. doi: 10.1002/jbmr.2176. [DOI] [PubMed] [Google Scholar]
- 29.Pothuaud L, Carceller P, Hans D. Correlations between grey-level variations in 2D projection images (TBS) and 3D microarchitecture:applications in the study of human trabecular bone microarchitecture. Bone. 2008;42:775–87. doi: 10.1016/j.bone.2007.11.018. [DOI] [PubMed] [Google Scholar]
- 30.Shevroja E, Lamy O, Kohlmeier L, Koromani F, Rivadeneira F, Hans D. Use of Trabecular Bone Score (TBS) as a Complementary Approach to Dual-energy X-ray Absorptiometry (DXA) for Fracture Risk Assessment in Clinical Practice. J Clin Densitom. 2017;20(3):334–45. doi: 10.1016/j.jocd.2017.06.019. [DOI] [PubMed] [Google Scholar]
- 31.Harvey NC, Glüer CC, Binkley N, McCloskey EV, Brandi ML, Cooper C, Kendler D, Lamy O, Laslop A, Camargos BM, Reginster JY, Rizzoli R, Kanis JA. Trabecular bone score (TBS) as a new complementary approach for osteoporosis evaluation in clinical practice. Bone. 2015;78:216–24. doi: 10.1016/j.bone.2015.05.016. [DOI] [PMC free article] [PubMed] [Google Scholar]
- 32.Genant HK, Wu CY, van Kuijk C, et al. Vertebral fracture assessment using a semiquantitative technique. J Bone Miner Res. 1993;(9):1137–1148. doi: 10.1002/jbmr.5650080915. [DOI] [PubMed] [Google Scholar]
- 33.Genant HK, Jergas M, Palermo L, Nevitt M, Valentin RS, Black D, Cummings SR. Comparison of semiquantitative visual and quantitative morphometric assessment of prevalent and incident vertebral fractures in osteoporosis The Study of Osteoporotic Fractures Research Group. J Bone Miner Res. 1996;11(7):984–96. doi: 10.1002/jbmr.5650110716. [DOI] [PubMed] [Google Scholar]
- 34.Griffith JF, Genant HK. New imaging modalities in bone. Curr Rheumatol Rep. 2011;13(3):241–250. doi: 10.1007/s11926-011-0174-x. [DOI] [PMC free article] [PubMed] [Google Scholar]
- 35.Engelke K, Adams JE, Armbrecht G, et al. Clinical use of quantitative computed tomography and peripheral quantitative computed tomography in the management of osteoporosis in adults:the 2007 ISCD Official Positions. J Clin Densitom. 2008;11:123e162. doi: 10.1016/j.jocd.2007.12.010. [DOI] [PubMed] [Google Scholar]
- 36.Bousson V, Le Bras A, Roqueplan F, et al. Volumetric quantitative computed tomography of the proximal femur:relationshipslinking geometric and densitometric variables to bone strength. Role for compact bone. Osteoporos Int. 2006;17(6):855–864. doi: 10.1007/s00198-006-0074-5. [DOI] [PubMed] [Google Scholar]
- 37.Link TM. Osteoporosis Imaging:State of the Art and Advanced. Radiology. 2012;263:3–17. doi: 10.1148/radiol.12110462. [DOI] [PMC free article] [PubMed] [Google Scholar]
- 38.Adams JE. Advances in bone imaging for osteoporosis. Nat Rev Endocrinol. 2013;9:28–42. doi: 10.1038/nrendo.2012.217. [DOI] [PubMed] [Google Scholar]
- 39.Engelke K, Adams JE, Armbrecht G, et al. Clinical use of quantitative computed tomography and peripheral quantitative computed tomography in the management of osteoporosis in adults:the 2007 ISCD Official Positions. J Clin Densitom. 2008;11:123e162. doi: 10.1016/j.jocd.2007.12.010. [DOI] [PubMed] [Google Scholar]
- 40.Ashe MC, Khan KM, Kontulainen SA, et al. Accuracy of pQCT for evaluating the aged human radius:an ashing, histomorphometry and failure load investigation. Osteoporos Int. 2006;17(8):1241–1251. doi: 10.1007/s00198-006-0110-5. [DOI] [PubMed] [Google Scholar]
- 41.Cohen A, Dempster DW, Müller R, et al. Assessment of trabecular and cortical architecture and mechanical competence of bone by high-resolution peripheral computed tomography:comparison with transiliac bone biopsy. Osteoporos Int. 2010;21(2):263–73. doi: 10.1007/s00198-009-0945-7. [DOI] [PMC free article] [PubMed] [Google Scholar]
- 42.Shen Y, Zhang YH, Shen L. Postmenopausal women with osteoporosis and osteoarthritis show different microstructural characteristics of trabecular bone in proximal tibia using high-resolution magnetic resonance imaging at 3 tesla. BMC Musculoskeletal Disorders. 2013;14:136. doi: 10.1186/1471-2474-14-136. [DOI] [PMC free article] [PubMed] [Google Scholar]
- 43.Rebuzzi M, Vinicola V, Taggi F, Sabatini U, Wehrli FW, Capuani S. Potential diagnostic role of the MRI-derived internal magnetic field gradient in calcaneus cancellous bone for evaluating postmenopausal osteoporosis at 3 T. Bone. 2013;57:155–163. doi: 10.1016/j.bone.2013.07.027. [DOI] [PubMed] [Google Scholar]
- 44.Tang GY, Lv ZW, Tang RB, Liu Y, Peng YF, Li W, Cheng YS. Evaluation of MR spectroscopy and diffusion-weighted MRI in detecting bone marrow changes in postmenopausal women with osteoporosis. Clin Radiol. 2010;65(5):377–81. doi: 10.1016/j.crad.2009.12.011. [DOI] [PubMed] [Google Scholar]
- 45.Biffar A, Dietrich O, Sourbron S, Duerr HR, Reiser MF, Baur-Melnyk A. Diffusion and perfusion imaging of bone marrow. Eur J Radiol. 2010;76(3):323–8. doi: 10.1016/j.ejrad.2010.03.011. [DOI] [PubMed] [Google Scholar]
- 46.Krieg MA, Barkmann R, Gonnelli S, Stewart A, Bauer DC, Del Rio Barquero L, et al. Quantitative ultrasound in the management of osteoporosis:the 2007 ISCD Official Positions. J Clin Densitom. 2008;11(1):163–87. doi: 10.1016/j.jocd.2007.12.011. [DOI] [PubMed] [Google Scholar]
- 47.Guglielmi G, De Terlizzi F, Nasuto M, Sinibaldi L, Brancati F. Quantitative ultrasound at the phalanges in a cohort of monozygotic twins of different ages. Radiol Med. 2015;120(3):277–82. doi: 10.1007/s11547-014-0440-x. [DOI] [PubMed] [Google Scholar]
- 48.Adams JE. Advances in bone imaging for osteoporosis. Nat. Rev. Endocrinol. 2013;9:28–42. doi: 10.1038/nrendo.2012.217. (Hartl F, Tyndall A, Kraenzlin M et al. Discriminatory ability of quantitative ultrasound parameters and bone mineral density in a population-based sample of postmenopausal women with vertebral fractures:result of the Basel Osteoporosis Study. J Bone Min Res 2002;17:321-330. [DOI] [PubMed] [Google Scholar]
- 49.Guglielmi G, Nasuto M. Quantitative ultrasound and fracture risk assessment. In: Guglielmi G, editor. Osteoporosis and bone densitometry measurements, medical radiology, diagnostic imaging. Berlin-Heidelberg: Springer-Verlag; 2003. pp. 133–44. [Google Scholar]
- 50.Chien MY, Huang TY, Wu YT. Prevalence of sarcopenia estimated using a bioelectrical impedance analysis prediction equation in community-dwelling elderly people in Taiwan. J Am Geriatr Soc. 2008;56:1710–5. doi: 10.1111/j.1532-5415.2008.01854.x. [DOI] [PubMed] [Google Scholar]
- 51.Levine JA, Abboud L, Barry M, Reed JE, Sheedy PF, Jensen MD. Measuring leg muscle and fat mass in humans:comparison of CT and dual-energy X-ray absorptiometry. J Appl Physiol. 2000;88:452–6. doi: 10.1152/jappl.2000.88.2.452. [DOI] [PubMed] [Google Scholar]
- 52.Guglielmi G, Ponti F, Agostini M, et al. The role of DXA in sarcopenia. Aging Clin Exp Res. 2016;28:1047. doi: 10.1007/s40520-016-0589-3. [DOI] [PubMed] [Google Scholar]
- 53.Erlandson MC, Lorbergs AL, Mathur S, Cheung AM. Muscle analysis using pQCT, DXA and MRI. Eur J Radiol. 2016;85:1505–11. doi: 10.1016/j.ejrad.2016.03.001. [DOI] [PubMed] [Google Scholar]
- 54.Petak S, Barbu CG, Yu EW, Fielding R, Mulligan K, Sabowitz B, Wu C-H, Shepherd JA. The Offcial Positions of the International Society for Clinical Densitometry:body composition analysis reporting. J Clin Densitom. 2013;16:508–19. doi: 10.1016/j.jocd.2013.08.018. [DOI] [PubMed] [Google Scholar]
- 55.Janssen I, Heymsfield SB, Ross R. Low relative skeletal muscle mass (sarcopenia) in older persons is associated with functional impairment and physical disability. J Am Geriatr Soc. 2002;50(5):889–96. doi: 10.1046/j.1532-5415.2002.50216.x. [DOI] [PubMed] [Google Scholar]
- 56.Mitsiopoulos N, Baumgartner RN, Heymsfield SB, Lyons W, Gallagher D, Ross R. Cadaver validation of skeletal muscle measurement by magnetic resonance imaging and computerized tomography. J Appl Physiol (1985) 1998;85(1):115–22. doi: 10.1152/jappl.1998.85.1.115. [DOI] [PubMed] [Google Scholar]
- 57.Erlandson MC, Lorbergs AL, Mathur S, Cheung AM. Muscle analysis using pQCT, DXA and MRI. Eur J Radiol. 2016;85(8):1505–11. doi: 10.1016/j.ejrad.2016.03.001. [DOI] [PubMed] [Google Scholar]
- 58.Wong AKO, Hummel K, Moore C, Beattie KA, Shaker S, Craven BC, et al. Improving Reliability of pQCT-Derived Muscle Area and Density Measures Using a Watershed Algorithm for Muscle and Fat Segmentation. J Clin Densitom. 2015;18(1):93–101. doi: 10.1016/j.jocd.2014.04.124. [DOI] [PMC free article] [PubMed] [Google Scholar]
- 59.Andreoli A, Scalzo G, Masala S, Tarantino U, Guglielmi G. Body composition assessment by dual-energy X-ray absorptiometry (DXA) Radiol Med. 2009;114:286–300. doi: 10.1007/s11547-009-0369-7. [DOI] [PubMed] [Google Scholar]
- 60.Houmard JA, Smith R, Jendrasiak GL. Relationship between MRI relaxation time and muscle fiber composition. Journal of Applied Physiology. 1995;78(3):807–9. doi: 10.1152/jappl.1995.78.3.807. [DOI] [PubMed] [Google Scholar]
- 61.Boutin RD, Yao L, Canter RJ, Lenchik L. Sarcopenia:Current Concepts and Imaging Implications. AJR Am J Roentgenol. 2015;205:W255–66. doi: 10.2214/AJR.15.14635. [DOI] [PubMed] [Google Scholar]
- 62.Fischer MA, Pfirrmann CW, Espinosa N, Raptis DA, Buck FM. Dixon-based MRI for assessment of muscle-fat content in phantoms, healthy volunteers and patients with achillodynia:comparison to visual assessment of calf muscle quality. Eur Radiol. 2014;24(6):1366–75. doi: 10.1007/s00330-014-3121-1. [DOI] [PubMed] [Google Scholar]
- 63.Alizai H, Nardo L, Karampinos DC, Joseph GB, Yap SP, Baum T, et al. Comparison of clinical semi-quantitative assessment of muscle fat infiltration with quantitative assessment using chemical shiftbased water/fat separation in MR studies of the calf of postmenopausal women. Eur Radiol. 2012;22(7):1592–600. doi: 10.1007/s00330-012-2404-7. [DOI] [PMC free article] [PubMed] [Google Scholar]
- 64.Nardo L, Karampinos DC, Lansdown DA, Carballido-Gamio J, Lee S, Maroldi R, et al. Quantitative assessment of fat infiltration in the rotator cuff muscles using water-fat MRI. J Magn Reson Imaging. 2014;39(5):1178–85. doi: 10.1002/jmri.24278. [DOI] [PMC free article] [PubMed] [Google Scholar]
- 65.Heymsfield SB, Gonzalez MC, Lu J, Jia G, Zheng J. Skeletal muscle mass and quality:evolution of modern measurement concepts in the context of sarcopenia. Proc Nutr Soc. 2015;74:355–66. doi: 10.1017/S0029665115000129. [DOI] [PubMed] [Google Scholar]
- 66.Dixon WT. Simple proton spectroscopic imaging. Radiology. 1984;153:189–94. doi: 10.1148/radiology.153.1.6089263. [DOI] [PubMed] [Google Scholar]
- 67.Janssen I, Heymsfield SB, Wang ZM, Ross R. Skeletal muscle mass and distribution in 468 men and women aged 18-88 yr. J Appl Physiol (1985) 2000;89(1):81–8. doi: 10.1152/jappl.2000.89.1.81. [DOI] [PubMed] [Google Scholar]
- 68.Kent-Braun JA, Ng AV, Young K. Skeletal muscle contractile and noncontractile components in young and older women and men. Journal of Applied Physiology. 2000;88(2):662–8. doi: 10.1152/jappl.2000.88.2.662. [DOI] [PubMed] [Google Scholar]
- 69.Macaluso A, Nimmo MA, Foster JE, Cockburn M, McMillan NC, De Vito G. Contractile muscle volume and agonist-antagonist coactivation account for differences in torque between young and older women. Muscle Nerve. 2002;25(6):858–63. doi: 10.1002/mus.10113. [DOI] [PubMed] [Google Scholar]
- 70.Nilwik R, Snijders T, Leenders M, Groen BB, van Kranenburg J, Verdijk LB, et al. The decline in skeletal muscle mass with aging is mainly attributed to a reduction in type II muscle fiber size. Exp Gerontol. 2013;48(5):492–8. doi: 10.1016/j.exger.2013.02.012. [DOI] [PubMed] [Google Scholar]
- 71.Guglielmi G, Bazzocchi A. Editorial. Eur J Radiol. 2016;85(8):1453–5. doi: 10.1016/j.ejrad.2016.05.011. [DOI] [PubMed] [Google Scholar]
- 72.Bazzocchi A, Filonzi G, Ponti F, Albisinni U, Guglielmi G, Battista G. Ultrasound:Which role in body composition? Eur J Radiol. 2016;85(8):1469–80. doi: 10.1016/j.ejrad.2016.04.005. [DOI] [PubMed] [Google Scholar]
- 73.Pillen S, van Alfen N. Skeletal muscle ultrasound. Neurol Res. 2011;33(10):1016–24. doi: 10.1179/1743132811Y.0000000010. [DOI] [PubMed] [Google Scholar]
- 74.Sanada K, Kearns CF, Midorikawa T, Abe T. Prediction and validation of total and regional skeletal muscle mass by ultrasound in Japanese adults. Eur J Appl Physiol. 2006;96(1):24–31. doi: 10.1007/s00421-005-0061-0. [DOI] [PubMed] [Google Scholar]
- 75.Ticinesi A, Meschi T, Narici MV, Lauretani F, Maggio M. Muscle Ultrasound and Sarcopenia in Older Individuals:A Clinical Perspective. J Am Med Dir Assoc. 2017;18(4):290–300. doi: 10.1016/j.jamda.2016.11.013. [DOI] [PubMed] [Google Scholar]
- 76.Bolsterlee Bart, et al. Comparison of measurements of medial gastrocnemius architectural parameters from ultrasound and diffusion tensor images Journal of Biomechanics 2015. 48(6):1133–1140. doi: 10.1016/j.jbiomech.2015.01.012. [DOI] [PubMed] [Google Scholar]