

Summary
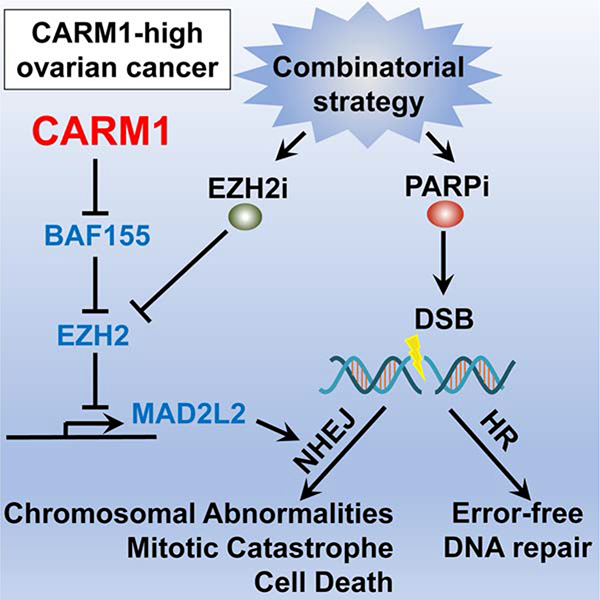
In response to DNA double-strand breaks, MAD2L2-containing shieldin complex plays a critical role in the choice between homologous recombination (HR) and non-homologous end joining (NHEJ)-mediated repair. Here we show that EZH2 inhibition upregulates MAD2L2 and sensitizes HR-proficient epithelial ovarian cancer (EOC) to poly (adenosine diphosphate-ribose) polymerase inhibitor (PARPi) in a CARM1-dependent manner. CARM1 promotes MAD2L2 silencing by driving the switch from the SWI/SNF complex to EZH2 through methylating the BAF155 subunit of the SWI/SNF complex on the MAD2L2 promoter. EZH2 inhibition upregulates MAD2L2 to decrease DNA end resection, which increases NHEJ and chromosomal abnormalities, ultimately causing mitotic catastrophe in PARPi treated HR-proficient cells. Significantly, EZH2 inhibitor sensitizes CARM1-high, but not CARM-low, EOCs to PARPi in both orthotopic and patient-derived xenografts.
Graphical Abstract
In Brief
Karakashev et al. show that CARM1 promotes EZH2-mediated epigenetic silencing of the shieldin complex protein MAD2L2. Inhibition of EZH2 induces MAD2L2 expression and non-homologous end joining in CARM1-high, homologous recombination proficient ovarian carcinoma cells, sensitizing them to PARP inhibitors.
Introduction
High-grade serous ovarian cancer (HGSOC) is the most common and fatal subtype of epithelial ovarian cancer (EOC). By inhibiting single-strand DNA break repair, PARP inhibitors (PARPi) are synthetically lethal in homologous recombination (HR)-deficient cancer cells (Lord and Ashworth, 2017). Indeed, PARPi such as Olaparib have been approved for treatment and maintenance in HGSOC with HR deficiency such as those caused by BRCA1/2 mutations with substantial clinical benefits (Konstantinopoulos et al., 2015; Moore et al., 2018). However, there is a major unmet clinical need to expand PARPi utility into HR-proficient HGSOCs that account for ~50% of HGSOCs (Konstantinopoulos et al., 2015).
CARM1 (also known as PRMT4) is an arginine methyltransferase that asymmetrically dimethylates arginine residues on protein substrates implicated in a number of pathways, including epigenetic regulation of gene transcription (Wang et al., 2014; Wu and Xu, 2012). CARM1 amplification/overexpression occurs in ~20% of HGSOCs, and CARM1-high HGSOCs are typically HR-proficient and mutually exclusive with BRCA1/2 mutations (Karakashev et al., 2018). EZH2 is the catalytic subunit of the polycomb repressive complex 2 (PRC2), which silences its target genes by generating a lysine 27 trimethylation epigenetic mark on histone H3 (H3K27me3) (Cao and Zhang, 2004). CARM1 functions as an oncogene in breast cancer by methylating the BAF155 subunit of the SWI/SNF complex (Wang et al., 2014). In addition, inhibition of EZH2 activity is a therapeutic vulnerability in cells with functional deficiency in the SWI/SNF complex (Hohmann and Vakoc, 2014). However, despite the mutual exclusivity between CARM1 amplification/overexpression and BRCA1/2 mutations in HGSOCs, whether EZH2 inhibition sensitizes CARM1-high HGSOCs to PARPi has not been explored.
DNA double strand break (DSB) is repaired by either error-free homologous recombination (HR) or error-prone non-homologous end joining (NHEJ) pathways (Ceccaldi et al., 2016). The choice between these two DSB repair pathways is regulated by a number of factors such as cell cycle and DSB end structure (Ceccaldi et al., 2016). For example, HR requires end resection to generate a 3’ overhang, while NHEJ can join unresected ends. MAD2L2 (also known as REV7) is a subunit of the shieldin complex that plays a critical role in the choice between HR and NHEJ DSB repair (Boersma et al., 2015; Ghezraoui et al., 2018; Gupta et al., 2018; Noordermeer et al., 2018; Tomida et al., 2018; Xu et al., 2015). The MAD2L2-containing shieldin promotes NHEJ by protecting DNA ends from resecting. In BRCA-deficient cells, loss of shieldin complex impairs NHEJ and drives PARP inhibitor resistance. Despite the role of shieldin in promoting NHEJ and its loss in mediating PARP inhibitor resistance in BRCA-deficient cells (Boersma et al., 2015; Dev et al., 2018; Ghezraoui et al., 2018; Gupta et al., 2018; Noordermeer et al., 2018; Xu et al., 2015), whether MAD2L2-containing shieldin complex can be explored for sensitizing PARP inhibitor in HR-proficient cells has not been investigated.
Results
EZH2 inhibitor sensitizes CARM1-high cells to a PARP inhibitor.
CARM1 amplification/overexpression is typically mutually exclusive with genetic alterations that cause HR defects such as BRCA1/2 mutations in HGSOCs (Figure S1A–B) and expression of CARM1 positively correlates with copy number gain or amplification in the TCGA HGSOC dataset (Figure S1C). PARP inhibitors are synthetically lethal with BRCA1/2 mutations in patients with HGSOCs (Konstantinopoulos et al., 2015; Moore et al., 2018). Since EZH2 inhibition is synthetically lethal with alterations in the CARM1-regulated SWI/SNF complex (Karakashev et al., 2018), we explored whether there is a synergy between EZH2 and PARP inhibitors. Indeed, EZH2 inhibitor GSK126 synergizes with PARP inhibitor Olaparib in CARM1-high A1847 cells, but not in CARM1 knockout A1847 cells (Figure 1A–B and S1D–F). Consistently, the IC50 of Olaparib was reduced by two different EZH2 inhibitors (GSK126 (McCabe et al., 2012) and Tazemetostat (Kuntz et al., 2016)) in CARM1-high, but not CARM1 knockout A1847 cells (Figure 1C–D). Conversely, EZH2 inhibitors decreased Olaparib IC50 in CARM1 overexpressing OVCAR3, but not in parental CARM1-low OVCAR3 cells (Figure S1G–I). In addition, genetic knockdown of EZH2 expression also decreased Olaparib IC50 in CARM1-high A1847 cells (Figure S1J–K). Similar observations were also made using another PARPi Rucaparib (Figure S1L–M) and cisplatin (Figure S1N–O), and in additional CARM1-high cells with or without CARM1 knockdown and, conversely, in CARM1-low cell with or without CARM1 overexpression (Figure S1P–S). The observed synergy between EZH2 and PARP inhibitors correlated with apoptosis induction in a CARM1-dependent manner (Figure 1E–F). Together, we conclude that EZH2 inhibitors sensitize CARM1-high ovarian cancer cells to PARP inhibitors.
Figure 1: CARM1-dependent sensitization of PARP inhibitor by EZH2 inhibitor.

A-B, Synergy analysis for PARP inhibitor Olaparib and EZH2 inhibitor GSK126 in (A) CARM1-high A1847 parental and (B) CARM1 knockout A1847 cells. Cells were treated with the indicated concentration of Olaparib and GSK126 for 72 hrs. The combination index (CI) value was determined as detailed in the materials and methods. CI value indicate: <1 synergism, =1 additive effect, >1 antagonism. C-D, Olaparib dose-response curves of (C) parental A1847 and (D) CARM1 knockout A1847 treated with the indicated concentration of EZH2 inhibitors GSK126 or Tazemetostat or vehicle DMSO control based on colony formation assays. E-F, The indicated cells were treated with 0.4 μM Olaparib, 2.5 μM GSK126 or a combination for 72 hrs. The apoptotic cells were (E) quantified by Annexin V staining or (F) examined for expression of cleaved PARP p85 or cleaved caspase 3 by immunoblot. Data represent mean ± SEM. n = 3 independent experiments. p values were calculated using a two-tailed t-test. See also Figure S1.
CARM1-dependent upregulation of MAD2L2 by EZH2 inhibitor
To explore the mechanism underlying the observed synergy between EZH2 and PARP inhibitors in CARM1-high cells, we cross-examined the RNA-seq and EZH2 and H3K27me3 ChIP-seq datasets comparing parental CARM1-high with CARM1 knockout A1847 cells (Figure S2A). The analysis revealed that the NHEJ pathway was enriched in the direct EZH2/H3K27me3 target genes whose expression was upregulated by CARM1 knockout. They include two protein encoding genes MAD2L2 and APLF as well as a long non-coding RNA (LINP1), which are all known regulators of NHEJ pathway (Figure S2A). Given the critical role of MAD2L2 in regulating NHEJ (Boersma et al., 2015; Dev et al., 2018; Ghezraoui et al., 2018; Gupta et al., 2018; Noordermeer et al., 2018; Xu et al., 2015), we focused our functional studies on MAD2L2. The association of EZH2 and its enzymatic product H3K27me3 with the MAD2L2 promoter was reduced by CARM1 knockout, which correlated with an increase in the expression of MAD2L2 (Figure 2A). We validated the upregulation of MAD2L2 at both mRNA and protein levels in EZH2 inhibitor GSK126-treated and CARM1 knockout cells (Figure 2B–C). However, there was no additive effect on MAD2L2 induced by GSK126 and CARM1 knockout suggesting that EZH2 and CARM1 function in the same pathway. Conversely, ectopic CARM1 expression in CARM1-low OVCAR3 cells repressed MAD2L2 expression, which was restored by EZH2 inhibitor GSK126 treatment (Figure 2D). Consistent with CARM1-regulated SWI/SNF complex distribution (Wang et al., 2014) and SWI/SNF antagonism with EZH2 in regulating their target gene expression (Wilson and Roberts, 2011), CARM1 knockout drove the switch from the SWI/SNF subunits such as BAF155, BRG1 and SNF5 to EZH2 (Figure 2E–G and Figure S2B–C). Notably, EZH2 inhibitor GSK126 decreased the association of H3K27me3 with the MAD2L2 promoter without affecting the association of either EZH2 or the subunits of the SWI/SNF complex with its promoter. Indeed, CARM1 expression negatively correlates with MAD2L2 expression in laser-capture and microdissected HGSOC specimens (Figure 2H). Similarly, CARM1-dependent expression and antagonism between EZH2 and SWI/SNF were also observed for other identified NHEJ regulators such as LINP1 and APLF (Figure S2D–J). Together, we conclude that EZH2 inhibitors sensitize ovarian cancer cells to PARP inhibitors in a CARM1-dependent manner, which correlates with CARM1’s role in driving the switch from the SWI/SNF complex to EZH2-mediated gene silencing for NHEJ genes such as MAD2L2.
Figure 2: CARM1-dependent upregulation of MAD2L2 by EZH2 inhibitor.
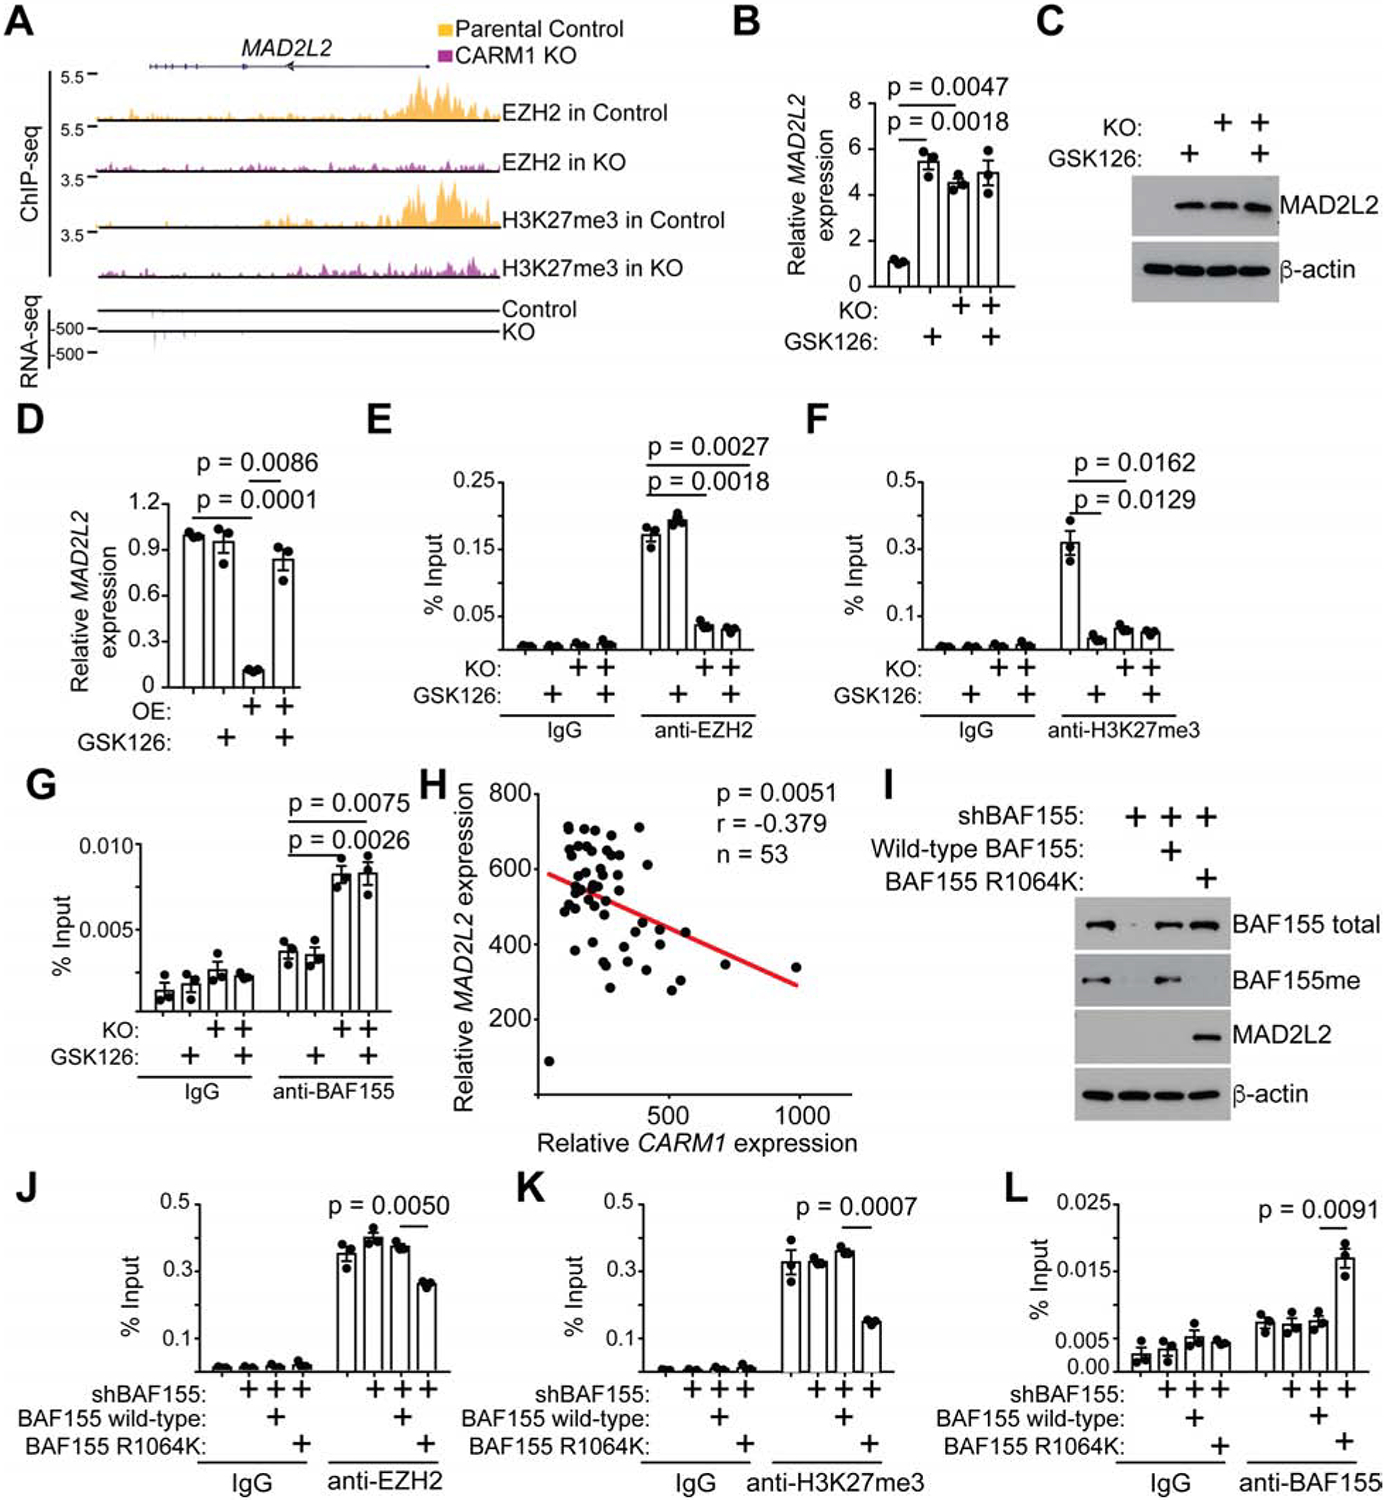
A, EZH2 and H3K27me3 ChIP-seq and RNA-seq tracks of the MAD2L2 gene locus in parental and CARM1 knockout A1847 cells. B-C, Expression of MAD2L2 (B) mRNA and (C) protein in CARM1-high parental A1847 cells with or without CARM1 knockout and treated with or without GSK126. D, Expression of MAD2L2 in CARM1-low OVCAR3 cells with or without ectopic CARM1 expression treated with or without GSK126 determined by qRT-PCR. E-G, Parental and CARM1 knockout A1847 cells treated with vehicle control or 10 μM GSK126 were subjected to ChIP analysis for the MAD2L2 promoter using antibodies against (E) EZH2, (F) H3K27me3, (G) BAF155 or an isotype matched IgG control. H, Negative correlation between CARM1 and MAD2L2 expression in HGSOC specimens based on a laser-capture and microdissected dataset (Mok et al., 2009). I-L, A1847 cells were infected with a lentivirus encoding shRNA targeting the 3’ untranslated region (UTR) of the BAF155 gene together with a retrovirus encoding a wild-type BAF155 or a BAF155 R1064K mutant. Drug-selected cells were (I) examined for expression of the indicated proteins by immunoblot or subjected to ChIP analysis for the MAD2L2 promoter using antibodies against (J) EZH2, (K) H3K27me3, (L) BAF155 or an isotype matched IgG control. Data represent mean ± SEM. n = 3 independent experiments unless otherwise stated. p values were calculated using a two-tailed t-test. See also Figures S2.
We next determined whether the CARM1-regulated antagonism between the SWI/SNF complex and EZH2 depends on the methylation of the R1064 residue of the BAF155 subunit by CARM1 (Wang et al., 2014). Toward this goal, we knocked down endogenous BAF155 in CARM1-high A1847 cells and ectopically expressed a shRNA-resistant wild-type BAF155 or a point mutant BAF155 R1064K that can no longer be methylated by CARM1 (Wang et al., 2014). Indeed, in the rescue experiment, the point mutant BAF155 R1064K that can no longer be methylated by CARM1 is sufficient to upregulate MAD2L2 on both mRNA and protein levels in BAF155 knockdown cells (Figure 2I and S2K). In contrast, wild-type BAF155 that can still be methylated by CARM1 was unable to upregulate MAD2L2 (Figure 2I and S2K). Consistently, the BAF155 R1064K mutant decreased the association of EZH2 and H3K27Me3 with the MAD2L2 promoter, while driving a switch of the SWI/SNF subunits such as BAF155, BRG1 and SNF5 back to the MAD2L2 promoter (Figure 2J–L and S2L–M). As a control, wild-type BAF155 failed to drive the switch back from EZH2 to the SWI/SNF complex on the MAD2L2 promoter (Figure 2J–L and S2L–M). Similar observations were also made for other identified CARM1-regulated NHEJ regulators such as LINP1 and APLF (Figure S2N–S). Thus, we conclude that CARM1 promotes the EZH2-mediated silencing of NHEJ regulators by methylating BAF155 to drive the switch from the SWI/SNF complex to EZH2-mediated gene silencing.
EZH2 inhibitor upregulates NHEJ activity in a CARM1-dependent manner.
We next directly determined changes in NHEJ and HR activities, two alternating DNA DSB repairing pathways (Ceccaldi et al., 2016), using a dual HR and NHEJ reporter assay (Arnoult et al., 2017) (Figure 3A). Indeed, GSK126 treatment or CARM1 knockout significantly increased NHEJ activity in CARM1-high cells (Figure 3B). Conversely, ectopic CARM1 expression significantly decreased NHEJ activity in CARM1-low cells, which can be restored by EZH2 inhibitor GSK126 treatment (Figure 3C). Notably, CARM1 knockout also increased HR activity in CARM1-high cells and, conversely, ectopic CARM1 expression decreased HR activity in CARM-low cells (Figure S3A–B). In contrast, EZH2 inhibition did not affect HR activity (Figure S3A–B). The increase in both NHEJ and HR activity by CARM1 knockout was recapitulated using a CARM1 inhibitor EZM2302 (Drew et al., 2017) (Figure S3C–E). Interestingly, CARM1 did not affect any known HR regulating genes based on RNA-seq analysis (e.g., Figure S1D and S3F). Instead, CARM1 knockout altered cell cycle distribution characterized by an increase in G2 phase (Figure S3G), which is known to favor HR-mediated DSB repair (Rothkamm et al., 2003). This suggests that compared with directly inhibiting CARM1 activity, inhibition of EZH2 activity is advantageous because it selectively upregulates NHEJ activity without affecting HR activity. Indeed, CARM1 inhibition failed to sensitize CARM1-high cells to PARP inhibitor (Figure S3H–I). Consistent with the finding that EZH2-mediated silencing of MAD2L2 depends on methylation of BAF155 by CARM1, same as EZH2 inhibitor, the BAF155 R1064K mutant increased NHEJ activity without affecting HR activity in BAF155 knockdown cells (Figure 3D–E). As a control, wild-type BAF155 did not affect either NHEJ or HR activity (Figure 3D–E). This correlated with a decrease in Olaparib IC50 in BAF155 R1064K rescued, but not wild-type BAF155 rescued cells (Figure S3J). Consistent with previous reports that MAD2L2-containing shieldin complex protects DNA end resection to promote NHEJ (Boersma et al., 2015; Dev et al., 2018; Ghezraoui et al., 2018; Gupta et al., 2018; Tomida et al., 2018; Xu et al., 2015), DNA combing assay revealed that upregulation of MAD2L2 by either EZH2 inhibitor GSK126 or CARM1 knockout correlated with a decrease in DNA end resection as reflected by an increase in CIdU/IdU ratio in the assay (Figure 3F). Together, we conclude that EZH2 inhibitor selectively upregulates NHEJ activity in CARM1-high cells, which correlates with a decrease in DNA end resection.
Figure 3: EZH2 inhibitor selectively increases NHEJ activity in CARM1-high cells.

A, Schematics of the dual NHEJ and HR reporter assay (Arnoult et al., 2017). B-C, NHEJ activity in (B) CARM1-high A1847 cells with or without CARM1 knockout or (C) CARM1-low OVCAR3 cells with or without ectopic CARM1 expression and treated with or without 10 μM GSK126 for 72 hr as determined by the percentage of eGFP cells in the dual NHEJ and HR reporter assay. D-E, A1847 cells were infected with a lentivirus encoding shRNA targeting the 3’ untranslated region (UTR) of the BAF155 gene together with a retrovirus encoding a wild-type BAF155 or a BAF155 R1064K mutant. Drug-selected cells were examined for (D) NHEJ and (E) HR activity in the dual NHEJ and HR reporter assay as determined by percentages of eGFP or mCherry positive cells. F, EZH2 inhibitor GSK126 increases DNA end protection as determined by DNA combing assay. Schematics of the assay is shown in the top and representative fibers from each of the indicated conditions are shown in the inserted images. The CIdU/IdU ratio was quantified as a surrogate for DNA end protection (n = 100 cells). Scale bar = 5 μm. Data represent mean ± SEM. n = 3 independent experiments unless otherwise stated. p values were calculated using a two-tailed t-test. See also Figure S3.
NHEJ and MAD2L2 determine the sensitization of CARM1-high cells to PARP inhibitor by EZH2 inhibitor.
To determine whether the observed sensitization to PARP inhibitor by EZH2 inhibitor in CARM1-high cells depends on the observed upregulation of the NHEJ pathway, we knocked down KU70 (Figure 4A), a key regulator of the NHEJ pathway (Ceccaldi et al., 2016). KU70 knockdown reversed the observed decrease in PARP inhibitor Olaparib IC50 and apoptosis induction in CARM1-high cells by EZH2 inhibitor (Figure 4B–C). To directly determine the role of MAD2L2 in the observed sensitization of PARP inhibitor by EZH2 inhibitor, we knocked down MAD2L2 in EZH2 inhibitor GSK126-treated cells (Figure 4D). MAD2L2 knockdown significantly decreased NHEJ activity induced by GSK126, without affecting HR activity (Figure 4E–F). Indeed, MAD2L2 knockdown significantly reversed the decrease in Olaparib IC50 and apoptosis induced by EZH2 inhibitor (Figure 4G–H). Together, we conclude that MAD2L2 upregulation and the associated increase in NHEJ activity play a major role in the observed sensitization to PARP inhibitor by EZH2 inhibitor in CARM1-high cells.
Figure 4: Sensitization to PARP inhibitor by EZH2 inhibitor is NHEJ and MAD2L2 dependent.

A-C, CARM1-high A1847 cells expressing shKU70 or shControl were (A) validated for KU70 knockdown by immunoblot, (B) examined for Olaparib dose-response curves with or without 2.5 μM GSK126, or (C) quantified for apoptosis by Annexin V staining in cells treated with vehicle control, 0.4 μM Olaparib, 2.5 μM GSK126 or a combination for 72 hr. Red dash line indicates 50% of growth inhibition. D-H, A1847 cells expressing the indicated shMAD2L2s or shControl and treated with or without GSK126 were (D) validated for MAD2L2 knockdown by immunoblot, examined for (E) NHEJ or (F) HR activities, (G) examined for Olaparib dose-response curves with or without 2.5 μM GSK126, or (H) quantified for apoptosis by Annexin V staining in cells treated with vehicle control, 0.4 μM Olaparib, 2.5 μM GSK126 or a combination for 72 hr. Data represent mean ± SEM. n = 3 independent experiments unless otherwise stated. p values were calculated using a two-tailed t-test.
EZH2 and PARP inhibitor combination causes chromosomal abnormalities and mitotic catastrophe.
NHEJ repair is error-prone, which may lead to genomic instability and cell death (Ceccaldi et al., 2016). We determined that there was a significant increase in chromosomal abnormalities based on chromosome spread of metaphase cells in GSK126 and Olaparib combination-treated CARM1-high cells compared with either treatment alone (Figure 5A–B). In contrast, the combination did not significantly increase chromosomal abnormalities in CARM1 knockout cells (Figure 5A–B). To determine whether the observed chromosomal abnormalities contribute to the observed apoptosis induction by GSK126 and Olaparib, we performed live cell imaging. Consistently, compared with either GSK126 or Olaparib-treated cells, the combination induced mitotic catastrophe in CARM1-high cells (Figure 5C and Movies S1–4). In contrast, the combination failed to induce mitotic catastrophe in CARM1 knockout cells (Figure 5D and Movies S5–8). We conclude that EZH2 and PARP inhibitor combination induces chromosomal abnormalities and ultimately mitotic catastrophe in a CARM1-dependent manner.
Figure 5: Sensitization to PARP inhibitor by EZH2 inhibitor correlates with an increase in chromosomal abnormalities and mitotic catastrophe.

A-B, Parental control and CARM1 knockout A1847 cells were treated with vehicle control, 0.4 μM Olaparib, 2.5 μM GSK126 or a combination for 72 hr. The treated cells were (A) subjected to metaphase chromosome spread, and (B) chromosomal abnormalities were quantified for the indicated groups (n =20 metaphase spreads). Arrows point to examples of chromosomes with missing arms or fusion chromosomes. Scale bar = 10 μm. C-D, (C) Parental control and (D) CARM1 knockout A1847 cells treated with vehicle control, 0.4 μM Olaparib, 2.5 μM GSK126 or a combination for 72 hr were subjected to time-lapse video microscopic analysis for mitosis. Cell nuclei were visualized by staining for DNA using siR-DNA. Scale bar = 10 μm. Time is expressed as minutes: seconds. Data represent mean ± SEM. p values were calculated using a two-tailed t-test. See also Movies S1–8.
EZH2 and PARP inhibitors are synergistic in suppressing the growth of CARM1-high, but not CARM1-low tumors in vivo in both orthotopic and patient-derived xenograft models.
To determine whether EZH2 inhibitor sensitizes CARM1-high EOCs to PARP inhibitors in vivo, we utilized three different xenograft models. In the orthotopic model, the tumors established by CARM1-high A1847 cells in mouse bursa that covers mouse ovary were treated with vehicle, Olaparib, GSK126 or a combination of Olaparib and GSK126 (Figure 6A–B). Consistent with HR-proficiency in CARM1-high EOCs, Olaparib alone did not affect the growth of the CARM1-high tumors (Figure 6A–B). However, the combination was significantly more effective in suppressing the growth of the orthotopic CARM1-high tumors compared with GSK126 alone (Figure 6A–B). Similar observations were also made in subcutaneous xenograft models (Figure S4A). This correlated with a significant improvement of survival of mice bearing CARM1-high tumors in the combination treatment group compared to GSK126 alone treatment group (Figure 6C). As a control, the GSK126 and Olaparib combination treatment did not significantly suppress the growth of tumors established by CARM1 knockout A1847 cells (Figure S4B). Significantly, similar synergistic effects between EZH2 inhibitor GSK126 and PARP inhibitor Olaparib were also observed in two CARM1-high, but not two CARM1-low, HGSOC patient-derived xenograft models (Figure 6D–H and S4C–F). Notably, the combination treatment did not significantly decrease the body weight of the treated mice, indicating that the combination of EZH2 and PARP inhibitors was not toxic (Figure S4G). Consistently, gross organ morphology and histological analyses of kidney, lung and liver harvested at the end of experiment from combination-treated mice revealed no abnormalities, suggesting that the combination treatment was well tolerated (Figure S4H–I). Together, we conclude that EZH2 inhibitor sensitizes CARM1-high, but not CARM1-low, tumors to PARP inhibitor in orthotopic and patient-derived ovarian cancer xenograft models.
Figure 6: EZH2 inhibitor sensitizes CARM1-high tumors to PARP inhibitor in vivo.

A-B, CARM1-high A1847 cells were unilaterally injected into the ovarian bursa sac of immunocompromised mice (n = 5 mice per group). Randomized mice were treated with vehicle control, Olaparib (50 mg per kg daily by i.p.), GSK126 (25 mg per kg daily by i.p.), or a combination for an additional 3 weeks. At the end of treatment, the mice were euthanized. (A) Reproductive tracts with tumors from the indicated treatment groups were dissected and (B) tumor volumes were measured as a surrogate for tumor burden. ANOVA with post-hoc multiple comparisons statistical analysis revealed that the combination is synergistic (p = 0.028). C, Kaplan–Meier survival curves for the indicated groups. p value was calculated by log-rank test. D, Expression of CARM1 and a loading control β-actin in the indicated CARM1-high and CARM1-low HGSOC PDXs was determined by immunoblot. A1847 and OVCAR3 were used as CARM1-high and CARM1-low controls, respectively. E-H, Mice with the indicated orthotopic (E-F) CARM1-high and (G-H) CARM-low PDXs were randomized into four different treatment groups and treated with vehicle control, Olaparib (50 mg per kg daily by i.p.), GSK126 (25 mg per kg daily by i.p.), or a combination. Tumor weight was measured as a surrogate for tumor burden at the end of the treatment. ANOVA with post-hoc multiple comparisons statistical analysis revealed that the combination is synergistic in CARM1-high (p = 0.006), but not CARM1-low (p = 0.394), PDXs. I-K, Tumors dissected from CARM1-high PDX #1 with the indicated treatments were (I) examined for MAD2L2 mRNA expression by qRT-PCR, or (J) subjected to immunological staining for apoptosis marker cleaved caspase 3, cell proliferation marker Ki67 or H3K27Me3 on serial sections and (K) the histological score (H-score) of the indicated markers was quantified from three separate fields from five tumors from five individual mice in each of the indicated treatment groups. Scale bar = 50 μm. L-M, Cells isolated from fresh CARM1-high or low PDXs post the indicated treatments were (L) subjected to metaphase chromosome spread, and (M) chromosomal abnormalities were quantified for the indicated groups (n>20 metaphase spreads). Arrows point to examples of chromosomes with missing arms or fusion chromosomes. Scale bar = 10 μm. Data represent mean ± SEM. p values were calculated using a two-tailed t-test unless otherwise stated. See also Figure S4.
We next sought to correlate the tumor suppressive effects observed in vivo with the molecular mechanism we have characterized in vitro. Indeed, MAD2L2 expression was increased by GSK126 treatment in CARM1-high tumors (Figure 6I and S4J), which correlated with a decrease in H3K27me3 levels (Figure 6J–K and S4K–L). In addition, the apoptosis marker cleaved caspase 3 was higher, while the proliferation marker Ki67 was lower, in the combination treatment group compared with GSK126 alone treatment group (Figure 6J–K and S4K–L). Indeed, chromosomal abnormalities in GSK126 and Olaparib combination-treated CARM1-high PDX, but not CARM1-low PDX, were significantly increased when compared with either treatment alone (Figure 6L–M). Together, these data support the notion that EZH2 inhibitor sensitizes EOCs to PARP inhibitor in vivo in a CARM1-dependent manner, which correlates with upregulation of MAD2L2 and the associated induction of apoptosis and suppression of cell proliferation.
Discussion
Here we report that selective increasing NHEJ activity by upregulating the expression of shieldin complex components such as MAD2L2 represents a therapeutic strategy to sensitize HR-proficient tumors to PARP inhibitors. Our study demonstrated that MAD2L2 and NHEJ play a major role in mediating the observed synergy between EZH2 and PARP inhibitors in CARM1-high cells because inhibition of either MAD2L2 or NHEJ activity significantly reversed the synergistic effects. However, a limitation of our study is that we cannot formally exclude the possibility that other mechanisms may also directly or indirectly contribute to the synergy. Regardless, this dataset demonstrates that regulating the choice between NHEJ and HR through altering shieldin complex can be explored for sensitizing HR-proficient cells to PARP inhibitors. These findings indicate that a combination of EZH2 and PARP inhibitors represents a precision treatment strategy for CARM1-high cancers. In contrast, although CARM1 inhibition or knockout upregulates MAD2L2 and increases NHEJ activity, this was accompanied by an increase in HR activity. Consequently, CARM1 inhibition failed to sensitize CARM1-high cells to PARP inhibitors. Thus, when combined with PARP inhibitors, EZH2 inhibitors are clearly advantageous compared with CARM1 inhibitors. Notably, upregulation of MAD2L2 by EZH2 inhibition is CARM1 dependent. Indeed, in CARM1-low cells, EZH2 inhibition does not significantly increase MAD2L2 expression and NHEJ activity. Interestingly, loss of EZH2 function promotes PARP inhibitor resistance in BRCA2-deficient cells (Rondinelli et al., 2017). Thus, genetic context should be taken into consideration for the EZH2 and PARP inhibitor combination. Notably, although BRCA1 promoter is methylated in A1847 cells, the IC50 to PARP inhibitor Olaparib in A1847 cells is comparable to those of BRCA1/2 wild-type cell lines without BRCA1 promoter methylation (Stordal et al., 2013). Consistently, our data show that A1847 cells are not sensitive to Olaparib.
PARP inhibitors demonstrate substantial clinical benefits in HR-deficient cancers such as BRCA1/2-mutated HGSOCs (Konstantinopoulos et al., 2015; Moore et al., 2018). Extending the efficacy of PARP inhibitors to HR-proficient HGSOCs is a critical unmet clinical need. CARM1 amplification/overexpression occurs in ~20% of HGSOCs that are typically HR-proficient (Karakashev et al., 2018). In addition, although CARM1 amplification/overexpression is often mutually exclusive with BRCA1/2 mutations, CARM1 upregulation can also occur in cells that have acquired HR proficiency, one of the most common resistance mechanisms to PARP inhibitors (Konstantinopoulos et al., 2015). For example, the PEO1 cell line is BRCA2 deficient and sensitive to PARP inhibitors, whereas PEO4 is derived from ascites of the same patients at the time of relapse with platinum resistance with proficient BRCA2 and HR due to a secondary mutation (Sakai et al., 2009). PEO1 is CARM1-low (Karakashev et al., 2018), whereas PEO4 is CARM1-high, and PEO4 is sensitive to EZH2 and PARP inhibitor combination. These findings suggest that the EZH2 and PARP inhibitor combination may be effective in overcoming PARP inhibitor resistance caused by acquired HR proficiency. Notably, CARM1 is often amplified or overexpressed in a number of major cancer types (El Messaoudi et al., 2006; Hong et al., 2004; Kim et al., 2010). Thus, our discovery will have far-reaching implications for expanding the clinical utility of PARP inhibitors.
STAR METHODS
CONTACT FOR REAGENT AND RESOURCE SHARING
Further information and requests for resources and reagents should be directed to and will be fulfilled by the Lead Contact, Rugang Zhang (rzhang@wistar.org)
EXPERIMENTAL MODEL AND SUBJECT DETAILS
Cell lines
Human EOC cell lines were obtained from indicated sources as detailed in Key Resources Table and were re-authenticated by The Wistar Institute’s Genomics Facility using short tandem repeat profiling using AmpFLSTR Identifiler PCR Amplification kit (Life Technologies). A1847, OVCAR3, OVCAR5, OVCAR10, CAOV3, and PEO4 cells were cultured in RPMI1640 supplemented with 10% fetal bovine serum (FBS) and 1% penicillin/streptomycin at 37°C supplied with 5% CO 2. Mycoplasma testing was performed monthly by LookOut Mycoplasma PCR detection (Sigma).
Mice
The protocols were approved by the Wistar Institutional Animal Care and Use Committee (IACUC). Mice are housed in solid bottom, single use ventilated or static cages. Cage bottoms and bedding are changed every two weeks for ventilated cages, and weekly for static. Lids and feeders are changed every 4 weeks. Animal quarters are serviced by individual animal caretakers who are trained to recognize the symptoms characteristic of sick animals. Each day the caretakers initial a checklist posted in each room indicating that observations were made. Temperature and humidity are monitored and documented. Staff monitors for and documents any animal welfare conditions and removes any dead animals if observed and notifies research staff and facility management. If an animal welfare condition is observed both the veterinarian and animal facility director or supervisor are notified. Animals are treated if there are open veterinary cases including weekends and holidays. For in vivo experiments, the sample size of at least 5 mice per group was determined on the basis of the data shown from in vitro experiments. 6–8-week old female immunocompromised NSG mice from Wistar Institute Animal Facility were used for all in vivo experiments.
METHOD DETAILS
Immunoblotting
Protein was extracted with RIPA buffer (150 mM NaCl, 1% NP40, 0.5% sodium deoxycholate, 0.1% SDS, 50 mM Tris pH 8.0 and 1 mM phenylmethylsulfonyl fluoride). Protein was separated by SDS–PAGE gel and transferred to a PVDF membrane. Membranes were blocked with 5% non-fat milk and then incubated with primary antibodies and secondary antibodies.
CRISPR-mediated CARM1 knockout
pLentiCRISPR-CARM1 was constructed by inserting the CARM1 guide RNA (gRNA; 5′-AGCACGGAAAATCTACGCGG-3′). pLentiCRISPR v2 (Addgene) was digested and dephosphorylated with BsmBI restriction enzyme (Fermentas) for 30 min at 37 °C. The digested plasmid was run on a 1% agarose gel, cut out, and purified using the Wizard SV Gel and PCR Clean Up kit (Promega). The oligonucleotides were phosphorylated using T4 PNK (M0201S) with T4 Ligation Buffer (New England Biolabs, Inc.). Samples were annealed in a thermocycler at 37 °C for 30 min and then at 95 °C for 5 min and then were ramped down to 25 °C at 5 °C/min. Annealed oligonucleotides were diluted 1:20 0 in RNase/DNase-free water. Ligation of the annealed oligonucleotide and digested pLentiCRISPR v2 plasmid was performed using Quick Ligase (New England Biolabs, Inc.).
Tet-inducible shEZH2 knockdown
tet-pLKO-shEZH2 was constructed by inserting the EZH2 shRNA (the sense sequence is 5′-TATTGCCTTCTCACCAGCTGC -3′) into the tet-pLKO-puro vector (Addgene) digested with AgeI and EcoRI restriction enzymes (NEB) and dephosphorylated for 30 min at 37 °C. The digested plasmid was run on a 1% agarose ge l, cut out, and purified using the Wizard SV Gel and PCR Clean Up kit (Promega). The oligonucleotides were phosphorylated using T4 PNK (M0201S) with T4 Ligation Buffer (New England Biolabs, Inc.). Samples were annealed in a thermocycler at 37 °C for 30 min and then at 95 °C for 5 min and finally were ramped down to 25 °C at 5 °C per min. Annealed oligonucleotides were diluted 1:200 in RNase/DNase-free water. Ligation of the annealed oligonucleotide and digested tet-pLKO-puro plasmid was performed using Quick Ligase (New England Biolabs, Inc.). To induce EZH2 knockdown, cells infected with tet-inducible shEZH2 virus were treated with 100 ng/ml of Doxycycline (Sigma).
Lentivirus infection
Phoenix cells were used to package the retroviruses (a gift from G. Nolan, Stanford University, USA). Plasmid encoding wild-type BAF155 and mutant R1064K BAF155 were described as previously published (Karakashev et al., 2018). Lentivirus was packaged using the Virapower Kit or Lenti-Pac HIV Expression Packaging Kit accordingly to manufacturer’s instructions. Cells infected with viruses encoding the puromycin resistance gene were selected in 1 μg/ml puromycin.
Reverse-transcriptase quantitative PCR (RT-qPCR)
RNA was isolated by RNeasy Mini Kit (Qiagen). mRNA expression for MAD2L2, APLF, and LINP1 was determined using SYBR green 1-step iScript (Bio-Rad) with a Life Technologies QuantStudio 3 machine.
Annexin V staining
Phosphatidylserine externalization was detected using an Annexin V FITC and PI kit following the manufacturer’s instructions. Briefly, cells were washed with cold PBS and resuspended in Annexin V binding buffer and stained with Annexin V and PI at room temperature and then analyzed immediately. Annexin V-positive cells were detected using the Becton-Dickinson LSR18 machine and analyzed with FlowJo version 7 software module.
Colony formation assay
1,000 to 2,000 cells were plated into a 24 well tissue culture plate and treated with the indicated compounds. Cell medium was changed every three days with appropriate drug doses for 10 days. Colonies were washed twice with PBS and fixed with 10% methanol and 10% acetic acid in distilled water. Fixed colonies were stained with 0.005% crystal violet. Integrated density was measured using NIH ImageJ software.
Chromatin Immunoprecipitation (ChIP), and Cut and Run ChIP analysis
The following antibodies were used to perform conventional ChIP: rabbit anti-EZH2 (Cell Signaling, 10 μl per immunoprecipitation), rabbit anti-H3K27me3 (Cell Signaling, 10 μl per immunoprecipitation). An isotype-matched IgG was used as a negative control. ChIP DNA was analyzed by quantitative PCR against the promoter of the human MAD2L2, APLF, and LINP1 genes.
Cut and run ChIP was performed as described (Skene and Henikoff, 2017). In brief, parental A1847 cell or A1847 CARM1-knockout cells were gently washed twice in room temperature with Wash Buffer (20 mM HEPES pH 7.5, 150 mM NaCl, 0.5 mM spermidine and a Roche complete EDTA-free tablet (Sigma-Aldrich) per 50 ml) and centrifuged at 600×g for 3 min. Cells were then resuspended in Antibody Buffer (antibody with 1:100 dilution in wash buffer supplemented with 0.05% digitonin and 2mM EDTA). The following antibodies were used: mouse anti-BRG1 (Santa Cruz), rabbit anti-SNF5 (Bethyl), and rabbit anti-BAF155 (Cell Signaling). An isotype-matched IgG was used as a negative control. After 2 hr incubation at 4°C ˌ supernatant was removed by centrifugation and cell pellets were washed once with Dig-Wash Buffer (Wash Buffer containing 0.05% digitonin). Cell pellets were then resuspended in Protein A-MNase at a final concentration of 700ng/ml in Dig-Wash Buffer, incubated for 1 hr at 4°C, washed twice in Dig-Wash Buffer and resuspende d in 100 μl of Dig-Wash Buffer. Tubes were placed at 0 °C, mixed with 2 μl 100 mM CaCl2, incubated at 0 °C for 30 min, and reactions were stopped by addition of 100 μl 2xSTOP buffer (340 mM NaCl, 20 mM EDTA pH8, 4 mM EGTA, 0.05% digitonin, 50 μg/ml RNase A (Thermo), 50 μg/ml glycogen). 10 μl of each sample was collected as input and the remaining sample was centrifuged 16,000×g for 5 min at 4 °C and the supernatant was collected. Both input and supernatant DNA were purified by phenol–chloroform–isoamyl alcohol and chloroform extraction and ethanol precipitation. ChIP DNA was analyzed by quantitative PCR against the promoter of the human MAD2L2, APLF, and LINP1 genes.
Cell-cycle analysis
Cells were fixed with 70% ethanol, treated with bovine RNAase for 30 min, and labeled with propidium iodide (PI) solution (Sigma). Cell suspension were incubated for 15 min at room temperature and PI staining was detected by using the Becton-Dickinson LSR18 machine, and analyzed with FlowJo version 7 software module.
Metaphase spread
Cells were synchronized with colcemid (50 ng/mL) for 3 hr and then incubated in 0.075 mol/L potassium chloride (KCl) at 37°C for 10 min. Next, cells were fixed with Carnoy fixative (3:1 methanol:acetic acid) and incubated at 4°C ove rnight. Fixed cells were dropped onto uncoated microscope slides and dried for 24 hr at room temperature. Slides were next stained in Giemsa staining solution (Sigma) for 4 min. Stained slides were analyzed for total gaps and breaks by Nikon Eclipse 80i microscope.
Dual HR and NHEJ reporter assay
The dual HR and NHEJ reporter assay was performed as previously described (Arnoult et al., 2017). Briefly, indicated cells were plated in a 6-well plates at a 50% confluence one day before transfection. Cells were transfected with 500ng of pCBA I-SceI plasmid (Addgene), 500ng of pLCN-DRR plasmid (Addgene) plasmid, and 500ng of pCAGGS-DRR-mCherry-Donor-EF1a-BFP plasmid (Addgene). After 72 hr incubation cells were collected and BFP, mCherry, and eGFP expression was detected by using the Becton-Dickinson LSR18 machine and analyzed with FlowJo version 7 software module.
DNA combing assay
The DNA combing assay was performed as we previously described (Aird et al., 2013). Specifically, replicating DNA was first labeled with 25 μM 5-iodo-2’-deoxyuridine (IdU) for 20 min. Cells were then subjected to the second DNA labeling with 250 μM 5-chloro-2’-deoxyuridine (CldU) for another 20 min. After double labeling, cells were treated with 4mM Hydroxyurea (Sigma) to induce replication stress. 2.5 μL of the cell suspension (~2,500 cells) were spotted onto one end of the glass slide, followed by addition of 7.5 μL of lysis buffer (50 mM EDTA, 0.5% SDS, 200 mM Tris-HCl, pH 7.5). After incubation for 8 min at room temperature, the slides were tilted to 15° to allow the DNA fibers to spread along the slide. DNA fibers were treated with 2.5M hydrochloric acid and incubated with rat anti-BrdU (BU1/75) monoclonal antibody (Novus, 1:500) that recognizes CIdU, but not IdU at 4°C overnight, followed by an AlexaFluor cy3-conjugated goat anti-rat secondary antibody (Thermo, 1:500) for 1.5 h at room temperature. The mouse anti-IdU monoclonal antibody (BD, 1:500) that recognizes IdU but not CIdU (4°C overnight) and AlexaFluor 488-conjugated goat anti-mouse secondary antibody (Thermo, 1:500) (1.5 h at room temperature) were used to detect IdU. Images were acquired randomly from fields with untangled fibers using Eclipse 80i Nikon Fluorescence Microscope. The lengths of CIdU (AF cy3, red) and IdU (AF 488, green) labeled patches were measured using the Image J software, and μm values were converted into kb using the conversion factor 1 μm = 2.59 kb. A minimum of 100 individual fibers was analyzed for each experiment and the mean of at least three independent experiments presented.
Xenograft ovarian cancer models
The protocols were approved by the Institutional Animal Care and Use Committee (IACUC). For in vivo experiments, the sample size of at least 5 mice per group was determined on the basis of the data shown from in vitro experiments. For orthotopic xenograft models, 1 × 10⁶ parental A1847 control or A1847 CARM1 knockout cells were unilaterally injected into the ovarian bursa sac of 6–8-week old female immunocompromised NSG mice (n = 5 mice per group). One week after injection the mice were treated with vehicle control (20% captisol), Olaparib (50 mg per kg daily by i.p.), GSK126 (25 mg per kg daily i.p.), or a combination for 3 weeks. At the end of the experiments, tumors were surgically dissected and tumor size was measured.
For subcutaneous xenograft models, 5 × 10⁶ parental A1847 or A1847 CARM1 knockout cells were unilaterally injected subcutaneously (n = 5 mice per group) in the flank of 6–8-week old female immunocompromised NSG mice. One week after injection the mice were randomized and treated with vehicle control (20% captisol), Olaparib (50 mg per kg daily by i.p.), GSK126 (25 mg per kg daily by i.p.) or a combination for 5 weeks. Tumor size was measured every 3 days. For survival experiments, after stopping the treatment, the mice were followed until burden reached 10% of the body weight as determined by The Wistar Institute IACUC guideline.
For CARM1-high PDX #1 and CARM1-low PDX #1, the procurement of human ovarian tumor tissues was approved by the Institutional Review Board of Christina Care Health System. De-identified patient tumor samples were obtained from Helen F. Graham Cancer Center at Christiana Care Health System. Second passage PDXs were orthotopically xenografted into the ovarian bursa sac of 6–8-week old female immunocompromised NSG mice (n = 7 mice per group for CARM1-high PDX #1 and n = 5 mice per group for CARM1-low PDX #1). Mice were randomized and treated with vehicle control (20% captisol), Olaparib (50 mg per kg daily, by i.p.), GSK126 (25 mg per kg daily by i.p.), or a combination starting on the day of the transplantation. Tumor weight was measured at the end of the treatment (77 days for CARM1-high PDX #1 and 97 days for CARM1-low PDX #1). For CARM1-high PDX #2 and CARM1-low PDX #2, PDXs were generated using frozen viable stocks of second passage PDXs specimens as previously described (Karakashev et al., 2018). Passage 3 HGSOC PDXs were re-established in 6–8-week old female immunocompromised NSG mice that are CARM1-high and CARM1-low, respectively. Specifically, PDXs were unilaterally engrafted subcutaneously into 6–8-week old female immunocompromised NSG mice (n = 5 mice per group). Mice were randomized and treated with vehicle control (20% captisol), Olaparib (50 mg per kg daily, by i.p.), GSK126 (25 mg per kg daily by i.p.), or a combination starting the day of the injection. Tumor size was measured every 3 days for 77 days.
Immunohistochemical (IHC) staining
IHC staining was performed on serial sections. Tissue sections were stained using Dako EnVision+ system following the manufacturer’s instructions. Briefly, formalin-fixed, paraffin-embedded tumors were sectioned, and slides were deparaffinized using xylenes (Fisher Scientific). Antigens were unmasked using citrate buffer (Thermo Fisher). Endogenous peroxidases were quenched with 3% hydrogen peroxide in methanol. Staining was performed using antibodies against H3K27me3 (Cell Signaling, 1:100 dilution), cleaved caspase 3 (Cell Signaling, 1:50 dilution), or Ki67 (Cell Signaling, 1:500 dilution). Counterstaining was performed using Mayer’s Hematoxylin (Dako). Expression of the stained markers was scored using a histologic score (H score).
QUANTIFICATION AND STATISTICAL ANALYSIS
Experiments were repeated 3 times unless otherwise stated. The representative images are shown unless otherwise stated. Statistical analysis was performed using GraphPad Prism 7 (GraphPad) for Mac OS. Quantitative data are expressed as mean ± SEM. unless otherwise stated. For all statistical analyses, the level of significance was set at 0.05. For correlation studies, Pearson’s correlation was used for calculating p and r values in GraphPad Prism 5 (GraphPad) for Mac OS. Analysis was performed blindly but not randomly. Animal experiments were randomized. There was no exclusion from the experiments. For in vivo synergy analysis, all data were log10 transformed before data analysis to improve normality and homoscedasticity. ANOVA with post-hoc multiple comparisons were performed for between groups comparisons. A general linear model with interaction term between single treatment was used for testing the synergistic combination effect in mouse model.
Genes that were significantly upregulated in CARM1 knockout cells (FDR<5%) and had significantly decreased EZH2 and H3K27me3 peaks (FDR<1%) were considered for overlap as direct CARM1/EZH2/H3K27me3 targets and significance of the overlap was tested using hypergeometric test. List of genes involved in NHEJ was obtained from QIAGEN’s Ingenuity® Pathway Analysis software (IPA®, QIAGEN Redwood City, www.qiagen.com/ingenuity, function “Non-homologous end joining [NHEJ]”) and through literature search and the function enrichment among direct CARM1/EZH2/H3K27me3 targets was tested using Fisher Exact Test. Pearson correlation test between CARM1 and MAD2L2 expression in laser capture micro-dissected human high-grade serous ovarian cancer specimens used gene expression data from NCBI GEO dataset GSE18520 (Mok et al., 2009). Stratification of patients into high and low CARM1 expression level in the TCGA HGSOC dataset was done using threshold value equal to average log2 CARM1/GAPDH ratio among patients with CARM1 amplification.
DATA AND SOFTWARE AVAILABILITY
Previously published RNA-seq and ChIP-seq of EZH2 and H3K27me3 for parental A1847 and CARM1 knockout A1847 cells were used in this study (NCBI GEO accession number GSE95645) (Karakashev et al., 2018).
Supplementary Material
Supplemental Movie 1, related to Figure 4
Live-cell time-lapse microscopy imaging of CARM1-high A1847 cells treated with vehicle control.
Supplemental Movie 2, related to Figure 4
Live-cell time-lapse microscopy imaging of CARM1-high A1847 cells treated with 0.4 μM Olaparib.
Supplemental Movie 3, related to Figure 4
Live-cell time-lapse microscopy imaging of CARM1-high A1847 cells treated with 2.5 μM GSK126.
Supplemental Movie 4, related to Figure 4
Live-cell time-lapse microscopy imaging of CARM1-high A1847 cells treated with a combination of 0.4 μM Olaparib and 2.5 μM GSK126.
Supplemental Movie 5, related to Figure 4
Live-cell time-lapse microscopy imaging of CARM1 knockout A1847 cells treated with vehicle control.
Supplemental Movie 6, related to Figure 4
Live-cell time-lapse microscopy imaging of CARM1 knockout A1847 cells treated with 0.4 μM Olaparib.
Supplemental Movie 7, related to Figure 4
Live-cell time-lapse microscopy imaging of CARM1 knockout A1847 cells treated with 2.5 μM GSK126.
Supplemental Movie 8, related to Figure 4
Live-cell time-lapse microscopy imaging of CARM1 knockout A1847 cells treated with a combination of 0.4 μM Olaparib and 2.5 μM GSK126.
KEY RESOURCES TABLE
| REAGENT or RESOURCE | SOURCE | IDENTIFIER |
|---|---|---|
| Antibodies | ||
| mouse anti-CARM1 | Cell Signaling | Cat#12495; RRID:AB_2797935 |
| goat anti-BAF155 | Santa Cruz | Cat#SC9746; RRID:AB_671099 |
| rabbit anti-methylated R1064 BAF155 | Millipore | Cat#ABE1339; RRID:AB_2731994 |
| rabbit anti-EZH2 | Cell Signaling | Cat#5246; RRID:AB_10694683 |
| rabbit anti-cleaved PARP p85 | Promega | Cat#G7341; RRID:AB_430876 |
| mouse anti-Ki67 | Cell Signaling | Cat#9449; RRID:AB_2715512 |
| rabbit anti-cleaved caspase 3 | Cell Signaling | Cat#9661; RRID:AB_2341188 |
| rabbit anti-H3K27Me3 | Cell Signaling | Cat#9733; RRID:AB_2616029 |
| mouse anti-β-actin | Sigma | Cat#A1978; RRID:AB_476692 |
| rabbit anti-KU70 | Abcam | Cat#ab83501; RRID:AB_10564007 |
| rabbit anti-MAD2L2 | Abcam | Cat#ab115622; RRID:AB_10901285 |
| mouse anti-BRG1 | Santa Cruz | Cat#sc-17796; RRID:AB_626762 |
| rabbit anti-SNF5 | Bethyl | Cat#A301–087A; RRID:AB_2191714 |
| rabbit anti-BAF155 | Cell Signaling | Cat#11956; RRID:AB_2797776 |
| AlexaFluor cy3-conjugated goat anti-rat secondary antibody | Thermo | Cat#A10522; RRID:AB_2534031 |
| mouse anti-IdU monoclonal antibody | BD | Cat#347580; RRID:AB_10015219 |
| mouse anti-IdU monoclonal antibody | BD | Cat#347580; RRID:AB_10015219 |
| Bacterial and Virus Strains | ||
| DH5α competent E. coli | Thermo Fisher | Cat#18265017 |
| Stbl3 competent E. coli | Thermo Fisher | Cat#C737303 |
| Chemicals, Peptides, and Recombinant Proteins | ||
| Lipofectamine 2000 | Thermo Fisher | Cat#11668019 |
| DNase I | Sigma | Cat#4536282001 |
| RNase A | Thermo Fisher | Cat#EN0531 |
| Proteinase K | Thermo Fisher | Cat#AM2544 |
| Dynabeads protein A | Thermo Fisher | Cat#10002D |
| Dynabeads protein G | Thermo Fisher | Cat#10004D |
| TRizol | Thermo Fisher | Cat#15596026 |
| MboI | New England Biolabs | Cat#R0147L |
| DNA Polymerase I, large Fragment | New England Biolabs | Cat#M0210 |
| T4 DNA ligase | New England Biolabs | Cat#M0202 |
| T4 DNA polymerase I | New England Biolabs | Cat#M0203 |
| DNA quick ligase | New England Biolabs | Cat#M2200 |
| MNase | Cell Signaling | Cat#10011S |
| BsmBI | Fermentas | Cat#ER0452 |
| EcoR1 | NEB | Cat#R0101S |
| AgeI | NEB | Cat#R0552S |
| GSK126 | Xcess Biosciences | Cat#A-1275 |
| GSK126 | Xcess Biosciences | Cat#M60071 |
| Cisplatin | Selleckchem | Cat#S1166 |
| Olaparib | Selleckchem | Cat#S1060 |
| Olaparib | L C Laboratories | Cat#O-9201 |
| Rucaparib | Selleckchem | Cat# S1098 |
| Tazemetostat | Selleckchem | Cat#S7128 |
| ZM2302 | Probechem | Cat#PC-61030 |
| Doxycyclin | Sigma | D9891 |
| Xylene | Fisher Scientific | Cat#1330-20-7 |
| IdU | Sigma | Cat#I7125 |
| CldU | Sigma | Cat#C6891 |
| Hydroxyurea | Sigma | SigmaCat#H8627 |
| Citrate buffer | Thermo Fisher | Cat#005000 |
| Mayer’s Hematoxylin | Dako | Cat#3309S |
| Propidium iodide | Sigma | Cat#p4170 |
| Critical Commercial Assays | ||
| LookOut Mycoplasma PCR detection | Sigma | Cat#MP0035 |
| Lenti-Pac HIV Expression Packaging Kit | Genecopoeia | Cat#LT001 |
| ViraPower Lentiviral Packaging Mix | Thermo Fisher | Cat#K497500 |
| Annexin V FITC and PI kit | Thermo Fisher | Cat#V13242 |
| Dako EnVision+ system | Dako | Cat#K4011 |
| AmpFLSTR Identifiler PCR Amplification kit | Life Technologies | Cat#4322288 |
| Deposited Data | ||
| RNA-seq data | Karakashev et al.,2018 | GSE95645 |
| ChIP-seq data | Karakashev et al.,2018 | GSE95645 |
| Experimental Models: Cell Lines | ||
| Phoenix cells | Dr. G. Nolan, Stanford University, USA | N/A |
| A1847 | Dr. A. Godwin, Fox chase Cancer Center, currently at University of Kansas Cancer Center | N/A |
| OVCAR3 | ATCC | HTB-161 |
| OVCAR5 | Dr. T. Hamilton, Fox Chase Cancer Center | N/A |
| OVCAR10 | Dr. A. Godwin, Fox chase Cancer Center, currently at University of Kansas Cancer Center | N/A |
| CAOV3 | ATCC | HTB-75 |
| PEO4 | Sigma | 10032308–1VL |
| Experimental Models and Subject Details | ||
| CARM1-high PDX #1 | Helen F. Graham Cancer Center at Christiana Care Health System | N/A |
| CARM1-low PDX #1 | Helen F. Graham Cancer Center at Christiana Care Health System | N/A |
| CARM1-high PDX #2 | Dr. J. Conejo-Garcia, Moffitt Cancer Center | N/A |
| CARM1-low PDX #2 | Dr. J. Conejo-Garcia, Moffitt Cancer Center | N/A |
| Oligonucleotides | ||
| 5′- ACCGCCCAGTGGAGAAATTC -3′ (MAD2L2 forward) | This paper | N/A |
| 5′-CATCGCACACGCTGATCTT-3′ (MAD2L2 reverse) | This paper | N/A |
| 5′- CCGCTGCTGGGAATAACAGA-3′ (APLF forward) | This paper | N/A |
| 5′- GCTTCAATGGTAAGAGCTGACT-3′ (APLF reverse) | This paper | N/A |
| 5′- AGCCGGTCCAGTACACCTTT-3′ (LINP1 forward) | This paper | N/A |
| 5′- GGAAAGCACCGTCTGTTGTT -3′ (LINP1 reverse) | This paper | N/A |
| 5′- GAGGCTGGAAGTGAGGATG-3′ (MAD2L2 forward) | This paper | N/A |
| 5′- GAGTGTCAGAGCGTGGAAA-3′ (MAD2L2 reverse) | This paper | N/A |
| 5′- CATGCAGTGAGGTTTCCATAAAG-3′ (APLF forward) | This paper | N/A |
| 5′- TTCAGTCAGCTGGACATTCG-3′ (APLF reverse) | This paper | N/A |
| 5′- TGCTTGGCTCACAATATCTCTC-3′ (LINP1 forward) | This paper | N/A |
| 5′- TCTTCATGAATCCCAGCTGTC-3′ (LINP1 reverse) | This paper | N/A |
| Recombinant DNA | ||
| pLentiCRISPR-CARM1 | Karakashev et al.,2018 | N/A |
| pLentiCRISPR v2 | Addgene, Sanjana et al Nat Methods. 2014 | Cat#52961 |
| tet-pLKO-puro | Addgene, Wiederschain et al Cell Cycle. 2009 | Cat#21915 |
| pLKO.1-shKU70 1 | Molecular Screening Facility (Wistar) | TRCN0000039610 |
| tet-pLKO-on -shEZH2 | Cloning, this paper | N/A |
| pLKO.1-shKU70 2 | Molecular Screening Facility (Wistar) | TRCN0000039612 |
| pLKO.1-shMAD2L2 1 | Molecular Screening Facility (Wistar) | TRCN0000006570 |
| pLKO.1-shMAD2L2 2 | Molecular Screening Facility (Wistar) | TRCN0000006573 |
| pLKO.1-shBAF155 | Molecular Screening Facility (Wistar) | TRCN0000015628 |
| pLenti-CARM1 | Genecopoeia | Cat#EX-Y3476-Lv105-B |
| pCBA I-SceI plasmid | Addgene | Cat#26477 |
| pLCN-DRR plasmid | Addgene | Cat#98895 |
| pCAGGS-DRR-mCherry-Donor-EF1a-BFP | Addgene | Cat#98896 |
| Software and Algorithms | ||
| Leica LAS-X 3.3 software | Leica | N/A |
| ImageJ Software | NIH | N/A |
| Ingenuity® Pathway Analysis software | Qiagen | N/A |
| FlowJo version 7 | FlowJo, LLC | N/A |
| GraphPad Prism 7 software | GraphPad | N/A |
Highlights.
EZH2 inhibitor sensitizes CARM1-high EOC cells to PARP inhibitor
EZH2 inhibitor upregulates MAD2L2 and NHEJ activity in CARM1-high EOC cells
EZH2 and PARP inhibitor combination causes mitotic catastrophe
EZH2 and PARP inhibitors are synergistic in suppressing CARM1-high EOCs in vivo
Significance:
Expanding the utility of PARP inhibitors into HR-proficient cancers remains a major unmet clinical need. CARM1 amplification/overexpression occurs in ~20% of high-grade serous ovarian cancers, which are typically mutually exclusive with BRCA1/2 mutations. Our results indicate that selective upregulation of the shieldin component MAD2L2 (also known as REV7) can be explored for sensitizing PARP inhibitors in HR-proficient cells, and a combination of EZH2 and PARP inhibitors represents a precision treatment strategy for HR-proficient CARM1-high cancers.
Acknowledgements:
This work was supported by US National Institutes of Health grants (R01CA160331, R01CA163377, R01CA202919 and R01CA239128 to R.Z., P50CA228991 to R.Z. and R50CA211199 to A.V.K.), US Department of Defense (OC150446 and OC180109 to R.Z.), The Honorable Tina Brozman Foundation for Ovarian Cancer Research (to R.Z.) and Ovarian Cancer Research Alliance (Collaborative Research Development Grant to R.Z. and Ann and Sol Schreiber Mentored Investigator Award to S.W. and J.L.). S.K. is supported by an AACR-AstraZeneca ovarian cancer research fellowship. Support of Core Facilities was provided by Cancer Centre Support Grant (CCSG) CA010815 to The Wistar Institute.
Footnotes
Publisher's Disclaimer: This is a PDF file of an unedited manuscript that has been accepted for publication. As a service to our customers we are providing this early version of the manuscript. The manuscript will undergo copyediting, typesetting, and review of the resulting proof before it is published in its final form. Please note that during the production process errors may be discovered which could affect the content, and all legal disclaimers that apply to the journal pertain.
Declaration of Interests: S.K. and R.Z. are co-inventors on a patent application covering the use of EZH2 inhibitors in CARM1-expressing cancers. All other authors declare no competing interests.
References:
- Aird KM, Zhang G, Li H, Tu Z, Bitler BG, Garipov A, Wu H, Wei Z, Wagner SN, Herlyn M, and Zhang R (2013). Suppression of nucleotide metabolism underlies the establishment and maintenance of oncogene-induced senescence. Cell Rep 3, 1252–1265. [DOI] [PMC free article] [PubMed] [Google Scholar]
- Arnoult N, Correia A, Ma J, Merlo A, Garcia-Gomez S, Maric M, Tognetti M, Benner CW, Boulton SJ, Saghatelian A, and Karlseder J (2017). Regulation of DNA repair pathway choice in S and G2 phases by the NHEJ inhibitor CYREN. Nature 549, 548–552. [DOI] [PMC free article] [PubMed] [Google Scholar]
- Boersma V, Moatti N, Segura-Bayona S, Peuscher MH, van der Torre J, Wevers BA, Orthwein A, Durocher D, and Jacobs JJL (2015). MAD2L2 controls DNA repair at telomeres and DNA breaks by inhibiting 5’ end resection. Nature 521, 537–540. [DOI] [PMC free article] [PubMed] [Google Scholar]
- Cao R, and Zhang Y (2004). The functions of E(Z)/EZH2-mediated methylation of lysine 27 in histone H3. Curr Opin Genet Dev 14, 155–164. [DOI] [PubMed] [Google Scholar]
- Ceccaldi R, Rondinelli B, and D’Andrea AD (2016). Repair Pathway Choices and Consequences at the Double-Strand Break. Trends Cell Biol 26, 52–64. [DOI] [PMC free article] [PubMed] [Google Scholar]
- Dev H, Chiang TW, Lescale C, de Krijger I, Martin AG, Pilger D, Coates J, Sczaniecka-Clift M, Wei W, Ostermaier M, et al. (2018). Shieldin complex promotes DNA end-joining and counters homologous recombination in BRCA1-null cells. Nat Cell Biol 20, 954–965. [DOI] [PMC free article] [PubMed] [Google Scholar]
- Drew AE, Moradei O, Jacques SL, Rioux N, Boriack-Sjodin AP, Allain C, Scott MP, Jin L, Raimondi A, Handler JL, et al. (2017). Identification of a CARM1 Inhibitor with Potent In Vitro and In Vivo Activity in Preclinical Models of Multiple Myeloma. Sci Rep 7, 17993. [DOI] [PMC free article] [PubMed] [Google Scholar]
- El Messaoudi S, Fabbrizio E, Rodriguez C, Chuchana P, Fauquier L, Cheng D, Theillet C, Vandel L, Bedford MT, and Sardet C (2006). Coactivator-associated arginine methyltransferase 1 (CARM1) is a positive regulator of the Cyclin E1 gene. Proc Natl Acad Sci U S A 103, 13351–13356. [DOI] [PMC free article] [PubMed] [Google Scholar]
- Ghezraoui H, Oliveira C, Becker JR, Bilham K, Moralli D, Anzilotti C, Fischer R, Deobagkar-Lele M, Sanchiz-Calvo M, Fueyo-Marcos E, et al. (2018). 53BP1 cooperation with the REV7-shieldin complex underpins DNA structure-specific NHEJ. Nature 560, 122–127. [DOI] [PMC free article] [PubMed] [Google Scholar]
- Gupta R, Somyajit K, Narita T, Maskey E, Stanlie A, Kremer M, Typas D, Lammers M, Mailand N, Nussenzweig A, et al. (2018). DNA Repair Network Analysis Reveals Shieldin as a Key Regulator of NHEJ and PARP Inhibitor Sensitivity. Cell 173, 972–988 e923. [DOI] [PMC free article] [PubMed] [Google Scholar]
- Hohmann AF, and Vakoc CR (2014). A rationale to target the SWI/SNF complex for cancer therapy. Trends Genet 30, 356–363. [DOI] [PMC free article] [PubMed] [Google Scholar]
- Hong H, Kao C, Jeng MH, Eble JN, Koch MO, Gardner TA, Zhang S, Li L, Pan CX, Hu Z, et al. (2004). Aberrant expression of CARM1, a transcriptional coactivator of androgen receptor, in the development of prostate carcinoma and androgen-independent status. Cancer 101, 83–89. [DOI] [PubMed] [Google Scholar]
- Karakashev S, Zhu H, Wu S, Yokoyama Y, Bitler BG, Park PH, Lee JH, Kossenkov AV, Gaonkar KS, Yan H, et al. (2018). CARM1-expressing ovarian cancer depends on the histone methyltransferase EZH2 activity. Nat Commun 9, 631. [DOI] [PMC free article] [PubMed] [Google Scholar]
- Kim YR, Lee BK, Park RY, Nguyen NT, Bae JA, Kwon DD, and Jung C (2010). Differential CARM1 expression in prostate and colorectal cancers. BMC Cancer 10, 197. [DOI] [PMC free article] [PubMed] [Google Scholar]
- Konstantinopoulos PA, Ceccaldi R, Shapiro GI, and D’Andrea AD (2015). Homologous Recombination Deficiency: Exploiting the Fundamental Vulnerability of Ovarian Cancer. Cancer Discov 5, 1137–1154. [DOI] [PMC free article] [PubMed] [Google Scholar]
- Kuntz KW, Campbell JE, Keilhack H, Pollock RM, Knutson SK, Porter-Scott M, Richon VM, Sneeringer CJ, Wigle TJ, Allain CJ, et al. (2016). The Importance of Being Me: Magic Methyls, Methyltransferase Inhibitors, and the Discovery of Tazemetostat. J Med Chem 59, 1556–1564. [DOI] [PubMed] [Google Scholar]
- Lord CJ, and Ashworth A (2017). PARP inhibitors: Synthetic lethality in the clinic. Science 355, 1152–1158. [DOI] [PMC free article] [PubMed] [Google Scholar]
- McCabe MT, Ott HM, Ganji G, Korenchuk S, Thompson C, Van Aller GS, Liu Y, Graves AP, Della Pietra A 3rd, Diaz E, et al. (2012). EZH2 inhibition as a therapeutic strategy for lymphoma with EZH2-activating mutations. Nature 492, 108–112. [DOI] [PubMed] [Google Scholar]
- Mok SC, Bonome T, Vathipadiekal V, Bell A, Johnson ME, Wong KK, Park DC, Hao K, Yip DK, Donninger H, et al. (2009). A gene signature predictive for outcome in advanced ovarian cancer identifies a survival factor: microfibril-associated glycoprotein 2. Cancer Cell 16, 521–532. [DOI] [PMC free article] [PubMed] [Google Scholar]
- Moore K, Colombo N, Scambia G, Kim BG, Oaknin A, Friedlander M, Lisyanskaya A, Floquet A, Leary A, Sonke GS, et al. (2018). Maintenance Olaparib in Patients with Newly Diagnosed Advanced Ovarian Cancer. N Engl J Med. [DOI] [PubMed] [Google Scholar]
- Noordermeer SM, Adam S, Setiaputra D, Barazas M, Pettitt SJ, Ling AK, Olivieri M, Alvarez-Quilon A, Moatti N, Zimmermann M, et al. (2018). The shieldin complex mediates 53BP1-dependent DNA repair. Nature 560, 117–121. [DOI] [PMC free article] [PubMed] [Google Scholar]
- Rondinelli B, Gogola E, Yucel H, Duarte AA, van de Ven M, van der Sluijs R, Konstantinopoulos PA, Jonkers J, Ceccaldi R, Rottenberg S, and D’Andrea AD (2017). EZH2 promotes degradation of stalled replication forks by recruiting MUS81 through histone H3 trimethylation. Nat Cell Biol 19, 1371–1378. [DOI] [PubMed] [Google Scholar]
- Rothkamm K, Kruger I, Thompson LH, and Lobrich M (2003). Pathways of DNA double-strand break repair during the mammalian cell cycle. Mol Cell Biol 23, 5706–5715. [DOI] [PMC free article] [PubMed] [Google Scholar]
- Sakai W, Swisher EM, Jacquemont C, Chandramohan KV, Couch FJ, Langdon SP, Wurz K, Higgins J, Villegas E, and Taniguchi T (2009). Functional restoration of BRCA2 protein by secondary BRCA2 mutations in BRCA2-mutated ovarian carcinoma. Cancer Res 69, 6381–6386. [DOI] [PMC free article] [PubMed] [Google Scholar]
- Skene PJ, and Henikoff S (2017). An efficient targeted nuclease strategy for high-resolution mapping of DNA binding sites. Elife 6. [DOI] [PMC free article] [PubMed] [Google Scholar]
- Stordal B, Timms K, Farrelly A, Gallagher D, Busschots S, Renaud M, Thery J, Williams D, Potter J, Tran T, et al. (2013). BRCA1/2 mutation analysis in 41 ovarian cell lines reveals only one functionally deleterious BRCA1 mutation. Mol Oncol 7, 567–579. [DOI] [PMC free article] [PubMed] [Google Scholar]
- Tomida J, Takata KI, Bhetawal S, Person MD, Chao HP, Tang DG, and Wood RD (2018). FAM35A associates with REV7 and modulates DNA damage responses of normal and BRCA1-defective cells. EMBO J 37. [DOI] [PMC free article] [PubMed] [Google Scholar]
- Wang L, Zhao Z, Meyer MB, Saha S, Yu M, Guo A, Wisinski KB, Huang W, Cai W, Pike JW, et al. (2014). CARM1 methylates chromatin remodeling factor BAF155 to enhance tumor progression and metastasis. Cancer Cell 25, 21–36. [DOI] [PMC free article] [PubMed] [Google Scholar]
- Wilson BG, and Roberts CW (2011). SWI/SNF nucleosome remodellers and cancer. Nat Rev Cancer 11, 481–492. [DOI] [PubMed] [Google Scholar]
- Wu J, and Xu W (2012). Histone H3R17me2a mark recruits human RNA polymerase-associated factor 1 complex to activate transcription. Proc Natl Acad Sci U S A 109, 5675–5680. [DOI] [PMC free article] [PubMed] [Google Scholar]
- Xu G, Chapman JR, Brandsma I, Yuan J, Mistrik M, Bouwman P, Bartkova J, Gogola E, Warmerdam D, Barazas M, et al. (2015). REV7 counteracts DNA double-strand break resection and affects PARP inhibition. Nature 521, 541–544. [DOI] [PMC free article] [PubMed] [Google Scholar]
Associated Data
This section collects any data citations, data availability statements, or supplementary materials included in this article.
Supplementary Materials
Supplemental Movie 1, related to Figure 4
Live-cell time-lapse microscopy imaging of CARM1-high A1847 cells treated with vehicle control.
Supplemental Movie 2, related to Figure 4
Live-cell time-lapse microscopy imaging of CARM1-high A1847 cells treated with 0.4 μM Olaparib.
Supplemental Movie 3, related to Figure 4
Live-cell time-lapse microscopy imaging of CARM1-high A1847 cells treated with 2.5 μM GSK126.
Supplemental Movie 4, related to Figure 4
Live-cell time-lapse microscopy imaging of CARM1-high A1847 cells treated with a combination of 0.4 μM Olaparib and 2.5 μM GSK126.
Supplemental Movie 5, related to Figure 4
Live-cell time-lapse microscopy imaging of CARM1 knockout A1847 cells treated with vehicle control.
Supplemental Movie 6, related to Figure 4
Live-cell time-lapse microscopy imaging of CARM1 knockout A1847 cells treated with 0.4 μM Olaparib.
Supplemental Movie 7, related to Figure 4
Live-cell time-lapse microscopy imaging of CARM1 knockout A1847 cells treated with 2.5 μM GSK126.
Supplemental Movie 8, related to Figure 4
Live-cell time-lapse microscopy imaging of CARM1 knockout A1847 cells treated with a combination of 0.4 μM Olaparib and 2.5 μM GSK126.
Data Availability Statement
Previously published RNA-seq and ChIP-seq of EZH2 and H3K27me3 for parental A1847 and CARM1 knockout A1847 cells were used in this study (NCBI GEO accession number GSE95645) (Karakashev et al., 2018).