Abstract
Adult stem cell therapy has demonstrated improved outcomes for treating cardiovascular diseases in preclinical trials. The development of imaging tools may increase our understanding of the mechanisms of stem cell therapy, and a variety of imaging tools have been developed to image transplanted stem cells in vivo; however, they lack the ability to interrogate stem cell function longitudinally. Here, we report the use of a nanoparticle-based contrast agent that can track stem cell viability using photoacoustic imaging. The contrast agent consists of inert gold nanorods coated with IR775c, a reactive oxygen species (ROS) sensitive near-infrared dye. Upon cell death, stem cells produce ROS to degrade the cell. Using this feature of stem cells, the viability can be measured by comparing the IR775c signal to the ROS insensitive gold nanorod signal, which can also be used to track stem cell location. The nanoprobe was successfully loaded into mesenchymal stem cells (MSCs), and then, MSCs were transplanted into the lower limb of a mouse and imaged using combined ultrasound and photoacoustic imaging. MSC viability was assessed using the nanoprobe and displayed significant cell death within 24 h and an estimated 5% viability after 10 days. This nanoparticle system allows for longitudinal tracking of MSC viability in vivo with high spatial and temporal resolution which other imaging modalities currently cannot achieve.
Keywords: stem cells, viability, photoacoustic, ultrasound, gold nanoparticle, molecular imaging
Graphical Abstract
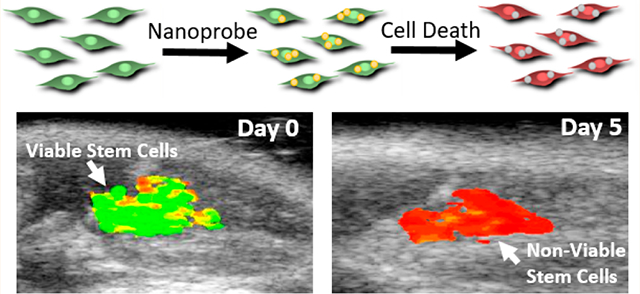
Stem cell therapy offers great potential in treating a multitude of diseases and conditions, including cardiovascular diseases. A variety of different cell lines have been used, including mesenchymal stem cells (MSCs), which have been shown to have strong angiogenic effects with minimal adverse consequences to the injected region.1 At present, there are numerous clinical trials investigating the benefits of stem cell therapy in cardiovascular diseases.2–5 While stem cell therapy has strong potential, there still is a need to be able to track stem cell fate during therapy which can provide information such as cell engraftment, the role MSCs play in vascular repair, and mechanisms of regeneration.6–8 To obtain this information, a better tool for imaging and measuring stem cell viability in real time with high temporal and spatial resolution during therapy is needed.
While the primary method to determine transplanted stem cell viability is the use of histology and immunohistochemistry, these techniques are end point measures which provide high spatial resolution but cannot be done in real time with high temporal resolution.9 Histology provides a snapshot of a single time point of a sample, making it costly and time-consuming to perform longitudinal analyses. These limitations ultimately hamper its use as a cell tracking method. Another technique, bioluminescence, can provide real-time imaging and high temporal resolution but lacks the necessary spatial resolution to track small volumes of cells. Through the use of reporter genes, cell proliferation can be measured but has safety concerns due to the use of transfection agents and potential immune response.10–12 Fluorescence microscopy has high sensitivity toward cell fate, but its limited depth penetration (<1 mm) makes it a poor choice for in vivo stem cell tracking.13 Radiolabeling MSCs for nuclear imaging such as positron emission tomography (PET) or single photon emission computed tomography (SPECT) has good sensitivity but lacks spatial resolution and long-term longitudinal imaging due to the contrast agent’s short half-life.10–12,14 Iron oxide nanoparticles have been used as contrast agents to label stem cells for magnetic resonance imaging (MRI). This technique has high spatial resolution and long-term cell tracking ability, but MRI’s high costs make it a poor choice for fast and continuous analysis of cell therapy.15–17
Photoacoustic imaging is an imaging modality previously used to track implanted stem cells.18,19 In photoacoustic imaging, acoustic waves are produced by thermal expansion of an absorber after a short laser pulse. Photoacoustic imaging provides depth penetration of several centimeters, sub-millimeter spatial resolution, and less than a second temporal resolution.20–22 Photoacoustic imaging is not sensitive toward implanted stem cells alone, but through the use of exogenous contrast agents such as gold nanoparticles,9,18,23–25 carbon nanotubes,26–28 and Prussian blue nanoparticles,29 stem cells have been visualized using this technique. Gold nanoparticles in particular have shown low toxicity and good loading into stem cells for long-term cell tracking.9,18,23,30 However, gold nanoparticles are insensitive to cell viability without additional ligand or dye functionalization such as through the use of reporter genes.31 Near-infrared photoacoustic dyes have been created to sense chemical species,32–34 pH,35–38 and metal ions.39,40 There is potential to combine one of these sensitive dyes with the labeling capability of gold nanoparticles to develop a viability probe using photoacoustic imaging.
In this study, we developed a probe for tracking stem cell viability in vivo through the use of photoacoustic imaging. Previous studies have shown transplanted stem cells may have 75–80% cell death in the first 1–3 days.41–43 Among the cell death cascade, a 4–6-fold increase in reactive oxygen species (ROS) is synthesized by MSCs to degrade proteins, membranes, and DNA.44–47 This formation of ROS motivates the choice to target ROS as the marker for viability of injected stem cells in vivo. Gold nanorods (AuNRs) have low sensitivity toward ROS and are not degraded or appreciably exocytosed making them an appropriate cell tracking agent.30 IR775c is a near-infrared dye which has previously been shown to be sensitive toward ROS and has been used to measure ROS production using fluorescence and photoacoustic imaging.48–50 By combining chemically inert AuNRs with an ROS sensitive photoacoustic dye in vivo longitudinal tracking of MSC viability was demonstrated.
RESULTS
Nanoprobe Design and Characterization.
The nanoprobe consists of electrostatically bound IR775c to poly-D-lysine (PDL) which is then electrostatically bound to silica-coated AuNRs (Figure 1). The AuNRs are synthesized to have a peak plasmon resonance of 880 nm which is then coated in silica using the Stöber process51 to shift the peak plasmon resonance to 910 nm and enhance the photoacoustic signal.52 IR775c was synthesized from IR775 by removing a chlorine side-group and replacing it with a carboxylic acid to confer electrostatic complexation with the PDL (Figure 1).
Figure 1.
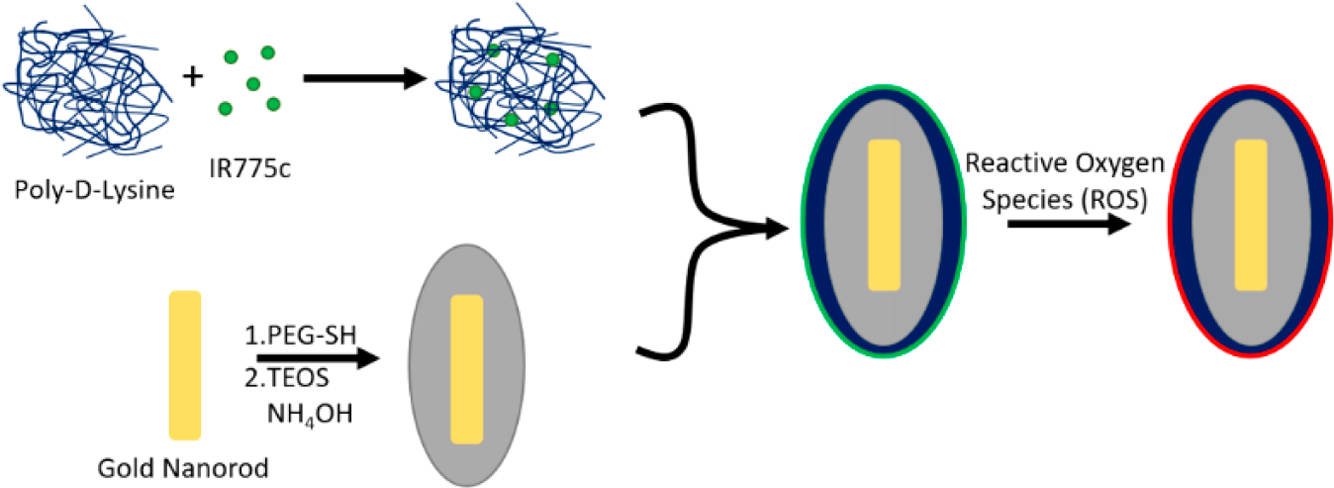
Diagram of nanoparticle synthesis. IR775c is electrostatically bound to poly-D-lysine. At the same time, AuNRs are coated in a layer of silica using the Stöber method. The IR775c/PDL is then electrostatically bound to the silica-coated AuNRs. The particle is composed of the polymer/dye mixture on the outside of the AuNR (green), allowing for ROS to interact with the dye and degrade it (red), while the inert AuNR does not change, thus giving different photoacoustic signals due to ROS interaction.
Each synthesis step of the nanoprobe was imaged using transmission electron microscopy (TEM). PDL was used because it has previously been shown to increase cellular uptake of gold nanoparticles30 and be enzymatically resistant53 (Figure 2A–D). The addition of a silica layer was confirmed, and the attachment of the polymer-dye layer was visualized. Furthermore, formation of each layer was analyzed by measuring the ζ potential and hydrodynamic diameter using dynamic light scattering (Figure 2E,F). The ζ potential shifted from +20 mV for PEGylated AuNRs to −40 mV after silica coating. The PDL layer caused the ζ to flip charge to +40 mV, and when coated with a dye/PDL it shifted to +8 mV. Hydrodynamic diameter results further validated the layer-by-layer synthesis. PEGylated AuNRs were initially 70 nm and increased to 150 nm for silica-coated AuNRs. The addition of PDL added 20 nm to the diameter, and addition of dye/PDL caused the diameter to increase to 450 nm. This measured diameter is primarily driven by nanoprobe aggregation, which occurs due to the relatively neutral ζ potential of the dye/PDL coating. TEM images of the nanoprobe also show this behavior when compared to just silica- or PDL-coated AuNRs. The nanoprobe absorption spectrum has a large peak at 790 nm which is due to the red shift of IR775c being electrostatically bound to PDL (Figure 2G). The AuNR peak is not visible in the spectra due to the broadness of the dye peak. Excess dye absorbance is necessary due to the large difference in absorption extinction coefficients between near-infrared dyes (105) and AuNRs (109).54
Figure 2.
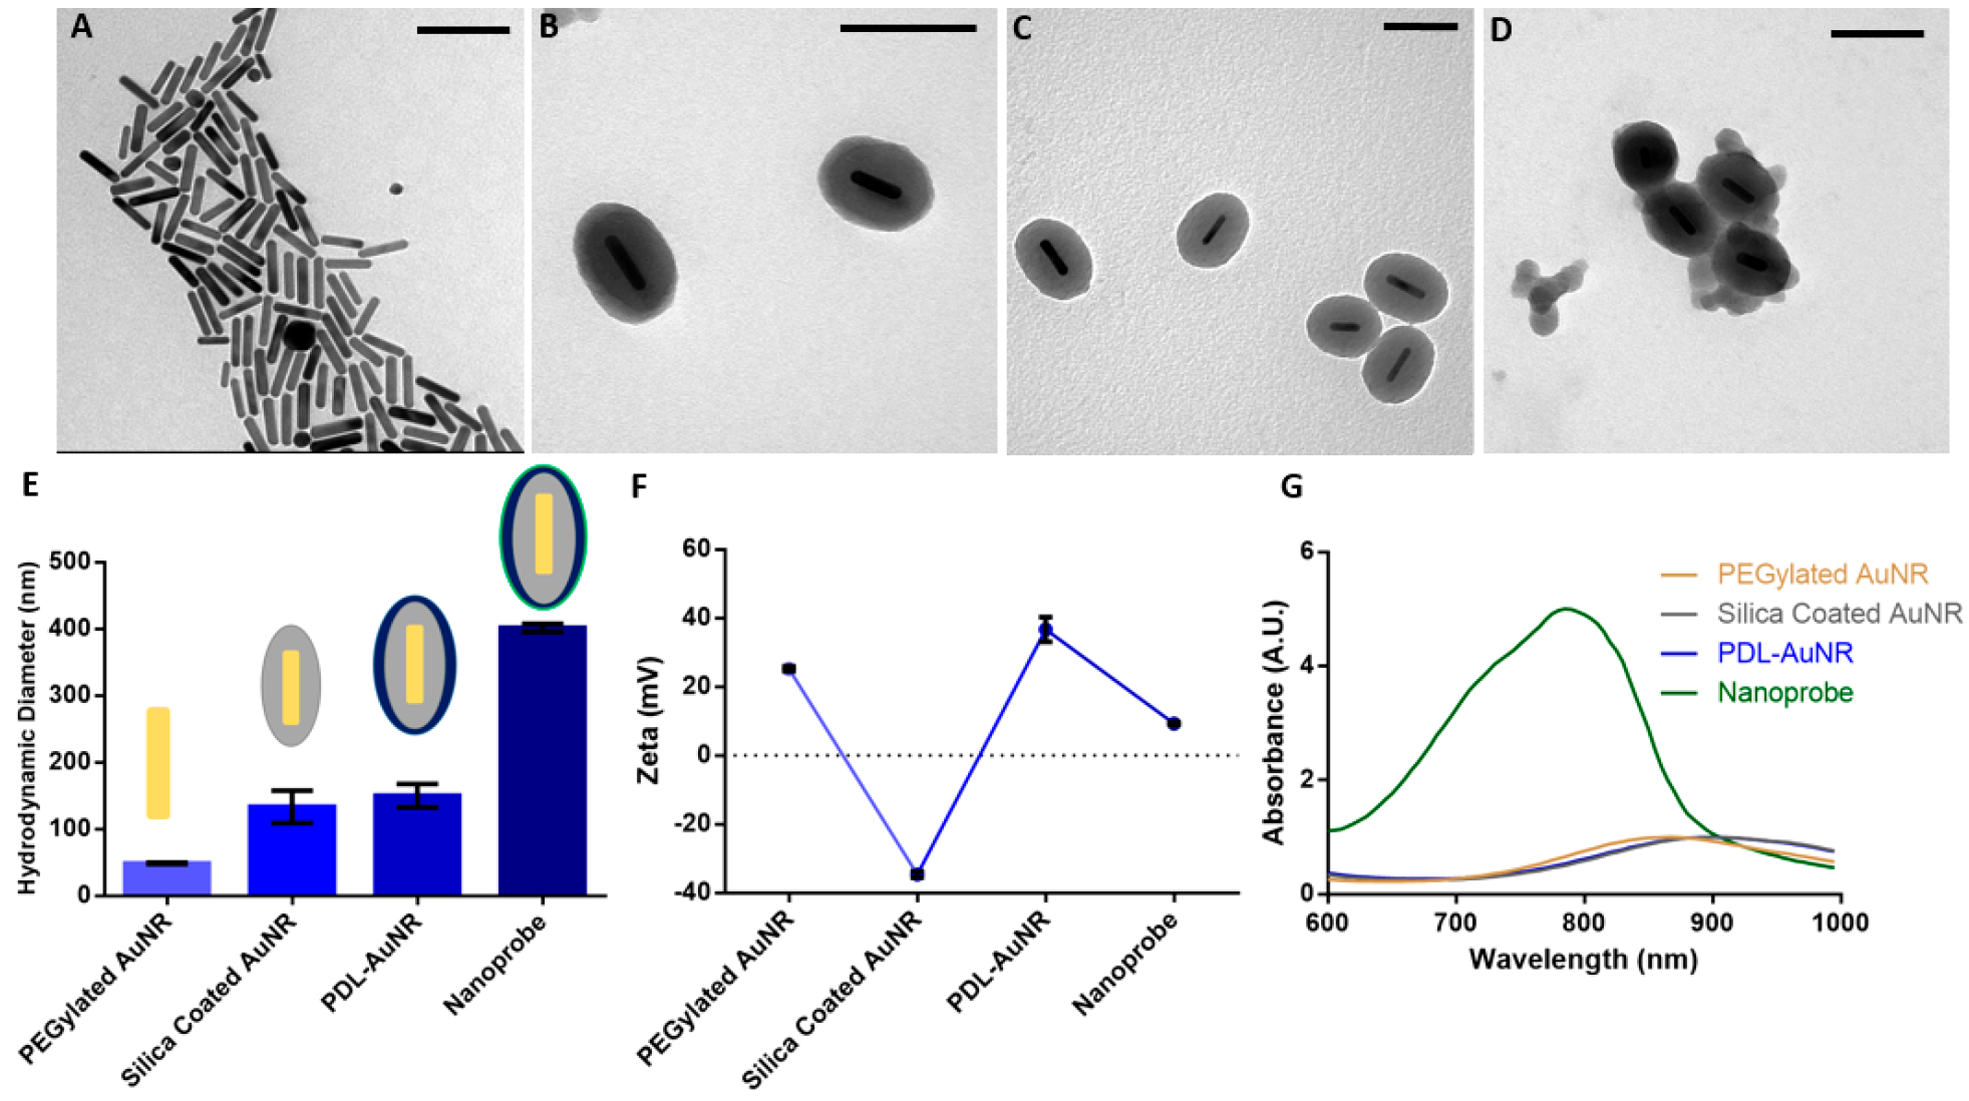
Characterization of the nanoparticle. TEM images of (A) gold nanorods, (B) silica-coated AuNRs, (C) PDL layered silica-AuNRs, and (D) PDL/IR775c layered silica-AuNR were obtained. (E) The hydrodynamic diameter increased for each step with the final nanoparticle having a diameter of 400 nm. (F) The ζ potential for each step was collected displaying flipping ζ potential with each layer and a relatively neutral ζ potential for the final particle. (G) The absorbance spectra displayed changing peak absorbance from 875 nm for AuNR to 910 nm for silica-AuNR and PDL-coated silica-AuNR, and 780 nm for the final nanoparticle. Scale bar is equal to 100 nm.
Next, we evaluated probe reactivity to ROS using absorbance spectroscopy. AuNRs displayed minimal effects by the addition of ROS while IR775c was reduced by a factor of 20 with the addition of 10 μM peroxynitrite (ONOO-) (Figure 3A,B). The nanoprobe displayed a linear rate of decreased absorption at 790 nm with addition of ONOO- (Figure 3). The linear range was from 0 to 20 μM ONOO-. The nanoprobe has decreased absorption as expected based on the sensitivity of the dye to ROS. Although not tested here, IR775c has also been shown to be reactive toward a wide range of ROS such as hydrogen peroxide, hypochlorite, and hydroxyl free radical.48
Figure 3.
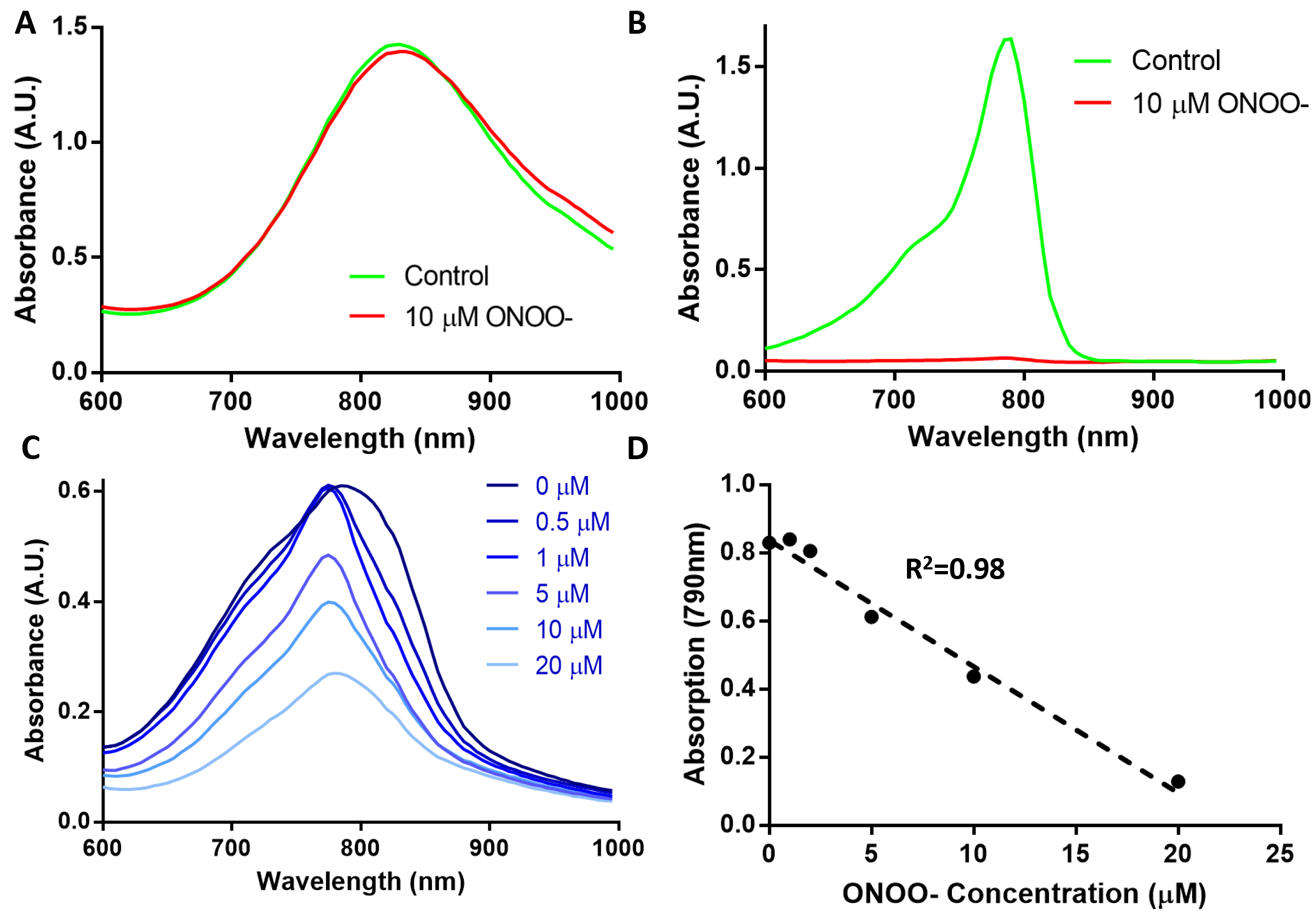
Effect of ROS was measured using absorption spectroscopy. (A) AuNRs displayed little change when reacted with peroxynitrite, unlike (B) IR775c which reduced by 20-fold. The nanoparticle (C) displayed reduced absorbance with larger concentrations of ONOO-. (D) A linear relationship can be seen when comparing the absorption at 780 nm against the concentration of ONOO-.
Since we have determined that the nanoprobe will respond to ROS by examining its absorption profile, the next step was to measure how the nanoprobe’s photoacoustic signal changes due to ROS (Figure 4A). The probe’s photoacoustic signal was similar in feature to the absorption spectrum with a broad peak at 780–800 nm and a small peak at 910 nm coinciding with IR775c and AuNR, respectively (Figure 4B). Upon addition of ONOO-, the 790 nm peak was reduced while the 910 nm peak did not change. As seen with the absorption data the dye’s photoacoustic signal was linearly related to the amount of ONOO-, thus allowing a ratiometric measurement between 790 and 910 nm, the dye peak and AuNR peak, respectively (Figure 4C).
Figure 4.

Effect of ROS by measuring photoacoustic signal. (A) PA signal at 790 nm is reduced with higher concentrations of ONOO-. (B) The photoacoustic spectra displays the reduction of the dye peak while the AuNR peak (910 nm) is unchanged. (C) The relationship between ONOO- concentration and PA ratio is linear.
Validation of Nanoprobe Sensing Stem Cell Viability in vitro.
The nanoprobe capacity to label and track MSCs was studied next. Poly-lysine-coated AuNRs have been shown to have low cytotoxicity when loaded into stem cells.30 The nanoprobe was incubated at different concentrations starting at 6 μg/mL to determine optimal labeling efficiencies. The MTS cell proliferation assay was used to determine the nanoprobe’s effect on cell viability. As shown in Figure S2, concentrations as high as 20 μg/mL had a negligible effect on cell metabolism; however, at 40 μg/mL metabolism was reduced by 50%. On the basis of this, MSCs were loaded at 20 μg/mL for all remaining studies. In addition, the Live/Dead assay was used to confirm that the nanoprobe did not negatively impact cell viability. In this study, no visible changes to cell morphology were observed, and cell viability was indistinguishable from a control group (Figure S2).
To induce cell death in stem cells, nanoprobe-loaded MSCs were incubated with 20 μM doxorubicin for 48 h. Doxorubicin has been shown to induce apoptosis in stem cells by intercalation of DNA which is followed by high intracellular ROS production and depolarization of mitochondrial membranes.44 After 48 h of doxorubicin incubation, a greatly reduced number of adherent cells is evident, and both the live and dead fluorophores overlap indicating that cells are undergoing cell death (Figure S3). Furthermore, the stem cell group incubated with doxorubicin has greatly reduced metabolic activity (17%) versus a control group in an MTS assay (Figure S3).
After establishing loading and apoptosis-inducing parameters, the ability of our nanoprobe to detect MSC viability was evaluated using ultrasound/photoacoustic imaging (US/PA). MSCs were plated at 10 000 cells/cm2 loaded with the nanoprobe for 6 h and then exposed to doxorubicin for 48 h to induce cell death. After doxorubicin treatment, cells were collected and placed in a gelatin phantom (50 000 cells in 20 μL) and then imaged using a combined US/PA system (Figure 5A). Representative regions of interest (ROIs) were selected for analysis from the 790 nm photoacoustic projections. As expected, two peaks were evident, one at 790 nm and a second peak at 910 nm. The 790 nm peak, representing the dye, was narrower and slightly red-shifted as compared to the nanoprobe alone, likely due to optical attenuation and scattering by the MSCs, and decreased in amplitude relative to the AuNR peak at 910 nm. This reduction in signal ratio is likely due to loss of polymer/dye during endocytosis of the particle. The peaks are well-defined and separated, allowing for easier ratiometric analysis to determine cell viability. A control group of viable MSCs without doxorubicin was compared to MSCs incubated with 20 μM doxorubicin for 48 h (Figure 5B). With both groups normalized to the 910 nm peak, the control group had a 790 nm/910 nm ratio of 1.31 versus 1.04 for the doxorubicin treated stem cells. The amplitude at 790 nm of the apoptotic MSCs versus the living MSCs is reduced by 18% (Figure 5C). This reduction in signal is caused by the degradation of the IR775c dye by apoptotic stem-cell-generated ROS, whereas the shape and peak wavelength of the AuNR remains unchanged. A longitudinal US/PA experiment was conducted in viable cells to determine if dye was being exocytosed separately from the AuNR, and PA ratios were stable with no change in signal over 5 days (Figure S4). This result shows that the nanoprobe is an effective way to measure MSC viability in vitro.
Figure 5.
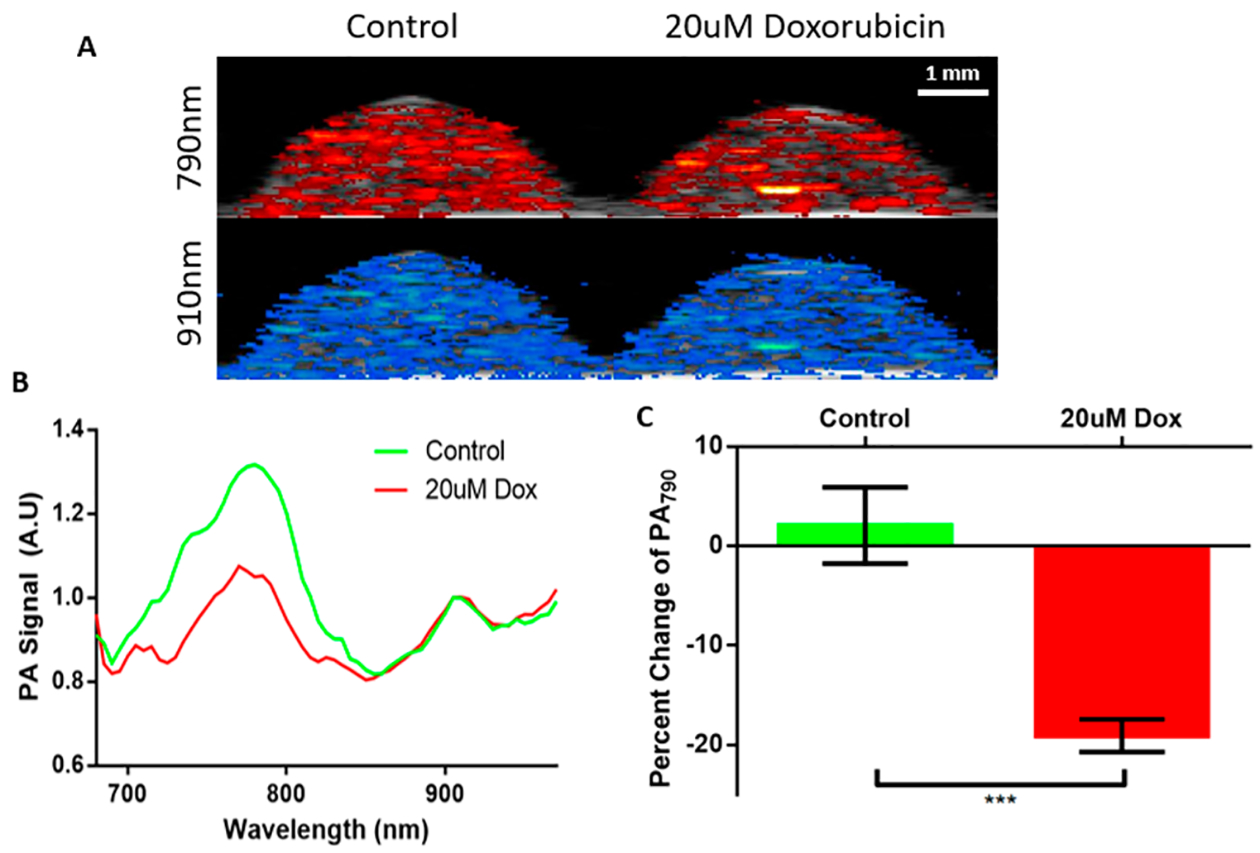
Validation of the nanoparticle in stem cells. (A) PA images are overlaid with corresponding B-mode ultrasound images. At 790 nm the control group has a slightly higher signal compared to the doxorubicin treated group. At 910 nm both groups have a similar signal. (B) The PA spectra display the dye and AuNR peaks. The AuNR peak is unchanged while the dye peak is reduced in the stem cells treated with doxorubicin. (C) Quantification of the reduced signal displays a negligible change in the control group and an 18% decrease in signal for the doxorubicin treated stem cells. *** p < 0.005.
Tracking Stem Cell Viability in vivo.
Nanoprobe-loaded MSCs were mixed with PEG-fibrin solution for injection into the gastrocnemius muscle. Intramuscular delivery of MSCs is a common model for treating peripheral artery disease in preclinical and clinical studies.55,56 This was followed by US/PA imaging immediately after injection (day 0) and then on days 1, 3, 5, 7, and 10 (Figure S5). We assume that MSCs were alive directly after transplantation, providing an initial photoacoustic signal representative of living cells on day 0. Each subsequent imaging session was compared to the initial PA signal to monitor injected cell population viability over time. As shown in Figure 6, the transplanted MSCs were visualized using photoacoustic imaging at 795 and 920 nm, layered over the ultrasound projections, which was determined to be the peaks as shown on the PA spectra. This red shift was likely due to optical attenuation and scattering by the surrounding tissue. To visualize the transplanted stem cell’s viability, a ratiometric heatmap of the photoacoustic signal was developed by projecting the ratio of the PA signal at 795 and 920 nm (Figure 6). With this tool, we were able to visualize the location and state of the MSCs, with higher ratio values indicating living MSC populations and lower values indicating dying or dead cell populations. This method was developed from the in vitro data displaying reduction in the dye peak due to dye degradation caused by stem cell death. In Figure 7, the MSCs’ state was monitored over 10 days, revealing a reduction in the dye/nanorod ratio over time. More specifically, PA spectra of the transplanted MSCs over time displayed the dye peak reduction of 22% by day 1 to 38% by day 10 when normalized to the AuNR peak (Figure 8A,B). This reduction is similar to in vitro measurements of stem cells incubated with doxorubicin. The 795 nm/920 nm ratio for each pixel within an ROI of day 0 and 1 was plotted on a histogram, and two clear peaks emerged at 1.18 and 0.75, correlating to the median ratio for day 0 and day 1, respectively (Figure 8C). By selecting a point between the two peaks where the populations overlap the most we created a cutoff point which separates the living and dead stem cell populations. As the cutoff point, 0.95 was selected, and the relative viability of the stem cell populations was calculated. In Figure 8D, the relative viability of the MSCs was calculated for each time point with viability on day 0 being 0.92 to day 10 with a viability measurement of 0.05. A rapid reduction in cell population viability is detected within the first day with slower cell death through day 10. In addition, there is reduced overall signal from the stem cells as the gel degrades, and stem cells are dispersed.
Figure 6.
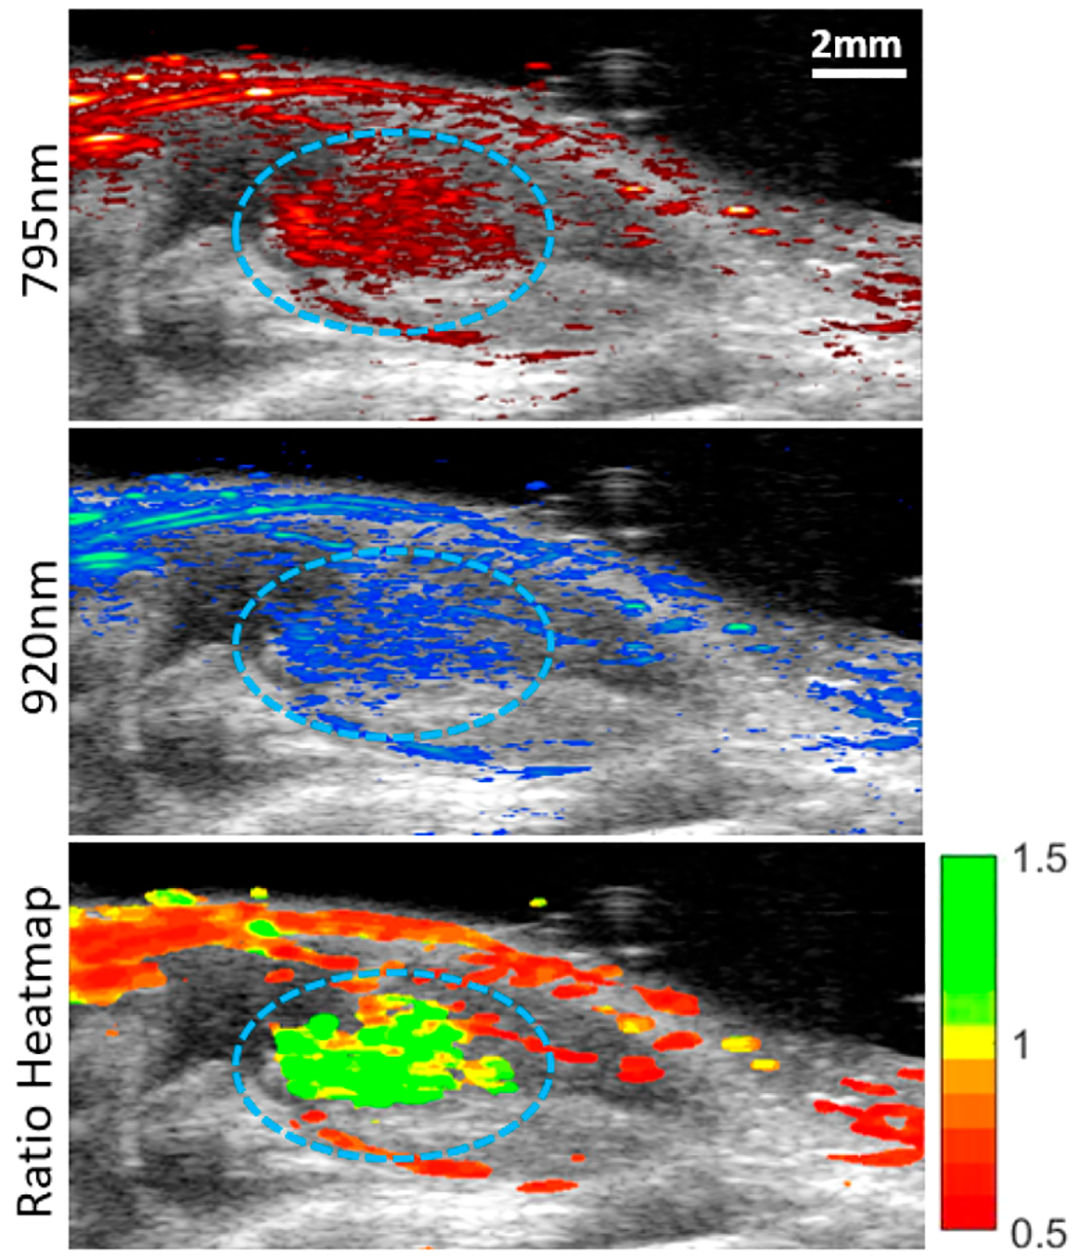
Imaging stem cells in vivo. The US/PA image of transplanted stem cells on day 0 is visualized at 795 and 920 nm excitation, correlating with the IR775c dye and AuNR peak. The labeled stem cells are circled in blue. The last image is a heatmap using the ratio of 795 nm/920 nm. The stem cells display a high ratio as expected due to them being alive directly after transplantation.
Figure 7.
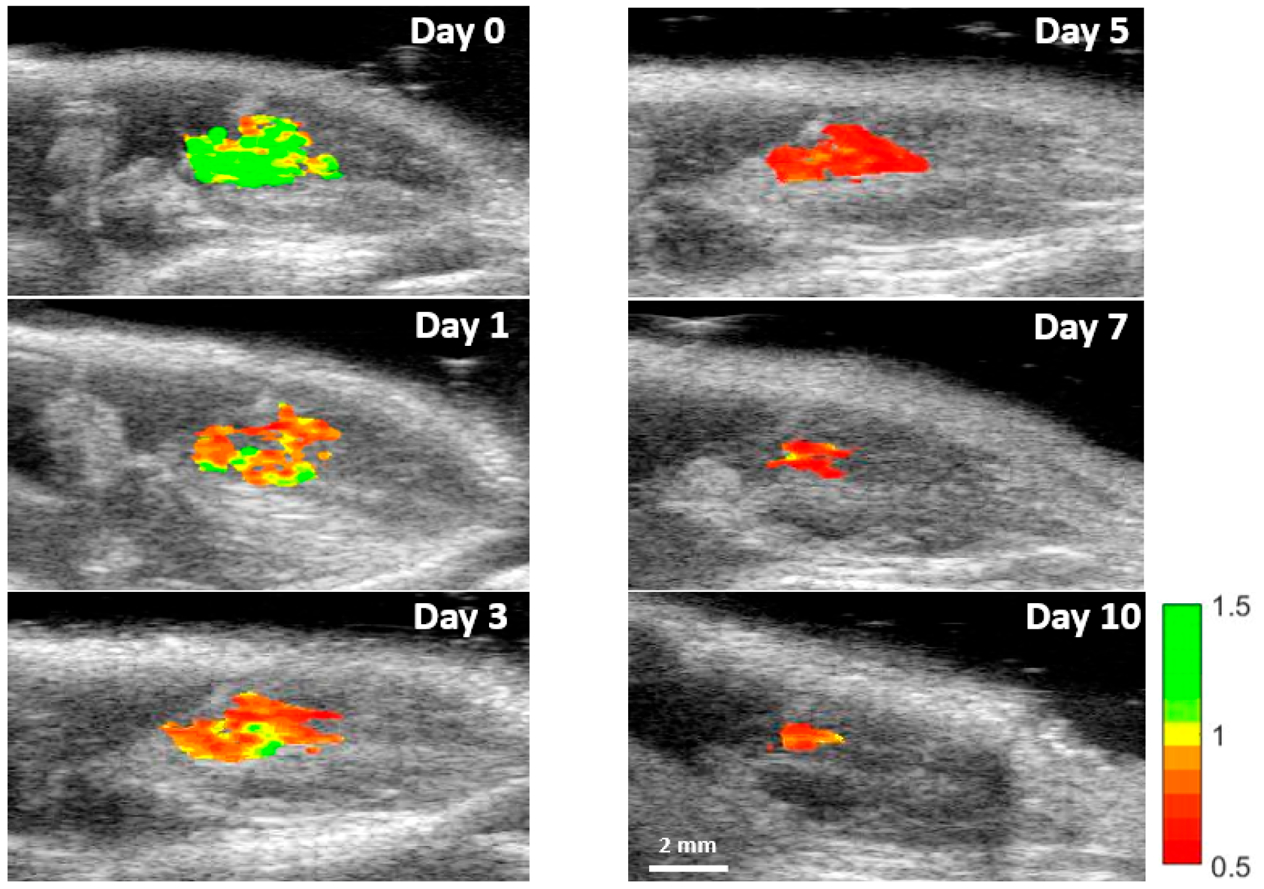
Ratiometric imaging of stem cell viability in vivo. PA images of day 0, 1, 3, 5, 7, and 10 at 795 and 920 nm were obtained, and the ratiometric images were created. The surrounding tissue signal was subtracted to better visualize the change in stem cell viability during the study. Reduction in ratio and signal is visible.
Figure 8.
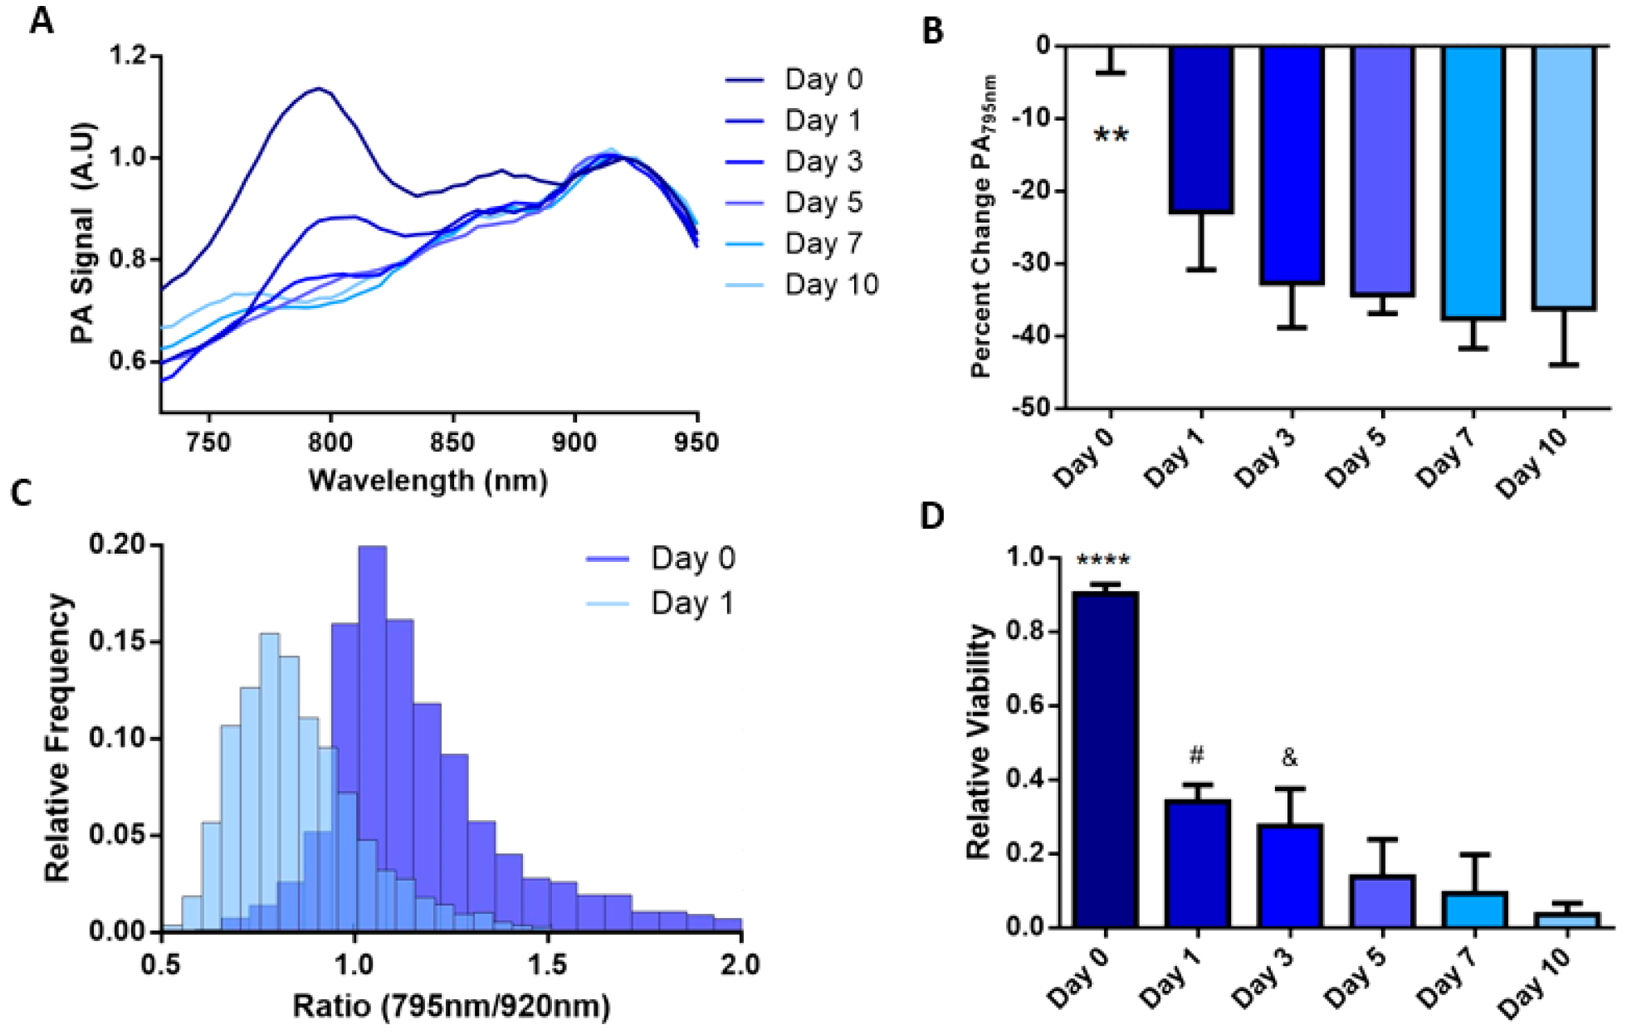
Analysis of the photoacoustic in vivo stem cell viability study. (A) PA spectra changes over the studies duration; the IR775c peak gradually decreases over time. (B) Quantification of the IR775c peak displays a reduction in signal by 22% on day 1 and steady 30–35% reduction on days 3–10. ** p < 0.01 compared to days 1–10. (C) Histogram of ratiometric data for days 0 and 1 show two distinctive groups with small overlap. A break at 0.95 was used to separate the two groups, with ratios greater than 0.95 signifying living cells and below 0.95 indicating dead cells. (D) Each time point is quantified to display relative viability with 92% viable cells on day 0 to 5% viable by day 10. **** p < 0.0001 compared to all days. # p <.05 compared to day 7 and 10. & p < 0.05 compared to day 10.
The nanoprobe system allows for tracking stem cell viability through the use of an inert gold nanoparticle and ROS sensitive photoacoustic dye. Stem cells can be loaded with the nanoprobe, and viability can be tracked using photoacoustic imaging. This system can be used for a variety of cell therapies to measure viability and track cells post-transplantation. This tracker uses photoacoustic imaging due to its good spatial and temporal resolution along with high sensitivity. In addition, this system allows for long-term longitudinal imaging of transplanted stem cells. This study was designed to only track MSC viability without a disease state to determine the ability of the nanoprobe tracker in vivo. The effect of the nanoprobe on stem cell’s differentiation potential was not analyzed here, but previous research has shown that gold nanoparticles do not inhibit the MSCs ability to differentiate in vitro or in vivo.30,57 A limitation of the nanoprobe is that it can only detect the viability of stem cells that are loaded with the nanoprobe, meaning it cannot track proliferation and will have reduced sensitivity over time as cells proliferate and migrate.
We aim to use this nanoprobe to further evaluate how disease states affect stem cell viability during therapy and determine what delivery methods can sustain cell viability to drive better patient outcomes. A variety of effects on cell viability in vivo can be measured using this tool. The nanoprobe can be used to determine the effect that co-transplantation with soluble factors or a hydrogel has on stem cell viability.58,59 Using the nanoprobe as a tool in this fashion will provide many researchers a faster process to optimize their therapeutic condition in a preclinical setting.60 In addition, looking at the effect of cell transplantation timing after disease onset and number of transplanted stem cells on stem cell viability can provide clinicians with optimal conditions for better patient outcomes.61–63
In addition to tracking cell viability the system can potentially be used to track ROS creation in different applications. For example, the nanoprobe can be used to map inflammation in tumors, ischemia, and wounds to better understand how inflammation affects these conditions. Macrophage activity can be monitored by loading macrophages with the nanoprobe prior to transplantation to measure polarization to a pro-inflammatory state. The system can also be altered by switching out IR775c with dyes exhibiting sensitivities toward pH, ions, or metals to use photoacoustic imaging to map their response while using the AuNR as an inert tracker.
CONCLUSION
In conclusion, a contrast agent was developed to track stem cell viability using photoacoustic imaging. A ROS sensitive near-infrared dye, IR775c, was bound to inert gold nanorods. The probe was characterized by dynamic light scattering (DLS), TEM, and ζ potential, and ONOO- was used to test its sensitivity toward ROS. The contrast agent was found to have low toxicity when endocytosed by MSCs. MSCs were labeled in vitro, and cell death was induced to determine the feasibility of the particle system. This was followed by transplanting nanoprobe-loaded MSCs intramuscularly to track stem cell viability over time using photoacoustic imaging. Stem cell viability was tracked longitudinally, and viability was found to decrease rapidly. This nanoprobe can track cell viability in real time, which will be useful to enhance our understanding of cell therapy and can be translated to tracking stem cell therapy longitudinally in patients. This tool can help determine the contribution and efficacy of cell therapies prior to functional recovery measurements in patients.
MATERIALS AND METHODS
Materials.
Poly-D-lysine (30–70 KDa), peroxynitrite (ONOO-), gelatin, PTFE tubing (1/16 in. × 0.031 in.), fibrinogen, thrombin, calcium chloride (CaCl2), IR775, dimethylformamide (DMF), isopropyl alcohol (IPA), mercaptopropionic acid, triethylamine (TEA), sodium borohydride (NaBH4), gold chloride trihydrate (HAuCl4), silver nitrate (AgNO3), ascorbic acid, and tetraethyl orthosilicate (TEOS) were purchased from Sigma-Aldrich; cetyl-trimethylammonium bromide (CTAB) was purchased from Amresco, 2 KDa polyethylene glycol (mPEG-SH) from Laysan Bio, 3.4 KDa SG-PEG-SG from NOF America, and ammonium hydroxide (NH3OH) from Fisher Scientific.
Nanoprobe Synthesis.
First, IR775c was synthesized by dissolving 50 mg of IR775 in 0.5 mL of DMF and reacted with 10 μL of mercaptopropionic acid and 21 μL of TEA for 24 h at room temperature. The reaction was stopped by the addition of excess dichloromethane, washed with brine, filtered, and evaporated. The product was analyzed using mass spectroscopy to determine purity (Figure S1). A product yield of 60% and purity of 95% were achieved. Gold nanorods were synthesized via seed mediated growth as previously described.64 Briefly, gold seed solution was prepared by mixing 0.6 mL of NaBH4 (10 mM) with 5 mL of 0.0005 M HAuCL4 (0.5 mM) and 5 mL of CTAB (200 mM). Then, 0.958 mL of seed solution was added to the growth solution consisting of 380 mL of 0.2 M CTAB, 15 mL of 0.01 M AgNO3, 40 mL of 0.01 M HAuCl4, and 4.4 mL of 0.1 M ascorbic acid. The solution was mixed overnight and turned dark red which was followed by three washes via centrifugation (20 000g, 30 min) and resuspended in DI H2O. The gold nanorods were then coated with mPEG-SH through ligand exchange by mixing equal parts aqueous 1 mg/mL mPEG-SH with an aqueous solution of gold nanorods. Excess PEG was removed by centrifuge filtration at 1500g for 10 min. This was followed by adding a layer of silica using the Stöber method.51 Under vigorous stirring, 3 mL of IPA was added to 2 mL of AuNR followed by 1.2 mL of TEOS (3% in isopropyl alcohol) and 1.2 mL of NH3OH (8.4% in isopropyl alcohol). The reaction mixed for 2.5 h followed by centrifugal filtration at 1000g for 5 min. Poly-D-lysine (30–70 KDa) was mixed with IR775c for 1 h, and then, silica-coated gold nanorods were added and mixed for 1 h followed by centrifugation (2500g, 15 min).
Nanoprobe Characterization.
The size and layer formation of the nanoprobe were characterized by transmission electron microscopy (TEM) and dynamic light scattering (DLS), and surface charge was characterized by ζ potential measurements. For TEM, an FEI Tecnai transmission electron microscope operating at 80 kV was used. The nanoparticle solution was drop-cast on carbon-coated copper 300 mesh (Electron Microscopy Science) which had been glow discharged. A Malvern Zetasizer nano ZS was used for DLS analysis and ζ potential measurement. The nanoparticle solution was placed in a cuvette, and readings were taken at 25 °C. For size measurements, 3 repetitions were taken of each solution with 20 readings per repetition. For ζ potential measurements, 3 repetitions were taken of each solution with 100 readings per repetition.
Assessment of ROS Sensitivity.
Gold nanorods and IR775c were placed in 10 μM ONOO- for 10 min prior to measuring absorbance using a Biotek Cytation 3 plate reader. The nanoprobe was placed in varying concentrations (0–50 μM) of ONOO- for 1 h prior to measuring absorbance using a plate reader. For photoacoustic sensitivity, after treatment with ONOO-, 50 μL of nanoprobe was placed into 5 cm of tubing, and the ends were closed off using nail polish. The tube phantom was secured into a container filled with water. Photoacoustic imaging was conducted using a commercially available Vevo LAZR system (Visualsonics) with a 21 MHz linear array transducer with optical cable connected to a tunable Nd:YAG laser. The signal was collected between 680 and 970 nm at 40 dB and 100% power.
Cell Culture and Loading.
Mesenchymal stem cells (Lonza) were seeded at 5000 cells/cm2 unless otherwise noted in growth media (Dulbecco’s modified Eagle’s medium (DMEM), supplemented with 10% fetal bovine serum (FBS), 1% Glutamax, and 1% penicillin-streptomycin). Media was changed every 2 days, and cells were passaged when they reached 80% confluency. Cells were cultured under standard cell culture conditions (37, 5% CO2). Passage 2–9 MSCs were used in all studies. All cells were counted after harvesting and washing. For loading, stem cells were plated at 100 000 cells per well in a 6-well plate (2 mL) and cultured for 2 days followed by the addition of 50 μL of nanoprobe in serum-free media (DMEM supplemented with 1% Glutamax and 1% penicillin-streptomycin) for 6 h, rinsing with PBS, and growth media being added back. The stem cells were removed from the plate using a 0.25% trypsin/EDTA solution for 5 min followed by centrifugation at 500g for 5 min.
Cytotoxicity.
Toxicity of the stem cells was evaluated using an MTS cell proliferation assay (Fisher Scientific) and Live/Dead assay (Thermo Fisher Scientific). For the MTS assay, mesenchymal stem cells were plated on a 12-well plate followed by incubation with the nanoprobe as previously stated but at varying concentrations of the nanoprobe (0–40 μg/mL). The following day, the stem cells were placed in a solution of 16% MTS reagent and 84% growth media of for 4 h, and then, absorption was measured at 490 nm. For the Live/Dead assay, the stem cells were plated and loaded the same, and after 24 h, the cells were rinsed with PBS and incubated with 4 μM calcein and 2 μM ethidium homodimer for 30 min followed by 3 rinses of PBS. The cells were placed in PBS and imaged using an inverted fluorescence microscope using a 20× objective.
In vitro Photoacoustic Imaging.
A tissue-mimicking phantom consisting of gelatin was prepared. A container was filled with a 2 cm thick layer of 8% gelatin. A 20 μL inclusion consisting of a premixed solution of equal parts nanoprobe loaded stem cells (with or without doxorubicin) and 16% gelatin was placed on top of the bottom layer. Photoacoustic imaging was conducted using a Vevo LAZR system with a 21 MHz linear array transducer with excitation wavelengths between 680 and 970 nm at 100% power and 40 dB. The peak energy at 680 nm was 20 mJ at 20 Hz. Matlab 2016b was used to analyze the images. The background was removed using a 5% threshold followed by 3 ROIs selected per field of view. For each wavelength the mean of each ROI was calculated to create the PA spectra and percent change. Graphpad prism was used for statistical analysis. P-values were calculated using a t test.
Photoacoustic Imaging of Cells in vivo.
Animal handling and care followed the recommendation of the National Institutes of Health (NIH) guidelines for the care and use of laboratory animals. All protocols were approved by the Institutional Animal Care and Use Committee (IACUC) at University of Texas at Austin. Female FVB/n mice (3–6 months) were used in this study in triplicate. The mice were anesthetized using 1.5% isoflurane with 1 L/min oxygen. Bifunctional SH-PEG (8 mg/mL) was mixed with fibrinogen (80 mg/mL) followed by the addition of equal volume of MSCs (40 × 106 cells/mL). A 25 μL portion of thrombin (25 U/mL) was preloaded into the 0.5 mL insulin syringe with a 28 gauge needle followed by 25 μL of the PEGylated fibrinogen and MSC solution, and a total volume of 50 μL was injected into the gastrocnemius muscle of the mouse. The final concentrations of the PEGylated fibrinogen gel were 10 mg/mL fibrinogen, 1 mg/mL SG-PEG, 10 × 106 MSCs/mL, and 12.5 U/mL thrombin. A commercial Vevo LAZR system was used for photoacoustic and ultrasound imaging. A 21 MHz linear array transducer was used. Wavelengths between 680 and 970 nm were used for 2D image collection. Three-dimensional data of the lateral gastrocnemius muscle was collected using a step-motor collecting images every 0.15 cm at 795 and 920 nm. Matlab 2016b was used to analyze the images. Artifacts due to other sources of signal were removed from the images. Stem cells were located on the basis of signal intensity at 920 nm. ROIs were manually outlined for analysis. Three slices per animal were used for analysis with a sample size of three mice. The ratio heatmap was created by first smoothing with a 3 × 3 pixel area followed by dividing the 795 nm image by the 920 nm image at each pixel. The PA signal of the surrounding tissue was subtracted out. The mean of the ROI was used for creating the PA spectra and percent change. The histogram consists of 5741 pixels for day 0 and 4271 pixels for day 1. Relative viability was calculated by counting all pixels above the cutoff divided by all pixels in the ROI. Graphpad prism was used for statistical analysis. P-values were calculated by ANOVA with the Tukey multiple comparison test.
Supplementary Material
ACKNOWLEDGMENTS
This work was supported by the National Institute of Health (NIH EB015007). We are grateful for discussions with S. Emelianov (Georgia Tech), K. Kubelick (Georgia Tech), D. Dumani (Georgia Tech), and J. Cook (NanoHybrids). TEM images were acquired at the Institute for Cellular and Molecular Biology at the University of Texas at Austin.
Footnotes
S Supporting Information
The Supporting Information is available free of charge on the ACS Publications website at DOI: 10.1021/acsnano.9b01802.
Mass spectrometry measurements, Live/Dead assay images, MTS assay data, and ultrasound and photoacoustic images (PDF)
The authors declare no competing financial interest.
REFERENCES
- 1.Wu Y; Chen L; Scott PG; Tredget EE Mesenchymal Stem Cells Enhance Wound Healing Through Differentiation and Angiogenesis. Stem Cells 2007, 25, 2648–2659. [DOI] [PubMed] [Google Scholar]
- 2.Bartunek J; Behfar A; Dolatabadi D; Vanderheyden M; Ostojic M; Dens J; El Nakadi B; Banovic M; Beleslin B; Vrolix M; Legrand V; Vrints C; Vanoverschelde J; Crespo-Diaz R; Homsy C; Tendera M; Waldman S; Wijns W; Terzic A Cardiopoietic Stem Cell Therapy in Heart Failure. J. Am. Coll. Cardiol 2013, 61, 2329–2338. [DOI] [PubMed] [Google Scholar]
- 3.Lawall H; Bramlage P; Amann B Stem Cell and Progenitor Cell Therapy in Peripheral Artery Disease. Thromb. Haemostasis 2010, 103, 696–709. [DOI] [PubMed] [Google Scholar]
- 4.Taghavi S; Duran JM; George JC Stem Cell Therapy for Peripheral Arterial Disease: A Review of Clinical Trials. Stem Cell Studies 2011, 1, 105–114. [Google Scholar]
- 5.Weinberg MD; Lau J; Rosenfield K; Olin J Peripheral Artery Disease. Part 2: Medical and Endovascular Treatment. Nat. Rev. Cardiol 2011, 8, 429–441. [DOI] [PubMed] [Google Scholar]
- 6.Bose RJC; Mattrey RF Accomplishments and Challenges in Stem Cell Imaging In vivo. Drug Discovery Today 2019, 24 (2), 492–504. [DOI] [PubMed] [Google Scholar]
- 7.Bulte JWM; Daldrup-Link HE Clinical Tracking of Cell Transfer and Cell Transplantation: Trials and Tribulations. Radiology 2018, 289, 604–615. [DOI] [PMC free article] [PubMed] [Google Scholar]
- 8.Park S; Greco V; Cockburn K Live Imaging of Stem Cells: Answering Old Questions and Raising New Ones. Curr. Opin. Cell Biol 2016, 43, 30–37. [DOI] [PMC free article] [PubMed] [Google Scholar]
- 9.Ricles LM; Hsieh P-L; Dana N; Rybalko V; Kraynak C; Farrar RP; Suggs LJ Therapeutic Assessment of Mesenchymal Stem Cells Delivered within a PEGylated Fibrin Gel Following an Ischemic Injury. Biomaterials 2016, 102, 9–19. [DOI] [PMC free article] [PubMed] [Google Scholar]
- 10.Sheikh AY; Wu JC Molecular Imaging of Cardiac Stem Cell Transplantation. Curr. Cardiol. Rep 2006, 8, 147–154. [DOI] [PubMed] [Google Scholar]
- 11.Zhou R; Acton PD; Ferrari VA Imaging Stem Cells Implanted in Infarcted Myocardium. J. Am. Coll. Cardiol 2006, 48, 2094–2106. [DOI] [PMC free article] [PubMed] [Google Scholar]
- 12.Zhang SJ; Wu JC Comparison of Imaging Techniques for Tracking Cardiac Stem Cell Therapy. J. Nucl. Med 2007, 48, 1916–1919. [DOI] [PMC free article] [PubMed] [Google Scholar]
- 13.Chehade M; Srivastava AK; Bulte JWM Co-Registration of Bioluminescence Tomography, Computed Tomography, and Magnetic Resonance Imaging for Multimodal In Vivo Stem Cell Tracking. Tomography 2016, 2, 158–165. [DOI] [PMC free article] [PubMed] [Google Scholar]
- 14.Wolfs E; Verfaillie CM; Van Laere K; Deroose CM Radiolabeling Strategies for Radionuclide Imaging of Stem Cells. Stem. Cell. Rev. Rep 2015, 11, 254–274. [DOI] [PubMed] [Google Scholar]
- 15.Khurana A; Chapelin F; Beck G; Lenkov OD; Donig J; Nejadnik H; Messing S; Derugin N; Chan RC-F; A. Iron Administration before Stem Cell Harvest Enables MR Imaging Tracking after Transplantation. Radiology 2013, 269, 186–197. [DOI] [PMC free article] [PubMed] [Google Scholar]
- 16.Modo M; Cash D; Mellodew K; Williams SCR; Fraser SE; Meade TJ; Price J; Hodges H Tracking Transplanted Stem Cell Migration Using Bifunctional, Contrast Agent-Enhanced. Magnetic Resonance Imaging. NeuroImage 2002, 17, 803–811. [PubMed] [Google Scholar]
- 17.Modo M; Mellodew K; Cash D; Fraser SE; Meade TJ; Price J; Williams SCR Mapping Transplanted Stem Cell Migration after a Stroke: A Serial, In Vivo Magnetic Resonance Imaging Study. NeuroImage 2004, 21, 311–317. [DOI] [PubMed] [Google Scholar]
- 18.Nam SY; Ricles LM; Suggs LJ; Emelianov SY In Vivo Ultrasound and Photoacoustic Monitoring of Mesenchymal Stem Cells Labeled with Gold Nanotracers. PLoS One 2012, 7, e37267. [DOI] [PMC free article] [PubMed] [Google Scholar]
- 19.Ricles LM; Nam SY; Treviño EA; Emelianov SY; Suggs LJ A Dual Gold Nanoparticle System for Mesenchymal Stem Cell Tracking. J. Mater. Chem. B 2014, 2, 8220–8230. [DOI] [PMC free article] [PubMed] [Google Scholar]
- 20.Emelianov SY; Li P-C; O’Donnell M Photoacoustics for Molecular Imaging and Therapy. Phys. Today 2009, 62, 34–39. [DOI] [PMC free article] [PubMed] [Google Scholar]
- 21.Vo-Dinh T Biomedical Photonics Handbook: Biomedical Diagnostics; CRC Press, Boca Rotan, FL, 2014. [Google Scholar]
- 22.Xu M; Wang LV Photoacoustic Imaging in Biomedicine. Rev. Sci Instrum 2006, 77, 041101. [Google Scholar]
- 23.Jokerst JV; Thangaraj M; Kempen PJ; Sinclair R; Gambhir SS Photoacoustic Imaging of Mesenchymal Stem Cells in Living Mice via Silica-Coated Gold Nanorods. ACS Nano 2012, 6, 5920–5930. [DOI] [PMC free article] [PubMed] [Google Scholar]
- 24.Chung E; Nam SY; Ricles LM; Emelianov S; Suggs L Evaluation of Gold Nanotracers to Track Adipose-Derived Stem Cells in a PEGylated Fibrin Gel for Dermal Tissue Engineering Applications. Int. J. Nanomed 2013, 325–336. [DOI] [PMC free article] [PubMed] [Google Scholar]
- 25.Santiesteban DY; Kubelick K; Dhada KS; Dumani D; Suggs L; Emelianov S Monitoring/Imaging and Regenerative Agents for Enhancing Tissue Engineering Characterization and Therapies. Ann. Biomed. Eng 2016, 44, 750–772. [DOI] [PMC free article] [PubMed] [Google Scholar]
- 26.Gong H; Peng R; Liu Z Carbon Nanotubes for Biomedical Imaging: The Recent Advances. Adv. Drug Delivery Rev 2013, 65, 1951–1963. [DOI] [PubMed] [Google Scholar]
- 27.Wang C; Ma X; Ye S; Cheng L; Yang K; Guo L; Li C; Li Y; Liu Z Protamine Functionalized Single-Walled Carbon Nanotubes for Stem Cell Labeling and In Vivo Raman/Magnetic Resonance/Photoacoustic Triple-Modal Imaging. Adv. Funct. Mater 2012, 22, 2363–2375. [Google Scholar]
- 28.Xie L; Wang G; Zhou H; Zhang F; Guo Z; Liu C; Zhang X; Zhu L Functional Long Circulating Single Walled Carbon Nanotubes for Fluorescent/Photoacoustic Imaging-Guided Enhanced Phototherapy. Biomaterials 2016, 103, 219–228. [DOI] [PubMed] [Google Scholar]
- 29.Kim T; Lemaster JE; Chen F; Li J; Jokerst JV Photoacoustic Imaging of Human Mesenchymal Stem Cells Labeled with Prussian Blue-Poly(L -Lysine) Nanocomplexes. ACS Nano 2017, 11, 9022–9032. [DOI] [PMC free article] [PubMed] [Google Scholar]
- 30.Ricles LM; Nam SY; Sokolov K; Emelianov SY; Suggs LJ Function of Mesenchymal Stem Cells Following Loading of Gold Nanotracers. Int. J. Nanomed 2011, 6, 407–416. [DOI] [PMC free article] [PubMed] [Google Scholar]
- 31.Comenge J; Sharkey J; Fragueiro O; Wilm B; Brust M; Murray P; Levy R; Plagge A Multimodal Cell Tracking from Systemic Administration to Tumour Growth by Combining Gold Nanorods and Reporter Genes. eLife 2018, 7, 1–22. [DOI] [PMC free article] [PubMed] [Google Scholar]
- 32.Zhao T; Zhang S; Guo Y; Wang Q Ratiometric Photoacoustic Nanoprobe for Monitoring and Imaging of Hydrogen Sulfide In Vivo. Nanoscale 2016, 8, 233–242. [DOI] [PubMed] [Google Scholar]
- 33.Reinhardt CJ; Zhou EY; Jorgensen MD; Partipilo G; Chan J A Ratiometric Acoustogenic Probe for In Vivo Imaging of Endogenous Nitric Oxide. J. Am. Chem. Soc 2018, 140, 1011–1018. [DOI] [PMC free article] [PubMed] [Google Scholar]
- 34.Zhou EY; Knox HJ; Reinhardt CJ; Partipilo G; Nilges MJ; Chan J Near-Infrared Photoactivatable Nitric Oxide Donors with Integrated Photoacoustic Monitoring. J. Am. Chem. Soc 2018, 140, 11686–11697. [DOI] [PMC free article] [PubMed] [Google Scholar]
- 35.Chen Q; Liu X; Zeng J; Cheng Z; Liu Z Albumin-NIR Dye Self-Assembled Nanoparticles for Photoacoustic PH Imaging and PH-Responsive Photothermal Therapy Effective for Large Tumors. Biomaterials 2016, 98, 23–30. [DOI] [PubMed] [Google Scholar]
- 36.Chen Q; Liu X; Chen J; Zeng J; Cheng Z; Liu Z A Self-Assembled Albumin-Based Nanoprobe for In Vivo Ratiometric Photoacoustic PH Imaging. Adv. Mater 2015, 27, 6820–6827. [DOI] [PubMed] [Google Scholar]
- 37.Guha S; Shaw GK; Mitcham TM; Bouchard RR; Smith BD Croconaine Rotaxane for Acid Activated Photothermal Heating and Ratiometric Photoacoustic Imaging of Acidic PH. Chem. Commun 2016, 52, 120–123. [DOI] [PMC free article] [PubMed] [Google Scholar]
- 38.Miao Q; Lyu Y; Ding D; Pu K Semiconducting Oligomer Nanoparticles as an Activatable Photoacoustic Probe with Amplified Brightness for In Vivo Imaging of PH. Adv. Mater 2016, 28, 3662–3668. [DOI] [PubMed] [Google Scholar]
- 39.Li H; Zhang P; Smaga LP; Hoffman RA; Chan J Photoacoustic Probes for Ratiometric Imaging of Copper(II). J. Am. Chem. Soc 2015, 137, 15628–15631. [DOI] [PubMed] [Google Scholar]
- 40.Liu Y; Su Q; Chen M; Dong Y; Shi Y; Feng W; Wu Z-Y; Li F Near-Infrared Upconversion Chemodosimeter for In Vivo Detection of Cu(2+) in Wilson Disease. Adv. Mater 2016, 28, 6625–6630. [DOI] [PubMed] [Google Scholar]
- 41.Sheikh A; Huber B; Narsinh K; Spin J; van der Bogt K; de Almeida P; Ransohoff K; Kraft D; Fajardo G; Ardigo D; Ranshoff J; Bernstein D; Fischbein M; Robbins R; Wu J In Vivo Functional and Transcriptional Profiling of Bone Marrow Stem Cells After Transplantation Into Ischemic Myocardium. Arterioscler. Thromb. Vasc. Biol 2012, 32, 92–102. [DOI] [PMC free article] [PubMed] [Google Scholar]
- 42.Müller-Ehmsen J; Whittaker P; Kloner RA; Dow JS; Sakoda T; Long TI; Laird PW; Kedes L Survival and Development of Neonatal Rat Cardiomyocytes Transplanted into Adult Myocardium. J. Mol. Cell. Cardiol 2002, 34, 107–116. [DOI] [PubMed] [Google Scholar]
- 43.Haider HK; Ashraf M Strategies to Promote Donor Cell Survival: Combining Preconditioning Approach with Stem Cell Transplantation. J. Mol. Cell. Cardiol 2008, 45, 554–566. [DOI] [PMC free article] [PubMed] [Google Scholar]
- 44.Yang F; Chen H; Liu Y; Yin K; Wang Y; Li X; Wang G; Wang S; Tan X; Xu C; Lu Y; Cai B Doxorubicin Caused Apoptosis of Mesenchymal Stem Cells via P38, JNK and P53 Pathway. Cell. Physiol. Biochem 2013, 32, 1072–1082. [DOI] [PubMed] [Google Scholar]
- 45.Hsuuw Y-D; Chang C-K; Chan W-H; Yu J-S Curcumin Prevents Methylglyoxal-Induced Oxidative Stress and Apoptosis in Mouse Embryonic Stem Cells and Blastocysts. J. Cell. Physiol 2005, 205, 379–386. [DOI] [PubMed] [Google Scholar]
- 46.Kim S-Y; Jeong H-C; Hong S-K; Lee M-O; Cho S-J; Cha H-J Quercetin Induced ROS Production Triggers Mitochondrial Cell Death of Human Embryonic Stem Cells. Oncotarget 2017, 8, 64964–64973. [DOI] [PMC free article] [PubMed] [Google Scholar]
- 47.Otsu K; Das S; Houser SD; Quadri SK; Bhattacharya S; Bhattacharya J Concentration-Dependent Inhibition of Angiogenesis by Mesenchymal Stem Cells. Blood 2009, 113, 4197–4205. [DOI] [PMC free article] [PubMed] [Google Scholar]
- 48.Oushiki D; Kojima H; Terai T; Arita M; Hanaoka K; Urano Y; Nagano T Development and Application of a Near-Infrared Fluorescence Probe for Oxidative Stress Based on Differential Reactivity of Linked Cyanine Dyes. J. Am. Chem. Soc 2010, 132, 2795–2801. [DOI] [PubMed] [Google Scholar]
- 49.Pu K; Shuhendler AJ; Jokerst JV; Mei J; Gambhir SS; Bao Z; Rao J Semiconducting Polymer Nanoparticles as Photoacoustic Molecular Imaging Probes in Living Mice. Nat. Nanotechnol 2014, 9, 233–239. [DOI] [PMC free article] [PubMed] [Google Scholar]
- 50.Pu K; Shuhendler AJ; Rao J Semiconducting Polymer Nanoprobe for In Vivo Imaging of Reactive Oxygen and Nitrogen Species. Angew. Chem. Int. Ed 2013, 52, 10325–10329. [DOI] [PMC free article] [PubMed] [Google Scholar]
- 51.Stöber W; Fink A; Bohn E Controlled Growth of Monodisperse Silica Spheres in the Micron Size Range. J. Colloid Interface Sci 1968, 26, 62–69. [Google Scholar]
- 52.Chen Y-S; Frey W; Kim S; Kruizinga P; Homan K; Emelianov S Silica-Coated Gold Nanorods as Photoacoustic Signal Nanoamplifiers. Nano Lett. 2011, 11, 348–354. [DOI] [PMC free article] [PubMed] [Google Scholar]
- 53.Lee SK; Mortensen LJ; Lin CP; Tung C-H An Authentic Imaging Probe to Track Cell Fate from Beginning to End. Nat. Commun 2014, 5, 1–8. [DOI] [PMC free article] [PubMed] [Google Scholar]
- 54.Weber J; Beard PC; Bohndiek SE Contrast Agents for Molecular Photoacoustic Imaging. Nat. Methods 2016, 13, 639–650. [DOI] [PubMed] [Google Scholar]
- 55.Lawall H; Bramlage P; Amann B Treatment of Peripheral Arterial Disease Using Stem and Progenitor Cell Therapy. J. Vasc. Surgery 2011, 53, 445–453. [DOI] [PubMed] [Google Scholar]
- 56.Moon MH; Kim SY; Kim YJ; Kim SJ; Lee JB; Bae YC; Sung SM; Jung JS Human Adipose Tissue-Derived Mesenchymal Stem Cells Improve Postnatal Neovascularization in a Mouse Model of Hindlimb Ischemia. Cell. Physiol. Biochem 2006, 17, 279–290. [DOI] [PubMed] [Google Scholar]
- 57.Comenge J; Fragueiro O; Sharkey J; Taylor A; Held M; Burton NC; Park BK; Wilm B; Murray P; Brust M; Levy R Preventing Plasmon Coupling between Gold Nanorods Improves the Sensitivity of Photoacoustic Detection of Labeled Stem Cells In Vivo. ACS Nano 2016, 10, 7106–7116. [DOI] [PubMed] [Google Scholar]
- 58.Chung E; Rytlewski JA; Merchant AG; Dhada KS; Lewis EW; Suggs LJ Fibrin-Based 3D Matrices Induce Angiogenic Behavior of Adipose-Derived Stem Cells. Acta Biomater. 2015, 17, 78–88. [DOI] [PMC free article] [PubMed] [Google Scholar]
- 59.Burdick JA; Mauck RL; Gerecht S To Serve and Protect: Hydrogels to Improve Stem Cell-Based Therapies. Cell Stem Cell 2016, 18, 13–15. [DOI] [PubMed] [Google Scholar]
- 60.Wagner J; Kean T; Young R; Dennis JE; Caplan AI Optimizing Mesenchymal Stem Cell-Based Therapeutics. Curr. Opin. Biotechnol 2009, 20, 531–536. [DOI] [PubMed] [Google Scholar]
- 61.Zhang S; Sun A; Xu D; Yao K; Huang Z; Jin H; Wang K; Zou Y; Ge J Impact of Timing on Efficacy and Safetyof Intracoronary Autologous Bone Marrow Stem Cells Transplantation in Acute Myocardial Infarction: A Pooled Subgroup Analysis of Randomized Controlled Trials. Clin. Cardiol 2009, 32, 458–466. [DOI] [PMC free article] [PubMed] [Google Scholar]
- 62.Bartunek J; Wijns W; Heyndrickx GR; Vanderheyden M Timing of Intracoronary Bone-Marrow-Derived Stem Cell Transplantation after ST-Elevation Myocardial Infarction. Nat. Clin. Pract. Cardiovasc. Med 2006, 3, S52–S56. [DOI] [PubMed] [Google Scholar]
- 63.Segers VFM; Lee RT Stem-Cell Therapy for Cardiac Disease. Nature 2008, 451, 937–942. [DOI] [PubMed] [Google Scholar]
- 64.Nikoobakht B; El-Sayed MA Preparation and Growth Mechanism of Gold Nanorods (NRs) Using Seed-Mediated Growth Method. Chem. Mater 2003, 15, 1957–1962. [Google Scholar]
Associated Data
This section collects any data citations, data availability statements, or supplementary materials included in this article.


