

Abstract
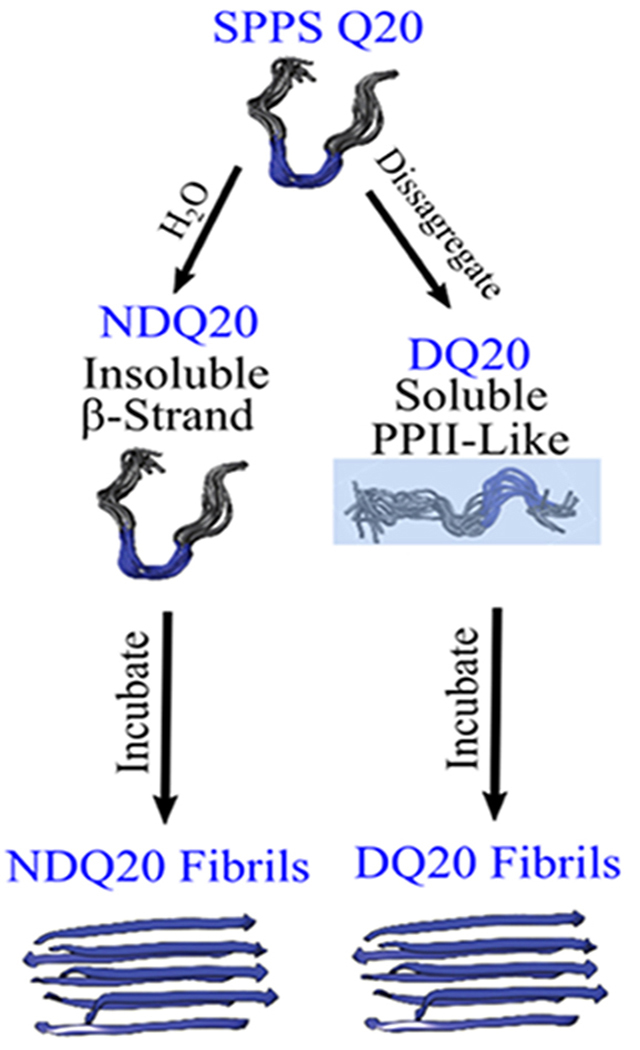
Fibrillization of polyglutamine (polyQ) tracts in proteins is implicated in at least 10 neurodegenerative diseases. This generates great interest in the structure and the aggregation mechanism(s) of polyQ peptides. The fibrillization of polyQ is thought to result from the peptide’s insolubility in aqueous solutions; longer polyQ tracts show decreased aqueous solution solubility, which is thought to lead to faster fibrillization kinetics. However, few studies have characterized the structure(s) of polyQ peptides with low solubility. In the work here, we use UV resonance Raman spectroscopy to examine the secondary structures, backbone hydrogen bonding, and side chain hydrogen bonding for a variety of solution-state, solid, and fibril forms of D2Q20K2 (Q20). Q20 is insoluble in water and has a β-strand-like conformation with extensive inter- and intrapeptide hydrogen bonding in both dry and aqueous environments. We find that Q20 has weaker backbone—backbone and backbone—side chain hydrogen bonding and is less ordered compared to that of polyQ fibrils. Interestingly, we find that the insoluble Q20 will form fibrils when incubated in water at room temperature for ~5 h. Also, Q20 can be prepared using a well-known disaggregation procedure to produce a water-soluble PPII-like conformation with negligible inter- and intrapeptide hydrogen bonding and a resistance to aggregation.
Graphical Abstract
INTRODUCTION
Expanded polyglutamine (polyQ) tracts in proteins and peptides induce aggregation and fibrillization.1 This polyQ-induced fibrillization is associated with at least 10 neurodegenerative diseases, including Huntington’s disease (HD) and multiple spinocerebellar ataxias.1 The mechanism of toxicity and the identity of the toxic species are still debated.2–4 The common factor for polyQ-associated neurodegenerative diseases is the presence of an expanded polyQ tract.1
In polyQ repeat diseases, longer polyQ tracts are correlated with an earlier disease symptom age-of-onset.5 Disease symptoms are only observed when the protein polyQ tract length surpasses a critical length (~≥36Q for the huntingtin protein in HD).1 This polyQ tract length dependence of disease age-of-onset is thought to result from a length-induced increase in the polyQ aggregation kinetics.6–8
This possibility was strengthened when Chen et al. showed that polyQ peptides with longer polyQ tracts have faster aggregation kinetics.6 Also, Chen et al. used aggregation rates calculated from polyQ peptides at high concentrations (~5—50 μM) to extrapolate aggregation rates for polyQ peptides at physiological concentrations (~0.1 nM).6 In these calculations, Q47 at physiological concentrations was calculated to aggregate in ~31 years. This aggregation rate is quite similar to the HD age-of-onset (30—40 years) for patients with a Q47 tract length in the huntingtin protein. Also, Q36 and Q28 lengths were calculated to begin aggregating in 141 and 1273 years, respectively, at physiological concentrations. These putative ages of disease onset roughly agree with the age of onset for polyQ tracts with <36Q residues in the huntingtin protein that do not produce HD symptoms within a patient’s lifetime. Because of the associations between polyQ tract length, aggregation kinetics, and disease age-of-onset, there is much interest in understanding the aggregation mechanism(s) of polyQ peptides of different lengths. Unfortunately, these studies of polyQ peptides are limited by the accompanying low solubility of these polyQ peptides in water.
For example, polyQ peptides with ~≥20 Q residues generally show low water solubility. To study the polyQ solution-state structure and fibrillization kinetics of long polyQ peptides, Chen et al. developed a “disaggregation” procedure that increases polyQ peptide solubility.9 Their solubilization procedure is referred to as disaggregation because it is thought to remove trace aggregate oligomers that are believed to seed fibrillization.10 Unfortunately, the exact mechanism by which this disaggregation protocol solubilizes polyQ peptide monomers is poorly understood. Because of the low solubility of long polyQ peptides, most studies use polyQ peptide solutions that are disaggregated before study.
Recently, Punihaole et al.11 used UV resonance Raman (UVRR) spectroscopy and metadynamics simulations to examine the solution-state structure of the small polyQ peptide D2Q10K2 (Q10) in its disaggregated (DQ10) and non-disaggregated (NDQ10) forms. They found that aqueous NDQ10 has a collapsed β-strand-like conformation with significant intrapeptide hydrogen bonding. In contrast, DQ10 has a polyproline II (PPII)-like conformation with negligible inter- and intrapeptide hydrogen bonding. They showed that the β-strand-like (NDQ10) and the PPII-like (DQ10) structures are both predominantly monomeric with large activation energy barriers between them that prevent interconversion between these solution-state monomeric structures. They also showed that NDQ10 and DQ10 are both soluble in water at concentrations of up to 1 mg/mL.
Computational12,13 and experimental14,15 studies have shown that longer polyQ peptides increasingly possess peptide–peptide hydrogen bonding. Studies showed that water is a good solvent for Q < 16, a theta solvent for Q = ~16 and a poor solvent for Q > 16.14–16 Apparently, the increasing favorability of interpeptide interactions for longer polyQ peptides results in decreased aqueous solubilities that are thought to drive the formation of peptide aggregates and fibrils.14,16 The peptide–peptide interactions of dilute polyQ solutions in poor solvents are satisfied via intrapeptide hydrogen bonds that give rise to compact collapsed structures.12,14,16 In contrast, more concentrated polyQ solutions will form interpeptide interactions that result in polyQ peptide aggregation.12,14,16 The low solubility of longer polyQ peptides is thought to promote their aggregation.12,14 However, little is known about the structures and fibrillization of polyQ peptides with low aqueous solubility.
Here, we use UVRR spectroscopy to examine the structures of D2Q20K2 (Q20). We find that non-disaggregated Q20 (NDQ20) is insoluble in water. In this work, we describe a polyQ peptide as insoluble if the peptide forms a pellet upon centrifugation (21 130g for 30 min).
Figure 1 summarizes the structures of Q20 observed in this study. Q20 was synthesized by Thermo Fisher Scientific using Fmoc-based solid-phase peptide synthesis (SPPS) (Figure 1a). The peptide was purified in 0.05% trifluoroacetic acid (TFA) using reverse-phase high-pressure liquid chromatography (HPLC) (Figure 1b). The purified peptide was then lyophilized, yielding the solid-phase peptide synthesis Q20 (SPPS Q20) species, which occurs in the form of a white powder (Figure 1c). For all experimental work, SPPS Q20 is considered to be the initial state of the peptide. Using UVRR, we find that SPPS Q20 is in a β-strand-like conformation (Figure 1c).
Figure 1.
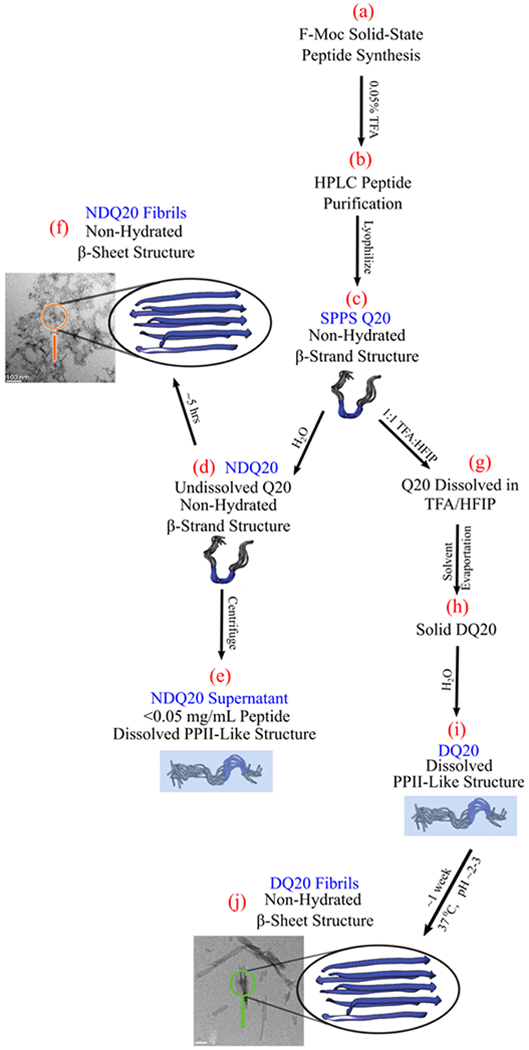
Summary of the forms of Q20 examined here. Each letter (a–j) indicates a form of the Q20 peptide. The blue text indicates the nomenclature for this particular form of Q20. The peptide models shown are from simulations previously calculated for Q10 by Punihaole et al.11,17 They depict the peptide structure of each state examined. The structures shaded in blue are found to have the backbone and Gln side chain primary amides hydrogen-bonded to water, while structures not shaded in blue have amide groups that are not hydrogen-bonded to water. These structures are discussed in detail within the text. PolyQ structural models were adapted with permission from Punihaole, D. et al. (2017). J. Phys. Chem. B, 121(24), 5953–5967. Copyright 2017 American Chemical Society.
SPPS Q20 added to water does not form a clear solution at 0.3 mg/mL. This state of Q20 is designated as non-disaggregated Q20 (NDQ20) because it was not disaggregated before being added to water (Figure 1d). We find that the secondary structure of NDQ20 is similar to that of the SPPS Q20. Despite the low water solubility of NDQ20, we find that NDQ20 forms β-sheet fibrils (Figure 1f) when incubated in water at room temperature.
We also prepared aqueous Q20 using the disaggregation protocol described in the Materials and Methods section. SPPS Q20 will dissolve in a 1:1 mixture of TFA and hexafluor-oisopropanol (HFIP) to form a clear solution (Figure 1g). The TFA/HFIP solvent can then be evaporated, and the resulting disaggregated Q20 (DQ20) peptide (Figure 1h) dissolves in water (Figure 1i). Using UVRR spectroscopy, we find that the DQ20 peptide has a PPII-like secondary structure with backbone and side chain amide groups hydrogen-bonded to water. DQ20 forms fibrils when incubated at 37 °C and neutral pH for ~1 week (Figure 1j).
Finally, we find that after ultracentrifugation of NDQ20, a small amount of peptide remains in the supernatant (Figure 1e). The peptide in the NDQ20 supernatant has a PPII-like structure similar to that of the highly soluble DQ20.
MATERIALS AND METHODS
Materials.
D2Q15K2 (Q15) (≥98% purity), D2Q20K2 (Q20) (≥98% purity), and TFA (≥99.5% purity) were purchased from Thermo Fisher Scientific. 1,1,1,3,3,3-Hexa-fluoro-2-propanol (HFIP) (~99% purity) was purchased from Acros Organics.
Peptide Synthesis.
Q15 and Q20 were synthesized by Thermo Fisher Scientific using Fmoc-based SPPS. The final peptide was cleaved from the solid support using TFA. The peptide was purified in 0.05% TFA using reverse-phase HPLC. The purified peptide was lyophilized to produce SPPS Q20 (Figure 1c).
Sample Preparation.
NDQ20 (Figure 1d) was prepared by adding the SPPS Q20, as received from Thermo Fisher Scientific, to nanopure water. Samples were prepared in sterilized centrifuge tubes to prevent impurities from seeding aggregation.
The NDQ20 supernatant (Figure 1e) was made by first preparing NDQ20 at 1 mg/mL. The mixture was vortexed for ~5 min to dissolve any soluble peptide. After vortexing, the sample remained turbid. The sample was centrifuged for 30 min at 21 130g and then for 30 min at 355 524g. The top ~50% of the supernatant was used for UV absorbance and UVRR measurements.
DQ20 (Figure 1i) was prepared by using the disaggregation procedure developed by Chen et al.9 To disaggregate polyQ the peptide was incubated in a 1:1 TFA and HFIP mixture for ~2—4 h (Figure 1g). The solvent was then evaporated with a stream of dry nitrogen gas (Figure 1h). The peptide was then dissolved in water to a concentration of 0.3 mg/mL.
TFA samples at pH = ~+0.5 were prepared by adding 10% (v/v) TFA to nanopure water. TFA samples (10% (v/v)) in acidic conditions, pH = ~−1.5, were prepared by adding TFA to concentrated hydrochloric acid. TFA in basic conditions was prepared by adding a known volume of 10 M NaOH to a 10% (v/v) TFA solution to a final pH of ~12. The internal UVRR intensity standard sodium perchlorate (NaClO4) was added to TFA samples and to the NDQ20 supernatant by adding a known volume of 5 M NaClO4 to the sample.
Absorbance Measurements.
Absorbance measurements used a Cary 5000 UV—vis—NIR spectrophotometer (Varian, Inc.) with a 0.02 cm pathlength, fused silica cylindrical cuvette.
UVRR Instrumentation.
The UVRR instrumentation was described in detail by Bykov et al.18 Briefly, the third harmonic of an infinity Nd:YAG laser (Coherent) was Raman-shifted (30 psi, H2) to 204 nm (the 5th anti-Stokes line of hydrogen). The Raman-scattered light was dispersed using a double monochromator in a subtractive configuration.18 The spectrum was imaged using a liquid nitrogen-cooled CCD camera with a Lumagen E coating (Spec10:400B, Princeton Instruments). The samples were placed in a Suprasil fused silica NMR tube that was spun during the measurement to reduce sample photodegradation. A ~165° backscattering geometry was used to collect the Raman scattering.
Transmission Electron Microscopy.
Transmission electron microscopy (TEM) images of DQ20 and NDQ20 fibrils were collected using a Morgagni 268(D) electron microscope (FEI) at 89 000× and 140 000× magnification, respectively, using an electron accelerating voltage of 80 kV. Images were recorded on a 10-megapixel ORCA camera (Hamamatsu). EM sample grids were prepared by incubating 3 μL of DQ20 or NDQ20 fibrils on carbon-coated copper EM grids for ~3 min, and the excess solution was removed by blotting with filter paper. The grid was then stained with 3 μL of 2% (w/v) uranyl acetate solution for ~45 s before blotting.
UVRR Methods.
UVRR excitation at ~204 nm is in resonance with the π → π* electronic transitions of amide groups, which include the secondary amide peptide bond and primary amide glutamine (Gln) side chains.19 This selectively enhances vibrational motions that couple to these electronic transitions. Thus, our UVRR spectra of polyQ peptides are dominated by vibrations localized on the backbone peptide bonds and the Gln side chain amide groups. This greatly simplifies the Raman spectra. UVRR spectra are sensitive to the structure and solvation states of the peptide.20
Band Reports on the Backbone Ramachandran Ψ Angle.
The peptide backbone amide III3 band () frequency was shown to be sinusoidally correlated with the peptide backbone Ramachandran Ψ angle.21,22 Mikhonin et al. developed a method to calculate the Ψ angle from an experimentally measured frequency for a peptide backbone in different solvation states and temperatures.22 Asher et al. then showed that we can estimate the distribution of Ψ angles in a peptide by modeling the inhomogenously broadened band as a sum of Lorentzian bands that approximate the homogenously broadened bands.23 These methodologies have been extensively used to examine the secondary structure of peptides.11,17,19,20,24–28 A detailed discussion of the equations used to calculate the Ψ angle distributions in this work can be found in the Supporting Information.
AmI Bands Report on the Hydrogen Bonding and Dielectric Environment of the Amide Carbonyls.
The amide I (AmI) bands of the secondary amide peptide backbone (AmIS) and the primary amide Gln side chains (AmIP) predominantly involve C=O stretching. The AmI band frequency and intensity are sensitive to the dielectric constant and the hydrogen bonding of the amide carbonyl groups.29–35 This makes the AmI band a spectral marker for examining the water exposure and hydrogen bonding of amide groups.20,30 An environment with a large dielectric constant, such as water, increases the contribution of the amide dipolar resonance structure (−O–C=NH+) compared to that of the less-polar resonance structure (O=C–NH). This decreases the C=O bond force constant and the AmI frequency.29,32 Also, stronger hydrogen bonding to the C=O bond decreases its bond force constant downshifting the AmI band frequency29,30,34.
The dielectric constant and the hydrogen bonding of the amide group also affect the AmI band UVRR intensities. In general, the deep UVRR enhancement of the AmI band of primary and secondary amides decreases with an increasing dielectric constant and/or increased hydrogen bonding to the amide C=O group.29,32 This occurs because resonance enhancement depends on the Frank–Condon overlap between the amide ground and resonant excited states. The resonance enhancement of the AmI vibration scales with the square of the displacement between the equilibrium C=O bond ground electronic state and the ππ*excited state along the AmI vibrational normal coordinate.36 The C=O bond in the ππ*excited state is typically elongated compared to that in the ground state.37,38 Thus, elongation of the C=O bond in a strong hydrogen bonding and/or high dielectric environment decreases the C=O bond displacement between the ππ* ground and excited state resulting in decreased UVRR enhancement.29,32
However, changes in the effective dielectric constant and hydrogen bonding also affect the amide ππ* excited-state geometry.29,31,35,38 Thus, a complete understanding of the dependence of the AmI UVRR intensity on the environment requires knowledge on how the dielectric constant and hydrogen bonding of the amide group affects the C=O bond length of both the ground and ππ* excited state.38 Table 1 summarizes the effects of changes in the dielectric environment and hydrogen bonding of the amide group on the AmI band intensity and frequency.
Table 1.
Effects of Dielectric Constant (ε) and C=O Hydrogen Bonding on the Frequency and Intensity of the AmI UVRR Band
| ε increase | ε decrease | H-bond strength increase | H-bond strength decrease | |
|---|---|---|---|---|
| Δ intensity | decrease | increase | decrease | increase |
| Δ frequency | decrease | increase | decrease | increase |
UVRR Band Assignments of PolyQ Peptides.
The UVRR spectra of solution-state11 and fibril-state17 Q10 were previously assigned in detail. The UVRR spectra of Q20 measured here are similar to those previously measured for Q10. Here, we briefly discuss the assignments of the conformationally sensitive UVRR bands. Please refer to our work on Q10 fibrils17 and on Q10 in solution11 for details.
Band Assignments.
The band is found in the ~1200–1300 cm−1 spectral region. As discussed above, this band is sensitive to the Ψ Ramachandran angle of the peptide backbone. Punihaole et al.11 previously found that DQ10 has peaks at ~1275, ~1250, and ~1215 cm−1 that derive from Ψ angle populations centered at ~175°, ~150°, and ~10°, respectively. The ~150° Ψ angle distribution is characteristic of PPII-like secondary structures, while Ψ angle populations at 10° and 175° are characteristic of turn-like and 2.51-helix-like structures, respectively. From the UVRR data along with metadynamics simulations, Punihaole et al. concluded that DQ10 contains short PPII-like helices separated by turn regions.11 The 2.51-helix-like conformation was found to be localized within the charged aspartic acid (Asp) and lysine (Lys) residues at the peptide N- and C-termini, respectively.
In contrast, NDQ10 has a single Raman band at ~1240 cm−1. This corresponds to a Ψ angle distribution centered at ~140°, which is characteristic of a β-strand-like conformation. From the band as well as metadynamics simulations, Punihaole et al. concluded that NDQ10 occurs in a collapsed β-strand-like conformation.11 A list of band frequencies and secondary structure assignments for DQ10 and NDQ10 is shown in Table 2.
Table 2.
Band Assignments and Structures for NDQ10 and DQ10
AmI Band Assignments.
The AmIS and AmIP bands are both found in the ~1650–1700 cm−1 spectral region and spectrally overlap. Xiong et al.24 showed that the AmIP and AmIS bands can be separately highlighted in the UVRR spectrum by collecting UVRR spectra at two different excitations wavelengths: 197 and 204 nm. Because the ππ* transition of primary amides is at higher energy than secondary amides, excitation deeper in the UV (197 nm) increases the resonance enhancement of the AmIP band relative to the AmIS band. By subtracting the 204 nm UVRR spectrum from that of 197 nm excitation (197–204 nm), we highlight the primary amide vibrations, including the AmIP band. In addition, we can highlight the secondary amide vibrations, such as the AmIS band, by subtracting the 197–204 nm difference spectrum from the 204 nm spectrum (204–(197–204) nm).
Punihaole et al. previously examined the AmIP and AmIS bands of NDQ10 and DQ10 peptides in their solution-11 and fibril-state17 conformations. The AmIP bands of Gln side chains hydrogen-bonded to water have low UVRR intensities and are broad, with center frequencies of ~1680 cm−1. A low AmI UVRR intensity and a frequency of ~1680 cm−1 were previously observed for the AmIP band of aqueous Gln39 as well as for the water hydrogen-bonded amides of Gln side chains of aqueous polyQ peptides.11 Similarly, the AmIS band of water hydrogen-bonded secondary amides has a low UVRR intensity and a frequency of ~1700 cm−1.34
Gln side chain and peptide backbone amide groups involved in peptide–peptide hydrogen bonding will be partially shielded from water. Thus, they will experience an environment with stronger hydrogen bonding and a lower dielectric constant compared to that of fully water exposed amide groups. For Gln side chain and peptide backbone amides involved in peptide–peptide hydrogen bonding, we experimentally observe intense AmIP and AmIS bands located at ~1660 cm−1. This was previously observed for the AmIP bands of Q10 in the solution-state11 and in Q10 fibrils17 as well as for the AmIS bands of Q10 fibrils.30
Wang et al.34 showed that the frequency of the AmIS band of the peptide backbone is correlated with the enthalpy of interaction (ΔHint) between the backbone amide C=O groups and their environment. The ΔHint is dominated by strong interactions such as hydrogen bonds.40 This allows for the calculation of the strength of a hydrogen bond between the backbone C=O groups and a hydrogen bond donor.30,34 Punihaole et al.30 later expanded this technique to examine the ΔHint of Gln side chain C=O groups with their environment. They derived the following equation to estimate the interaction enthalpy of the Gln side chain:
| (1) |
Using eq 1, Punihaole et al.30 estimated the strengths of Gln side chain hydrogen bonding in solution-state polyQ peptides and backbone and side chain hydrogen bonding in polyQ fibrils. They found that in both solution and fibril-state polyQ, side chain–side chain and side chain–backbone (~−5.9 kcal/mol) hydrogen bonding interactions are stronger than that of side chain–water (~−4.3 kcal/mol), backbone–water (~−4.3 kcal/mol), and backbone–backbone (~−3.8 kcal/mol) hydrogen bonding.30
It is important to note that calculating ΔHint from an AmI frequency assumes that the AmI frequency is only dependent on ΔHint. However, the AmIS frequency of the peptide backbone is also strongly dependent on the peptide secondary structure.41 This occurs predominantly through changes in the transition dipole coupling (TDC) of adjacent AmIS oscillators.41 As a result, the determination of peptide backbone ΔHint is confounded by TDC. In contrast, TDC is weak and can be neglected for Gln side chain AmIS oscillators because of the larger distances and decreased order between adjacent oscillators.30 Punihaole et al. demonstrated this by showing that, in polyQ fibrils, the AmIS band is split due to TDC while the AmIP band consists of a single narrow peak that indicates negligible coupling.30
From the AmI frequency, we can determine if the Gln side chain and backbone amide C=O groups are hydrogen-bonded to water or peptide. However, the AmIP and AmIS bands have the same frequency (~1660 cm−1) for C=O hydrogen bonding to backbone NH and Gln side chain NH hydrogen bond acceptors.17,30 Therefore, we cannot differentiate between backbone–side chain and backbone–backbone hydrogen bonding as well as side chain–backbone and side chain–side chain hydrogen bonding. In this paper, side chain–peptide (backbone–peptide) hydrogen bonding denotes that a side chain (backbone) carbonyl hydrogen bond acceptor is hydrogen-bonded to either a side chain or backbone hydrogen bond donor. Table 3 summarizes the AmI band frequencies, intensities, and interaction enthalpies for polyQ peptide amide groups involved in different hydrogen bonding interactions.
Table 3.
Characteristic AmI Frequencies and UVRR Intensities for Side Chain and Backbone Amide Groups Involved in Peptide–Peptide or Peptide–Water Hydrogen Bondinga
| hydrogen bonding interaction | AmI freq. (cm−1) | relative AmI UVRR intensity | interaction enthalpy (kcal/mol) | sample(s) |
|---|---|---|---|---|
| sidechain C=O–water | ~1680 (AmIP) | weak | ~−4.330 | DQ10,11,30 NDQ10,11,30 Gln39 |
| sidechain C=O–backbone NH | ~1660 (AmIP) | strong | ~−5.930 | NDQ1011,30 |
| sidechain C=O–sidechain NH | ~1660 (AmIP) | strong | ~−5.930 | NDQ10,11,30 NDQ10 fibrils,17,30 DQ10 fibrils17,30 |
| backbone C=O–water | ~1700 (AmIS) | weak | ~−4.334 | NAcA3ME34 |
| backbone C=O–backbone NH | ~1660 (AmIS) | strong | ~−3.830 | NDQ10 fibrils,17,30 DQ10 fibrils17,30 |
NAcA3ME, N-aceyletrialanine methyl ester.
RESULTS AND DISCUSSION
Solubility of Q10, Q15, and Q20.
We qualitatively examined the solubility of DQ15, NDQ15, DQ20, and NDQ20 by adding these peptides to water, vortexing, and examining the sample for separation upon standing or centrifugation at 21 130g for 30 min. We find that NDQ15, DQ15, and DQ20 all form apparently clear, homogenous solutions in water, as observed by eye, at 1 mg/mL concentrations. They do not form pellets upon centrifugation. Additionally, Punihaole et al.11 previously showed that NDQ10 and DQ10 form clear solutions in water at 1 mg/mL concentrations, and they showed using diffusion-ordered NMR spectroscopy (DOSY) that these peptides are predominately monomeric. Also, using DOSY, we find that DQ15 and DQ20 diffuse at a rate consistent with a monomeric peptide (data not shown). A detailed description of the DQ15 and DQ20 DOSY data will be presented in a future publication.
In contrast, NDQ20 does not form a clear, homogenous solution in water at 1 mg/mL concentration (Figure 1d). NDQ20 begins separating within minutes upon standing and forms a large, easily observable pellet and a clear supernatant when centrifuged at 21 130g for 30 min.
UVRR Characterization of DQ20.
We used UVRR spectroscopy to investigate the secondary structure of DQ20 (Figure 1i). We find that the UVRR spectrum (Figure 2) and secondary structure (Figure 3) of DQ20 are similar to those previously reported for DQ10.11 DQ20 contains peaks at ~1215, ~1275, and ~1250 cm−1, which result from Ψ angle distributions characteristic of turn-like (Ψ = 10°), 2.51-helix-like (Ψ = 175°), and PPII-like (Ψ = 150°) secondary structures, respectively (Figure 3). From this we conclude that DQ20 has a predominantly PPII-like conformation interspersed with turn regions and with terminal residues in a 2.51-helix-like conformation, as previously found for DQ10.11
Figure 2.
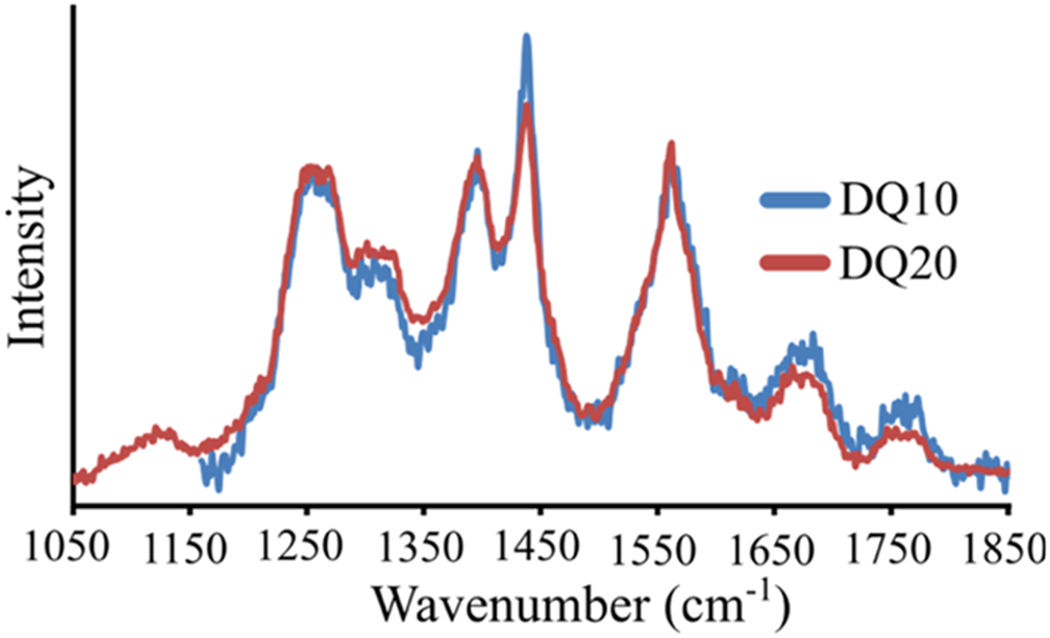
UVRR spectra of (blue) DQ10 and (red) DQ20. The DQ10 spectrum was previously measured by Punihaole et al.11 The DQ10 spectrum was adapted with permission from Punihaole, D. et al. (2017). J. Phys. Chem. B, 121(24), 5953–5967. Copyright 2017 American Chemical Society.
Figure 3.
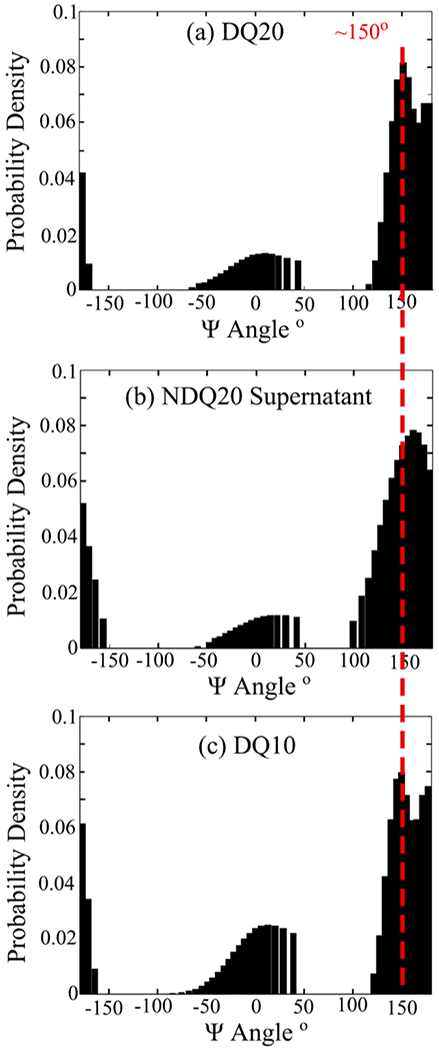
UVRR determined Ψ angle distributions of (a) DQ20, (b) NDQ20 supernatant, and (c) DQ10. The Ψ distribution for DQ10 was previously calculated by Punihaole et al.11 The DQ10 Ψ distribution was adapted with permission from Punihaole, D. et al. (2017). J. Phys. Chem. B, 121(24), 5953–5967. Copyright 2017 American Chemical Society.
DQ20 Contains Gln Side Chains Hydrogen-Bonded to Water.
DQ20 has overlapping AmIS and AmIP bands at ~1677 cm−1. To identify the frequency of the AmIP band, we examined the 197–204 nm difference spectrum of DQ20 (Figure 4a). We find that the AmIP band is located at ~1681 cm−1. Using eq 1, we estimate that the ΔHint is 4.1 kcal/mol, which is similar to the ΔHint between the Gln side chain and water.30 Our results show that DQ20 has Gln side chains that are hydrogen-bonded to water (Figure 1i).
Figure 4.
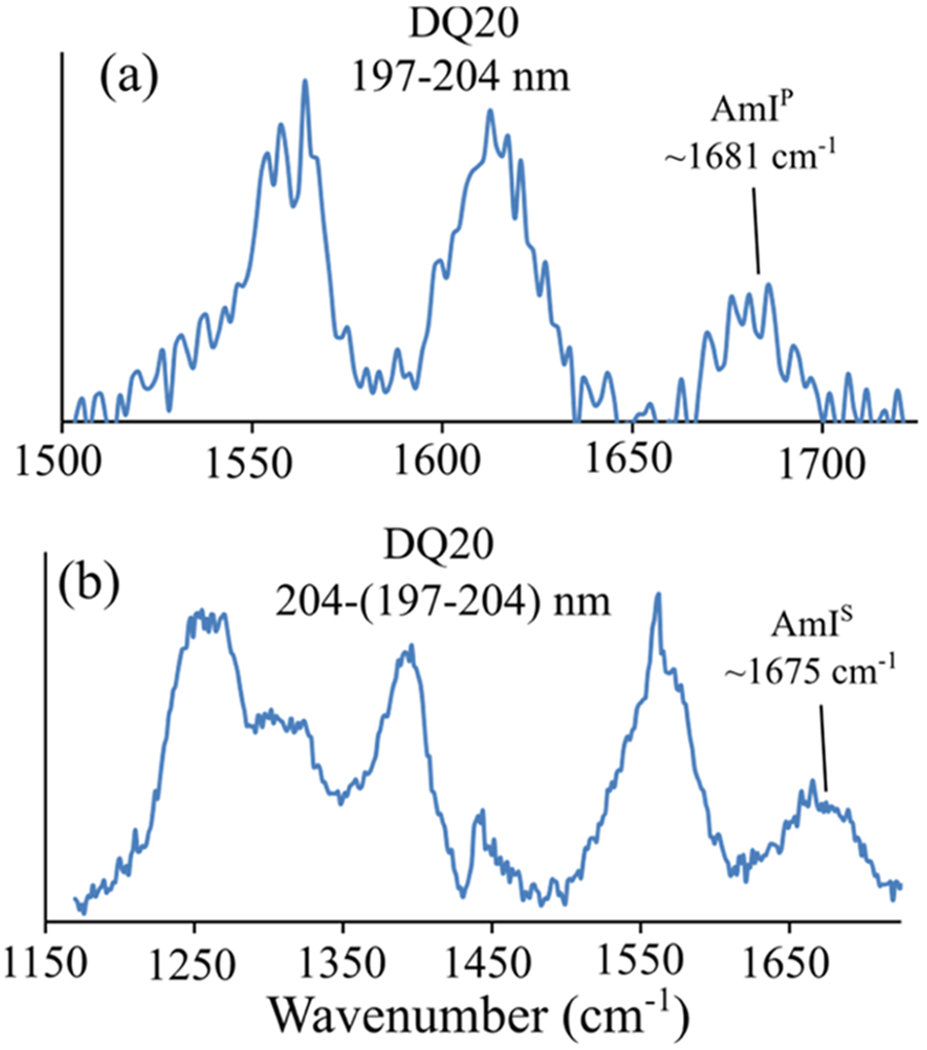
(a) 197–204 nm difference spectrum and (b) 204–(197–204) nm difference spectrum of DQ20. The AmIP band is located at ~1681 cm−1 and the AmIS band is located at ~1675 cm−1.
We also examined the 204–(197–204) nm difference spectrum of DQ20 to determine its AmIS frequency (Figure 4b). We find that DQ20 contains a broad AmIS band centered at ~1675 cm−1. Previously, Punihaole et al.30 observed the frequency of the AmIS band to be ~1660 cm−1 in β-sheet Q10 fibrils with strong backbone–backbone hydrogen bonding. As discussed above, weaker hydrogen bonding upshifts the AmI band frequency. Thus, the fact that the AmIS frequency of DQ20 is upshifted compared to that of fibrils suggests that the peptide backbone of DQ20 involves weaker hydrogen bonding than that of β-sheet fibrils. This is expected for PPII-like secondary structures that generally have water-exposed peptide backbones.
Fibrillization of DQ20.
At room temperature and low pH (pH = ~+2–3), the DQ20 monomers are stable for >>1 week. However, incubation of DQ20 at 37 °C and pH = ~+7 results in fibril formation in ~1 week (Figure 1j). The UVRR spectra of DQ20 fibrils are similar to those previously observed for DQ10 fibrils (Figure 5a).17 The and AmI bands of DQ10 and DQ20 fibrils are similar, indicating that their secondary structures and hydrogen bonding interactions are similar (Figure S4). The UVRR spectra of DQ20 fibrils show bands at ~1230 and ~1210 cm−1 that derive from Ψ angle distributions centered at ~145° and ~123°, respectively, (Figure 6a). As discussed previously by Punihaole et al., Ψ angle distributions centered at ~145° are characteristic of antiparallel β-sheet structures, while those centered at ~123° are characteristic of parallel β-sheet structures.
Figure 5.
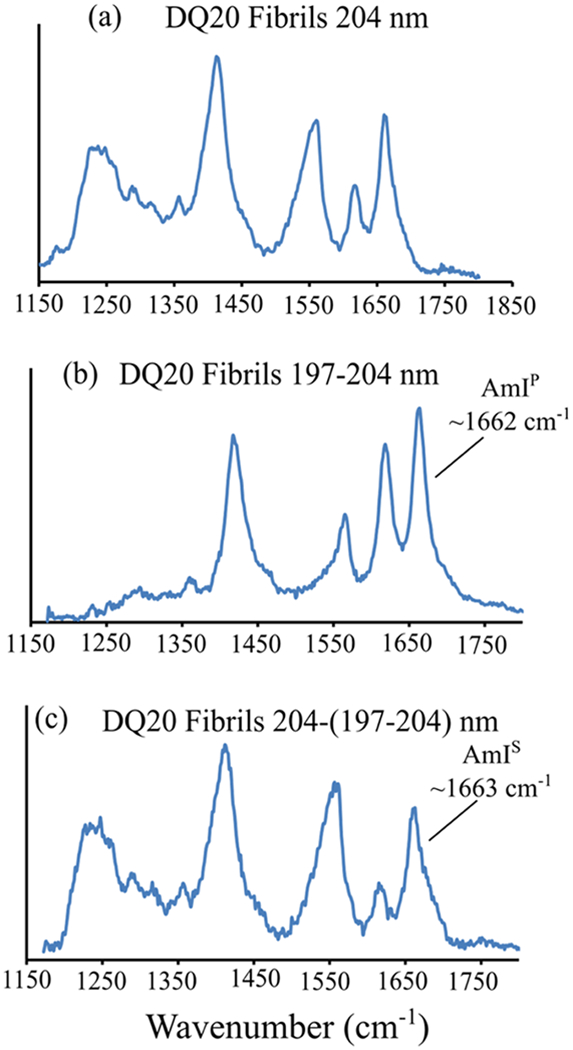
(a) 204, (b) 197–204, and (c) 204–(197–204) nm UVRR spectra of DQ20 fibrils.
Figure 6.
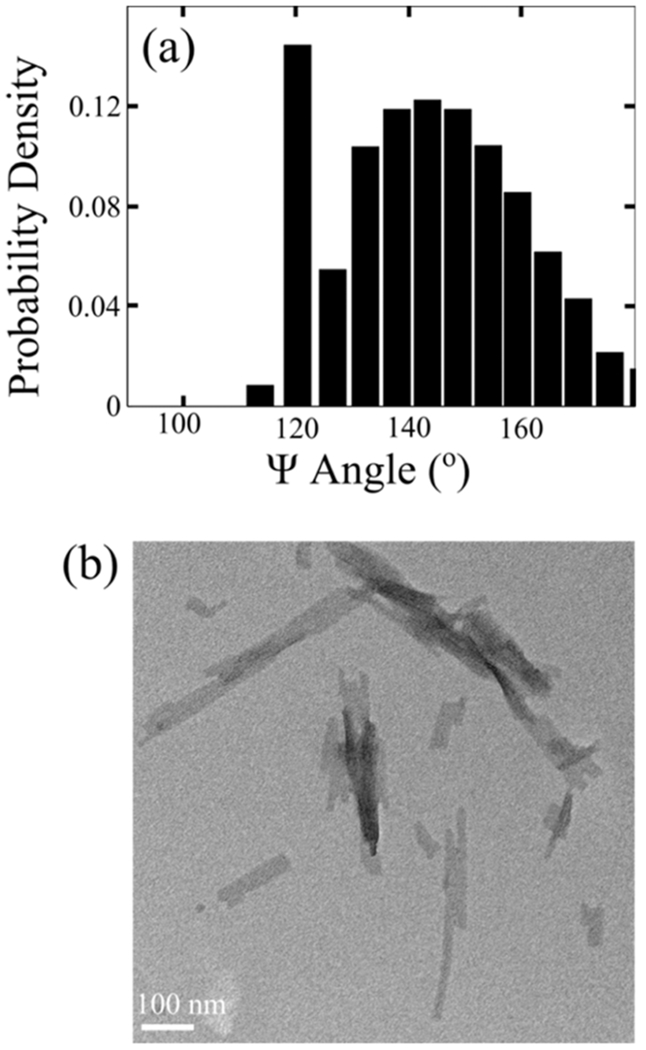
(a) Ψ angle distribution and (b) TEM image of DQ20 fibrils.
In the 197–204 nm difference spectrum, the AmIP band maximum of DQ20 fibrils occurs at ~1662 cm−1 (Figure 5b). As discussed above, this is characteristic of Gln side chain C=O groups involved in strong side chain–side chain and/or side chain–backbone hydrogen bonding. Using eq 1, we estimate that the ΔHint for Gln side chain C=O groups in DQ20 fibrils is ~−5.7 kcal/mol, similar to that previously found for DQ10 fibrils.30 Similarly, an AmIS band is observed in the 204–(197–204) nm difference spectrum (Figure 5c) of DQ20 fibrils at ~1663 cm−1 that is characteristic of backbone amides involved in β-sheet backbone–backbone hydrogen bonding as previously observed for Q10 fibrils.17,30 Overall, the AmIP and AmIS band frequencies show that both backbone and side chain amide C=O groups in DQ20 fibrils are involved in strong peptide–peptide hydrogen bonding.
Solubility of NDQ20.
As discussed above, NDQ20 does not form clear solutions in water (Figure 1d). We used UV absorbance to detect the presence of any soluble peptide in the supernatant after ultracentrifugation of NDQ20. We found that the NDQ20 supernatant contains significant absorbance; suggesting the presence of a soluble peptide (Figure 7). Using UV absorbance and UVRR spectroscopies, we calculate that the NDQ20 supernatant contains ~0.076 mg/ml of peptide. The supernatant peptide concentration calculations are discussed in detail below.
Figure 7.
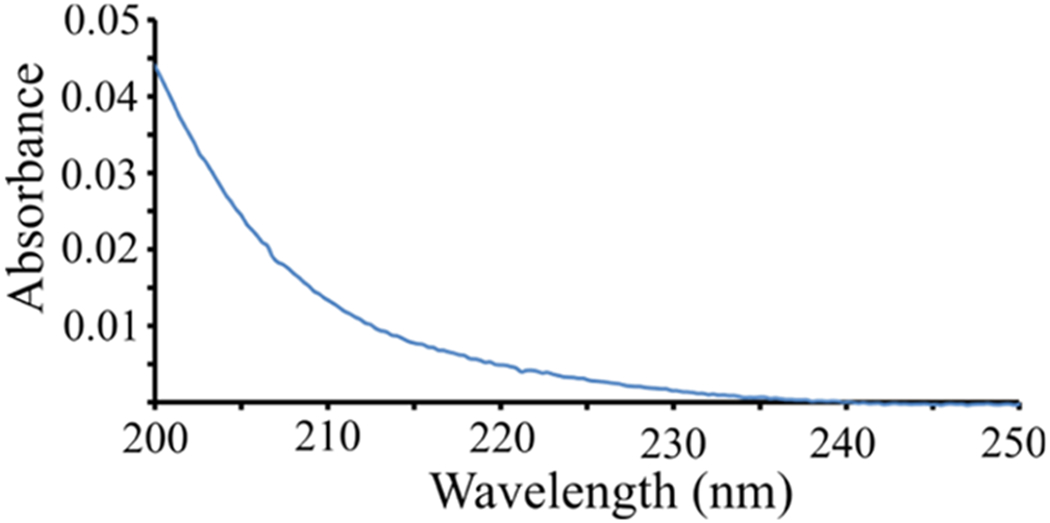
Absorption spectrum of the NDQ20 supernatant.
Soluble NDQ20 Supernatant Fraction Contains a PPII-like Peptide Conformation.
We used UVRR to examine the structure of the peptide in the NDQ20 supernatant (Figure 1e). The UVRR spectrum of the NDQ20 supernatant is similar to that of DQ20 (Figure 8). We observe bands at ~1250, ~1215, and ~1275 cm−1, which derive from Ψ angle distributions centered at ~150°, ~10°, and ~175°, respectively, (Figure 3b). As discussed above for DQ20, these Ψ angles are characteristic of PPII-like, turn-like, and 2.51-helix-like secondary structures, respectively. From the Ψ angle distributions, we conclude that the peptide in the NDQ20 supernatant has the same secondary structure as DQ20. However, the widths of the PPII-like and 2.51-helix-like Ψ angle distributions (and bands) of the NDQ20 supernatant are larger than those of DQ20 (Figure 3). This indicates that the PPII-like and 2.51-helix-like structures of the NDQ20 supernatant are less ordered compared to that of DQ10. Also, we find that the AmIP and AmIS bands of the NDQ20 supernatant are found at ~1680 cm−1, which is similar to that of DQ20 and indicates Gln side chains that are hydrogen-bonded to water.
Figure 8.
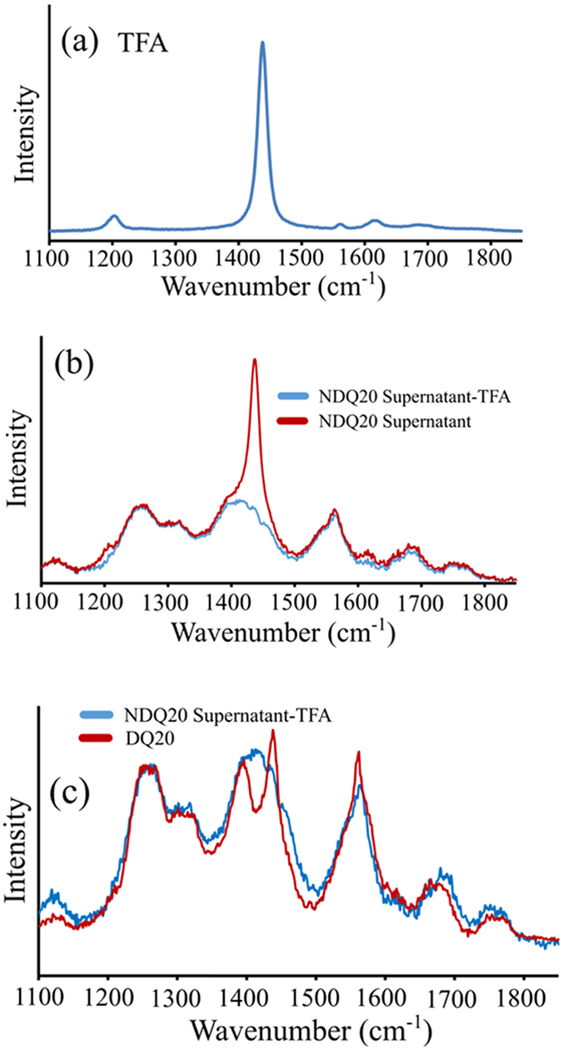
UVRR spectra of (a) TFA and the (b) NDQ20 supernatant with (blue) and without (red) subtraction of TFA. (c) UVRR spectral comparison of (red) DQ20 and (blue) the NDQ20 supernatant with TFA subtracted.
TFA Contamination in the NDQ20 Supernatant.
In the NDQ20 supernatant UVRR spectra, we observe a strong, dominant peak at ~1435 cm−1 and a weaker peak at ~1205 cm−1 that result from TFA (Figure 8a,b). These bands derive from CO stretching and asymmetric C–F stretching bands of the trifluoroacetate ion.
Thermo Fisher Scientific synthesized our Q20 using an Fmoc SPPS where TFA was used for peptide cleavage and as a cosolvent for HPLC purification (see Materials and Methods section). As a result, TFA is a common impurity in our Q20 peptides.42 When NDQ20 is centrifuged, most of it pellets out. However, because of TFA’s miscibility with water, it remains in the supernatant.
Figure 9b shows the 204 nm UVRR spectrum of 10% (v/v) TFA (pKa = ~+0.5)43 in water at pH = ~+0.5. This spectrum is consistent with that previously reported for deprotonated TFA (trifluoroacetate).44,45 Also, the Figure 9b UVRR spectrum is identical to that of deprotonated TFA (Figure 9c), indicating that the trifluoroacetate ion is selectively resonance-enhanced at 204 nm. In contrast, the UVRR spectrum of protonated TFA (Figure 9a) significantly differs from that of trifluoroacetate and has a much smaller 204 nm UVRR cross section.
Figure 9.
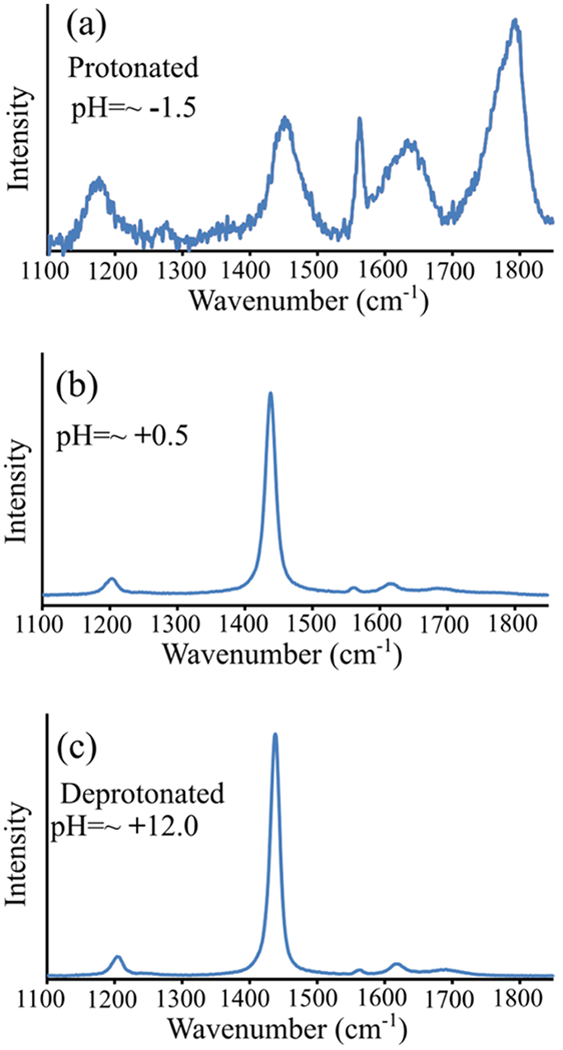
UVRR spectra (204 nm) of 10% (v/v) TFA in water at (a) pH = ~−1.5, (b) pH = ~+0.5, and (c) pH = ~+12. At pH = ~+12 TFA is deprotonated, and at pH = ~−1.5 TFA is predominantly protonated.
We assign the spectrum of trifluoroacetate based on the assignments of Robinson and Taylor,44 and Klemperer and Pimentel.45 The most intense peak in the TFA UVRR spectrum is located at ~1435 cm−1 and is assigned to symmetric carboxylate stretching motion. We also observe peaks at ~1205 and 1620 cm−1 that were previously assigned to asymmetric C–F stretching44 and asymmetric carboxylate stretching,44,45 respectively.
We assign our UVRR spectrum of protonated TFA based on the assignments of Fuson et al.46 For protonated TFA, the most intense UVRR peaks are found at ~1795 and ~1772 cm−1. We assign these bands to C=O stretching of TFA based on the work by Fuson et al.46 We also observe a band at ~1452 cm−1 that is assigned to C=O deformation.46 The bands at ~1014 and 1177 and ~1273 cm−1 are assigned to the OH out-of-plane deformation, C–F stretching, and OH in-plane deformations, respectively, of protonated TFA.46
We found that the NDQ20 supernatant has a pH of ~+3.5. Therefore, TFA is predominantly deprotonated in the NDQ20 supernatant. The peaks at ~1435 and ~1205 cm−1 in the NDQ20 supernatant are assigned to the strongly resonance-enhanced carboxylate stretching and the C–F stretching bands of the trifluoroacetate ion. Subtraction of the TFA UVRR spectrum from that of the NDQ20 supernatant reduces the intensity of the ~1435 and ~1205 cm−1 bands with little effect on the other UVRR bands, including the structurally sensitive and AmI bands (Figure 8b).
Concentration of TFA in the NDQ20 Supernatant.
The NDQ20 supernatant contains both TFA and the Q20 peptide. We determined the concentration of TFA in the NDQ20 supernatant from its UVRR spectrum. To do this, we first calculated the Raman cross section of the ~1435 cm−1 band of trifluoroacetate using the following equation
| (2) |
where σi is the Raman cross section of the trifluoroacetate ~1435 cm−1 band, σr is the Raman cross section of an internal standard Raman band, Ii is the intensity of the ~1435 cm−1 trifluoroacetate band, and Ir is the intensity of the internal standard Raman band. The factors kr and ki are the spectrometer efficiencies for the Raman bands of trifluoroacetate and the internal standard, respectively, and Cr and Ci are the concentrations of trifluoroacetate and the internal standard, respectively. The term in parentheses approximately corrects for sample self-absorption where Aex is the sample absorbance at the excitation frequency, Ai is the sample absorbance at the trifluoroacetate Raman band of interest, and Ar is the sample absorbance at the internal standard Raman band.
To determine the 204 nm UVRR cross section for the ~1435 cm−1 band of trifluoroacetate, we measured the UVRR spectrum of TFA at pH = ~+12 using sodium perchlorate (NaClO4) as an internal Raman cross section standard. The Raman cross section of NaClO4 was estimated to be ~ 1.18 × 10⁻²⁷ cm−2 molecule−1 sr−1 for 204 nm excitation by extrapolating the Raman cross section measurements of Dudik et al.47 From eq 2, we calculate that the 204 nm Raman cross section of the ~1435 cm−1 trifluoroacetate band is ~1.08 (±0.01) × 10−26 cm2 molecule−1 sr−1.
Using the Raman cross section of trifluoroacetate, we can determine the concentration of TFA in the NDQ20 supernatant. Rearrangement of eq 2 gives
| (3) |
We collected the UVRR spectra of the NDQ20 supernatant using sodium perchlorate as an internal standard. The NDQ20 supernatant has a pH of ~+3.5; thus, essentially all of the TFA in the supernatant will be deprotonated and contribute to the ~1435 cm−1 band of trifluoroacetate. Because we know the 204 nm Raman cross section of the ~1435 cm−1 trifluoroacetate band, we can calculate the concentration of TFA in the NDQ20 supernatant using eq 3. We find that the concentration of TFA in the NDQ20 supernatant is ~810 ± 70 μM.
Concentration of the Peptide in the NDQ20 Supernatant.
Using the concentration of TFA in the supernatant, calculated above, we determined the absorbance due to TFA at 214 nm in the NDQ20 supernatant. We constructed a calibration curve for TFA in the NDQ20 supernatant at 214 nm using a standard addition method (Figure 10a). From the calibration curve, we calculate that 810 μM TFA should result in an absorbance of ~0.0006 at 214 nm. For the NDQ10 supernatant, we find an absorbance of ~0.0113 ± 0.002 at 214 nm (Figure 7). Thus, the absorbance of the peptide in the NDQ20 supernatant is ~0.0107. We constructed a calibration curve using the highly soluble DQ20 peptide to determine the concentration of the peptide in the supernatant (Figure 10b). At 214 nm, DQ20 has a molar absorptivity of ~19220 M−1 cm−1. From the DQ20 calibration curve, we calculate that the NDQ20 supernatant contains ~0.076 mg/mL (~24.8 μM) of the Q20 peptide.
Figure 10.
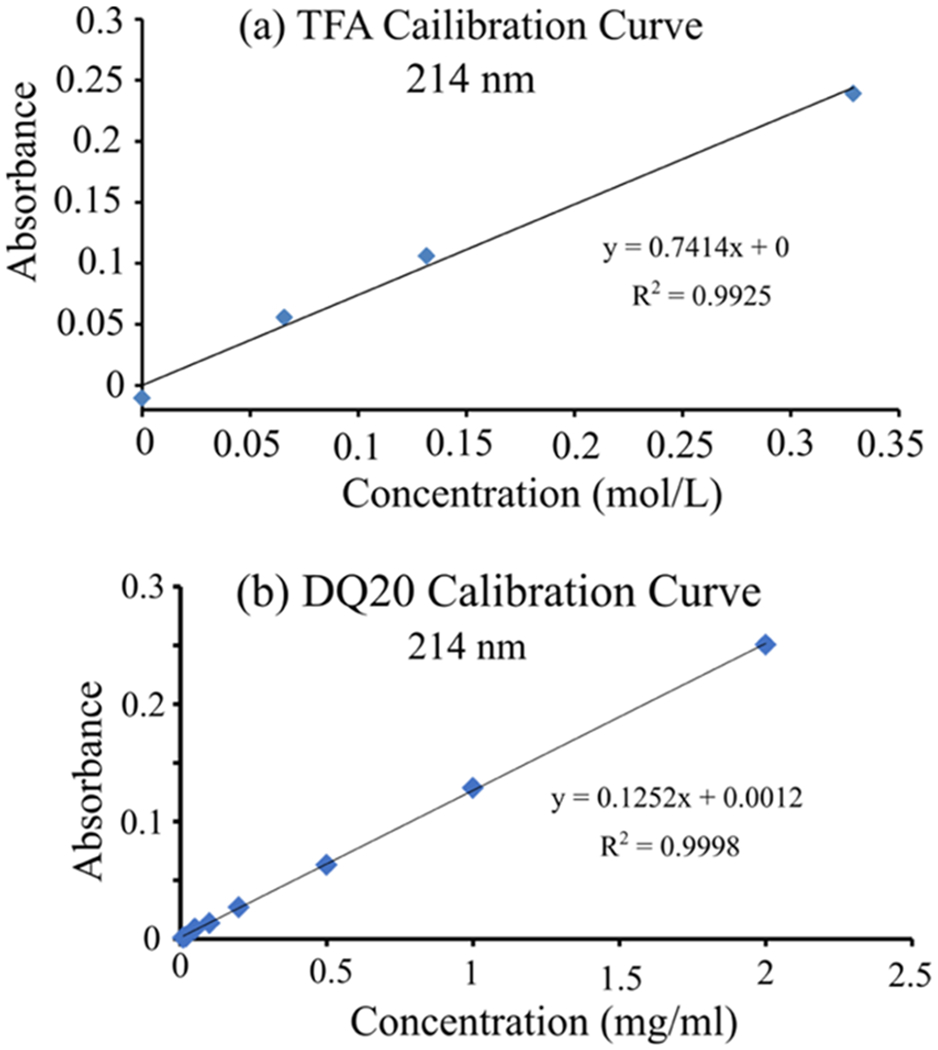
Absorbance calibration curve at 214 nm for (a) TFA and (b) DQ20.
TFA Used in SPPS May Induce PPII-like Conformation.
Our results show that the peptide in the NDQ20 supernatant has a PPII-like structure similar to that of disaggregated peptides and contains TFA. This is consistent with the results of Burra and Thakur48,49 who showed that TFA alone causes disaggregation of polyQ peptides. Further, disaggregated polyQ peptides have previously been found to occur in PPII-like conformations.11 Thus, we hypothesize that the PPII-like structure observed in the NDQ20 supernatant results from the use of TFA during peptide synthesis. However, the mechanism by which TFA induces a structural change in polyQ peptides remains poorly understood.
Structure of SPPS Q20 and NDQ20.
UVRR Characterization and Ψ Angle Distribution of SPPS Q20.
The UVRR spectrum of SPPS Q20 is similar to that of NDQ10,11 which was found to have a collapsed β-strand-like conformation (Figure 11).11 The SPPS Q20 UVRR spectrum shows an frequency of ~1245 cm−1, which is 5 cm−1 upshifted compared to that of NDQ10 (~1240 cm−1). This ~5 cm−1 frequency difference between SPPS Q20 and NDQ10 likely results from differences in peptide backbone hydration.
Figure 11.
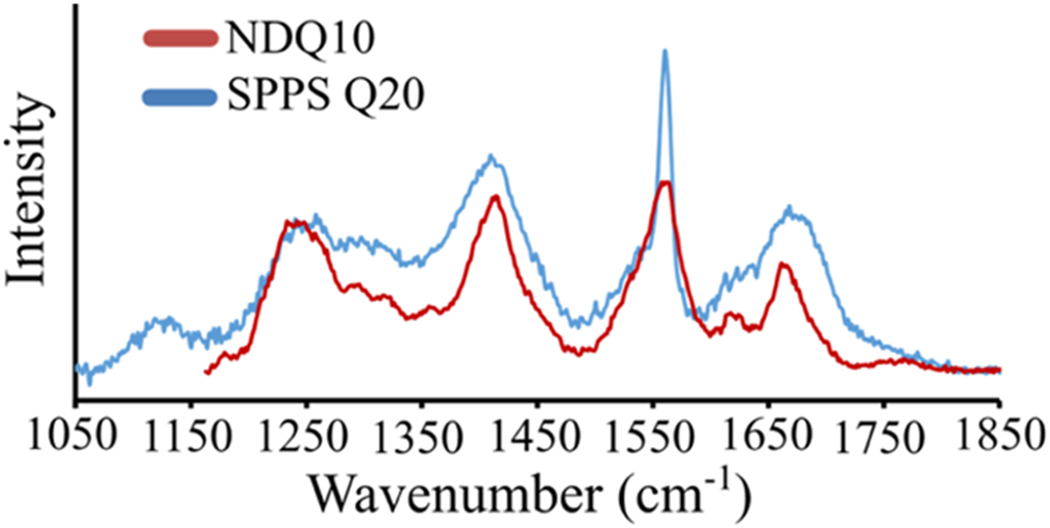
UVRR spectra of (red) NDQ10 and (blue) SPPS Q20. The NDQ10 spectrum was adapted with permission from Punihaole, D. et al. (2017). J. Phys. Chem. B, 121(24), 5953–5967. Copyright 2017 American Chemical Society.
Mikhonin et al. previously correlated the frequency to the Ψ angle for peptides in a variety of backbone solvation states.22 They found that the frequency of the band is sensitive to water solvation of the peptide backbone. Comparison of the frequency–Ψ angle correlations for crystalline peptides and solvated peptides shows an ~4 cm−1 upshift of the band in peptide crystals compared to peptides in aqueous solution. This is similar to the ~5 cm−1 upshift of the band we observe for SPPS Q20 compared to aqueous NDQ10. Thus, the frequency differences between NDQ10 and SPPS Q20 are most likely to result from water exposure of the peptide backbone. In agreement, the AmIP band of SPPS Q20 indicates that the side chain amide groups are not hydrogen-bonded to water (see below) while the NDQ10 side chain and backbone carbonyl groups are hydrogen-bonded to water.11 See below for a detailed discussion of the SPPS Q20 AmI bands.
Punihaole et al.11 previously calculated the Ψ angle distribution of the NDQ10 peptide from the band using an equation derived by Mikhonin et al.22 for peptides in aqueous solution with an unknown hydrogen bonding environment (eq S4). Using this equation, Punihaole et al. calculated that aqueous NDQ10 has a Ψ angle distribution centered at ~140°, characteristic of a β-strand-like secondary structures.11
Here, we use the band of SPPS Q20 to calculate its Ψ angle distribution. However, because the frequency depends on both the Ψ angle and hydrogen bonding to the amide C=O and N–H groups,22,33 we must account for the frequency shift resulting from differences in hydrogen bonding between dissolved NDQ10 and SPPS Q20. Therefore, instead of using eq S4 for aqueous peptides, we used the measured frequency–Ψ angle correlation for crystalline peptides derived by Mikhonin et al.22 (eq S5). This equation best models the hydrogen bonding and solvation environments expected for SPPS Q20. Using this equation, we calculate that SPPS Q20 has a Ψ angle distribution centered at ~138°, which is characteristic of β-strand-like structures (Figure 12b) such as that observed for NDQ10 (Ψ = ~140°).11 Also, it is important to note that the band and Ψ angle distribution of SPPS Q20 are significantly broader than those of NDQ10. This indicates that the β-strand-like conformation of SPPS Q20 is less ordered and contains more conformational variations compared to those of NDQ10.
Figure 12.
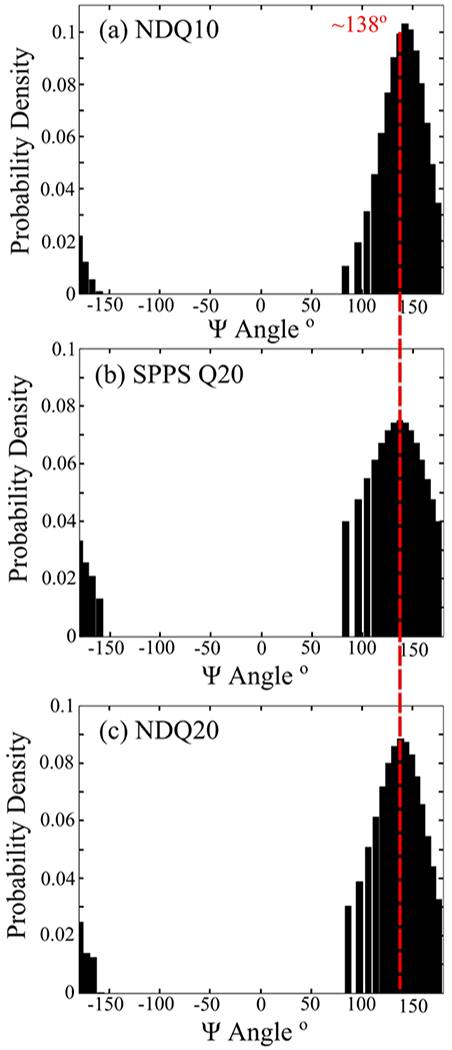
Ψ angle distribution of (a) NDQ10 previously calculated by Punihaole et al.,11 (b) SPPS Q20, and (c) NDQ20. The NDQ10 Ψ distribution was adapted with permission from Punihaole, D. et al. (2017). J. Phys. Chem. B, 121(24), 5953–5967. Copyright 2017 American Chemical Society.
UVRR Characterization and Ψ Angle Distribution of NDQ20.
We investigated the structure of NDQ20 (Figure 1d) by measuring its UVRR spectrum (Figure 13). We find that the UVRR spectrum of NDQ20 in water is very similar to that of SPPS Q20 (Figure 12b) with an band at ~1246 cm−1. Using eq S5, we calculate that the NDQ20 Ψ angle distribution is centered at ~138°, which is characteristic of a β-strand-like conformation (Figure 12c).
Figure 13.
UVRR spectra of (blue) SPPS Q20 and (red) NDQ20 in water.
Side Chain and Backbone Hydrogen Bonding in SPPS Q20 and NDQ20.
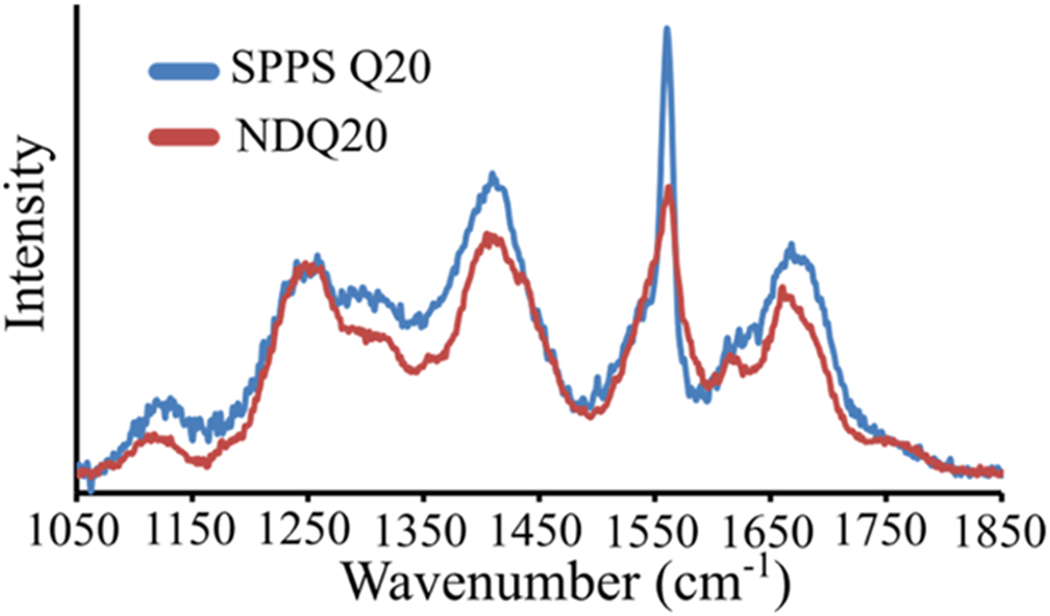
At 204 nm excitation, SPPS Q20 and NDQ20 both contain broad (~70 cm−1 FWHH) AmI bands centered at ~1670 cm−1 (Figure 14). In contrast to SPPS Q20, NDQ20 also contains a narrow AmI peak at ~1660 cm−1, which indicates strong peptide–peptide hydrogen bonding.
Figure 14.
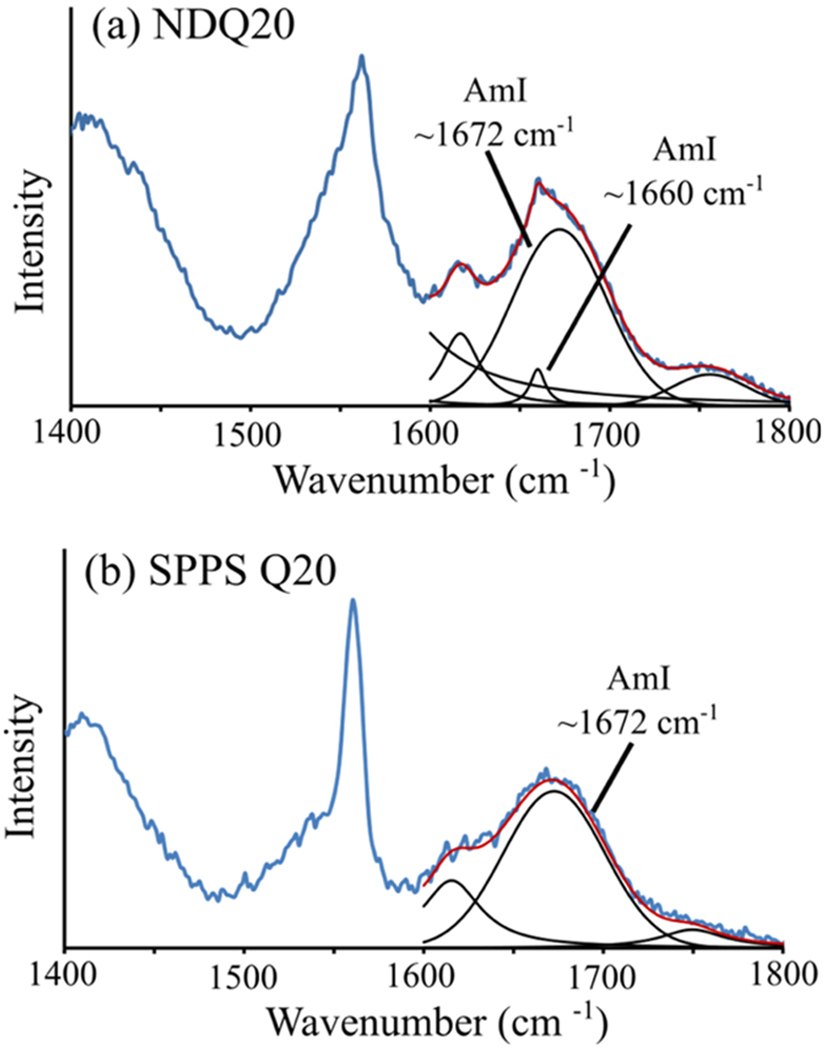
UVRR AmI spectral region of (a) NDQ20 and (b) SPPS Q20. The spectra were modeled as a sum of Gaussian and Lorentzian bands, shown in black, as described in the Supporting Information. The AmI bands are labeled in each spectrum.
We examined the 197–204 nm difference spectra of SPPS Q20 and NDQ20 to highlight the contributions of the AmIP bands (Figure 15a,c). We find that SPPS Q20 and NDQ20 both contain narrow AmIP bands located at ~1666 and ~1662 cm−1, respectively. These frequencies are indicative of strong side chain–side chain and/or side chain–backbone hydrogen bonding such as that found in polyQ fibrils.17 Using eq 1, we estimate that the Gln side chain ΔHint = ~−5.3 kcal/mol for SPPS Q20 and ~−5.6 kcal/mol for NDQ20.
Figure 15.
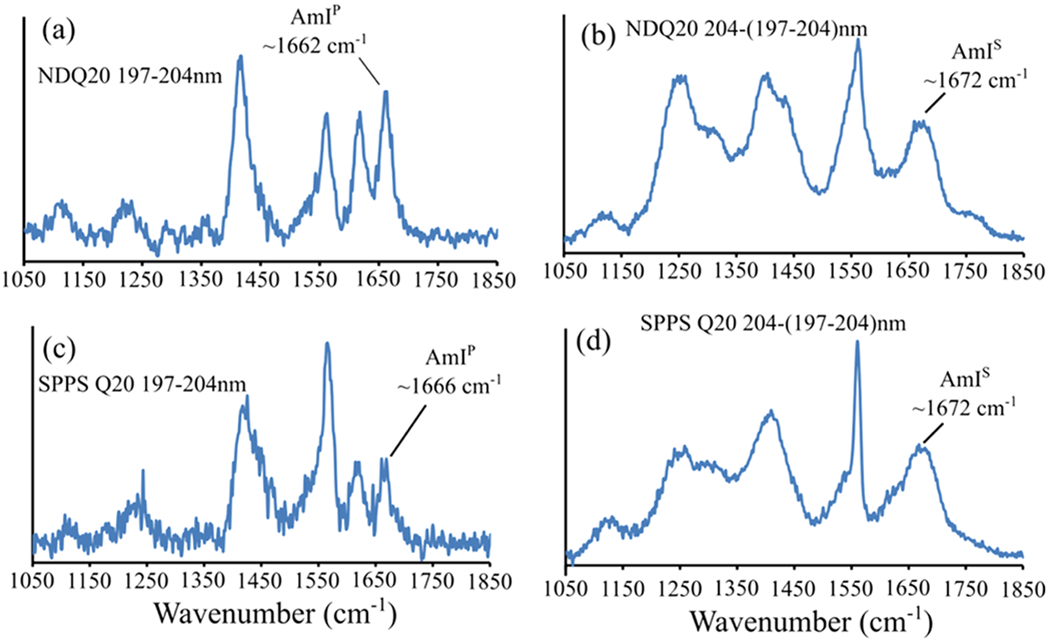
197–204 nm UVRR difference spectra of (a) NDQ20 and (c) SPPS Q20, and 204–(197–204)nm difference spectra of (b) NDQ20 and (d) SPPS Q20.
The increased relative intensity of the ~1662 cm−1 AmIP band in the UVRR spectra of NDQ20, compared to that of SPPS Q20, indicates that NDQ20 contains a larger population of Gln side chains involved in strong side chain–peptide hydrogen bonding. Also, the lack of an ~1680 cm−1 AmIP band in NDQ20 and SPPS Q20 indicates that neither species contains a significant population of Gln side chains hydrogen-bonded to water.
From the 204–(197–204) nm spectra (Figure 15b,d), we find that both NDQ20 and SPPS Q20 have an AmIS frequency of ~1675 cm−1. This frequency is upshifted from that of polyQ fibrils (~1660 cm−1), indicating that NDQ20 and SPPS Q20 contain weaker backbone–peptide hydrogen bonding. Also, the AmIS bands of NDQ20 and SPPS Q20 are broad (~70 cm−1 FWHH), suggesting that the peptide backbone amides are found in a variety of hydrogen bonding environments that inhomogenously broaden the AmIS band.
Stability and Activation Barrier between the PPII-like and β-Strand-like Structures of PolyQ.
Punihaole et al.11 previously showed that the PPII-like and β-strand like conformations do not interconvert because of a high activation barrier between them. We find that the PPII-like polyQ structure of DQ1011 and DQ20 contains negligible peptide–peptide hydrogen bonding and extensive peptide–water hydrogen bonding. PPII conformations are thought to be stabilized by peptide backbone–water hydrogen bonding50,51 and/or the low-energy water–water hydrogen bonding structure of the PPII peptide solvation shell.50,52–57 Thus, it is likely that the polyQ PPII-like structure is also stabilized by these interactions. A PPII-like → β-strand-like polyQ structural transition would have to overcome the energy barrier(s) associated with breaking peptide backbone–water hydrogen bonds and/or disrupting the water–water hydrogen bonding of the PPII solvation shell.
In contrast, the β-strand-like structure of NDQ1011 and NDQ20 contains significant side chain–peptide hydrogen bonding. β-strand structures are stabilized by peptide–peptide hydrogen bonding between neighboring β-strands.58 Thus, polyQ β-strand conformations are likely stabilized by their side chain–peptide hydrogen bonding. A β-strand-like → PPII-like polyQ structural transition would have to overcome the energy barrier associated with breaking peptide–peptide hydrogen bonds.
NDQ20 Fibrillization.
To determine if NDQ20 (Figure 1d) will from fibrils, we examined the UVRR spectrum of aqueous NDQ20 after incubation for ~5 h at room temperature (~18 °C) and low pH (pH = ~+2–3) (Figure 1f). Incubation of NDQ20 resulted in a UVRR spectrum similar to that of NDQ10 fibrils reported by Punihaole et al (Figure 16b).17 After incubation, the band downshifts to ~1233 cm−1, which is characteristic of the antiparallel-β-sheet structure of polyQ fibrils (Ψ = ~148°) (Figure 17b) that contain dry fibril cores.17 We also observe a low-intensity band at ~1210 cm−1 that corresponds to a Ψ angle distribution centered at ~123°. As discussed previously by Punihaole et al., Ψ angles of ~123° arise from subpopulations of a parallel β-sheet in polyQ fibrils.17 The widths of both the parallel and antiparallel β-sheet Ψ angle distributions are larger for NDQ20 fibrils compared to NDQ10 fibrils. This indicates that the secondary structure of the NDQ20 fibrils is less ordered compared to NDQ10 fibrils.
Figure 16.
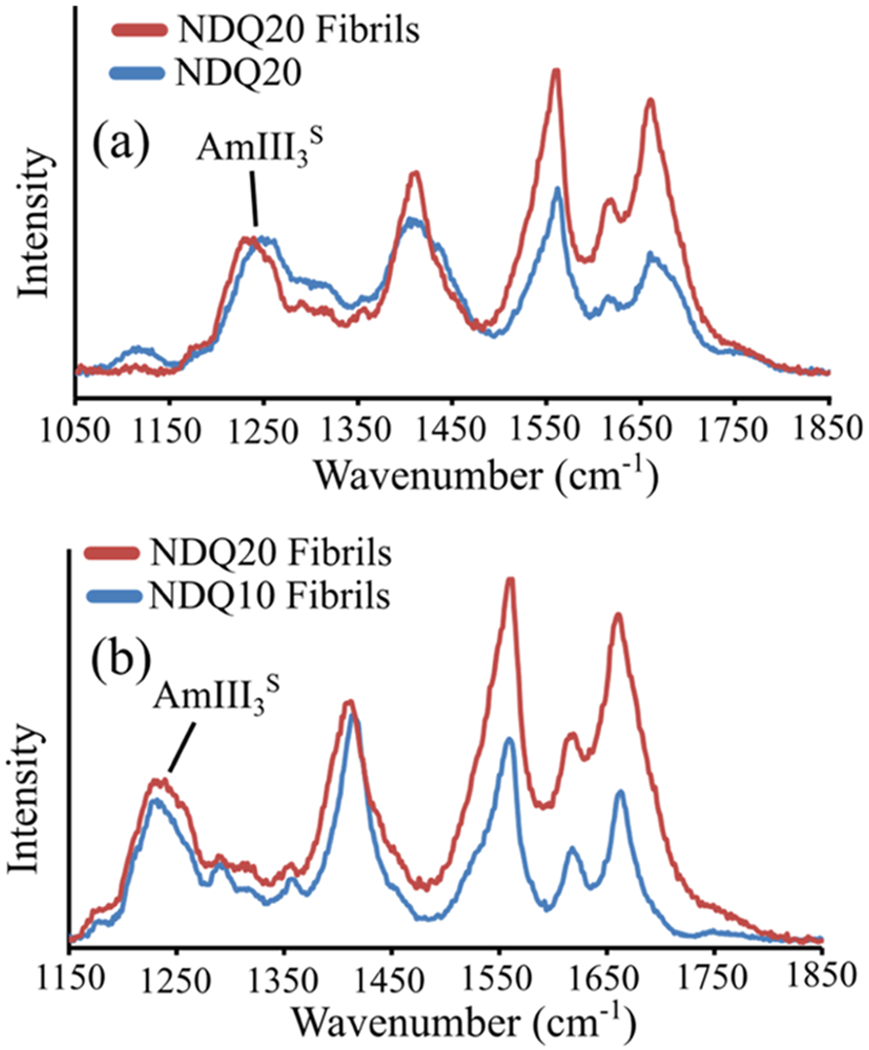
(a) UVRR spectra of NDQ20 (blue) and NDQ20 fibrils (red). (b) Comparison of the UVRR spectra of NDQ20 fibrils (red) and NDQ10 fibrils (blue) previously collected by Punihaole et al.17 The NDQ10 fibril spectrum was adapted with permission from Punihaole, D. et al. (2016). J. Phys. Chem. B, 120(12), 3012–3026. Copyright 2016 American Chemical Society.
Figure 17.
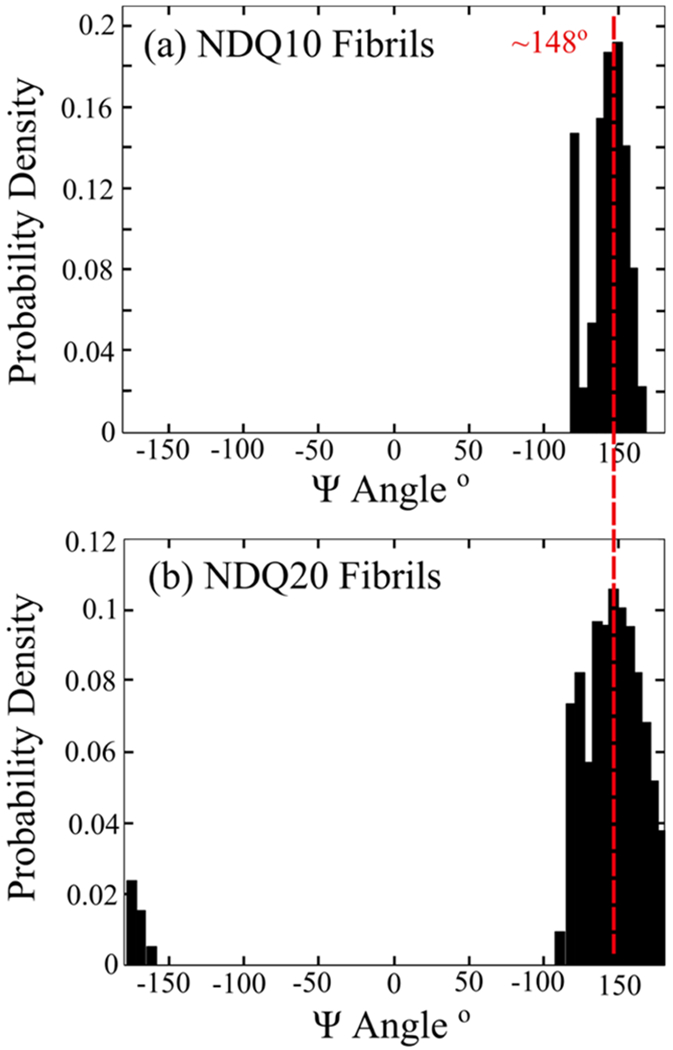
Ψ angle distribution of (a) NDQ10 fibrils and (b) NDQ20 fibrils. Both NDQ10 fibrils and NDQ20 fibrils contain Ψ angle distributions that peak at ~148° and ~123°, which are characteristic of antiparallel β-sheet and parallel β-sheet conformations, respectively.
Additionally, the AmI band downshifts to ~1660 cm−1 and increases in relative intensity as a result of formation of strong peptide–peptide hydrogen bonds, as previously observed in Q10 fibril formation.17 To determine the frequency of the AmIP and AmIS bands, we examined the 197–204 and 204–(197–204) nm UVRR spectra of NDQ20 after incubation (Figure 18a,b). We find that the AmIP band is located at ~1665 cm−1, which corresponds to a side chain ΔHint of ~−5.4 kcal/mol. This is similar to that previously observed for Q10 fibrils.17,30 Also, we find that the AmIS band is located at ~1665 cm−1, which suggests strong backbone–backbone hydrogen bonding, as previously observed in polyQ fibrils.17
Figure 18.
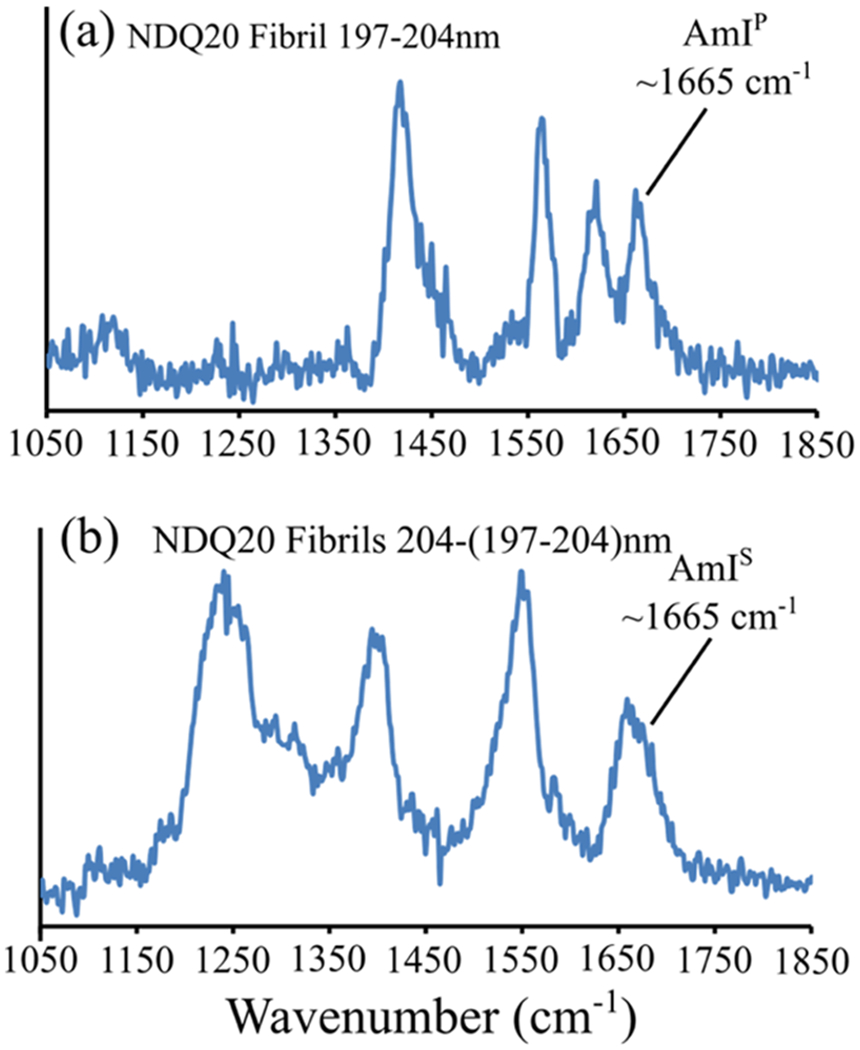
(a) 197–204 and (b) 204–(197–204) nm difference spectra of NDQ20 after ~5 h of incubation.
To confirm formation of fibrils, we collected TEM images of NDQ20 after incubation for ~1–2 days at room temperature and low pH (pH = ~+2–3). Figure 19 shows TEM images of NDQ20 fibrils and NDQ10 fibrils. The TEM images of NDQ10 fibrils were previously collected by Punihaole et al.17 We find that NDQ20 contains amyloid-like fibril aggregates with a similar morphology to that observed for NDQ10.17 These images confirm that NDQ20 forms fibrils when incubated at room temperature (~18 °C) and low pH (pH = ~+2–3).
Figure 19.
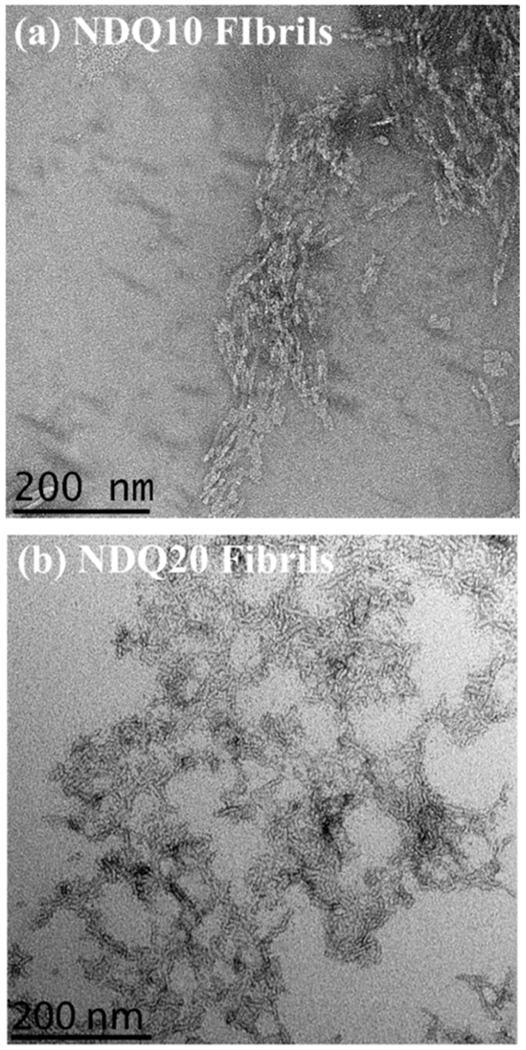
TEM images of (a) NDQ10 fibrils previously collected by Punihaole et al.17 and (b) NDQ20 fibrils (Figure 1f). The NDQ10 fibril TEM image was adapted with permission from Punihaole, D. et al. (2016). J. Phys. Chem. B, 120(12), 3012–3026. Copyright 2016 American Chemical Society.
Comparison to Other Results.
Our insights into the structures of SPPS Q20 and NDQ20 generally agree with results recently published by Burra and Thakur.59 They investigated the structures of the insoluble polyQ peptide K2Q9PGQ4AQ4PGQ9PGQ9K2 (PGQ9A) in the solid–phase synthesis lyophilized powder (SPPS PGQ9A) and non-disaggregated (NDPGQ9A) forms using Fourier transform infrared and CD spectroscopies.
Burra and Thakur59 found that SPPS PGQ9A contains predominantly antiparallel β-sheet structure with minority populations of random coil and turn conformations. They conclude that SPPS PGQ9A must have weaker peptide–peptide hydrogen bonding compared to β-sheet fibrils because turn and random coil conformations have a less optimal hydrogen bonding pattern.59 This is in agreement with our UVRR data showing that SSPS Q20 is in a β-strand-like conformation with weaker hydrogen bonding compared to fibrils.
In contrast to SPPS PGQoA, Burra and Thakur showed that NDPGQ9A contains only antiparallel β-sheet conformation.59 Because random coil and turn conformations were not observed in NDPGQ9A, they concluded that NDPGQ9A must contain stronger peptide–peptide hydrogen bonding compared to SPPS PGQ9A. 59 Their conclusions agree with our results showing that NDQ20 contains a β-strand-like structure and stronger peptide–peptide hydrogen bonding compared to SPPS Q20.
Additionally, Burra and Thakur do not observe signs of NDPGQ9A fibrillization after incubation in water for 3 h.59 In contrast, we find that NDQ20 forms fibrils after ~5 h of incubation in water. It is possible that Burra and Thakur did not observe fibrillization of NDPGQ9A because it requires an incubation time longer than 3 h to form fibrils.
The work by Burra and Thakur59 qualitatively examined the secondary structures of SPPS PGQ9A and NDPGQ9A. From the secondary structures, they predicted the hydrogen bonding in each species. Our measurements quantitatively extend the work of Burra and Thakur59 by quantifying the peptide Ψ angle distribution and by directly measuring the peptide backbone and Gln side chain hydrogen bonding interactions for SPPS Q20 and NDQ20. As described above, our measurements provide new insights into the specific secondary structures and hydrogen bonding interactions experienced by insoluble polyQ species.
Implication of NDQ20 Fibrillization on the PolyQ Fibrillization Mechanism.
Currently, there are two major models for the polyQ fibrillization mechanism. The first model, proposed by Wetzel and co-workers,6,60 argues that polyQ aggregation occurs via nucleated growth. In this mechanism, the nucleus is thought to be a thermodynamically unfavorable conformation of the peptide monomer, and fibrils elongate by the recruitment of monomeric units to the growing fibril.6,61
The second model for the polyQ aggregation mechanism, developed by Pappu and co-workers, proposes that polyQ peptides form inter- and intrapeptide hydrogen bonds that lead to the formation of non-fibrillar polyQ aggregates.12–14 They propose that these aggregates can undergo a conformational change to form fibrils.62
Here, we show that the insoluble NDQ20 (Figure 1d) peptide will convert from non-fibril aggregates to fibrils in water. This result suggests that non-fibril polyQ aggregates in water can undergo a conformational transition into fibrils.
CONCLUSIONS
The results of this work are summarized in Table 4.
Table 4.
Summary of Secondary Structure and Hydrogen Bonding for Forms of Q20 Examined in This Studya
| AmIP υ (cm−1) | side chain H-bonding | AmIS υ (cm−1) | backbone H-bonding | Ψ angle (deg) | secondary structure | |
|---|---|---|---|---|---|---|
| DQ20 | ~1681 | S.C.-W. | ~1675 | B.B.-W. | ~10, ~175, ~150 | turn, 2.51-helix, PPII |
| DQ20 fibrils | ~1662 | S.C.-P. | ~1663 | B.B.-P. | ~145, ~123 | P-β-sheet, A-β-sheet |
| NDQ20 | ~1662 | S.C.-P. | ~1672 | B.B.-P. | ~138 | β-strand |
| NDQ20 supernatant | ~1680 | S.C.-W. | ~1680 | B.B.-W. | ~10, ~175, ~150 | turn, 2.51-helix, PPII |
| SPPS Q20 | ~1666 | S.C.-P. | ~1672 | B.B.-P. | ~138 | β-strand |
| NDQ20 fibrils | ~1665 | S.C.-P. | ~1665 | B.B.-P. | ~148, ~123 | P-β-sheet, A-β-sheet |
S.C., side chain; W., water; P., peptide; B.B., backbone; P-β-sheet, parallel β-sheet; A-β-sheet, antiparallel β-sheet.
We used UVRR spectroscopy to investigate the structures of Q20. NDQ20 is essentially insoluble in water (Figure 1d). In contrast, we find that disaggregation of Q20 renders the peptide (DQ20) highly soluble (Figure 1i). Using UVRR spectroscopy we find that DQ20 is in a PPII-like conformation with backbone and side chain amide groups hydrogen-bonded to water.
To examine the solubility of NDQ20 (Figure 1d), we collected UV absorption spectra of the NDQ20 supernatant (Figure 1e) after ultracentrifugation. We find that the supernatant has weak absorbance. Using UV absorbance and UVRR, we find a concentration of ~0.076 mg/mL for the peptide in the NDQ20 supernatant. Using UVRR spectroscopy, we find that the soluble fraction of NDQ20 is in a PPII-like conformation (Figure 1e) with Gln side chains and peptide backbone hydrogen-bonded to water, similar to that of DQ1011 and DQ20. The presence of a PPII-like peptide structure in the NDQ20 supernatant could result from the use of TFA in the peptide synthesis, which can disaggregate polyQ in the absence of HFIP.48,49
We used UVRR spectroscopy to investigate the structures of SPPS Q20 (Figure 1c) and NDQ20 (Figure 1d). We find that SPPS Q20 and NDQ20 are in β-strand-like conformations (Ψ = ~138°) similar to that previously observed for NDQ10.11 Using UVRR spectroscopy, we also probed the backbone and side chain amide hydrogen bonding interactions in SPPS Q20 and NDQ20. We find that both NDQ20 and SPPS Q20 contain backbone amides with weaker inter- and intrapeptide hydrogen bonding compared to that found in fibrils. In contrast, the side chain amide groups in SPPS Q20 and NDQ20 are involved in strong side chain–peptide hydrogen bonding. The number of side chain–peptide hydrogen bonds in NDQ20 is greater than that of SPPS Q20.
Upon incubation for ~5 h, we find that NDQ20 converts to fibrils (Figure 1f).17 These fibrils have a β-sheet secondary structure with side chain and backbone amides involved in strong peptide–peptide hydrogen bonding. This result, along with the observation that NDQ20 contains more side chain–peptide hydrogen bonds compared to SPPS Q20, suggests that high molecular weight, non-fibrillar polyQ aggregates can undergo a conformational transition into fibrils. The discovery that apparently insoluble polyQ peptides can form fibrils may allow for fibrillization studies on NDQ peptides in a β-strand-like conformation without the need for disaggregation.
Supplementary Material
ACKNOWLEDGMENTS
Funding for this work was provided by the University of Pittsburgh and the Defense Threat Reduction Agency (DTRA) HDTRA1-09-14-FRCWMD (R.S.J., S.E.W., S.A.A.). S.E.W. gratefully acknowledges support through the Molecular Biophysics and Structural Biology NIH Training Grant (T32 GM 088119).
Footnotes
ASSOCIATED CONTENT
Supporting Information
The Supporting Information is available free of charge on the ACS Publications website at DOI: 10.1021/acs.jpcb.8b10783.
UVRR spectral fitting; Ψ angle distribution calculations; TFA absorption spectra; and comparison between the UVRR spectra of DQ10 and DQ20 fibrils (PDF)
The authors declare no competing financial interest.
REFERENCES
- (1).Orr HT; Zoghbi HY Trinucleotide Repeat Disorders. Annu. Rev. Neurosci. 2007, 30, 575–621. [DOI] [PubMed] [Google Scholar]
- (2).Yang W; Dunlap JR; Andrews RB; Wetzel R Aggregated Polyglutamine Peptides Delivered to Nuclei are Toxic to Mammalian Cells. Hum. Mol. Genet. 2002, 11, 2905–2917. [DOI] [PubMed] [Google Scholar]
- (3).Nagai Y; Inui T; Popiel HA; Fujikake N; Hasegawa K; Urade Y; Goto Y; Naiki H; Toda T A Toxic Monomeric Conformer of the Polyglutamine Protein. Nat. Struct. Mol. Biol. 2007, 14, 332–340. [DOI] [PubMed] [Google Scholar]
- (4).Ross CA; Poirier MA What is the Role of Protein Aggregation in Neurodegeneration? Nat. Rev. Mol. Cell Biol. 2005, 6,891–898. [DOI] [PubMed] [Google Scholar]
- (5).Penney JB; Vonsattel J-P; Macdonald ME; Gusella JF; Myers RH CAG Repeat Number Governs the Development Rate of Pathology in Huntington’s Disease. Ann. Neurol. 1997, 41, 689–692. [DOI] [PubMed] [Google Scholar]
- (6).Chen S; Ferrone FA; Wetzel R Huntington’s Disease Age-of-Onset Linked to Polyglutamine Aggregation Nucleation. Proc. Natl. Acad. Sci. U.S.A. 2002, 99, 11884–11889. [DOI] [PMC free article] [PubMed] [Google Scholar]
- (7).Sugaya K; Matsubara S; Kagamihara Y; Kawata A; Hayashi H Polyglutamine Expansion Mutation Yields a Pathological Epitope Linked to Nucleation of Protein Aggregate: Determinant of Huntington’s Disease Onset. PLoS One 2007, 2, No. e635. [DOI] [PMC free article] [PubMed] [Google Scholar]
- (8).Sugaya K; Matsubara S Nucleation of Protein Aggregation Kinetics as a Basis for Genotype-Phenotype Correlations in Polyglutamine Diseases. Mol. Neurodegener. 2009, 4, 29. [DOI] [PMC free article] [PubMed] [Google Scholar]
- (9).Chen S; Wetzel R Solubilization and Disaggregation of Polyglutamine Peptides. Protein Sci. 2001, 10, 887–891. [DOI] [PMC free article] [PubMed] [Google Scholar]
- (10).Chen S; Berthelier V; Yang W; Wetzel R Polyglutamine Aggregation Behavior in Vitro Supports a Recruitment Mechanism of Cytotoxicity1. J. Mol. Biol. 2001, 311, 173–182. [DOI] [PubMed] [Google Scholar]
- (11).Punihaole D; Jakubek RS; Workman RJ; Marbella LE; Campbell P; Madura JD; Asher SA Monomeric Polyglutamine Structures that Evolve into Fibrils. J. Phys. Chem. B 2017, 121, 5953–5967. [DOI] [PubMed] [Google Scholar]
- (12).Vitalis A; Wang X; Pappu RV Atomistic Simulations of the Effects of Polyglutamine Chain Length and Solvent Quality on Conformational Equilibria and Spontaneous Homodimerization. J. Mol. Biol. 2008, 384, 279–297. [DOI] [PMC free article] [PubMed] [Google Scholar]
- (13).Wang X; Vitalis A; Wyczalkowski MA; Pappu RV Characterizing the Conformational Ensemble of Monomeric Polyglutamine. Proteins 2006, 63, 297–311. [DOI] [PubMed] [Google Scholar]
- (14).Crick SL; Jayaraman M; Frieden C; Wetzel R; Pappu RV Fluorescence Correlation Spectroscopy Shows That Monomeric Polyglutamine Molecules Form Collapsed Structures in Aqueous Solutions. Proc. Natl. Acad. Sci. U.S.A. 2006, 103, 16764–16769. [DOI] [PMC free article] [PubMed] [Google Scholar]
- (15).Walters RH; Murphy RM Examining Polyglutamine Peptide Length: A Connection between Collapsed Conformations and Increased Aggregation. J. Mol. Biol. 2009, 393, 978–992. [DOI] [PMC free article] [PubMed] [Google Scholar]
- (16).Vitalis A; Wang X; Pappu RV Quantitative Characterization of Intrinsic Disorder in Polyglutamine: Insights from Analysis Based on Polymer Theories. Biophys. J. 2007, 93, 1923–1937. [DOI] [PMC free article] [PubMed] [Google Scholar]
- (17).Punihaole D; Workman RJ; Hong Z; Madura JD; Asher SA Polyglutamine Fibrils: New Insights into Antiparallel β-Sheet Conformational Preference and Side Chain Structure. J. Phys. Chem. B 2016, 120, 3012–3026. [DOI] [PubMed] [Google Scholar]
- (18).Bykov S; Lednev I; Ianoul A; Mikhonin A; Munro C; Asher SA Steady-State and Transient Ultraviolet Resonance Raman Spectrometer for the 193–270 nm Spectral Region. Appl. Spectrosc. 2005, 59, 1541–1552. [DOI] [PubMed] [Google Scholar]
- (19).Oladepo SA; Xiong K; Hong Z; Asher SA; Handen J; Lednev IK UV Resonance Raman Investigations of Peptide and Protein Structure and Dynamics. Chem. Rev. 2012, 112, 2604–2628. [DOI] [PMC free article] [PubMed] [Google Scholar]
- (20).Jakubek RS; Handen J; White SE; Asher SA; Lednev IK Ultraviolet Resonance Raman Spectroscopic Markers for Protein Structure and Dynamics. Trends Anal. Chem. 2018, 103, 223–229. [DOI] [PMC free article] [PubMed] [Google Scholar]
- (21).Asher SA; Ianoul A; Mix G; Boyden MN; Karnoup A; Diem M; Schweitzer-Stenner R Dihedral Psi Angle Dependence of the Amide III Vibration: A Uniquely Sensitive UV Resonance Raman Secondary Structural Probe. J. Am. Chem. Soc. 2001, 123, 11775–11781. [DOI] [PubMed] [Google Scholar]
- (22).Mikhonin AV; Bykov SV; Myshakina NS; Asher SA Peptide Secondary Structure Folding Reaction Coordinate: Correlation between UV Raman Amide III Frequency, Psi Ramachandran Angle, and Hydrogen Bonding. J. Phys. Chem. B 2006, 110, 1928–1943. [DOI] [PubMed] [Google Scholar]
- (23).Asher SA; Mikhonin AV; Bykov S UV Raman Demonstrates That α-Helical Polyalanine Peptides Melt to Polyproline II Conformations. J. Am. Chem. Soc. 2004, 126, 8433–8440. [DOI] [PubMed] [Google Scholar]
- (24).Xiong K; Punihaole D; Asher SA UV Resonance Raman Spectroscopy Monitors Polyglutamine Backbone and Side Chain Hydrogen Bonding and Fibrillization. Biochemistry 2012, 51, 5822–5830. [DOI] [PMC free article] [PubMed] [Google Scholar]
- (25).Xiong K; Ma L; Asher SA Conformation of Poly-L-Glutamate Is Independent of Ionic Strength. Biophys. Chem. 2012, 162, 1–5. [DOI] [PMC free article] [PubMed] [Google Scholar]
- (26).Xiong K; Asher SA Impact of Ion Binding on Poly-L-Lysine (Un) Folding Energy Landscape and Kinetics. J. Phys. Chem. B 2012, 116, 7102–7112. [DOI] [PMC free article] [PubMed] [Google Scholar]
- (27).Ma L; Hong Z; Sharma B; Asher S UV Resonance Raman Studies of the NaClO4 Dependence of Poly-l-Lysine Conformation and Hydrogen Exchange Kinetics. J. Phys. Chem. B 2012, 116, 1134–1142. [DOI] [PMC free article] [PubMed] [Google Scholar]
- (28).Hong Z; Damodaran K; Asher SA Sodium Dodecyl Sulfate Monomers Induce XAO Peptide Polyproline II to α-Helix Transition. J. Phys. Chem. B 2014, 118, 10565–10575. [DOI] [PMC free article] [PubMed] [Google Scholar]
- (29).Punihaole D; Jakubek RS; Dahlburg EM; Hong Z; Myshakina NS; Geib S; Asher SA UV Resonance Raman Investigation of the Aqueous Solvation Dependence of Primary Amide Vibrations. J. Phys. Chem. B 2015, 119, 3931–3939. [DOI] [PMC free article] [PubMed] [Google Scholar]
- (30).Punihaole D; Jakubek RS; Workman RJ; Asher SA Interaction Enthalpy of Side Chain Backbone Amides in Polyglutamine Solution Monomers and Fibrils. J. Phys. Chem. Lett 2018, 9, 1944. [DOI] [PubMed] [Google Scholar]
- (31).Markham LM; Hudson BS Ab Initio Analysis of the Effects of Aqueous Solvation on the Resonance Raman Intensities of N-Methylacetamide. J. Phys. Chem. 1996, 100, 2731–2737. [Google Scholar]
- (32).Mayne LC; Hudson B Resonance Raman Spectroscopy of N-Methylacetamide: Overtones and Combinations of the C-N Stretch (Amide II’) and Effect of Solvation on the C=O Stretch (Amide I) Intensity. J. Phys. Chem. 1991, 95, 2962–2967. [Google Scholar]
- (33).Myshakina NS; Ahmed Z; Asher SA Dependence of Amide Vibrations on Hydrogen Bonding. J. Phys. Chem. B 2008, 112, 11873–11877. [DOI] [PMC free article] [PubMed] [Google Scholar]
- (34).Wang Y; Purrello R; Ceorgiou S; Spiro TG; Georgiou S; Spiro TG UVRR Spectroscopy of the Peptide Bond. 2. Carbonyl H-Bond Effects on the Ground- and Excited-State Structures of N-Methylacetamide. J. Am. Chem. Soc. 1991, 113, 6368–6377. [Google Scholar]
- (35).Hudson BS; Markham LM Resonance Raman Spectroscopy as a Test of Ab Initio Methods for the Computation of Molecular Potential Energy Surfaces. J. Raman Spectrosc. 1998, 29, 489–500. [Google Scholar]
- (36).Heller EJ; Sundberg R; Tannor D Simple Aspects of Raman Scattering. J. Phys. Chem. 1982, 86, 1822–1833. [Google Scholar]
- (37).Asher SA; Chi Z; Li P Resonance Raman Examination of the Two Lowest Amide Ππ* Excited States. J. Raman Spectrosc. 1998, 29, 927–931. [Google Scholar]
- (38).Chen XG; Asher SA; Schweitzer-Stenner R; Mirkin NG; Krimm S UV Raman Determination of the Ππ* Excited State Geometry of N-Methylacetamide: Vibrational Enhancement Pattern. J. Am. Chem. Soc. 1995, 117, 2884–2895. [Google Scholar]
- (39).Punihaole D; Hong Z; Jakubek RS; Dahlburg EM; Geib S; Asher SA Glutamine and Asparagine Side Chain Hyperconjugation-Induced Structurally Sensitive Vibrations. J. Phys. Chem. B 2015, 119, 13039–13051. [DOI] [PMC free article] [PubMed] [Google Scholar]
- (40).Riddle FL Jr; Fowkes FM. Spectral Shifts in Acid-Base Chemistry. 1. van Der Waals Contributions to Acceptor Numbers. J. Am. Chem. Soc. 1990, 112, 3259–3264. [Google Scholar]
- (41).Barth A Infrared Spectroscopy of Proteins. Biochim. Biophys. Acta, Bioenerg. 2007, 1767, 1073–1101. [DOI] [PubMed] [Google Scholar]
- (42).Valenti LE; Paci MB; De Pauli CP; Giacomelli CE Infrared Study of Trifluoroacetic Acid Unpurified Synthetic Peptides in Aqueous Solution: Trifluoroacetic Acid Removal and Band Assignment. Anal. Biochem. 2011, 410, 118–123. [DOI] [PubMed] [Google Scholar]
- (43).Averill BA; Eldredge P General Chemistry: Principles, Patterns, and Applications; Saylor Foundation, 2012. [Google Scholar]
- (44).Robinson RE; Taylor RC Raman Spectrum and Vibrational Assignments for the Trifluoroacetate Ion. Spectrochim. Acta 1962, 18, 1093–1097. [Google Scholar]
- (45).Klemperer W; Pimentel GC Hydrogen Bonding in Sodium Trifluoroacetate-Trifluoroacetic Acid Compounds. J. Chem. Phys. 1954, 22, 1399–1402. [Google Scholar]
- (46).Fuson N; Josien M-L; Jones EA; Lawson JR Infrared and Raman Spectroscopy Studies of Light and Heavy Trifluoroacetic Acids. J. Chem. Phys. 1952, 20, 1627–1634. [Google Scholar]
- (47).Dudik JM; Johnson CR; Asher SA Wavelength Dependence of the Preresonance Raman Cross Sections of CH3CN, SO42–, ClO4–, and NO3–. J. Chem. Phys. 1985, 82, 1732. [Google Scholar]
- (48).Burra G; Thakur AK Anhydrous Trifluoroacetic Acid Pretreatment Converts Insoluble Polyglutamine Peptides to Soluble Monomers. Data Brief 2015, 5, 1066–1071. [DOI] [PMC free article] [PubMed] [Google Scholar]
- (49).Burra G; Thakur AK Unaided Trifluoroacetic Acid Pretreatment Solubilizes Polyglutamine Peptides and Retains Their Biophysical Properties of Aggregation. Anal. Biochem. 2016, 494, 23–30. [DOI] [PubMed] [Google Scholar]
- (50).Sreerama N; Woody RW Molecular Dynamics Simulations of Polypeptide Conformations in Water: A Comparison of α, β, and Poly (pro) II Conformations. Proteins: Struct., Funct., Bioinf 1999, 36, 400–406. [PubMed] [Google Scholar]
- (51).Adzhubei AA; Sternberg MJE Left-Handed Polyproline II Helices Commonly Occur in Globular Proteins. J. Mol. Biol. 1993, 229, 472–493. [DOI] [PubMed] [Google Scholar]
- (52).Mezei M; Fleming PJ; Srinivasan R; Rose GD Polyproline II Helix Is the Preferred Conformation for Unfolded Polyalanine in Water. Proteins: Struct., Funct., Bioinf 2004, 55, 502–507. [DOI] [PubMed] [Google Scholar]
- (53).Drozdov AN; Grossfield A; Pappu RV Role of Solvent in Determining Conformational Preferences of Alanine Dipeptide in Water. J. Am. Chem. Soc. 2004, 126, 2574–2581. [DOI] [PubMed] [Google Scholar]
- (54).Fleming PJ; Fitzkee NC; Mezei M; Srinivasan R; Rose GD A Novel Method Reveals That Solvent Water Favors Polyproline II over β-Strand Conformation in Peptides and Unfolded Proteins: Conditional Hydrophobic Accessible Surface Area (CHASA). Protein Sci. 2009, 14, 111–118. [DOI] [PMC free article] [PubMed] [Google Scholar]
- (55).Makarov AA; Lobachov VM; Adzhubei IA; Esipova NG Natural Polypeptides in Left-Handed Helical Conformation A Circular Dichroism Study of the Linker Histones’ C-Terminal Fragments and β-Endorphin. FEBS Lett. 1992, 306, 63–65. [DOI] [PubMed] [Google Scholar]
- (56).Eker F; Cao X; Nafie L; Huang Q; Schweitzer-Stenner R The Structure of Alanine Based Tripeptides in Water and Dimethyl Sulfoxide Probed by Vibrational Spectroscopy. J. Phys. Chem. B 2003, 107, 358–365. [Google Scholar]
- (57).Stapley BJ; Creamer TP A Survey of Left-Handed Polyproline II Helices. Protein Sci. 2008, 8, 587–595. [DOI] [PMC free article] [PubMed] [Google Scholar]
- (58).Horton HR; Moran LA; Ochs RS; Rawn JD; Scrimgeour KG Principles of Biochemistry; Prentice Hall: Upper Saddle River, NJ, 1996. [Google Scholar]
- (59).Burra G; Thakur AK Insights into the Molecular Mechanism behind Solubilization of Amyloidogenic Polyglutamine-Containing Peptides. Pept. Sci. 2018, No. e24094. [Google Scholar]
- (60).Kar K; Jayaraman M; Sahoo B; Kodali R; Wetzel R Critical Nucleus Size for Disease-Related Polyglutamine Aggregation Is Repeat-Length Dependent. Nat. Struct. Mol. Biol. 2011, 18, 328–336. [DOI] [PMC free article] [PubMed] [Google Scholar]
- (61).Wetzel R Physical Chemistry of Polyglutamine: Intriguing Tales of a Monotonous Sequence. J. Mol. Biol. 2012, 421, 466–490. [DOI] [PMC free article] [PubMed] [Google Scholar]
- (62).Vitalis A; Pappu RV Assessing the Contribution of Heterogeneous Distributions of Oligomers to Aggregation Mechanisms of Polyglutamine Peptides. Biophys. Chem. 2011, 159, 14–23. [DOI] [PMC free article] [PubMed] [Google Scholar]
Associated Data
This section collects any data citations, data availability statements, or supplementary materials included in this article.