

Abstract
Limited DNA end resection is the key to impaired homologous recombination (HR) in BRCA1-mutant cells. Here through a loss-of-function CRISPR screen we identify DYNLL1 as an inhibitor of DNA end resection. Loss of DYNLL1 allows DNA end resection and restores HR in BRCA1-mutant cells, thereby inducing resistance to platinum drugs and poly(ADP-ribose) polymerase (PARP) inhibitors. Low BRCA1 expression correlates with increased chromosomal aberrations in primary ovarian carcinomas, and the junction sequences of somatic structural variants indicate diminished HR. Concurrent decrease in DYNLL1 expression in BRCA1 low carcinomas reduced genomic alterations and increased homology at lesions. In cells DYNLL1 limits nucleolytic degradation of DNA ends by associating with the DNA end resection machinery (MRN complex, BLM helicase and DNA2). In vitro, DYNLL1 directly binds MRE11 to limit its end resection activity. Therefore, we infer that DYNLL1 is an important anti-resection factor that significantly influences genomic stability and response to DNA damaging chemotherapy.
High-grade serous ovarian carcinoma (HGSOC) patients with germline mutations in BRCA1/2 exhibit high sensitivity and improved outcome to double strand DNA break (DSB)-inducing agents [i.e. platinum and Poly(ADP-ribose) polymerase inhibitors (PARPi)] due to underlying defects in DNA repair via HR1–3. Due to their effectiveness, three PARP inhibitors (olaparib, rucaparib, niraparib) have recently gained FDA approval for the treatment of HGSOCs. However, de novo and acquired resistance to these agents is common even in the BRCA mutation carriers, and pose a significant, and unsolved, clinical challenge. Restoration of HR by re-instating DNA end resection (depletion/deletion of 53BP14,5 and interactors6,7, REV78 and interactors9–13 etc.) in BRCA1-mutant cells is sufficient to confer PARPi resistance. Stabilizing the DNA replication fork (depletion/deletion of factors, PTIP14, CHD415, EZH216 etc. that recruit nucleases MRE1117,18, EXO118, MUS81 etc.) in BRCA1/2-mutant cells also causes PARPi resistance. Here, we adopted a systematic approach to comprehensibly identify unexplored factors/pathways that could be responsible for PARPi/platinum resistance in BRCA-defective HGSOC patients.
We utilized a genome-scale bacterial clustered regularly interspaced short palindromic repeats (CRISPR)-Cas9 knockout (GeCKO) library19 to identify genes whose loss confers resistance to clinical PARPi and platinum drugs in a panel of patient-derived BRCA1-mutant HGSOC lines. Amongst the most significant ‘hits’ of our screen, in both PARPi and platinum treated cells, was Dynein light chain 1 protein (DYNLL1). Diminished expression of DYNLL1 (alias LC8, PIN) significantly correlated with poor progression free survival (PFS), after platinum-based chemotherapy of patients with BRCA1-mutated ovarian carcinomas. Here, we describe the mechanism by which DYNLL1 contributes to PARPi/ platinum resistance. We report that it inhibits resection by directly interacting with MRE11 which is involved in nucleolytic degradation of DSB ends. These observations depict a previously uncharacterized function of DYNLL1 in regulation of HR-mediated DSB repair which bears significant clinical relevance.
RESULTS and DISCUSSION
We utilized the updated GeCKO library to screen a panel of BRCA1-mutant HGSOC lines (UWB1.289, COV362, and JHOS-2) to identify PARPi or cisplatin-resistant clones (Figure 1A). Specifically, Cas9-expressing cells were infected with sgRNA library, passaged to allow genomic editing, and treated with olaparib or cisplatin for (Figures 1a). Olaparib or cisplatin resistant clones were analyzed using a bar-code based sequencing strategy20,21 which includes the STARs algorithm to identify the disrupted gene. Deep sequencing results from the resistant clones were normalized against input abundance (representative examples, Figure 1b) and a rank order based on STARS score and significant enrichment of sgRNAs was generated (p value<0.01, Supplemental Table 1 and 2). As anticipated in the olaparib resistance screen, factors such as PARP1, 53BP14,5 and the recently described Rinn/Shieldin complex proteins9–13 were amongst the high confidence hits. In the cisplatin resistance screen the membrane channel protein LRRC8D22 that has been implicated in cisplatin uptake was a high-confidence ‘hit’. DYNLL1 was amongst the top ranked factors in both the olaparib and platinum screen as was the transcriptional regulator of DYNLL1, the ATM-interacting protein ATMIN.
Figure 1. Genome wide CRISPR screen reveals DYNLL1 loss causes PARPi and platinum resistance in BRCA1-mutant HGSOCs.

a, Schematic of CRISPR-based screen for PARPi or cisplatin resistance. b, Relative guide abundance before and after Olaparib and cisplatin treatment in Cov362 cells (data provided in Supplemental Table 1 and 2). c, Progression free survival (PFS) of ovarian carcinoma patients with BRCA1 mutant (top DYNLL1 high expression n=16, DYNLL1 low expression n=20) and BRCA1 wild type (bottom DYNLL1 high n=135, DYNLL1 low n=111) based on above or below median expression values of DYNLL1 (Source: Ovarian cancer, TCGA Dataset Nature 2011). Statistical significance was assessed by the one-sided Mantel–Cox test with P-value as indicated. d, Immunoblot of ATMIN and DYNLL1 from Cov362 cells with deletions of ATMIN or DYNLL1. #1 and #2 are independent stable clones. Survival assay of the indicated Cov362 clones treated with e, PARP inhibitors: Olaparib or Niraparib and f, Platinum drugs: Cisplatin or Carboplatin. g, Immunoblot of tagged DynLL1 in Cov362 cells with deletions of ATMIN or DYNLL1. d-f, experiments were repeated 3 times independently with similar results. Survival assay of h) Cov362 DYNLL1 −/− clone and i) Cov362 ATMIN −/− clone expressing tagged DYNLL1, treated with Olaparib or Cisplatin. Data is represented as mean SEM from 3 different experiments.
DYNLL1 has been implicated as a master regulator of several cellular functions ranging from intracellular trafficking to apoptosis23,24 but its function in DNA repair remains unexplored. We selected ATMIN and DYNLL1 for further study because of their potential clinical relevance. ATMIN is altered in about 30% of HGSOCs (Extended Data Fig. 1a). Low expression of DYNLL1 significantly correlates with worse progression free survival (PFS) of BRCA1 mutant HGSOC patients in the Cancer Genome Atlas (TCGA) dataset (Figure 1c). However, no such correlation was observed with PFS of BRCA-proficient HGSOC patients. Furthermore, there is no impact of DYNLL1 depletion on PARPi and platinum sensitivity in BRCA-proficient cells (Extended Data Fig. 1b). This is consistent with the notion that the decreased expression of DYNLL1 may cause platinum resistance exclusively in BRCA1 mutant HGSOC patients.
In ATMIN and DYNLL1-deficient Cov362 clones (Figure 1d), we observed that loss of ATMIN leads to depletion of DYNLL1. However, the reverse was not observed. This is consistent with the role of ATMIN in regulating DYNLL1 expression25. Next we confirmed that loss of ATMIN or DYNLL1 leads to significant resistance to PARPi, olaparib and niraparib (Figure 1e) and platinum drugs, cisplatin and carboplatin (Figure 1f) in independent clones. We validated these results in another BRCA1- mutant line ovarian line, UWB1.289 cells, BRCA1- mutant line breast lines MDA-MB-436 and L56Br-C1 and by co-depletion of BRCA1 and DYNLL1 in RPE1 and Hela cells (Extended Data Fig. 1c–h). We conclude that impact of DYNLL1 depletion on PARPi and platinum drugs in BRCA1-deficient contexts is not lineage specific. Next we expressed GFP-tagged or Flag-tagged DYNLL1 in ATMIN−/− and DYNLL1−/− cells. Restoration of DYNLL1 expression (Figure 1g) in DYNLL1−/− cells restored sensitivity to cisplatin and olaparib (Figure 1h). Importantly, restoration of DYNLL1 expression in ATMIN−/− cells (Figure 1g) also restored sensitivity to cisplatin and olaparib (Figure 1i). These results confirm the epistatic relationship of ATMIN and DYNLL1 and suggest that the impact of ATMIN loss in PARPi and platinum-resistance in BRCA1-mutant cells is mediated by DYNLL1.
DYNLL1 depletion did not impact PARPi and platinum-sensitivity of BRCA2-mutant cells (Extended Data Fig.1i) and low DYNLL1 levels do not correlate with worse PFS in BRCA2 mutant HGSOC patients (Extended Data Fig.1j). Therefore, we hypothesized that DYNLL1 may function upstream of BRCA2-mediated RAD51 nucleo-filament and restore HR to induce PARPi resistance in BRCA1-mutant cells. Consistent with our hypothesis, we observed significant increase in RAD51 foci formation in DYNLL1 −/− BRCA1-mutated Cov362 cells treated with olaparib (Figure 2a) or exposed to IR (Extended Data Fig. 2a). To rule out the possibility that mutant BRCA1 is involved in PARPi resistance in DYNLL1-deficient cells, we silenced BRCA1 expression in Cov362 cells, and confirmed that DYNLL1 loss indeed restores RAD51 foci in the absence of BRCA1 (Extended Data Fig. 2b).
Figure 2. DYNLL1 loss leads to restoration of DNA end resection and HR.

Immunofluorescence and quantification of Cov362 cells and Cov362 DYNLL1−/− cells treated with 10 uM Olaparib for 24 h stained with antibodies against a) RAD51, b) 53BP1, and c) RPA32 (for a, 143 cells b, 102 cells and c, 146 cells were analyzed, unpaired t test two tailed p<0.0001). -H2AX staining was done for all panels (data not shown). d, Schematic of AsiSI based DNA end resection assay (top) in U2OS cells and PCR-based quantification of ssDNA formation at 335bp or 1664bp downstream of the AsiSI induced break site (bottom) in cells transfected with indicated siRNAs. N=3 unpaired t test two tailed p<0.0001. e, Change in ssDNA length in Cov362 control and Cov362 DYNLL1−/− cells after 10 uM Olaparib treatment for 48 h, representative images (left) and quantification (right). 150 DNA fibers are analyzed, unpaired t test two tailed p-value between Ctrl and sgDYNLL1< 0.0001, p-value between sgDYNLL1 #1 and #2 =0.0848. Data is represented as mean SEM from 3 independent experiments.
Loss of 53BP1 foci formation in BRCA1-deficient tumors restores HR and causes PARPi resistance. DYNLL1 interacts with 53BP127, therefore, we examined the efficacy of 53BP1 foci formation in DYNLL1−/− cells. 53BP1 foci per cell is not significantly changed in the absence of DYNLL1 (Figure 2b). However, there is a decrease in cells with relatively high numbers (>30) of 53BP1 foci (Extended Data Fig. 2c). The modest impact of DYNLL1 loss on 53BP1 foci formation is unlikely to account for the PARPi resistance phenotype. Next, we examined DNA end resection in DYNLL1-deficient cells. Relative to control Cov362 cells there was a significant increase in RPA foci formation in DYNLL1−/− Cov362 cells after treatment with olaparib (Figure 2c) or exposure to IR (Extended Data Fig. 2d). Also phosphorylated RPA32 was increased after olaparib treatment in DYNLL1−/− Cov362 cells in relative to control Cov362 cells suggesting an increase in end resection (Extended Data Fig. 2e). In BRCA-proficient RPE1 cells the DYNLL1 depletion had no significant impact on RAD51 and 53BP1 foci per cell and there was a modest increase in RPA2 foci per cell (Extended Data Fig. 2f–h).
To quantitatively measure DNA end resection, we introduced the AsiSI endonuclease fused to estrogen receptor (ER-AsiSI)28 in either BRCA1 depleted or DYNLL1 and BRCA1 depleted U2OS cells and used a qPCR-based method29 to measure single stranded DNA (ssDNA) (Figure. 2d, schematic in upper panel). We observed a decrease in ssDNA generated from a specific DSB after depletion of BRCA1. However, when we silenced both DYNLL1 and BRCA1 we ‘rescued’ this phenotype and ssDNA levels were restored (Figure. 2d). Finally, we adopted the high resolution method, Single Molecule Analysis of Resection Tracks (SMART) assay,30 to directly visualize and measure ssDNA generated by DNA end resection in the BRCA1-mutant Cov362 cells after olaparib treatment. Indeed, the loss of DYNLL1 enhanced end resection in these cells and significantly increased the production of ssDNA after olaparib treatment (Figure. 2e). Together, our results suggest that loss of DYNLL1 in BRCA1 mutant or depleted cells restores RAD51 foci formation by facilitating DNA end resection.
To investigate any connection of BRCA1 and DYNLL1 in genomic stability of primary HGSOCs, we analyzed data from a cohort of 112 tumors from 92 HGSOC patients31. Whole genome and transcriptome sequencing had revealed ~36,000 somatic structural variants (SVs; amplifications, deletions, translocations, and inversions) in these tumors. Since DYNLL1 loss lead to restoration of HR-mediated DSB repair in BRCA1 mutant cells, we compared patterns of SVs in this cohort, after grouping the samples into 4 categories (Figure 3a and b) based on combinatorial high (above median) and low (below median) expression of BRCA1 and DYNLL1. Compared to the BRCA1 high-group, the BRCA1-low group had significantly (p-value < 0.001) high number of SVs per genome, which is consistent with the concept of increased genomic instability in BRCA1-deficient tumors. However, in the samples, that had low expression in both BRCA1 and DYNLL1, the number of SVs was substantially lower than the BRCA1-low group (p-value =0.10), which supports our experimental observation that DYNLL1 loss facilitates restoration of DNA repair in a BRCA1 deficient background. Analyzing different classes of SVs (i.e. deletions, duplications, insertions, and translocations) we observed broadly similar patterns i.e. increased burden of genomic aberrations in the BRCA1-low group, which is reduced in the group with low expression of both BRCA1 and DYNLL1. Nonetheless, these samples still had relatively elevated burden of SVs, particularly duplications and deletions (p-value < 0.05), compared to the DYNLL1 and BRCA1 proficient samples (Figure 3a). Next, we analyzed the extent of base pair level homology at the SV junctions for these samples. Samples with low BRCA1 expression and high DYNLL1 expression, the proportion of SVs with indications of HR-mediated repair (>=10bp homology) was smaller compared to the groups with high BRCA1 expression (p-value < 0.05 in both cases). In contrast, in the group, that had low expression of both BRCA1 and DYNLL1, the proportion of SVs with indications of HR-mediated repair (>=10bp homology) had increased and was comparable to that observed in the HR proficient group with high expression of both BRCA1 and DYNLL1. Analysis with high and low 53BP1 yielded a very similar pattern with low 53BP1 restoring homology in BRCA1-low samples (Figure 3b). This is consistent with the role of 53BP1 in impeding resection in BRCA1-mutant cells5. Taken together, analysis of genomic alterations in HGSOCs provides independent evidence that suppression of DYNLL1 expression distinctly compensates for BRCA1 deficiency in restoring DNA repair functions and maintaining genomic stability. Furthermore, correlation of diminished DYNLL1 expression with increased homology at SVs in the BRCA1-low cohort suggests that this decrease in DYNLL1 probably occurs concurrently with BRCA1 loss otherwise the genomic scar at a SV would represent other DNA repair mechanisms. We also obtained SV and expression data for Pancreatic Cancer Endocrine neoplasms (PAEN-AU) cohorts, which is part of the International Cancer Genome Consortium (ICGC). There were 4-154 (median: 18) SVs per sample in the PAEN-AU cohort. Extending the analyses to this pancreatic cancer cohort, we observed that the samples, that had low expression in both BRCA1 and DYNLL1, the number of SVs was lower (p-value = 0.02, Extended Data Fig. 3a) and the proportion of SVs with indications of HR-mediated repair (>=10bp homology) was higher than those with low expression of only BRCA1 (p-value >0.05, Extended Data Fig. 3b) which is consistent with the patterns in the ovarian cancer cohort and our experimental observations.
Figure 3. Impact of DYNLL1 on chromosomal aberrations in HGSOC samples and interaction with the DNA end resection machinery.

a, Samples from the Australian Ovarian Cancer Study cohort (OV-AU) were grouped into 4 categories based on combinatorial high (above median) and low (below median) expression of BRCA1 and DYNLL1, frequency of somatic structural variations (SV) (left panel) and frequency of intra-chromosomal SVs (Deletion + Duplication/ Insertion/ Intra-Chromosomal Translocation) (right panel) were plotted. b, Samples from the OV-AU cohort were grouped into 4 categories based on combinatorial high (above median) and low (below median) expression of BRCA1 and DYNLL1 (left panel) or expression of BRCA1 and 53BP1 (right panel). Frequency of homologous sequence discovered in the junction of Deletion + Duplication/ Insertion/ Intra-Chromosomal Translocation were plotted. Statistical differences (Mann Whitney U test, p values) are indicated. c, Representative immunoblot from 3 experiments of indicated proteins in Cov362 cells and Cov362 DYNLL1−/− cells after sub-cellular fractionation. Quantification (n=3) of chromatin enrichment shown in Extended Data 3e. d, Flag immunoprecipitation of GFP-DYNLL1 with FLAG-tagged DNA end resection proteins. Experiments were repeated 4 times independently with similar results. e, U2OS stable clone (U2OS19) containing 256 lac-operator and 96 tetracycline response element copies were transiently transfected with mCherry-LacI fused to DYNLL1 and either GFP- empty or fused to indicated proteins. Quantification of co-localization of mCherry-DYNLL1 with indicated GFP-tagged proteins on the LacO array is indicated (mean ± s.d., n=3).
Next, we investigated the molecular mechanism of how DYNLL1 impacts DNA end resection. ATMIN/DYNLL1 individually and as a complex have been implicated in transcriptional regulation 25,27,32. Analysis of the RNA sequencing data from ATMIN−/− mouse embryonic fibroblasts revealed increase in mRNA levels of the nucleases DNA2 and MRE11 and the Bloom’s Syndrome helicase (BLM) after aphidicolin treatment33. Following up on this data, we observed a basal increase in transcripts of DNA end resection factors in ATMIN- deficient and DYNL11-deficient Cov362 cells (Extended Data Fig. 3c and d), but this moderate increase in transcripts did not translate to consistent increase in protein levels of all the factors (Figure 3c). However, sub-cellular fractionation of these cells revealed that loss of DYNLL1 leads to very distinct increase in the DNA end resection factors in the chromatin bound fraction (Figure 3c, Extended Data Fig. 3e). Unrelated DNA repair factors such as REV7, PARP1 and Fen1 are not enriched in chromatin of DYNLL1 deficient cells. DYNLL1 is an essential ‘hub’ protein that interacts with hundreds of proteins34,35 and potentially influences their function. For example, it inhibits the activity of apoptotic factors BIM and BMF36 and nitric oxide synthase (NOS) via interaction37. Therefore, we tested the association of DYNLL1 with the DNA end resection factors and observed that DYNLL1 interacts with Flag-tagged (Figure 3d) and endogenous MRE11, RAD50, NBN, DNA2 and BLM (Extended Data Fig. 3f). To further investigate these interactions in intact cells, we adopted the Escherichia coli LacI/LacO tethering system38. mCherry-DYNLL1was fused to the lac-repressor (LacI) and its co-localization with the GFP-tagged DNA end resection factors was observed in ~70% of cells that were analyzed (Figure. 3e). Therefore, we concluded that DYNLL1 associates with the DNA end resection machinery (MRE11, NBN, RAD50, BLM, and DNA2). The interaction of DYNLL1 with these DSB factors is consistent with the observation that DYNLL1 is recruited to DSBs (Extended Data Fig. 3g) and overall there is more chromatin-associated DYNLL1 after DNA damage (Extended Data Fig. 3h).
DYNLL1 is present in both, a monomeric and a dimeric form in cells and the structural transition (PDB#3DVT, Extended Data Fig. 4a)39 between these two forms might be key to its interaction network35. Phosphorylation of serine 88 (S88) is critical for dimerization and ability to interact with factors such as BIM40. Another residue, cysteine 2 (C2) in the disordered region of the protein has also been implicated in interactions41. The phospho-null mutation of S88 (S88A) or mutation C2 to alanine (C2A) disrupted the interaction of DYNLL1 with the DNA end resection proteins. In contrast, the phosphomimetic mutation of S88 (S88D) had a detectably enhanced interaction with (MRE11, NBN, RAD50, BLM, and DNA2) (Figure 4a). Intriguingly, the well characterized interaction of DYNLL1 with 53BP135, had a contrasting pattern with reduced interaction of 53BP1 with S88D mutant and continued interaction with S88A mutant protein (Extended Data Fig. 4b). Re-constituting BRCA1-mutant DYNLL1 deficient cells with wildtype or DYNLL- mutants allowed us to ask whether the interaction of DYNLL1 with these factors is indeed regulating the PARPi sensitivity of BRCA1-mutant cells. Wildtype DYNLL1 or the S88D rescued the PARPi resistance phenotype whereas the two mutants (S88A and C2A) that do not interact with DNA end resection enzymes phenocopied the DYNLL1-deficient cells (Figure 4b).
Figure 4. Identification and characterization of DYNLL1 mutants that impact genome stability in cells and DNA end resection in vitro.

a, Immunoprecipitation of DYNLL1 mutants with end resection complex enzymes. Experiments were repeated 3 times independently with similar results. b, Immunoblot of tagged- DYNLL1 (wildtype and mutants) in Cov362 DYNLL1−/− cells (bottom) and survival assay following olaparib treatment (top) Data is represented as mean SEM from 3 different experiments. c, Resection products of WT or mutant recombinant DYNLL1 (purified proteins top panel) with MRN-RPA-BLM-DNA2 and a [32] P-labeled linear 2.7kb dsDNA substrate (middle panel) and quantification of resection efficiency (bottom panel, n=3). d, GST pull down of GST-tagged DYNLL1- WT and S88D mutant and MRE11 isolated from insect cells. e, Resection product of a 5’ end labelled 100 bp dsDNA incubated with indicated concentration of purified recombinant human DYNLL1 and the MRE11-RAD50-NBS1 complex. f, Immunofluorescence and quantification of MRE11 foci in Cov362 cells and Cov362 DYNLL1−/− cells treated with 10 uM Olaparib for 24 h. 198 cells were analyzed, unpaired t test two tailed p-value between Ctrl and sgDYNLL1< 0.0001. Data is represented as mean SEM from three different experiments.
Next, we tested whether DYNLL1 can inhibit DNA end resection in a cell-free system. Purified MRN complex, RPA, DNA2 and BLM was used to conduct in vitro end resection assays with radiolabeled DNA as previously described42. Consistent with their capacity to interact with the DNA end resection machinery in BRCA1-mutant cells and induce PARPi resistance, recombinant DYNLL1 wildtype protein and the S88D mutant protein suppressed end resection activity of the MRN complex in the presence of BLM, DNA2 and RPA (Figure 4c). In contrast, addition of C2A mutant protein (Figure 4c) or the S88A mutant protein (Extended Data Fig. 4c) that failed to interact with DNA end resection factors had no impact on end resection activity. Using in vitro binding assays we only detected the interaction of MRE11 with DYNLL1 wildtype and S88D mutant proteins (Figure 4d), that is, other factors included in the in vitro resection assays (DNA2, BLM, EXO1 and RPA2) did not interact (Extended Data Fig. 4d). Therefore, we conducted in vitro end resection assays excluding these factors and only using the MRN complex. DYNLL1 suppressed the end resection activity of the MRN complex (Figure 4e) and did not impact the helicase activity of BLM (Extended Data Fig. 4e). Finally, focusing on the impact of DYNLL1 on MRE11 in cells we observed that relative to control Cov362 cells there was a significant increase in MRE11 foci formation in DYNLL1−/− Cov362 cells after treatment with olaparib (Figure 4f).
The potent end resection activity of the MRN complex needs to be stringently regulated for efficient DSB repair and to maintain genomic stability. Our results definitively describe a new role for DYNLL1 in the negative regulation of DNA end resection. The primary mechanism by which DYNLL1 impairs end resection in BRCA1-deficient cells is via interaction with MRE11. How the interaction of DYNLL1 with MRE11 impairs its nuclease activity or its recruitment to foci remains unexplored. Furthermore, how this interaction is regulated in the context of the DNA damage response, for example, which kinase/phosphatase (s) regulates the phosphorylation of S88 residue of DYNLL1 to modulate the interaction needs to be investigated. Another key aspect is the role of DYNLL1 in regulating DSB repair is only manifested in BRCA1-deficient and not BRCA2-deficent cells. This highlights the role of BRCA1 in the initial end resection step of HR which is independent of BRCA2. Importantly, this is very similar to the impact of 53BP1 which was observed only in BRCA1-deficient cells4,5. Future studies will reveal the regulation of this intriguing small protein which functions inside preformed complexes and connects diverse biological modules.
METHODS
Cell culture
All cells were obtained from the American Type Culture Collection (ATCC). Cells were grown in Dulbecco’s modified Eagle’s medium (DMEM) containing 10% fetal bovine serum (FBS), except Kuramochi cells, which were grown in RPMI-1640 supplemented with 10% FBS and 1% penicillin/streptomycin, and UWB1.239 cells, which were grown in RPMI-1640 supplemented with 50% ATCC, and 50% Mammary Epithelial Growth Medium (MEGM) from Clonetics/Lonza, 3% FBS, and 1% penicillin/streptomycin. Parental cells were tested for mycoplasma contamination.
Antibodies
Mouse antibodies used were against Flag M2, α- and β-tubulin (Sigma), BRCA1, γH2AX (Millipore), LIG4, GFP and c-myc (Santa Cruz), REV7 (BD Transduction Libratory); rabbit antibodies were against PARP1, H2AX, FEN1, RAD50 (Cell Signalling), Histone H3, BLM, DNA2, DYNLL1 (Abcam), MRE11 (GeneTex), ATMIN (Millipore), EXO1 (Sigma), PTIP, 53BP1and Rad51 (Santa Cruz), RPA32 Phosphor-S4/S8 (Bethyl); goat antibodies were against NBN (Santa Cruz) and rat antibody against RPA2 (Cell Signaling).
CRISPR Screen
The doses of olaparib and cispalatin to use in these screens were determined by propagating UWB1.289, COV362, and JHOS-2 in different concentrations of these drugs to determine the effect on cell proliferation. To generate cell lines stably expressing Cas9, UWB1.289, COV362, and JHOS-2 were infected with the Cas9 expression vector pXPR_BRD111 and selected with 10 μg/mL blasticidin for 4-7 days. Cas9-expressing cells were maintained in 2-5 μg/mL blasticidin. The production of the GeCKO library from Broad Institute (targeting 18,080 genes with 64,751 unique guide sequences) in the pLentiGuide-puro backbone has been previously described19. After transduction of library and selection for 7-10 days with puromycin the cells were treated with olaparib or cisplatin for 14 days with medium/drug change every three days. DNA from Olaparib-resistant clones and Cisplatin-resistant clones were extracted with QIAGEN DNeasy Blood and tissue kits. PCR of gDNA and pDNA (sgRNA plasmid pool used to generate virus) was performed as previously described21. Cells transduced with the CRISPR library but did not go through PARPi or Cisplatin selections were sequenced as input control. STARS analysis was performed using the STARS software v 1.1 (Broad Institute)21. Genes were ranked based on input from all three lines and the p value obtained from the STARS analysis (please see Supplemental Tables).
TCGA analysis
Publicly available TCGA Ovarian serous cystadenocarcinoma data (Nature 2011) from cBioportal was queried for DYNLL1 expression data. Other clinical characteristics and BRCA1 and BRCA2 alteration data were also downloaded for the 316 ovarian carcinoma tumors in the cohort. 36 carcinomas with a BRCA1 mutation, 33 BRCA1 hypermethylated tumors and 34 carcinomas harboring a BRCA2 mutation were isolated from the cohort and used for further analysis. (two tumors: TCGA-13-1512-01 and TCGA-23-1026-01 have both a BRCA1 and BRCA2 mutation and are considered to be hyper-mutated and not included in the analysis). All necessary calculations were performed using and Graph Pad Prism v7.0.
Statistical analysis
All statistical calculations were performed using Excel, GraphPad Prism v7.0 or R. Unless mentioned otherwise, all statistics were evaluated by two-tailed Student’s t-test (Mann–Whitney test). No statistical methods were used to predetermine sample size. The experiments were not randomized. The investigators were not blinded to allocation during experiments and outcome assessment. For all panels, n.s. represents p value > 0.05, * p value < 0.05, ** p value < 0.01, *** p value < 0.001, and **** p value < 0.0001.
CTG assay
For assessing cellular toxicity, cells were transfected twice with siRNA at 36h intervals. Forty-eight hours after the second transfection, cells were seeded into 96-well plates. Next day, DNA-damaging agents were added at the indicated concentrations. Cells were incubated in drug containing media for 5 days followed by incubation in drug-free media for 4 days before viability was measured using CellTiter-Glo reagent (Promega) and assayed using a luminescence microplate reader. Untreated and treated conditions were repeated in triplicates for each experiment, and each experiment was repeated at least three times. Survival for each drug was plotted as a percentage of survival in drug-free media.
Immunofluorescence
Cells were grown on glass coverslips, fixed in 4% formaldehyde in PBS for 15 min at room temperature and blocked/permeabilized for 1 h in PBS containing 0.3% Triton X-100, 1% BSA, 10% fetal bovine (or 3% goat serum). Incubation with primary and secondary antibodies (Alexa Fluor, Molecular Probes) was done in PBS containing 1% BSA and 0.1% Triton X-100 for 1 h at room temperature. Coverslips were mounted using DAPI Fluoromount-G (Southern Biotech). When staining for RPA or RAD51 foci, soluble proteins were pre-extracted as previously described6 before processing for immunofluorescence.
siRNA-mediated silencing
Cells were transfected with siRNAs using Lipofectamine RNAimax following the manufacturer’s instructions (Invitrogen).
The sequences of the stealth siRNAs (Thermo-fisher) for the human genes were as follows. DYNLL1#1: GAAGGACAUUGCGGCUCAU;
DYNLL1#2: CAGCCUAAAUUCCAAAUAC;
53BP1: AGAACGAGGAGACGGUAAUAGUGGG;
BRCA1: CAGCUACCCUUCCAUCAUA;
Control: AAGCCGGUAUGCCGGUUAAGU.
Protein purification
Recombinant DYNLL1 WT, DYNLL1 mutant versions, and BLM were tagged at the N-terminus with GST and at the C-terminus with His10 using a protocol described previously43. MRE11, RAD50, NBS1 were purified according to an established protocol 44. RPA was purified as described44. For recombinant DNA2 protein purification, SF9 insect cells (1 L at 106 cells/ml) were infected with GST-DNA2-FLAG baculovirus. At 48 h post-infection, cells were harvested by centrifugation and the pellet was frozen on dry ice. Cells were lysed in Buffer 1 (1X PBS containing 150 mM NaCl, 1 mM EDTA, 0.05% Triton X-100, 1 mM DTT and protease inhibitors) and homogenized by 20 passes through a Dounce homogenizer (pestle A). Cell lysate was incubated with 1 mM MgCl2 and 2.5 U/ml benzonase nuclease at 4°C for 1 h followed by centrifugation at 35000 rpm for 1 hour. Soluble cell lysate was incubated with 1 mL of GST- Sepharose beads for 1hour 30 minutes at 4°C with gentle rotation. Beads were washed twice with buffer 1 followed by incubation with buffer 2 (Buffer 1 with 5 mM ATP, 15 mM MgCl2) for 1 hour at 4°C. Sepharose GST beads were washed twice with buffer 1 supplemented with 200 mM NaCl and once with P5 buffer (50 mM NaHPO4 pH 7.0, 500 mM NaCl, 10% glycerol, 0.05% Triton-X-100, 5 mM imidazole) followed by cleavage with PreScission protease (60 U/ml, GE Healthcare Life Sciences), overnight at 4°C in P5 buffer. Supernatant was then collected and completed to 10 mL with Flag binding buffer (50 mM Tris-HCl pH 7.5, 150 mM NaCl, 1 mM EDTA, 10% glycerol, 0.025% Triton X-100) before to incubate with 600 μl of M2 anti-Flag affinity gel (Invitrogen) for 1 hour at 4°C. Beads were washed twice with washing buffer (Flag binding buffer supplemented with 100 mM NaCl). After two additional washes with Elution Flag buffer (50 mM Tris-HCl pH 7.5, 150 mM NaCl, 0.025% Triton X-100 and 10% glycerol), proteins were eluted twice in one volume of beads with Elution Flag buffer and 500 μg/ml of 3X-Flag peptide for 45 min at 4°C. Protein was then dialyzed in the storage buffer (20 mM Tris-HCl, pH 7.4, 200 mM NaCl, 10% glycerol, 1 mM DTT) and stored in aliquots at −80°C.
In vitro resection assay (BLM-DNA2)
In vitro resection experiments were performed using pUC18 DNA linearized with KpnI and then 3’ labeled with [α-32P] ATP and terminal deoxytransferase (NEB). Reactions were conducted using 50 nM of linearized DNA substrate in standard buffer (20 mM Na-HEPES pH 7.5, 0.05% Triton X-100, 100 μg/ml BSA). Buffer was supplemented with 2 mM ATP and 5 mM MgCl2 immediately before addition of the purified proteins. Reactions were initiated on ice by adding DYNLL1 WT or the mutant versions and transferred immediately to 37°C. After 5 min, the order of addition and incubation of the respective protein components were: MRN (10 nM, 5 min), RPA (100nM, 4 min), BLM (6.5 nM, 4 min) and DNA2 (10 nM, 45 min). Reactions were followed by proteinase K treatment for 1 hour. Products were analyzed on a 1% native agarose gel. Gels were dried on DE81 paper (Whatman) and signals were detected by autoradiography. Densitometric analyses were performed using the FLA-5100 phosphorimager (Fujifilm) and quantitated using the Image Reader FLA-5000 v1.0 software.
In vitro resection assay (MRN)
The dsDNA probe for the MRN gel was made by annealing the following two oligo followed by purification.
F:GGGCGAATTGGGCCCGACGTCGCATGCTCCTCTAGACTCGAGGAATTCGGTACCCCGGGTTCGAAATCGATAAGCTTACAGTCTCCATTTAAAGGACAAG
R:CTTGTCCTTTAAATGGAGACTGTAAGCTTATCGATTTCGAACCCGGGGTACCGAATTCCTCGAGTCTAGAGGAGCATGCGACGTCGGGCCCAATTCGCCC
For detailed methods please see (Moiani D et al. 2018)45.
SMART Assay
DNA fiber analysis was performed as previously described 46. Briefly, cells were transfected with siRNA for 48 h with bromodeoxyuridine (BrdU) in culture media to label all genomic DNA. After 48 hours treatment with 10 uM Olaparib, cells were spotted on a slide followed by lysis with lysis buffer (200 mM Tris-HCl [pH 5.5], 50 mM EDTA, and 0.5% SDS), the denature step for normal BrdU staining was skipped so that BrdU antibody will only recognize ssDNA labled with BrdU. After three washes in water, slides were processed for immunofluorescence. Coverslips were blocked for 1 h in PBS containing 1% BSA. Incubation with primary antibodies rat anti-bromodeoxyuridine (BrdU) (BD Biosciences) and mouse anti-dsDNA antibody (Millipore) was done in PBS containing 1% BSA for 1 h at 37°C. Coverslips were washed three times in PBS followed by incubation with secondary antibodies goat anti-rat IgG Alexa fluor 488 and donkey anti-mouse IgG Alexa fluor 594 (both Life Technologies) for 1 h at 37°C. Coverslips were mounted on slides with DAPI Fluoromount-G (Southern Biotech). Images were analyzed using ImageJ software.
RNA purification and qPCR
RNA was purified using TRIzol reagent (Invitrogen) according to the manufacturer’s protocol. cDNA was generated from 1 μg of purified RNA using a Quanta Biosciences qScript cDNA Synthesis Kit according to the manufacturer’s protocol. One microliter out of 20 μl cDNA was used to perform qPCR using the NEB supermix with the following gene specific primers:
BLM forward 1 (GTGTTACACCACCCCAAAGTC),
BLM reverse 1 (GGAGGCAAATCAGTCTTTACTG),
BLM forward 2 (GGACCTTGACACCTCTGACAG),
BLM reverse 2 (GGATTCAGCTCCTGCATACTC),
DNA2 forward 1 (GTGCCATACCTGTCACAAATC),
DNA2 reverse 1 (GAAGGACCGACAAGTTTCTGTC),
DNA2 forward 2 (CAGAAACTTGTCGGTCCTTCC),
DNA2 reverse 2 (GTGGAAGAACAGAACTAAGGTAGG),
EXO 1 forward 1 (CTAGCCAAAGGTGAACCTACTG),
EXO1 reverse 1 (GTGTGATATTGATAGACCGGGTG),
EXO1 forward 2 (CCTCGTGGCTCCCTATGAAG),
EXO1 reverse 2 (CTAGGAGATCCGAGTCCTCTG),
NBN forward 1 (TGGAGCAGGAAAACTTCCAC),
NBN reverse 1 (GATTTCCTGCCTTAGCCACT),
NBN forward 2 (CACTCACCTTGTCATGGTATCAG),
NBN reverse 2 (CTGCTTCTTGGACTCAACTGC),
MRE11A forward 1 (CTTGTACGACTGCGAGTGGA),
MRE11A reverse 1 (TTCACCCATCCCTCTTTCTG),
MRE11A forward 2 (GCTCTTCCTCTTTGAGACCC),
MRE11A reverse 2 (TCTGCCTTTAGTGCTGATGAC),
Rad50 forward 1 (CAGGAGGGAAATCTCCAGTACAA),
Rad50 reverse 1 (TTTGGTTGGACCCAATGGGG),
Rad50 forward 2 (TACTGGAGATTTCCCTCCTGG),
Rad50 reverse 2 (AGACTGACCTTTTCACCATGC).
Genomic and transcriptomic analysis
Genomic and transcriptomic data for chemo-resistant, high-grade serous ovarian cancer (HGSC) was obtained from the Australian Ovarian Cancer Study cohort (OV-AU), and Pancreatic Cancer Endocrine neoplasms (PAEN-AU) cohorts which are part of the International Cancer Genome Consortium (ICGC). Inactivating germline or somatic mutations in genes associated with homologous recombination repair, or BRCA1 methylation, were detected collectively in half of the primary tumors. For these cohorts, somatic structural variations (SV; duplications, deletions, inversions, intra- and inter-chromosomal translocations) were identified using qSV (PMCID: PMC4523082) from the whole genome sequencing data for 93 and 33 patients respectively. There were 48 to 2431 (median: 292) SVs per sample in the ovarian cohort and nd 4-154 (median: 18) SVs per sample in the pancreatic cohort . RNAseq based expression data was also available for these tumors from the ICGC data portal (https://dcc.icgc.org/). We grouped the samples into 4 categories based on combinatorial high (above median) and low (below median) expression of BRCA1 and DYNLL1 this enabled us to analyze samples with BRCA deficiency due to classic BRCA1 inactivation/loss as well as those potentially mediated by other mechanisms (e.g. promoter hypermethylation). Statistical analysis was performed using R.
Plasmids and transfection
Two CRISPR guide RNAs were selected from GeCKO library. sgRNAs targeting ATMIN and DYNLL1 locus were cloned in pLentiGuide-puro vector (Addgene 52963). 24 h after transduction, cells were selected with puromycin. Unless otherwise mentioned, stable and transient transfections were performed using Lipofectamine 2000 (Invitrogen) or Fugene 6 (Promega) following the manufacturer’s instructions.
Immunoprecipitation
Unless otherwise mentioned, proteins were immunoprecipitated from whole-cell extracts. Briefly, cells were collected, washed and lysed for 30 min in a buffer containing 20 mM Tris-HCl (pH 7.65), 300 mM NaCl, 0.5% NP-40, 5 mM EDTA, 5% glycerol and protease and phosphatase cocktail inhibitors (Roche). Protein concentration from cleared supernatants was estimated using Bradford assay (Biorad). 2 mg of whole-cell extracts were incubated on a roller for 16 h at 4 °C with anti-Flag- (Sigma). Resins were washed five times with TGN buffer (20 mM Tris-HCl (pH 7.65), 150 mM NaCl, 3 mM MgCl2, 10% glycerol, 0.5% NP-40). Eluted proteins were analysed by immunoblotting.
GST pull-down
GST or GST-DYNLL1-S88D bound on Glutathione Sepharose beads (GE Healthcare) were incubated in 500 μL of GSTB buffer (50 mM Tris-HCl pH 7.4, 150 mM NaCl, 0.5% NP40, 5 mM NaF, 1 mM Na3VO4, protease inhibitor cocktail (Roche), 1 mg/ml BSA) for 20 minutes at room temperature. MRE11 purified protein was then added to each reaction and incubated for 20 minutes at room temperature. Complexes were washed four times with GSTB buffer without BSA. Proteins were visualized by Western blotting using the indicated antibodies.
Data Availability Statement:
Authors can confirm that all relevant data are included in the paper and or its supplementary information files.
Extended Data
Extended Data Figure 1, Related to Fig. 1.
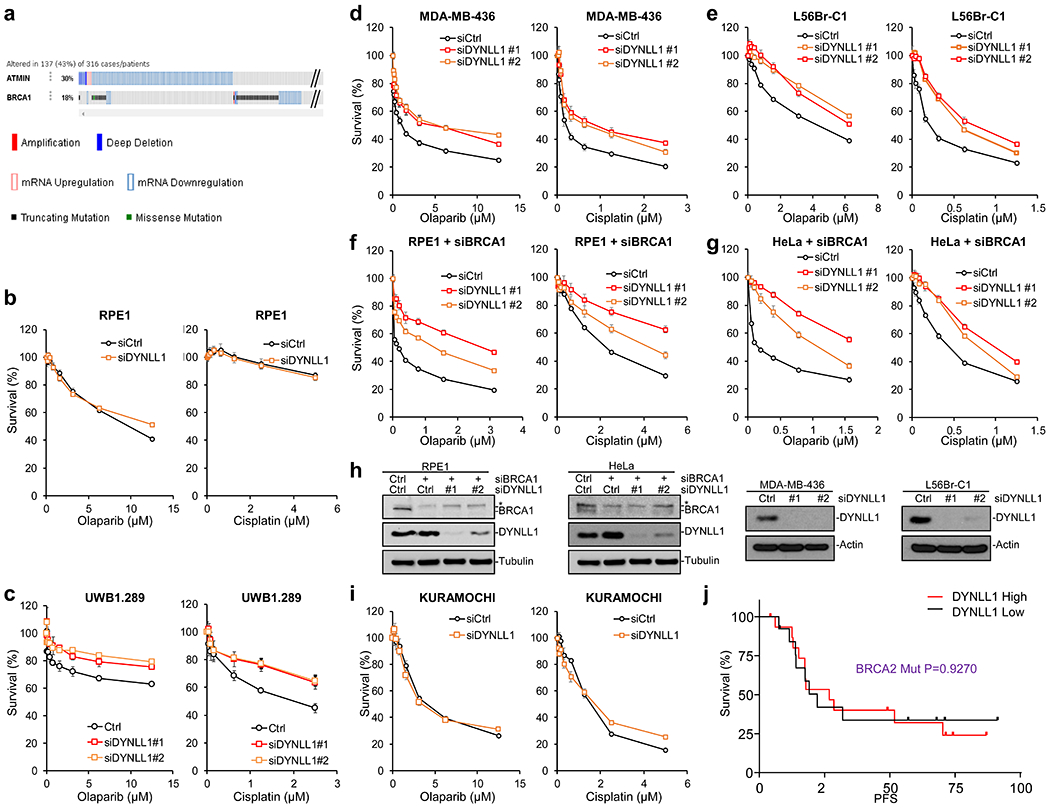
a, Comparison of ATMIN and BRCA1 alterations in Ovarian Cancer according to TCGA data (316 samples, Nature, 2011) from the cBioPortal. Red bar, Amplification. Blue bar, Deep deletion. Red square, mRNA Upregulation. Blue square, mRNA Downregulation. Gray bar, no mutation. Green square, missense mutation. Black square, truncating mutation. b, Survival assay of RPE1 with siCtrl and siDYNLL1. c-e, Survival assay of BRCA1-mutant cells UWB1.289, MDA-MB-236 and L56Br-C1 treated with olaparib and cisplatin, transfected with siCtrl and siDYNLL1. f, g Survival assay of BRCA1 siRNA transfected RPE1 and Hela cells treated with olaparib and cisplatin, co-transfected with siCtrl and siDYNLL1. h, Immuno-blots showing depletion of DYNLL1 and BRCA1. Experiments were repeated independently with similar results for 3 times. i, KURAMUCHI with siCtrl and siDYNLL1, treated with Olaparib or Cisplatin. For all panels, data is represented as mean SEM from three different experiments. j, Progression Free Survival (PFS) of ovarian carcinoma patients with BRCA2 mutation based on above or below median expression values of DYNLL1 (DYNLL1 high n=14, DYNLL1 low n=18, Source: Ovarian cancer, TCGA Dataset Nature 2011). Statistical significance was assessed by the one-sided Mantel–Cox test with P-value as indicated.
Extended Data Figure 2, Related to Fig. 2.

Immunofluorescence and quantification of RAD51 foci (a and b) and RPA32 foci (c) in Cov362 cells and Cov362 DYNLL1−/− cells exposed to 5Gy IR. Staining for Rad51 is 6 h and RPA32 is 4 h after IR. For panel a, N=105, unpaired t test two tailed for Ctrl and sgDYNLL1#1 p-value < 0.0001. for Ctrl and sgDYNLL1#2 p=0.0003, for sgDYNLL1#1 and sgDYNLL1#2 p=0.5679. In (b) Cov362 cells and Cov362 DYNLL1−/− cells were also transfected with control siRNA and siBRCA1, immunoblot (left panel). Data is represented as mean SEM from three different experiments (n=100). For panel c, N=100, unpaired t test two tailed for Ctrl and sgDYNLL1#1 p-value = 0.0002. for Ctrl and sgDYNLL1#2 p<0.0001, for sgDYNLL1#1 and sgDYNLL1#2 p=0.5679. d, immunoblot of Cov362 and Cov362 DYNLL1−/− cells after 10 uM Olaparib treatment for 48 h with indicated antibodies. Experiments were repeated independently for 3 times with similar results. e, Analysis of 53BP1 foci as shown in Fig.2b from Cov362 cells and Cov362 DYNLL1−/− cells treated with 10 uM Olaparib for 24 h. Data is represented as mean SEM from three different experiments (n=102 cells of each genotype). f-h, Immunofluorescence and quantification of 53BP1 foci (f) n=95 p=0.1019 unpaired t test two sided, RPA32 foci (g) n=100 p=0.0238 unpaired t test two sided and RAD51 foci (h) n=94 p=0.3161 unpaired t test two sided in RPE1 cells transfected with siCtrl and siDYNLL1 exposed to 5Gy IR. Staining for 53BP1 is 1 h, Rad51 is 6 h and RPA32 is 4 h after IR. For all panels, data is represented as mean SEM from three different experiments.
Extended Data Figure 3, Related to Fig. 3.

a, Samples from the Pancreatic Cancer Endocrine neoplasms (PAEN-AU) were grouped into 4 categories based on combinatorial high (above median) and low (below median) expression of BRCA1 and DYNLL1, frequency of somatic structural variations (SV) (left panel) and frequency of intra-chromosomal SVs (deletion/Duplication/ Insertion/ Intra-Chromosomal Translocation) (right panel) were plotted. b, Samples from the PAEN-AU (32 samples) cohort were grouped into 4 categories based on combinatorial high (above median) and low (below median) expression of BRCA1 and DYNLL1 (left panel) or expression of BRCA1 and 53BP1 (right panel). Frequency of homologous sequence discovered in the junction of Deletion + Duplication/ Insertion/ Intra-Chromosomal Translocation were plotted. For a and b panel, statistical differences (calculated using one sided Wilcoxon Rank Sum test) are indicated. In the boxplots, upper whisker is defined to be 1.5×IQR more than the third quartile and the lower whisker is defined to be 1.5×IQR lower than the first quartile respectively, where IQR is the difference between the third quartile and the first quartile, i.e. the box length. c, Quantification of mRNA level of indicated genes in Cov362 (ctrl) and Cov362 ATMIN−/−cells (sgATMIN). N=4, for all panels expression was normalized to actin, data is represented as mean SEM from 4 different experiments. Unpaired t test two-sided Ctrl vs #1 and Ctrl vs #2 for MRE11 are P=0.0335 and P=0.0038, for NBN are P=0.0152 and P=0.0257, for BLM are P=0.0130 and P=0.0203, for DNA2 are P<0.0001 and P=0.0179. d, Quantification of mRNA levels of indicated genes in Cov362 (ctrl) and Cov362 DYNLL1−/− (sgDYNLL1). N=6, for all panels expression was normalized to actin, data is represented as mean SEM from 6 different experiments. e, Quantification of subcellular fraction of indicated proteins (n=3) in Cov362 cells and Cov362 DYNLL1−/− cells. Total protein and chromatin bound protein was normalized to H2AX levels, and levels of indicated proteins in Cov362 DYNLL1−/− cells graphically represented relative to the control Cov362 cells. Data is represented as mean SEM. Unpaired t test two sided Ctrl vs #1 and Ctrl vs #2 for MRE11 are P<0.0001 and P<0.0001, for Rad50 are P=0.0035 and P=0.0007, for NBN are P<0.0001 and P<0.0001, for BLM are P<0.0001 and P<0.0001, for DNA2 are P=0.0002 and P<0.0001. f, Flag immunoprecipitation of FLAG-DYNLL1 and immunoblot with indicated antibodies. g, Immunofluorescence and quantification of DYNLL1 and -H2AX foci in RPE1 cells transfected with siCtrl and siDYNLL1, 1h after 5Gy IR. Experiments were repeated independently for 3 times with similar results. h, Immunoblot of DYNLL1 in RPE1 cells exposed to 5 Gy IR and sub-cellular fractionation at indicated times. Experiments were repeated independently for 3 times with similar results.
Extended Data Figure 4, Related to Fig. 4.

a, Structure of DYNLL1 dimer with potentially relevant residues indicated. b, Immunoprecipitation of indicated DYNLL1 mutants with 53BP1 and MRE11. Experiments were repeated independently for 3 times with similar results. c, Resection products of independent experiments WT or mutant recombinant DYNLL1 (purified proteins inner panel) with MRN-RPA-BLM-DNA2 and a [32] P-labeled linear 2.7kb dsDNA substrate. Experiments were repeated independently for 3 times with similar results. d, GST pull-down of GST-tagged DYNLL1-S88D incubated with purified human MRE11 or human DNA, EXO1, BLM, or the human RPA trimer (RPA70-RPA32-RPA14). Experiments were repeated independently for 3 times with similar results. e, Recombinant DYNLL1 WT protein was incubated with RPA-BLM and with a [32P]-labeled linear 2.7 kb dsDNA substrate to monitor DNA unwinding. Experiments were repeated independently for 3 times with similar results.
Supplementary Material
Acknowledgements
DC is supported NIH grants R01 CA208244 and R01CA142698, a Leukemia and Lymphoma Society Scholar grant, and the Claudia Adams Barr Program in Innovative Basic Cancer Research. DC and PK are supported by DOD W81XWH-15–0564/OC140632. YJH is supported by an AACR-AstraZeneca Ovarian Cancer Research Fellowship (17-40-12-HE). J.-Y.M. was supported by a CIHR foundation grant.
Footnotes
COMPETING FINANCIAL INTERESTS
The authors declare no competing financial interests.
REFERENCE
- 1.Bolton KL et al. Association between BRCA1 and BRCA2 mutations and survival in women with invasive epithelial ovarian cancer. JAMA 307, 382–390, doi:307/4/382 [pii] 10.1001/jama.2012.20 (2012). [DOI] [PMC free article] [PubMed] [Google Scholar]
- 2.Vencken PM et al. Chemosensitivity and outcome of BRCA1- and BRCA2-associated ovarian cancer patients after first-line chemotherapy compared with sporadic ovarian cancer patients. Annals of oncology : official journal of the European Society for Medical Oncology / ESMO 22, 1346–1352, doi:mdq628 [pii] 10.1093/annonc/mdq628 (2011). [DOI] [PubMed] [Google Scholar]
- 3.Yang D et al. Association of BRCA1 and BRCA2 mutations with survival, chemotherapy sensitivity, and gene mutator phenotype in patients with ovarian cancer. JAMA 306, 1557–1565, doi:306/14/1557 [pii] 10.1001/jama.2011.1456 (2011). [DOI] [PMC free article] [PubMed] [Google Scholar]
- 4.Bouwman P et al. 53BP1 loss rescues BRCA1 deficiency and is associated with triple-negative and BRCA-mutated breast cancers. Nat Struct Mol Biol 17, 688–695 (2010). [DOI] [PMC free article] [PubMed] [Google Scholar]
- 5.Bunting SF et al. 53BP1 inhibits homologous recombination in Brca1-deficient cells by blocking resection of DNA breaks. Cell 141, 243–254 (2010). [DOI] [PMC free article] [PubMed] [Google Scholar]
- 6.Callen E et al. 53BP1 mediates productive and mutagenic DNA repair through distinct phosphoprotein interactions. Cell 153, 1266–1280, doi: 10.1016/j.cell.2013.05.023 (2013). [DOI] [PMC free article] [PubMed] [Google Scholar]
- 7.Escribano-Diaz C et al. A Cell Cycle-Dependent Regulatory Circuit Composed of 53BP1-RIF1 and BRCA1-CtIP Controls DNA Repair Pathway Choice. Mol Cell, doi: 10.1016/j.molcel.2013.01.001 (2013). [DOI] [PubMed] [Google Scholar]
- 8.Xu G et al. REV7 counteracts DNA double-strand break resection and affects PARP inhibition. Nature 521, 541–544, doi: 10.1038/nature14328 (2015). [DOI] [PMC free article] [PubMed] [Google Scholar]
- 9.Gupta R et al. DNA Repair Network Analysis Reveals Shieldin as a Key Regulator of NHEJ and PARP Inhibitor Sensitivity. Cell, doi: 10.1016/j.cell.2018.03.050 (2018). [DOI] [PMC free article] [PubMed] [Google Scholar]
- 10.Dev H et al. Shieldin complex promotes DNA end-joining and counters homologous recombination in BRCA1-null cells. Nat Cell Biol, doi: 10.1038/s41556-018-0140-1 (2018). [DOI] [PMC free article] [PubMed] [Google Scholar]
- 11.Noordermeer SM et al. The shieldin complex mediates 53BP1-dependent DNA repair. Nature, doi: 10.1038/s41586-018-0340-7 (2018). [DOI] [PMC free article] [PubMed] [Google Scholar]
- 12.Mirman Z et al. 53BP1-RIF1-shieldin counteracts DSB resection through CST- and Polalpha-dependent fill-in. Nature, doi: 10.1038/s41586-018-0324-7 (2018). [DOI] [PMC free article] [PubMed] [Google Scholar]
- 13.Ghezraoui H et al. 53BP1 cooperation with the REV7-shieldin complex underpins DNA structure-specific NHEJ. Nature 560, 122–127, doi: 10.1038/s41586-018-0362-1 (2018). [DOI] [PMC free article] [PubMed] [Google Scholar]
- 14.Ray Chaudhuri A et al. Replication fork stability confers chemoresistance in BRCA-deficient cells. Nature 535, 382–387, doi: 10.1038/nature18325 (2016). [DOI] [PMC free article] [PubMed] [Google Scholar]
- 15.Guillemette S et al. Resistance to therapy in BRCA2 mutant cells due to loss of the nucleosome remodeling factor CHD4. Genes & development 29, 489–494, doi: 10.1101/gad.256214.114 (2015). [DOI] [PMC free article] [PubMed] [Google Scholar]
- 16.Rondinelli B et al. EZH2 promotes degradation of stalled replication forks by recruiting MUS81 through histone H3 trimethylation. Nat Cell Biol 19, 1371–1378, doi: 10.1038/ncb3626 (2017). [DOI] [PubMed] [Google Scholar]
- 17.Schlacher K et al. Double-strand break repair-independent role for BRCA2 in blocking stalled replication fork degradation by MRE11. Cell 145, 529–542, doi: 10.1016/j.cell.2011.03.041 (2011). [DOI] [PMC free article] [PubMed] [Google Scholar]
- 18.Lemacon D et al. MRE11 and EXO1 nucleases degrade reversed forks and elicit MUS81-dependent fork rescue in BRCA2-deficient cells. Nat Commun 8, 860, doi: 10.1038/s41467-017-01180-5 (2017). [DOI] [PMC free article] [PubMed] [Google Scholar]
- 19.Shalem O et al. Genome-scale CRISPR-Cas9 knockout screening in human cells. Science 343, 84–87, doi: 10.1126/science.1247005 (2014). [DOI] [PMC free article] [PubMed] [Google Scholar]
- 20.Shalem O et al. Genome-scale CRISPR-Cas9 knockout screening in human cells. Science 343, 84–87, doi: 10.1126/science.1247005 (2014). [DOI] [PMC free article] [PubMed] [Google Scholar]
- 21.Doench JG et al. Optimized sgRNA design to maximize activity and minimize off-target effects of CRISPR-Cas9. Nat Biotechnol 34, 184–191, doi: 10.1038/nbt.3437 (2016). [DOI] [PMC free article] [PubMed] [Google Scholar]
- 22.Planells-Cases R et al. Subunit composition of VRAC channels determines substrate specificity and cellular resistance to Pt-based anti-cancer drugs. EMBO J 34, 2993–3008, doi: 10.15252/embj.201592409 (2015). [DOI] [PMC free article] [PubMed] [Google Scholar]
- 23.Barbar E Dynein light chain LC8 is a dimerization hub essential in diverse protein networks. Biochemistry 47, 503–508, doi: 10.1021/bi701995m (2008). [DOI] [PubMed] [Google Scholar]
- 24.King SM Dynein-independent functions of DYNLL1/LC8: redox state sensing and transcriptional control. Sci Signal 1, pe51, doi: 10.1126/scisignal.147pe51 (2008). [DOI] [PubMed] [Google Scholar]
- 25.Jurado S et al. ATM substrate Chk2-interacting Zn2+ finger (ASCIZ) Is a bi-functional transcriptional activator and feedback sensor in the regulation of dynein light chain (DYNLL1) expression. The Journal of biological chemistry 287, 3156–3164, doi: 10.1074/jbc.M111.306019 (2012). [DOI] [PMC free article] [PubMed] [Google Scholar]
- 26.Johnson N et al. Stabilization of mutant BRCA1 protein confers PARP inhibitor and platinum resistance. Proceedings of the National Academy of Sciences of the United States of America 110, 17041–17046, doi: 10.1073/pnas.1305170110 (2013). [DOI] [PMC free article] [PubMed] [Google Scholar]
- 27.Lo KW et al. The 8-kDa dynein light chain binds to p53-binding protein 1 and mediates DNA damage-induced p53 nuclear accumulation. J Biol Chem 280, 8172–8179 (2005). [DOI] [PubMed] [Google Scholar]
- 28.Iacovoni JS et al. High-resolution profiling of gammaH2AX around DNA double strand breaks in the mammalian genome. The EMBO journal 29, 1446–1457, doi: 10.1038/emboj.2010.38 (2010). [DOI] [PMC free article] [PubMed] [Google Scholar]
- 29.Zhou Y, Caron P, Legube G & Paull TT Quantitation of DNA double-strand break resection intermediates in human cells. Nucleic acids research 42, e19, doi: 10.1093/nar/gkt1309 (2014). [DOI] [PMC free article] [PubMed] [Google Scholar]
- 30.Cruz-Garcia A, Lopez-Saavedra A & Huertas P BRCA1 accelerates CtIP-mediated DNA-end resection. Cell reports 9, 451–459, doi: 10.1016/j.celrep.2014.08.076 (2014). [DOI] [PubMed] [Google Scholar]
- 31.Patch AM et al. Whole-genome characterization of chemoresistant ovarian cancer. Nature 521, 489–494, doi: 10.1038/nature14410 (2015). [DOI] [PubMed] [Google Scholar]
- 32.Rayala SK et al. Functional regulation of oestrogen receptor pathway by the dynein light chain 1. EMBO reports 6, 538–544, doi: 10.1038/sj.embor.7400417 (2005). [DOI] [PMC free article] [PubMed] [Google Scholar]
- 33.Mazouzi A et al. A Comprehensive Analysis of the Dynamic Response to Aphidicolin-Mediated Replication Stress Uncovers Targets for ATM and ATMIN. Cell reports 15, 893–908, doi: 10.1016/j.celrep.2016.03.077 (2016). [DOI] [PubMed] [Google Scholar]
- 34.Rapali P et al. Directed evolution reveals the binding motif preference of the LC8/DYNLL hub protein and predicts large numbers of novel binders in the human proteome. PloS one 6, e18818, doi: 10.1371/journal.pone.0018818 (2011). [DOI] [PMC free article] [PubMed] [Google Scholar]
- 35.Rapali P et al. DYNLL/LC8: a light chain subunit of the dynein motor complex and beyond. FEBS J 278, 2980–2996, doi: 10.1111/j.1742-4658.2011.08254.x (2011). [DOI] [PubMed] [Google Scholar]
- 36.Puthalakath H, Huang DC, O’Reilly LA, King SM & Strasser A The proapoptotic activity of the Bcl-2 family member Bim is regulated by interaction with the dynein motor complex. Molecular cell 3, 287–296 (1999). [DOI] [PubMed] [Google Scholar]
- 37.Jaffrey SR & Snyder SH PIN: an associated protein inhibitor of neuronal nitric oxide synthase. Science 274, 774–777 (1996). [DOI] [PubMed] [Google Scholar]
- 38.Dundr M et al. Actin-dependent intranuclear repositioning of an active gene locus in vivo. The Journal of cell biology 179, 1095–1103, doi: 10.1083/jcb.200710058 (2007). [DOI] [PMC free article] [PubMed] [Google Scholar]
- 39.Lightcap CM et al. Biochemical and structural characterization of the Pak1-LC8 interaction. The Journal of biological chemistry 283, 27314–27324, doi: 10.1074/jbc.M800758200 (2008). [DOI] [PMC free article] [PubMed] [Google Scholar]
- 40.Song C et al. Serine 88 phosphorylation of the 8-kDa dynein light chain 1 is a molecular switch for its dimerization status and functions. The Journal of biological chemistry 283, 4004–4013, doi: 10.1074/jbc.M704512200 (2008). [DOI] [PubMed] [Google Scholar]
- 41.Jung Y, Kim H, Min SH, Rhee SG & Jeong W Dynein light chain LC8 negatively regulates NF-kappaB through the redox-dependent interaction with IkappaBalpha. The Journal of biological chemistry 283, 23863–23871, doi: 10.1074/jbc.M803072200 (2008). [DOI] [PMC free article] [PubMed] [Google Scholar]
- 42.Tkac J et al. HELB Is a Feedback Inhibitor of DNA End Resection. Molecular cell 61, 405–418, doi: 10.1016/j.molcel.2015.12.013 (2016). [DOI] [PubMed] [Google Scholar]
- 43.Buisson R et al. Cooperation of breast cancer proteins PALB2 and piccolo BRCA2 in stimulating homologous recombination. Nat Struct Mol Biol 17, 1247–1254, doi: 10.1038/nsmb.1915 (2010). [DOI] [PMC free article] [PubMed] [Google Scholar]
- 44.Yu Z et al. The MRE11 GAR motif regulates DNA double-strand break processing and ATR activation. Cell research 22, 305–320, doi: 10.1038/cr.2011.128 (2012). [DOI] [PMC free article] [PubMed] [Google Scholar]
- 45.Moiani D et al. Targeting Allostery with Avatars to Design Inhibitors Assessed by Cell Activity: Dissecting MRE11 Endo- and Exonuclease Activities. Methods Enzymol 601, 205–241, doi: 10.1016/bs.mie.2017.11.030 (2018). [DOI] [PMC free article] [PubMed] [Google Scholar]
- 46.Nieminuszczy J, Schwab RA & Niedzwiedz W The DNA fibre technique - tracking helicases at work. Methods 108, 92–98, doi: 10.1016/j.ymeth.2016.04.019 (2016). [DOI] [PubMed] [Google Scholar]
METHODS REFERENCES:
- 1.Shalem O et al. Genome-scale CRISPR-Cas9 knockout screening in human cells. Science 343, 84–87, doi: 10.1126/science.1247005 (2014). [DOI] [PMC free article] [PubMed] [Google Scholar]
- 2.Doench JG et al. Optimized sgRNA design to maximize activity and minimize off-target effects of CRISPR-Cas9. Nat Biotechnol 34, 184–191, doi: 10.1038/nbt.3437 (2016). [DOI] [PMC free article] [PubMed] [Google Scholar]
- 3.Callen E et al. 53BP1 mediates productive and mutagenic DNA repair through distinct phosphoprotein interactions. Cell 153, 1266–1280, doi: 10.1016/j.cell.2013.05.023 (2013). [DOI] [PMC free article] [PubMed] [Google Scholar]
- 4.Buisson R et al. Cooperation of breast cancer proteins PALB2 and piccolo BRCA2 in stimulating homologous recombination. Nat Struct Mol Biol 17, 1247–1254, doi: 10.1038/nsmb.1915 (2010). [DOI] [PMC free article] [PubMed] [Google Scholar]
- 5.Yu Z et al. The MRE11 GAR motif regulates DNA double-strand break processing and ATR activation. Cell research 22, 305–320, doi: 10.1038/cr.2011.128 (2012). [DOI] [PMC free article] [PubMed] [Google Scholar]
- 6.Moiani D et al. Targeting Allostery with Avatars to Design Inhibitors Assessed by Cell Activity: Dissecting MRE11 Endo- and Exonuclease Activities. Methods Enzymol 601, 205–241, doi: 10.1016/bs.mie.2017.11.030 (2018). [DOI] [PMC free article] [PubMed] [Google Scholar]
- 7.Nieminuszczy J, Schwab RA & Niedzwiedz W The DNA fibre technique - tracking helicases at work. Methods 108, 92–98, doi: 10.1016/j.ymeth.2016.04.019 (2016). [DOI] [PubMed] [Google Scholar]
Associated Data
This section collects any data citations, data availability statements, or supplementary materials included in this article.
Supplementary Materials
Data Availability Statement
Authors can confirm that all relevant data are included in the paper and or its supplementary information files.