Abstract
This paper introduces a novel compact low-power amperometric instrumentation design with current-to-digital output for electrochemical sensors. By incorporating the double layer capacitance of an electrochemical sensor’s impedance model, our new design can maintain performance while dramatically reducing circuit complexity and size. Electrochemical experiments with potassium ferricyanide, show that the circuit output is in good agreement with results obtained using commercial amperometric instrumentation. A high level of linearity (R2 = 0.991) between the circuit output and the concentration of potassium ferricyanide was also demonstrated. Furthermore, we show that a CMOS implementation of the presented architecture could save 25.3% of area, and 47.6% of power compared to a traditional amperometric instrumentation structure. Thus, this new circuit structure is ideally suited for portable/wireless electrochemical sensing applications.
Keywords: amperometric instrumentation, electrochemical sensor, low power, compact, current-to-digital readout
I. Introduction
Electrochemical sensors are widely used for environmental monitoring such as gaseous pollutants [1], and medical/healthcare diagnosis such as detection of antigen-antibody binding events, hybridized DNA, neuronal tissue, bacteria, glucose and enzymes reaction [2]. The most prevalent electrochemical sensor mode is the amperometric mode, in which the sensor reaction current is proportional to the analyte concentration. Recently, there is a trend in developing sensor microsystem for wireless, portable and implantable monitoring applications. These applications bring extreme requirements for instrumentation circuits in terms of power, area and cost, especially in applications that demand a large number of sensors [3].
Amperometric instrumentation consists of two parts: a potentiostat and a current readout circuit. The potentiostat provides current required for the reaction while maintaining the electrode/electrolyte interface at the correct potential. The current readout circuit conditions the electrochemical measurement and digitizes the reaction current. It is common to use bulky instrumentation to collect the amperometric readout. Many of the electrochemical instruments reported utilize commercial instrumentation and do not focus on the challenges of miniaturization for portable applications [4], [5]. However, the bulky instrumentation is expensive and not good for system miniaturization. Existing research has focused on optimizing individual parts (either potentiostat or readout circuit) for given power/size/resolution requirements [6]-[12], which help to push forward the circuit design for portable/wireless electrochemical sensing applications. However, no research has considered topology optimization from the perspective of the complete sensor-circuit system level. A great deal of recent research has focused on CMOS amperometric circuit designs for specific applications [13]-[21]. However, for many low volume and research applications, the economics of CMOS are not beneficial, and a simple amperometric circuit that is easy to build and can perform well without CMOS fabrication would be of great value.
This paper introduces a novel compact and low power amperometric instrumentation circuit topology that utilizes the inherent nature of electrochemical sensor interfaces to enable system-level optimization. The new amperometric circuit provides complete current-to-digital readout with reduced component count compared to traditional amperometric instrumentation. Specifically, our new topology saves two operational amplifiers (opamp) and one integrator capacitor, thus significantly lowering circuit power and area compared to a traditional design. Therefore, the new electrochemical instrumentation circuit is well suited for portable, wireless, and implantable sensory microsystem applications. This paper makes major reuse of the content published in Xiaoyi’s thesis [22] with permission.
Section II introduces the electrochemical sensor model and the traditional amperometric instrumentation circuit. Section III details the new compact amperometric instrumentation design concept. Section IV presents performance comparisons to traditional instrumentation circuits and evaluates the errors caused by model simplification. Circuit implementation and test results are shown in Section IV, and a conclusion is presented in Section V.
II. Electrochemical Sensor model and Traditional Amperometric Instrumentation Circuits
A. Electrochemical sensor and its equivalent circuit model
Electrochemical sensors in amperometric mode work under the following sensing principle: the reaction current is proportional to the analyte concentration when reacted electrode/electrolyte interface is biased at a constant voltage. To accurately control the reaction taking place at the interface, three-electrode cell configuration has been applied to amperometric electrochemical sensors. In such three-electrode cell, the reaction takes place at the interface between the working electrodes (WE) and electrolyte. A constant potential is maintained between the reference electrode (RE) and the WE. The third electrode, counter electrode (CE), provides a current path to the WE.
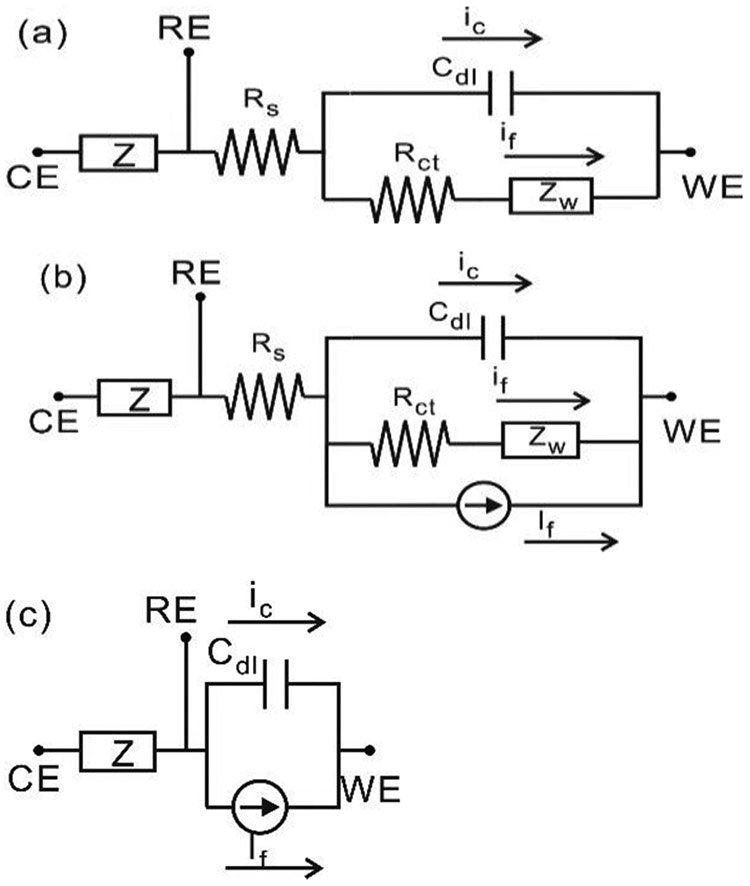
To analyze the electrochemical sensor’s electrical response, equivalent circuit models have been proposed in electrochemical impedance spectroscopy (EIS) theory. Randles circuit model [23], as shown in Fig. 1 (a), is a classic equivalent circuit model widely used to describe a three-electrode sensor. The impedance between the RE and the WE consists of an uncompensated solution resistor Rs (relatively small), in series with the parallel combination of the double layer capacitor Cdl at the WE interface (charging current iC follows through this path), and an impedance of a faradaic reaction caused by AC stimulus (AC faradaic current if follows through this path). The faradaic reaction consists of a charge transfer resistor Rct and Warburg element Zw which can be calculated as:
| (1) |
where Aw is the Warburg coefficient and ω is the angular frequency. Since our only interest is in the WE interface, the impedance between the CE and the RE is denominated as simple impedance Z. Notice that this model only represents sensor’s response to small AC stimulus. To represent both AC and DC response, a complete equivalent circuit model is shown in Fig. 1(b) [23], [24]. A current source is added to represent DC faradaic current If. Here, If is the constant reaction current proportional to the analyte concentration in amperometric electrochemical sensors, which is the main interest in sensor current measurements. In general, if ≪ If, and Rs is relative small. They can be considered as second-order effects in sensors response. For analysis simplicity, Rs and if,ac are omitted during following instrumentations derivation and will be re-discussed in Section III. The simplified model is shown in Fig. 1(c).
Fig. 1.
Equivalent circuit model of electrochemical sensor cell. (a) Randles model (b) Complete model considering both AC and DC stimulus. (c) Simplified model for circuit analysis.
B. Traditional amperometric instrumentationation
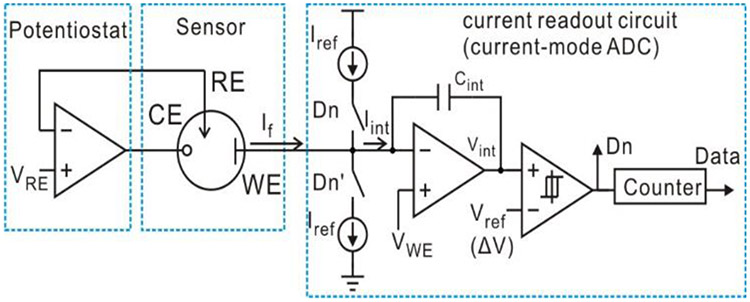
As introduced in Section I, the amperometric instrumentation circuit consists of two parts: a potentiostat and a current readout circuit. The potentiostat provides current from the CE to the WE while maintaining the voltage between the RE and the WE. A typical potentiostat can be implemented by a single opamp with appropriate connections [9], [25], [26]: the positive input node is connected with bias for the RE (VRE), the negative input node is connected to the RE, and the output is connected with the CE to provide the current path. The current readout circuit collects If either at the WE or the CE, then conditions and digitizes it. Two topologies have been used to implement the current readout circuit: a current-to-voltage convertor followed by a voltage-mode analog-to-digital convertor (ADC) [27] and a single current-mode ADC [11], [28]. Given the requirement of sensor applications for low power and low complexity, a model amperometric instrumentation circuit, as shown in Fig. 2, utilizes the single opamp for potentiostat design and the current-mode ADC for current readout design. In the current-mode ADC, two reference current sources Iref of opposite direction are alternately connected with the integrator through switches, which are controlled by the digital output of the hysteresis comparator Dn. Thus, the input current of the integrator Iint is given by
| (2) |
Fig. 2.
Schematic of a model amperometric instrumentation circuit including potentiostat and current-mode ΣΔ ADC.
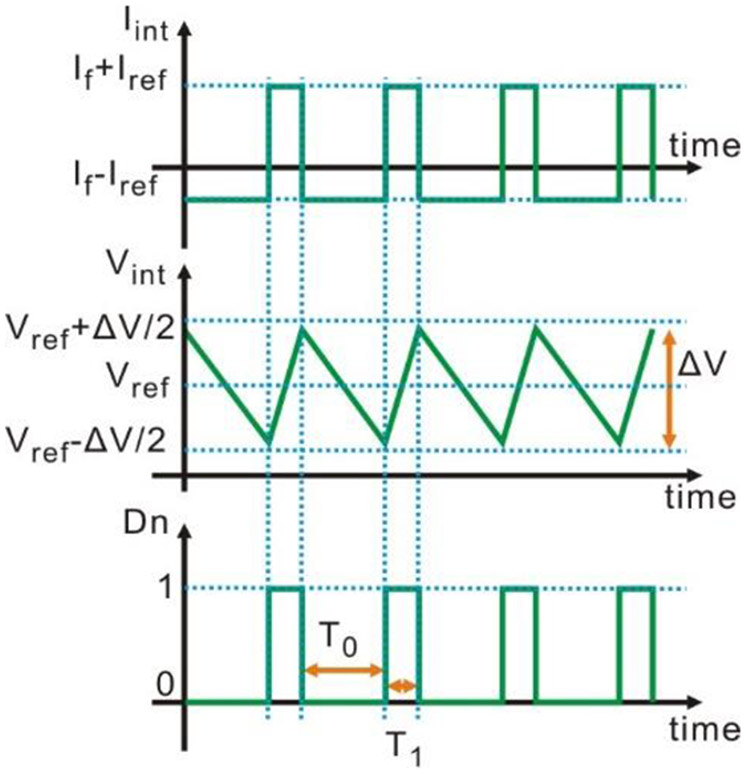
As the waveforms in Fig. 3 illustrate, the integrator capacitor is charged/discharged according to the direction of Iint. Consequently, the output of the integrator Vint rises/falls corresponding to Iint direction. While Vint reaches the hysteresis comparator upper/lower bound (Vref+/−ΔV/2) (where ΔV is the hysteresis window width and Vref is the reference voltage), Dn flips, changing Iint according to (2). The square waveform at the output of the hysteresis comparator is then digitized by a counter with the reference clock at a much higher frequency. The time interval T1 of the digital “high” for Dn is given by
| (3) |
and the time interval T0 of the digital “low” for Dn is
| (4) |
Fig. 3.
Waveforms of the current on the integrator input Iint, the voltage on the integrator output Vint, and the digital output of the comparator Dn.
From (3) and (4), If can be expressed as a function of Iref, T1, and T0 by
| (5) |
If the duty cycle α of Dn is defined as
| (6) |
then by combining (5) and (6), If can be expressed as a function of α and Iref given by
| (7) |
Therefore, given a known Iref, If is obtained by measuring duty cycle of Dn. Notice that If is independent of both the integrator capacitor Cint and the hysteresis comparator parameters (ΔV and Vref).
III. Compact Amperometric Instrumetation Design
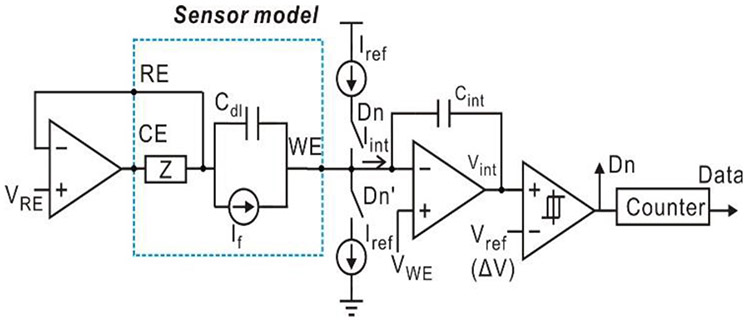
In the model amperometric instrumentation circuit in Fig. 2, replacing the sensor symbol with the simplified electrochemical sensor equivalent circuit model of Fig. 1(c) produces the fully electrical schematic of an electrochemical sensor system represented in Fig. 4. Notice that the sensor operates at the steady state when no current flows through Cdl and only If is collected in the readout circuit. From a system point of view, the sensor system contains two capacitors: Cdl and Cint. Cint is part of the readout circuit and used for charging/discharging; Cdl is the inherent interface capacitor. Since capacitors occupy large area in integrated circuits, if Cdl could be utilized to play the role of Cint, then Cint could be eliminated from the circuit to save area. Modifying the traditional structure to incorporate Cdl into the circuit and eliminate Cint, we develop a compact amperometric instrumentation topology.
Fig. 4.
Schematic of the electrochemical sensor system consisting of a model amperometric instrumentation circuit and the simplified electrochemical sensor equivalent circuit model.
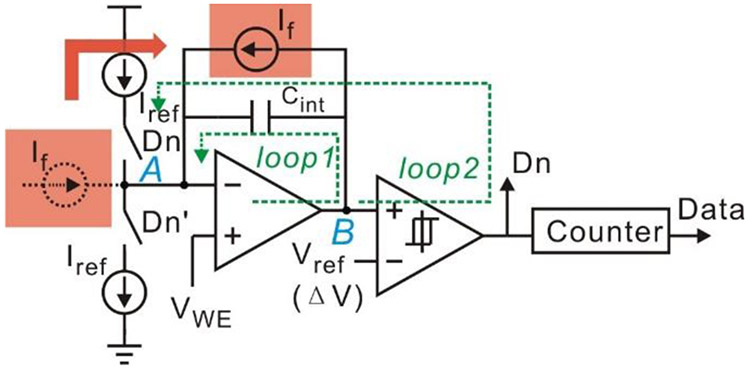
As shown in Fig. 5, a current source If can be used to represent the electrochemical sensor equivalent model. Given that node B is a low-impedance node, folding the current source to the output of the integrator is equivalent to the typical topology of the current readout circuit. Notice that the parallel connection of If and Cint is the same as the equivalent circuit between RE and WE in Fig. 1(c). Because the value Cint is arbitrary. If still can be calculated from (7) when Cint is replaced with Cdl.
Fig. 5.
Derivation of the instrumentation topology. The input current source is folded into parallel connection with the integrator capacitor.
To satisfy sensor’s bias condition, a potentiostat function is incorporated into the current-mode ADC by the following modification steps. First, by flipping the direction of If, and substituting Vref and VWE with VWE and VRE, the voltage between the RE and the WE can be held by feedback loops of the integrator (loop1) and of the ADC (loop2). Although WE potential is not strictly held constant due to a nonzero value of ΔV in the loop2, the perturbation on WE does not affect the sensor’s steady state as long as ΔV is set small enough (less than 10 mV) [29]. In addition, because current can only flow from the CE to the WE, node A should be connected to CE rather than RE.
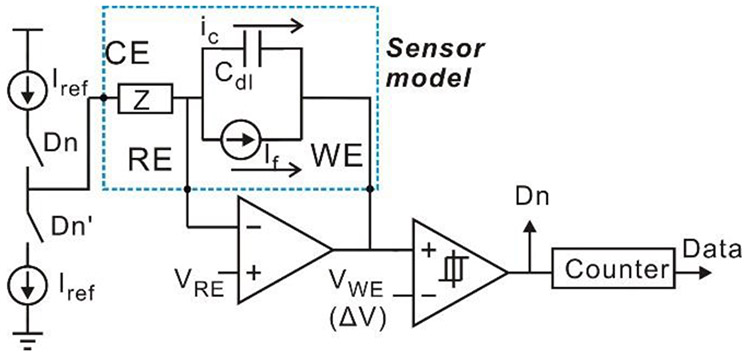
Following the modification described above, a modified amperometric instrumentation circuit with the sensor model can be illustrated as Fig. 6. Because the direction of the current source If is opposite from the direction of If in Fig. 5, If in Fig. 6 should be written as
| (8) |
Fig. 6.
Schematic of the modified amperometric instrumentation circuit with sensor equivalent circuit model.
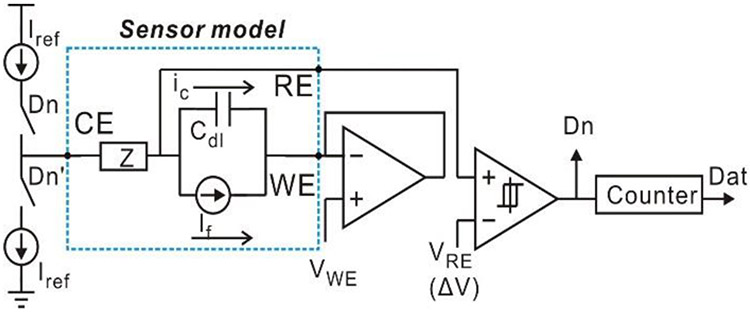
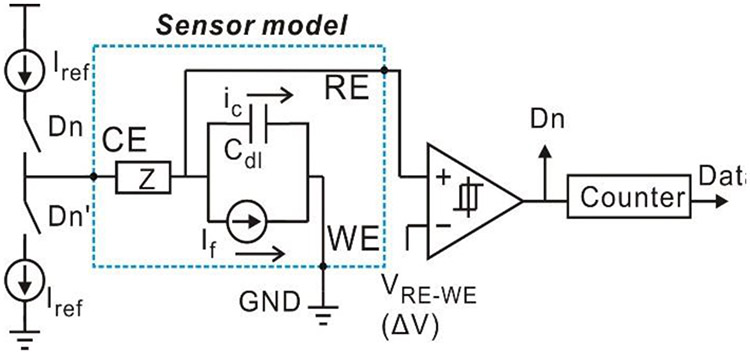
This topology successfully realizes the functions of both current-mode ADC and potentiostat. Compared to a traditional topology in Fig. 2, it utilizes Cdl for integrator, and eliminates one opamp required by the potentiostat and Cint required by the integrator. Notice that voltages at RE and WE in Fig. 6 are both held by the feedback loops and no constrains are required for VRE and VWE from circuit perspective. Therefore, nodes RE and WE are interchangeable. By swapping WE with RE, the simplified structure shown in Fig. 7 can be achieved. Notice that the WE is connected to a unit-gain buffer, and this buffer can be discarded for further simplification. By connecting the WE to ground and replacing VRE with VRE-WE, the resulting schematic in Fig. 8 defines a new compact current-to-digital amperometric instrumentation (CCDAI) topology. Here, it has been assumed that the sensor bias requires VRE>VWE and thus VRE-WE>0. If the sensor bias requires VRE<VWE, the WE could alternatively be connected to the power supply.
Fig. 7.
Schematic of the simplified compact amperometric instrumentation circuit with electrochemical sensor equivalent circuit model.
Fig. 8.
Schematic of CCDAI with electrochemical sensor equivalent circuit model.
Following the derivation from the schematic in Fig. 4 to the one in Fig. 8, the CCDAI topology was designed functionally equivalent to the traditional amperometric instrumentation, when the parameters of the hysteresis comparator in the CCDAI meet the following constraints: Vref is set to VRE-WE, and ΔV is set to 10mV.
IV. Performance Analysis
Although the function of the CCDAI is equivalent to the traditional amperometric instrumentation, structure differences and additional constrains will cause performance differences. In addition, as mentioned in Section I, the equivalent circuit used to derive the circuit topology was the simplified model in Fig. 1 (c). The sensors’ second-order effects should be fully considered in terms of performance. This section evaluates the performance of the CCDAI in two aspects: performance difference from the traditional amperometric instrumentation and performance affected by second-order elements in equivalent circuit model.
A. Performance relative to traditional amperometric instrumentation
Compared to the traditional potentiostat that drives the electrochemical cell from an opamp output, the CCDAI drives the electrochemical cell by a constant current source with much a lower current value. Therefore, it would take longer time to stabilize the electrochemical cell potential. Nevertheless, differences in the potential stabilization time would not affect steady state operation of the electrochemical cell.
Compared to a traditional current mode ADC, the main differences of the CCDAI include: 1). the integrator capacitor Cint is replaced by sensor’s double layer capacitor Cdl; 2). the hysteresis comparator voltage window is limited to 10mV. These two differences could affect the resolution of the calculated If. From (7), If is obtained by calculating measured α with a known Iref value. From (6), the resolution of α is determined by how short T0 and T1 are given a fixed counter reference clock frequency. From (3) and (4), T0 and T1 are proportional to Cdl and ΔV. Therefore, Cdl and ΔV do affect the resolution of If. Assuming ∣If∣<Imax, the given max time interval width is expressed by
| (9) |
For a fixed counter reference clock frequency f0, the maximum relative quantization error [28] is given by
| (10) |
The ADC’s effective resolution (in bits) N is determined by
| (11) |
Therefore, larger ΔV and Cdl would improve the effective resolution N. In the traditional current-mode ADC, ΔV can be up to the power supply voltage, Vdd, which can be 5V in a portable device. In the CCDAI, ΔV is restricted to maximum 10 mV. ΔV in the CCDAI is 500 times smaller than in the traditional current-mode ADC, resulting in 9 bits of effective resolution loss for the CCDAI. However, in the meantime, electrochemical double layer capacitor Cdl has much larger capacitance density than a capacitor that can be fabricated by CMOS process in a single IC chip. For instance, double layer formed on 1 mm2 electrode can generate μF level capacitance; while a capacitor in a single IC chip is up to tens of pF. The 10000 times larger capacitance in the CCDAI would result in 13 bits of effective resolution improvement for the CCDAI. Therefore, the total effect of Cdl and ΔV provides an improvement of around 4 bits of the effective resolution. As a tradeoff, the sampling rate drops as the effective resolution increases. Fortunately, electrochemical systems typically have a slow response and do not need a fast sampling rate.
B. Second-order effects of the sensor equivalent circuit model
The derivation in Section III was based on a simplified model in Fig. 1(c). Given a complete model in Fig. 1(b), an evaluation is needed to determine whether the solution resistor Rs and AC Faradaic components in the complete equivalent circuit model would introduce significant errors.
If we first consider adding Rs to the circuit, the corresponding waveform of Vint is illustrated in Fig. 9. Although the abrupt jump in Vint caused by Rs can be observed, this does not change T1 and T0. Thus (8) is still valid. However, the abrupt jump decreases the effective charging/discharging window from ΔV to ΔV - Iref·Rs. In a standard electrochemical cell configuration, the RE is placed close to the WE and a typical experimental value of Rs is on the order of 10 ~ 102 Ω. With μA level of Iref, this only gives 10 ~ 100μV error, which is less than 1% of 10 mV. Therefore, Rs has negligible impact on the resolution.
Fig. 9.
Vint waveform illustration when considering Rs in the equivalent circuit model.
Next, AC Faradaic components were evaluated. The AC Faradaic components are in parallel with the double layer capacitor Cdl and the DC Faradaic current source If. Because both the Warburg element and Cdl block DC current, only AC current if can pass through those AC Faradaic components. The sensor current Isens is the sum of the DC current If and the AC current ic + if. Observe that the sensor current Isens should be equal to the current provided by the current source at any time,
| (12) |
where T1 is the time interval when Dn = 1 in the CCDAI, T0 is the time interval when Dn=0 in the CCDAI. Here T1 and T0 do not follow (3) and (4). The waveform of Isens is illustrated in Fig. 10. Given the waveform in the time domain, Isens can also be expressed by Fourier series as
| (13) |
where fc = 1/(T1+T0). The first term in (13) represents the DC part of Isens, and the second term represents the AC part. Because the AC components (Cdl and Warburg elements) block DC currents, and DC current source blocks AC currents, If is equal to the DC part of Isens. Thus If is
| (14) |
Fig. 10.
Illustration of Isens in time domain.
Because (14) is identical to (7), one can conclude that the readout value of the CCDAI is the same as the result obtained in Section III, even when considering the complete electrochemical sensor equivalent circuit model.
V. Results
A. CCDAI implementation
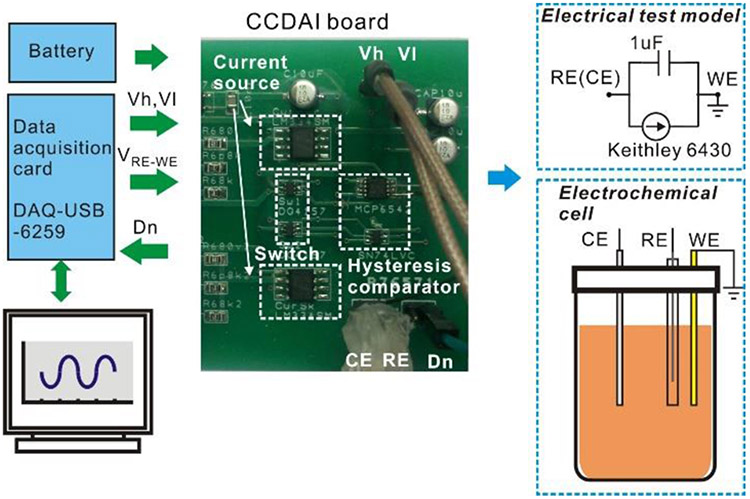
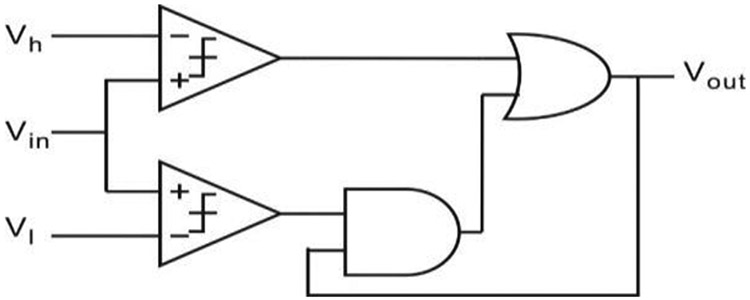
To verify the functionality and performance of the CCDAI, the test setup shown in Fig. 11 was built. The CCDAI was implemented on a printed circuit board with the following commercial IC chips: high precision current source (LM334SM (TI)), high speed switches (DG4157 (Vishay), turn on/off time ~ 22/8 ns), push-pull output comparator (MCP6542), and the buffer gate (SN74LVC). The circuit power supply was set to 5 V and current bias Iref was set to 1 μA, which are suitable values for a portable sensor application. To implement a hysteresis comparator with upper and lower bounds that can be adjusted independently during testing, the circuit shown in Fig. 12 was implemented using two comparators, an AND gate and an OR gate. A USB-6259 data acquisition card (National Instrumentations Inc.) was used to set the voltage on the reference electrode, VRE-WE, and the comparator’s upper/lower bound voltages, Vh and V1. It was also used to measure the time intervals T1 and T0 of comparator output Dn using an internal 10MHz clock. A Labview user interface was built for communication between a PC and the data acquisition card. The current If was calculated using (8) with the measured T1 and T0 values.
Fig. 11.
Test setup for electrical and chemical experiment.
Fig. 12.
A hysteresis comparator realization with adjustable upper/lower bound.
B. Experimental Results
To evaluate the ADC performance of the CCDAI, an electrical test model was connected with the CCDAI board. To implement the simplified model in Fig. 1(c), the electrical test model consisted of a 1 μF capacitor and a Keithley 6430 Source Meter connected in parallel. CE and RE were shorted in the test. The current readout accuracy of the CCDAI was tested by sweeping If from −800 nA to 800 nA with 2 nA step. Differential non-linearity (DNL) and integral non-linearity (INL) of the readout current are plotted in Fig. 13. The worst DNL equals to −56dB and the worst INL equals to −49dB, meaning that CCDAI achieves a resolution of better than 6nA, equivalent to 8 bits over the tested range. To increase the resolution of the CCDAI, tradeoffs with other performance metrics could be considered. For example, as shown in Eq. (11) the main factors to determine resolution are ΔV, Cdl, and f0. In theory, resolution will be enhanced by increasing ΔV. However, as described in Section III, ΔV has to be set to less than 10 mV to avoid inaccuracy in RE-WE voltage and degradation of the electrochemical result. Cdl is an inherent parameter of the electrochemical cell and is already much higher than the capacitors implemented on chip in conventional CMOS designs. The resolution could be enhanced by increasing f0 at the expense of higher power consumption. Considering this tradeoff, in our design, we set the f0 as 100 kHz. It is a remarkable fact that, increasing f0 for better resolution, not only increase the power consumption of the counter, but also increase the size of the counter to support greater number of bits. Therefore, by considering a fixed counter clock frequency of f0=100 kHz, 8 bit resolution has been implemented which enables us to reach 6 nA resolution. This resolution meets the requirements for many electrochemical sensor applications [30].
Fig. 13.
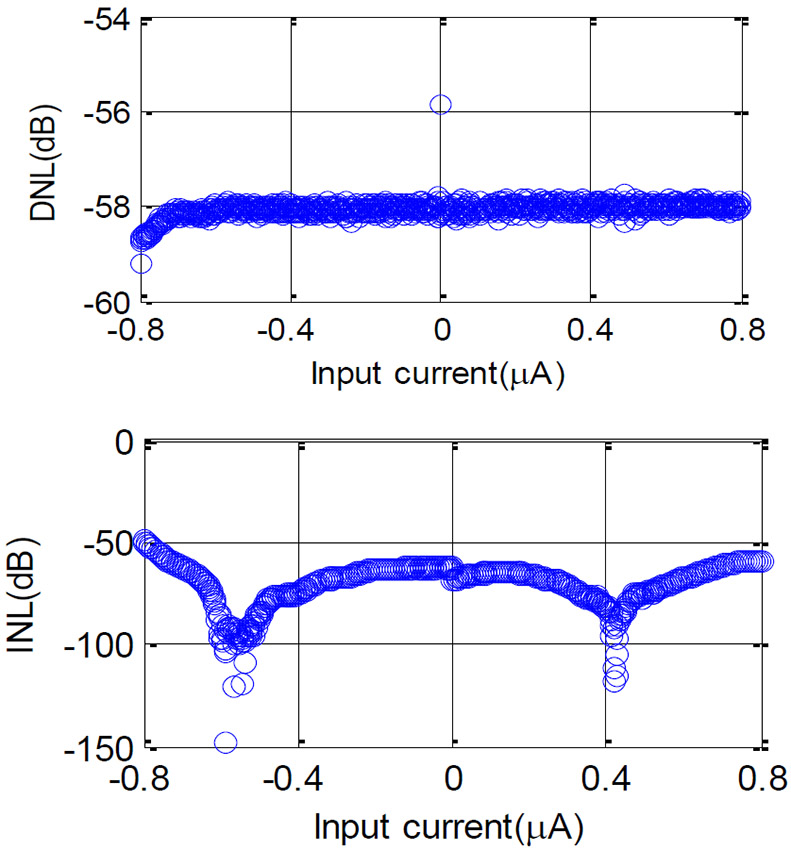
DNL and INL of the CCDAI. Both DNL and INL in the current range are better than −49dB, implying an 8 bit of effective resolution.
To verify the electrochemical functionality of the CCDAI board, an electrochemical test was performed using an electrochemical cell with potassium ferricyanide as the analyte. The electrolyte consists of 0.1M potassium chloride as buffer solution and potassium ferricyanide with varied concentrations (from 0 to 6 mM). Ag/AgCl (CH Instrumentations Inc.) was used as standard RE. Pt wire (CH Instrumentations Inc.) was used as the CE. Au plate with 1 mm2 area (CH Instrumentations Inc.) was used as the WE. VWE-RE was set to 190 mV.
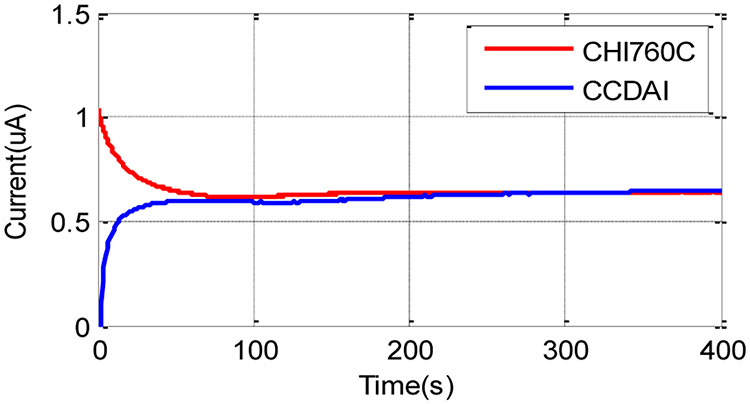
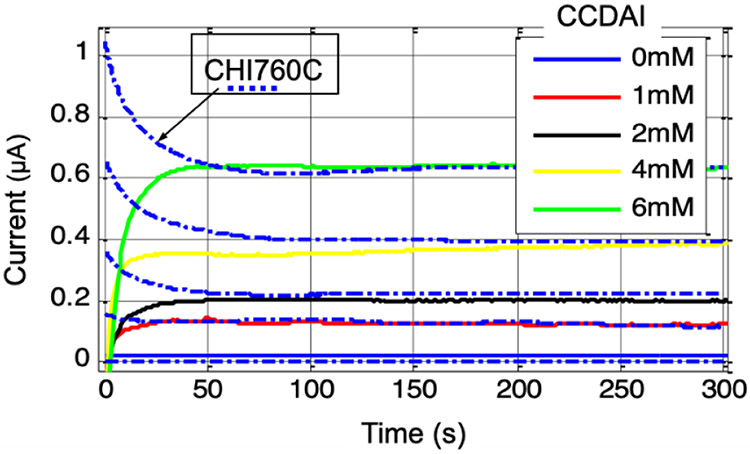
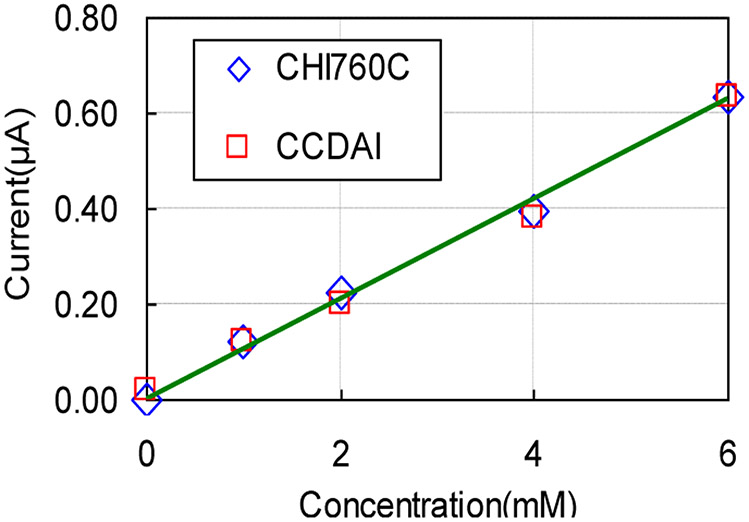
The faradaic current generated by potassium ferricyanide redox reaction was recorded by the CCDAI as a function of time. The commercial electrochemical instrumentation CHI760C was used as a reference to record current data at the same condition setup. As an example, data for a 6mM concentration is plotted in Fig. 14 and shows that both the currents recorded by CCDAI and CHI760C converged to the same level with negligible differences after the chemical system reached the steady state. The transit pattern differences are caused by the different stimulus provided by the two instrumentations. CHI760C applies large current to set the initial VWE-RE to the desired voltage in the very short time; while CCDAI applies a constant current to raise VWE-RE to the desired voltage in a gentle way. In addition, initial current recorded by CHI760C includes charging current caused by step stimulus, while current recorded by the CCDAI does not contain the charging current. Due to unavoidable convection in the solution [31], the currents at the steady state fluctuate slightly in amplitude. This phenomenon was observed from the data recorded by both instrumentations. Results obtained from the CCDAI at different potassium ferricyanide concentrations are plotted in Fig. 15. The data obtained from CHI760C are plotted as dot/dash curves as references. Steady state current values recorded by the CCDAI and by CHI760C have good agreements with negligible differences in all tested concentration cases. The average current values from 200 s to 300 s, which were recorded by CCDAI and CHI760C, were taken to plot the calibration curve as shown in Fig. 16. The least-squares correlation coefficients (R2) of the fitting curve are 0.991 and 0.996 for the data acquired by CCDAI and CHI760C respectively. The electrochemical experiment results demonstrate the functionality and the accuracy of the CCDAI.
Fig. 14.
The faradaic current generated by 6 mM of potassium ferricyanide as function of time when VWE-RE=190mV. Red line represents data recorded by CHI760C and blue line represents data recorded by CCDAI.
Fig. 15.
The faradaic current recorded by the CCDAI at VWE-RE=190mV as function of time for 0- 6 mM of potassium ferricyanide. The dot and dash curves present the data recorded by CHI760C for reference.
Fig. 16.
Calibration curve of faradaic current vs potassium ferricyanide concentration. The current values were the average values from 200s to 300s. Fitting curve was presented as a straight line. R2 values of the fitting line are 0.991 and 0.996 for the data acquired by CCDAI and CHI760C, respectively.
C. Analysis of area and power savings
The CCDAI realizes a compact topology while maintaining the functionality of a traditional amperometric instrumentation circuit. Compared to the model instrumentation circuit presented in Fig. 2, the CCDAI (Fig. 8) eliminates two opamps and one integrator capacitor. In microelectronic circuits, both of these components usually occupy larger area than comparators and current sources. In addition, opamps are a major source of power consumption in ICs. To provide a qualitative comparison. Table I and Table II lists the area and power consumption, respectively, of each component based on results from circuit blocks within a 0.5μm CMOS analog chip [32]. The total estimated area and power of the potential CCDAI chip and the model electrochemical circuit are shown in the last row of the tables. The CCDAI can be seen to reduce area by 25.3% and power consumption by 47.6% compared to the model amperometric instrumentation circuit. Area savings can be further improved using an advanced process node; the large area digital counter would be much smaller and the area savings due to CCDAI’s eliminating the integration capacitor would be amplified because capacitors do not scale with feature size. For further comparison, Table III shows performance characteristics of several amperometric instrumentation circuits that also target low power applications. In comparison, our CCDAI design demonstrates good resolution and power performance while potentially utilizing very low area.
TABLE I:
Area occupation of IC blocks in a 0.5μM CMOS fabrication process for comparison between the model amperometric instrumentation circuit and the CCDAI.
| Area(μm2) | Model | CCDAI | Savings | |
|---|---|---|---|---|
| Opamp | 1200 | 2 | 0 | |
| Comparator | 1000 | 1 | 1 | |
| Current source pair (with switch) | 600 | 1 | 1 | |
| 8-bit counter @100kHz | 12000 | 1 | 1 | |
| Capacitor(μF) | 2200 | 1 | 0 | |
| Total area(μm2) | 18200 | 13600 | 25% |
TABLE II:
Power consumption of IC blocks in a 0.5μM CMOS fabrication process for the comparison between the model amperometric instrumentation circuit and the CCDAI.
| Power@5V (μW) |
Model | CCDAI | Savings | |
|---|---|---|---|---|
| Opamp | 7.5 | 2 | 0 | |
| Comparator | 5 | 1 | 1 | |
| Current source pair (with switch) | 0.5 | 1 | 1 | |
| 8-bit counter @100kHz | 11 | 1 | 1 | |
| Capacitor(1pF) | N/A | 1 | 0 | |
| Total power(μW) | 31.5 | 16.5 | 47.6% |
TABLE III:
COMPARISON OF THE POTENTIOSTAT WITH PREVIOUS WORK.
| Work | Tech | Supply | Resolution | Power (μW) |
Area (mm2) |
|---|---|---|---|---|---|
| [13] 2014 | 2.5μm CMOS | 5V | ~μA | 25 | 6.44 |
| [14] 2016 | 0.18μm CMOS | 1.8V | 50-200nA | 71.7 | 0.0179 |
| [15] 2012 | 0.13μm CMOS | 1.2V | 150nA | 3 | 0.36 |
| [6] 2018 | PCB | 5v | ~μA | 12.6/CCM* 139/DCM* | |
| CCDAI | 0.5 μm CMOS | 5V | 16.5Δ | 0.0136Δ | |
| PCB | 5V | 6 nA | 25 |
CCM: Continuous current mode; DCM: Discrete current mode
Analytical calculation
VI. Conclusion
A novel compact amperometric instrumentation design with current-to-digital readout for electrochemical sensor was presented. Compared to a model amperometric instrumentation structure, the new design dramatically saves area, cost and power by utilizing the sensor’s double layer capacitor as a circuit element and adopting EIS mode, without sacrificing its resolution and detection of limitation performance. A board-level CCDAI was implemented and tested, demonstrating an 8-bit effective resolution in the range of −800 nA to 800 nA. Functionality of the instrumentation was verified by an electrochemical experiment in potassium ferricyanide. High linearity of current-to-concentration transfer was acquired with an R2 of 0.991. A CMOS implementation of the CCDAI is estimated to save 25.3% of area and 47.6% of power compared to the model amperometric instrumentation structure. Thus this new compact circuit topology is well suited for portable/wireless electrochemical sensor applications.
Acknowledgments
This work was supported by the National Institutes of Health under Grant NIH_R01ES022302 and the National Institute for Occupational Safety and Health (NIOSH) under Grant R01OH009644.
Contributor Information
Heyu Yin, Department of Electrical and Computer Engineering, Michigan State University, East Lansing, MI 48824, USA.
Ehsan Ashoori, Department of Electrical and Computer Engineering, Michigan State University, East Lansing, MI 48824, USA.
Xiaoyi Mu, Apple Inc., Cupertino, CA 95014, USA.
Andrew J. Mason, Department of Electrical and Computer Engineering, Michigan State University, East Lansing, MI 48824, USA.
References
- [1].Stetter JR, Korotcenkov G, Zeng X, Tang Y, and Liu Y, “Electrochemical gas sensors: fundamentals, fabrication and parameters,” Chem. sensors Compr. Sens. Technol, vol. 5, no. December, pp. 1–89, 2011. [Google Scholar]
- [2].Wang J, “Electrochemical biosensors: Towards point-of-care cancer diagnostics,” Biosens. Bioelectron, vol. 21, no. 10, pp. 1887–1892, 2006. [DOI] [PubMed] [Google Scholar]
- [3].Philipp S.-L. D. Kruppa, Alexander Frey, Ingo Kuehne, Schienle Meinrad, Norbert Persike, Thomas Kratzmueller, Hartwich Gerhard, “A digital CMOS-based 24×16 sensor array platform for fully automatic electrochemical DNA detection,” Biosens. Bioelectron, vol. 26, no. 4, pp. 1414–1419, 2010. [DOI] [PubMed] [Google Scholar]
- [4].Ekanayake EMIM, Preethichandra DMG, and Kaneto K, “An amperometric glucose biosensor with enhanced measurement stability and sensitivity using an artificially porous conducting polymer,” IEEE Trans. Instrum. Meas, vol. 57, no. 8, pp. 1621–1626, 2008. [Google Scholar]
- [5].Park J, Kim CS, and Choi M, “Oxidase-coupled amperometric glucose and lactate sensors with integrated electrochemical actuation system,” IEEE Trans. Instrum. Meas, vol. 55, no. 4, pp. 1348–1355, 2006. [Google Scholar]
- [6].Ghanbari S, Habibi M, and Magierowski S, “A High-Efficiency Discrete Current Mode Output Stage Potentiostat Instrumentation for Self-Powered Electrochemical Devices,” IEEE Trans. Instrum. Meas, vol. 67, no. 9, pp. 2247–2255, 2018. [Google Scholar]
- [7].Huang Y and Mason AJ, “A redox-enzyme-based electrochemical biosensor with a CMOS integrated bipotentiostat,” IEEE Biomed. Circuits Syst. Conf. BioCAS 2009, pp. 29–32, 2009. [Google Scholar]
- [8].Martin S, Gebara F, Strong TD, and Brown RB, “A low-voltage, chemical sensor interface for systems-on-chip: the fully-differential potentiostat,” 2004 IEEE Int. Symp. Circuits Syst. (IEEE Cat. No.04CH37512), vol. 4, no. 3, pp. 6–9, 2004. [Google Scholar]
- [9].Ahmadi MM and Jullien GA, “Current-mirror-based potentiostats for three-electrode amperometric electrochemical sensors,” IEEE Trans. Circuits Syst. I Regul. Pap, vol. 56, no. 7, pp. 1339–1348, 2009. [Google Scholar]
- [10].Ayers S, Gillis KD, Lindau M, and Minch BA, “Design of a CMOS potentiostat circuit for electrochemical detector arrays,” IEEE Trans. Circuits Syst. I Regul. Pap, vol. 54, no. 4, pp. 736–744, 2007. [DOI] [PMC free article] [PubMed] [Google Scholar]
- [11].Gore A, Chakrabartty S, Pal S, and Alocilja E, “A multichannel femtoampere-sensitivity conductometric array for biosensing applications,” Annu. Int. Conf. IEEE Eng. Med Biol. - Proc., vol. 53, no. 11, pp. 6489–6492, 2006. [DOI] [PubMed] [Google Scholar]
- [12].Aleeva Yana PBG, Giovanni Maira, Michelangelo Scopelliti, Vincenzo Vinciguerra, Graziella Scandurra, Gianluca Cannata, Gino Giusi, Carmine Ciofi, Viviana Figa, Occhipinti Luigi G., “Amperometric Biosensor and Front-End Electronics for Remote Glucose Monitoring by Crosslinked PEDOT-Glucose Oxidase,” IEEE Sens. J, vol. 18, no. 12, pp. 4869–4878, 2018. [Google Scholar]
- [13].Sutula S, Pallares Cuxart J, Gonzalo-Ruiz J, Munoz-Pascual FX, Teres L, and Serra-Graells F, “A 25-μW All-MOS potentiostatic delta-sigma ADC for smart electrochemical sensors,” IEEE Trans. Circuits Syst. I Regul. Pap, vol. 61, no. 3, pp. 671–679, 2014. [Google Scholar]
- [14].Mamun K. A. Al, Islam SK, Hensley DK, and McFarlane N, “A Glucose Biosensor Using CMOS Potentiostat and Vertically Aligned Carbon Nanofibers,” IEEE Trans. Biomed Circuits Syst, vol. 10, no. 4, pp. 807–816, 2016. [DOI] [PubMed] [Google Scholar]
- [15].Liao YT, Yao H, Lingley A, Parviz B, and Otis BP, “A 3-μW CMOS glucose sensor for wireless contact-lens tear glucose monitoring,” IEEE J. Solid-State Circuits, vol. 47, no. 1, pp. 335–344, 2012. [Google Scholar]
- [16].Li H, Sam Boling C, and Mason AJ, “CMOS Amperometric ADC with High Sensitivity, Dynamic Range and Power Efficiency for Air Quality Monitoring,” IEEE Trans. Biomed. Circuits Syst, vol. 10, no. 4, 2016. [DOI] [PMC free article] [PubMed] [Google Scholar]
- [17].Li H, Parsnejad S, Ashoori E, Thompson C, Purcell EK, and Mason AJ, “Ultracompact Microwatt CMOS Current Readout with Picoampere Noise and Kilohertz Bandwidth for Biosensor Arrays,” IEEE Trans. Biomed. Circuits Syst, vol. 12, no. 1, 2018. [DOI] [PMC free article] [PubMed] [Google Scholar]
- [18].Ghoreishizadeh SS, Taurino I, De Micheli G, Carrara S, and Georgiou P, “A Differential Electrochemical Readout ASIC with Heterogeneous Integration of Bio-Nano Sensors for Amperometric Sensing,” IEEE Trans. Biomed. Circuits Syst, vol. 11, no. 5, pp. 1148–1159, 2017. [DOI] [PubMed] [Google Scholar]
- [19].Nazari MH, Mazhab-Jafari H, Leng L, Guenther A, and Genov R, “CMOS neurotransmitter microarray: 96-channel integrated potentiostat with on-die microsensors,” IEEE Trans. Biomed. Circuits Syst, vol. 7, no. 3, pp. 338–348, 2013. [DOI] [PubMed] [Google Scholar]
- [20].Stanaćević M, Murari K, Rege A, Cauwenberghs G, and Thakor NV, “VLSI potentiostat array with oversampling gain modulation for wide-range neurotransmitter sensing,” IEEE Trans. Biomed. Circuits Syst, vol. 1, no. 1, pp. 63–72, 2007. [DOI] [PubMed] [Google Scholar]
- [21].Li H, Liu X, Li L, Mu X, Genov R, and Mason A, “CMOS Electrochemical Instrumentation for Biosensor Microsystems: A Review,” Sensors, vol. 17, no. 1, p. 74, December 2017. [DOI] [PMC free article] [PubMed] [Google Scholar]
- [22].Mu Xiaoyi, “Wearable Gas Sensor Microsystem for Personal Healthcare and Environmental Monitoring,” 2013. [Google Scholar]
- [23].Bard AJ and Faulkner LR, Electrochemical Methods: Fundamentals and Applications, vol. 8 2000. [Google Scholar]
- [24].Pettit CM, Goonetilleke PC, Sulyma CM, and Roy D, “Combining impedance spectroscopy with cyclic voltammetry: Measurement and analysis of kinetic parameters for faradaic and nonfaradaic reactions on thin-film gold,” Anal. Chem, vol. 78, no. 11, pp. 3723–3729, 2006. [DOI] [PubMed] [Google Scholar]
- [25].Martin SM, Gebara FH, Larivee BJ, and Brown RB, “A CMOS-integrated microinstrument for trace detection of heavy metals,” IEEE J. Solid-State Circuits, vol. 40, no. 12, pp. 2777–2786, 2005. [Google Scholar]
- [26].Levine PM, Gong P, Levicky R, and Shepard KL, “Active CMOS sensor array for electrochemical biomolecular detection,” IEEE J. Solid-State Circuits, vol. 43, no. 8, pp. 1859–1871, 2008. [Google Scholar]
- [27].Li L, Liu X, Qureshi WA, and Mason AJ, “CMOS amperometric instrumentation and packaging for biosensor array applications,” IEEE Trans. Biomed. Circuits Syst, vol. 5, no. 5, pp. 439–448, 2011. [DOI] [PubMed] [Google Scholar]
- [28].Kościelnik D and Miśkowicz M, “Asynchronous Sigma-Delta analog-to digital converter based on the charge pump integrator,” Analog Integr. Circuits Signal Process, vol. 55, no. 3, pp. 223–238, 2008. [Google Scholar]
- [29].M. E. O. and Tribollet B, Electrochemical Impedance Spectroscopy. Wiley, 2008. [Google Scholar]
- [30].Analog Devices, “Analog Devices Document,” 2013.
- [31].Plambeck JA, Electroanalytical Chemistry: Basic Principles and Applications. New York: Wiley, 1982. [Google Scholar]
- [32].Yang C, Jadhav SR, Worden RM, and Mason AJ, “Compact Low-Power Impedance Extractor and Digitizer for Sensor Array Microsystems,” IEEE J. Solid-State Circuits, vol. 44, no. 10, pp. 2844–2855, 2009. [Google Scholar]


