Abstract
Background
Transient loss of consciousness (TLOC) is a common reason for presentation to primary/emergency care; over 90% are because of epilepsy, syncope, or psychogenic non-epileptic seizures (PNES). Misdiagnoses are common, and there are currently no validated decision rules to aid diagnosis and management. We seek to explore the utility of machine-learning techniques to develop a short diagnostic instrument by extracting features with optimal discriminatory values from responses to detailed questionnaires about TLOC manifestations and comorbidities (86 questions to patients, 31 to TLOC witnesses).
Methods
Multi-center retrospective self- and witness-report questionnaire study in secondary care settings. Feature selection was performed by an iterative algorithm based on random forest analysis. Data were randomly divided in a 2:1 ratio into training and validation sets (163:86 for all data; 208:92 for analysis excluding witness reports).
Results
Three hundred patients with proven diagnoses (100 each: epilepsy, syncope and PNES) were recruited from epilepsy and syncope services. Two hundred forty-nine completed patient and witness questionnaires: 86 epilepsy (64 female), 84 PNES (61 female), and 79 syncope (59 female). Responses to 36 questions optimally predicted diagnoses. A classifier trained on these features classified 74/86 (86.0% [95% confidence interval 76.9%–92.6%]) of patients correctly in validation (100 [86.7%–100%] syncope, 85.7 [67.3%–96.0%] epilepsy, 75.0 [56.6%–88.5%] PNES). Excluding witness reports, 34 features provided optimal prediction (classifier accuracy of 72/92 [78.3 (68.4%–86.2%)] in validation, 83.8 [68.0%–93.8%] syncope, 81.5 [61.9%–93.7%] epilepsy, 67.9 [47.7%–84.1%] PNES).
Conclusions
A tool based on patient symptoms/comorbidities and witness reports separates well between syncope and other common causes of TLOC. It can help to differentiate epilepsy and PNES. Validated decision rules may improve diagnostic processes and reduce misdiagnosis rates.
Classification of evidence
This study provides Class III evidence that for patients with TLOC, patient and witness questionnaires discriminate between syncope, epilepsy and PNES.
Transient loss of consciousness (TLOC)—impairment of consciousness with real or apparent loss of awareness, amnesia for the period of unconsciousness, abnormal motor control, loss of responsiveness, and a short duration, with full spontaneous recovery, not because of head trauma1,2—is a commonly presenting complaint, accounting for 3% of UK emergency department (ED) attendances.3 Estimated lifetime prevalence is 50%.4 Over 90% are explained by one of 3 aetiologies: syncope, epilepsy, and psychogenic non-epileptic seizures (PNES). Diagnosis can be difficult as most patients are asymptomatic with no examination abnormalities by the time they are assessed by a clinician.3,5 Inter-ictal investigations are often uninformative or misleading.5,6 Individual features in a patient's history or witness descriptions (e.g., acquisition of ictal injuries or apparent occurrence from sleep) have been shown to distinguish between syncope and tonic-clonic seizures, but their ability to distinguish between the common diagnoses in unselected patient populations (including those with PNES or other types of epileptic seizures causing impaired consciousness) is unproven.7,8 Misdiagnoses are common, with estimates ranging from 25% to 42%.9–11 Correct diagnoses, especially of PNES, are often delayed by several years.12 Diagnostic errors put patients at risk of iatrogenic injury and death.12,13
Despite low sensitivity or specificity of individual clinical features in the differential diagnosis of TLOC, clusters of such features can discriminate between syncope, epilepsy, and PNES.8,14–17 The use of such clusters can be operationalised via clinical decision rules (CDRs) that quantify the contribution of different features to a pre-defined clinical threshold and provide criteria for different courses of action. Correctly employed in the appropriate setting, CDRs can improve clinical decision-making.18 While candidate CDRs for the diagnosis of TLOC have been suggested,16 none is endorsed in current management guidelines.4 Guidelines do, however, exist for risk stratification and management of syncope and seizures on first presentation,2,4 highlighting the importance for clinicians of reaching a working initial diagnosis for appropriate triage and ongoing management. There are a considerable range of candidate clinical features to discriminate between causes, but prospective validation of most is lacking.19 A CDR appropriate for use in primary care or ED settings would require a modest number of features jointly to discriminate between common diagnoses with a sufficient level of accuracy. We previously demonstrated that comprehensive TLOC symptom or witness observation profiles (captured by the 86-item Paroxysmal Event Profile [PEP] and the 31-item Paroxysmal Event Observer [PEO] questionnaire) could separate with a high level of accuracy between the 3 commonest causes of TLOC.14,20
One challenge in developing a CDR for TLOC is that simple scores assume features combine linearly—that a given clinical feature counts for or against a given diagnosis to the same degree irrespective of the presence/absence of other features. However, clinicians working with patients who experience TLOC will interpret features very differently depending on what others are also present (e.g., pre-ictal palpitations when accompanied by pallor and sweating may suggest syncope, but point to PNES when associated with a fear of dying). Such nonlinear combinations are hard to incorporate into simple scoring rules, but are easily handled by automated classifiers. A range of such tools is available in the machine learning literature, and previous work demonstrates their applicability to differentiating between causes of TLOC.15 While the more complex decision rules used by such classifiers require computer-based implementation, in an era of widespread smartphone availability and increasing use of electronic patient records, this should not present a barrier to implementation. Indeed, such computerized tools are widely used for other clinical problems in both primary care (e.g., QRISK21) and emergency (e.g., NELA [National Emergency Laparotomy Audit]22 and P-POSSUM [Portsmouth Physiological and Operative Severity Score for the enumeration of Mortality and morbidity]23) settings.
The purpose of the present study is to identify a manageable set of features suitable for a CDR for patients first presenting with TLOC and to evaluate the diagnostic performance of a classifier trained on these features. We perform this both for clinical scenarios in which a TLOC observer can provide witness information and for presentations in which TLOC occurred unobserved. The identification of a modest subset of diagnostic features from the extensive PEP and PEO questionnaires would help future development and validation of a CDR for TLOC in primary and emergency care settings.
Methods
Primary research question
We sought to determine whether a questionnaire based on witness and symptom reports of TLOC could be used to train a diagnostic classifier that could reliably distinguish between epilepsy, syncope, and PNES.
Patient recruitment
This study is based on data previously used to explore the discriminatory potential of TLOC symptom and witness observation profiles.14,20 Patients with diagnoses of epilepsy or documented PNES24 were identified from the clinical databases of the Department of Clinical Neurophysiology, Royal Hallamshire Hospital in Sheffield, UK, and the National Hospital of Neurology and Neurosurgery in London, UK. Typical episodes involving TLOC had been captured in all participants by video-EEG. Clinical diagnoses were made by a neurologist with a particular interest in seizure disorders and based on video-EEG findings as well as all other available clinical data. Some patients with syncope were identified from the same sources, but most had been diagnosed by the Falls and Syncope Service, Newcastle upon Tyne, UK. All diagnoses were made by experts, supported by pathophysiologic evidence (e.g., tilt-table testing results consistent with the diagnosis, or syncopal or presyncopal symptoms co-occurring with explanatory ECG or blood pressure changes). We have given further details on the recruitment method and formulation of “gold standard” diagnoses previously.14
From 2004 to 2009 we approached patients ≥16 years old with TLOC and a confirmed diagnosis of epilepsy, syncope, or PNES by post until we had received 100 completed questionnaires for each group. We asked participants to identify an observer of their events and ask them to complete and return a questionnaire about witness-observable TLOC manifestations.
Sample size
Neither our research question nor our proposed method of data analysis (see below) straightforwardly permits sample size calculations. Given the large number of potential predictor variables, we use methods designed for analysis of small-n large-p data sets (sample size n <<< number of predictor variables p) that demonstrate robust performance with smaller sample sizes and more predictors than in our data set.25
Questionnaires
Clinical and demographic features
Patients were asked to provide information about basic demographic features (age, sex), family history of blackouts, and 17 selected common cardiovascular or neurologic comorbidities.
Paroxysmal Event Profile
We asked patients to report the presence or absence of peri-episodal symptoms using the PEP, an 86-item questionnaire describing frequency of symptoms on a 5-point Likert scale (“always” to “never”). Construction, content, and diagnostic contribution of the PEP are described elsewhere.14 The PEP is available online (appendix 1, links.lww.com/CPJ/A131).
PEO questionnaire
We asked witnesses to describe episodes using the PEO questionnaire. The PEO includes questions on the duration of witness' acquaintance with the patient and the number of witnessed episodes, followed by 31 observable episode manifestations classified on a 5-point (“always” to “never”) Likert scale. Construction, content, and diagnostic contribution of the PEO are described elsewhere.20 The PEO is available online (appendix 2, links.lww.com/CPJ/A131).
Statistical analysis
To reflect the likelihood of many patients presenting with TLOC only having experienced one or very few episodes, we recoded Likert-scale frequency responses used in the PEP and PEO into binary “ever” (“always,” “sometimes,” “frequently,” “rarely”) or “never” (“never”) responses. We excluded questionnaire responses for items that would be unintelligible at first seizure presentation (e.g., age at onset, previous hospitalisations because of episodes), and also excluded age since we recruited syncope patients from a healthcare setting primarily attracting older adults.14 We then randomly assigned respondents to training and validation data sets in a 2:1 ratio (Using a sequence S = {s1,… sN} of N pseudo-random numbers [Mersenne Twister, seed = 0] with uniform distribution over the real-number interval [0,1]; nth patient was assigned to the training group iff sn ≤= 2/3; otherwise, the patient was assigned to validation).
For variable reduction, we utilised a technique recommended in consensus guidance on CDR construction:26 ensemble bootstrap-aggregation (using ensembles of classification trees, AKA a “random forest,” RF).27 We employed an iterative algorithm designed for small-n large-p genomics data sets based on RFs.28 Decision trees provide an easily interpretable supervised learning method for classification problems, but fitting algorithms tend to be unstable in their selection of variables in large-p data sets.28 Constructing ensembles of trees using bootstrap sampling and aggregation improves performance significantly.27 For feature selection, we trained a RF of 1000 trees (allowing all predictors to be sampled at each node split to improve discrimination between variables)25 and ranked predictor importance by an increase in out-of-bag prediction error with permutation of predictor values. We then trained progressively smaller RFs by removing the least-important 20% of predictors at each step and calculated the out-of-bag error for each RF. The selected set of variables is that which minimises the out-of-bag error (“0 standard error rule”). We performed this procedure twice: once using history, symptom, and witness report data (“witness–patient,” reflecting scenarios in which a TLOC patient presents with an observer of the event); and once using only history and symptoms (“patient-only,” to reflect scenarios in which no such observer is available). To evaluate predictive performance of the reduced-dimension model, we used the resulting RFs to classify patients in the validation sample into diagnoses of epilepsy, syncope, or PNES, and compared these to reference standard diagnoses.
All analyses were performed using MATLAB R2017b with Statistics and Machine Learning Toolbox (The MathWorks, Natick, MA). All code, including RF classifiers, is available from the authors on request.
Standard protocol approvals, registrations, and patient consents
Ethical approval for this study was granted by the Northern and Yorkshire Multi-Centre Research Ethics Committee.
Invitations, information sheets, and questionnaires were sent to potential participants as previously described,14 with specific information that return of completed questionnaires would be interpreted as consent to participate.
Data availability
All data and statistical analyses are available from the authors on request.
Results
Descriptive analysis
Three hundred respondents returned PEP questionnaires (219 female), 100 with each diagnosis. Of these, 249 also returned PEO (witness) questionnaires: 86 (64 female) had diagnoses of epilepsy, 84 PNES (61 female), and 79 syncope (59 female). The demographic characteristics of this subpopulation are similar to those of the whole study sample reported previously.14,20 Further details of between-group differences on individual PEP and PEO items are described elsewhere.14,20
For patient-only analysis the training group comprised 208 participants (73 epilepsy, 72 PNES, 63 syncope), of whom 149 were female, with the remaining participants assigned to validation. For witness/patient, the training group comprised 163 participants (58 epilepsy, 52 PNES, 53 syncope), of whom 114 were female; the validation group comprised the remainder.
Although 96.3% of questionnaire items were answered by respondents, 104/249 (41.8%) of participants had at least one missing value in their responses. RF analysis with surrogate splitting is robust to missing values.27
Feature selection
Witness/patient
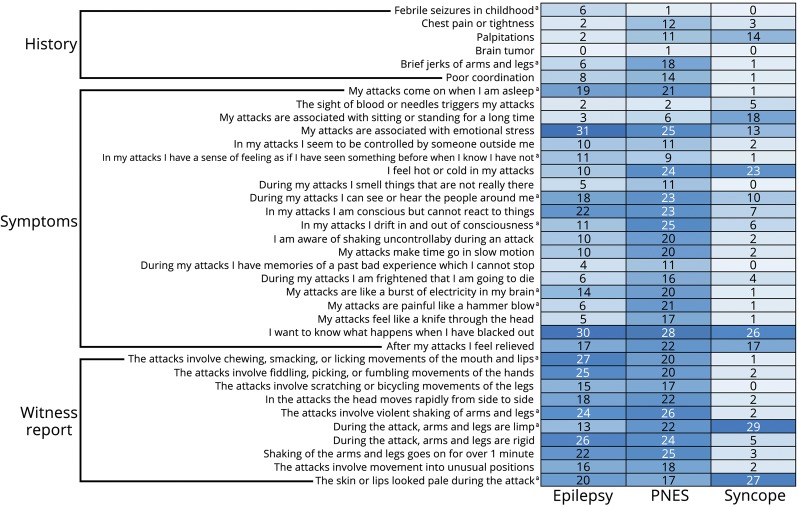
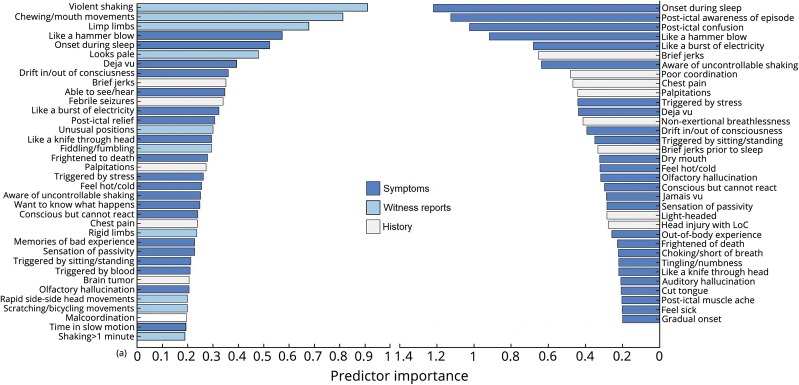
RF-based iterative feature selection identified 36 features that were jointly predictive of diagnosis (figure 1). These included: 6 historical or non-ictal complaints (35.3% of historical features inquired about); 20 peri-ictal symptoms (23.3% of PEP items); and 10 witness-reported signs (29.4% of PEO items). Relative importance of selected predictors is shown in figure 2A.
Figure 1. Features selected from patient and witness report data (N = 249).
Counts display percentage of patients reporting each feature by diagnosis. A darker colour indicates higher percentage reporting the feature as present.
Figure 2. Predictor importance (relative change in classification error with predictor permutation) for witness and patient data (A) and patient-only (B).
.
Patient-only
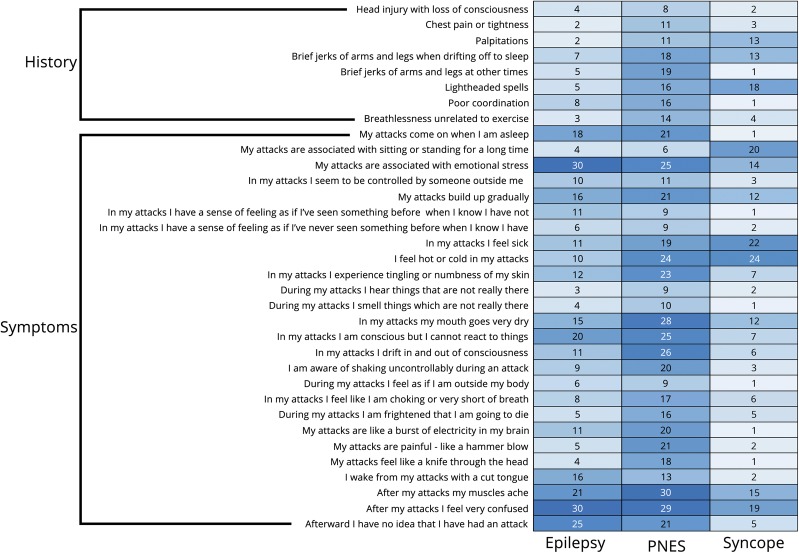
Feature selection identified 34 features (figure 3): 8 historical (47.1% of history questionnaire features) and 26 peri-ictal symptoms (30.2% PEP items). Relative importance is shown in figure 2B.
Figure 3. Features selected using only patient reports (N = 300).
Counts display percentage of patients reporting each feature by diagnosis. A darker color indicates higher percentage reporting the feature as present.
Predictor performance on validation sample
Witness/patient
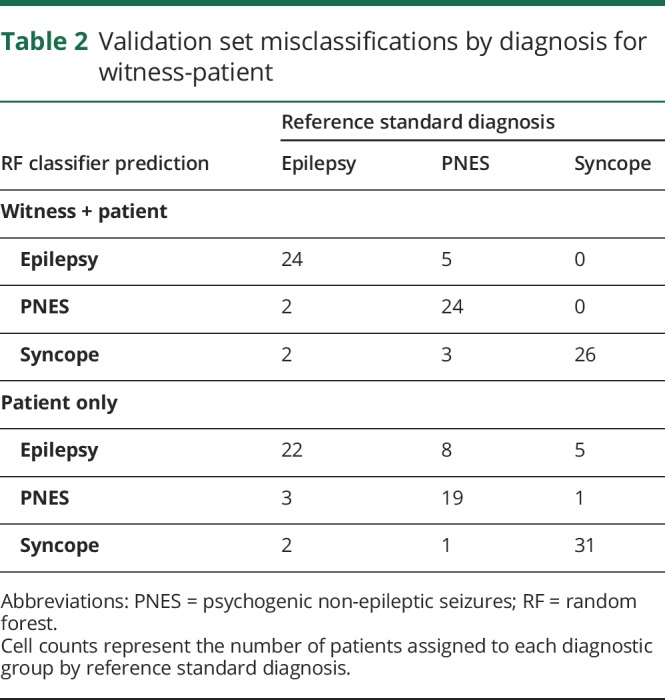
The 36-feature RF classified 74/86 (86.0%; 95% confidence intervals [CIs] 76.9%–92.6%) of patients in the validation sample correctly. Hundred percent of syncope diagnoses were identified correctly, 85.7% epilepsy and 75.0% PNES. Full predictor performance by diagnosis is summarised in table 1. Of patients who were incorrectly classified, equal numbers of patients with epilepsy were classified as syncope or PNES, while slightly more patients with PNES were classified as epilepsy than syncope (table 2).
Table 1.
Predictor performance of RF models (with 95% CIs) by reference diagnosis for witness-patient (N = 86) and patient-only (N = 92) classifiers (see text for definition of groups)
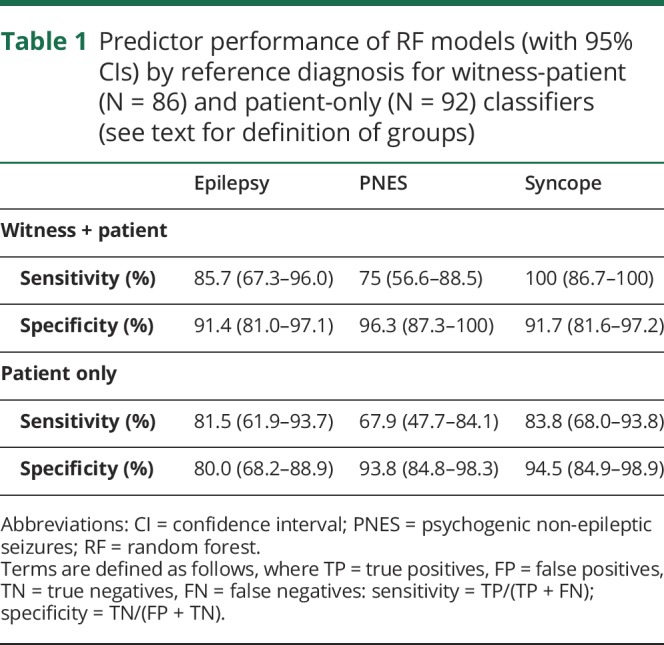
Table 2.
Validation set misclassifications by diagnosis for witness-patient
Patient-only
The 34-feature RF classified 72/92 (78.3%; 95% CI 68.4%–86.2%) of patients in the validation sample correctly (83.8% syncope, 81.5% epilepsy, 67.9% PNES). Of patients who were incorrectly classified, both PNES and syncope patients were more commonly classified as epilepsy than the alternative, while one more epilepsy patient was classified as having PNES than syncope (table 2).
Comparison of classifiers and sensitivity analysis
Comparison to regression-based classification
We compared the performance of the witness/patient RF against a multinomial logistic regression model that used the 36 predictors selected in our witness/patient variable reduction procedure. The RF outperformed the regression model (classification accuracy 77.9% vs 86.0%; McNemar's test for difference in performance p = 0.096). We provide further details in appendix e-3 (links.lww.com/CPJ/A131) (section 1).
Sensitivity analysis
We report post-hoc sensitivity analyses of the effects of selected witness and patient variables on classifier accuracy in appendix e-3 (links.lww.com/CPJ/A131) (section 2). Duration of witness acquaintance, number of events witnessed influenced, and time since onset of blackouts did not affect classifier accuracy. We found an association between number of events in the past year and classifier accuracy, which may be a consequence of the over-representation of PNES amongst participants reporting higher frequency of events.
Discussion
Our results demonstrate that, when both patient and witness reports are available, a CDR with a modest number of questions distinguishes very well between syncope and the 2 types of seizures. Pending validation, such a tool could be usefully employed in the ED or primary care to direct patients to either cardiological or neurologic investigation and referral. The CDR also provides some guidance for differentiating epilepsy from PNES. Previous studies suggest that questions about other domains (for instance, previous trauma, coping styles, current psychopathology) could improve the discrimination between epilepsy and PNES19; however, the inclusion of such questions might reduce patient acceptability of the CDR.15,29,30
The reduction in performance seen with patient-only classification emphasises the clinical importance of the collateral history. Included witness report features corresponded to semiological features previously used in the differential diagnosis of TLOC31; assessment of these features in witness reports thus remains clinically valuable, despite the fact that when considered individually, untrained observers may not report their presence reliably.7,32
Automated classification using RFs successfully reduces the number of predictor variables without sacrificing accuracy. Our RF classifier improved upon classification accuracy relative to regression-based methods using all features, even using a separate validation sample to control for overfitting.20 This may be because of the ability of machine learning methods such as RFs to exploit nonlinear interactions between predictors.15 The importance of nonlinear interactions to RF classification can explain some apparently anomalous divergences between features selected by our witness–patient and patient-only classifiers, for example that post-ictal unawareness or confusion are important features in the patient-only classifier but not selected in the witness-patient classifier. This suggests that when no witness data are available, these features contribute importantly to diagnosis, but in combination with information available from witnesses, other features become relatively more important.
Several previous attempts have been made to derive CDRs for diagnosis of TLOC although, to date, these have concentrated on the simpler problem of binary classification, as opposed to our 3-category approach which provides a finer classification. Direct performance comparison against these previously published offerings is therefore difficult; however, our results are largely consistent while offering notable theoretical and practical advantages. Our 36-feature RF includes all items of the 9-point regression-based CDR presented by Sheldon et al.16 except episodal diaphoresis (the PEP does not include pre-episodal sweating; post-episodal sweating had a negative predictor importance score on our analysis, indicating a negative contribution to correct classification). Sheldon et al. claim 94% sensitivity and specificity for the distinction between syncope and epilepsy (86.5% sensitivity and 92.1% specificity in independent prospective validation),33 but their CDR does not discriminate between epilepsy and PNES, their epilepsy group only included tonic-clonic seizures, and diagnoses in their study were not supported by objective findings during typical episodes. These limitations also apply to Hoefnagels et al.'s 4-feature regression-based score,34 which includes age as a predictor (we could not include age in our analysis because of sampling bias, as discussed further below). While our classifier was less successful in distinguishing epilepsy and PNES than syncope from either, results are comparable to those of Syed et al.15 who used a similar variable-reduction followed by machine-learning classification to use 53 questionnaire items to distinguish PNES from epilepsy with a sensitivity of 85%–94% and specificity of 83%–85%: more sensitive but less specific than ours (though their analysis included no syncope group). Their classifier included more extensive demographic details and a range of psychosocial variables, suggesting the potential for further improvement of performance through consideration of other non-historical variables.
Our feature selection identified important contributions to differential diagnosis from patient symptoms, past medical history, and witness reports. Consistent with previous reports, PNES patients endorsed a higher number of comorbid complaints.35,36 The classifiers included several features suggesting a greater preservation or fluctuating level of ictal consciousness in PNES patients than those with epilepsy, consistent with previous reports of post-event recall of ictal events and quantitative studies of ictal impairment of consciousness in epilepsy and PNES.37–39 Both classifiers highlighted the relevance of ictal panic and dissociative symptoms to identifying PNES, an association previously identified.14,40,41 Reported onset during sleep contributed to diagnosis in the symptoms-only model, being predictive of both epilepsy and PNES. This observation might be considered surprising given differences in sleep patterns between epilepsy and PNES42; however, while onset during EEG-confirmed sleep is highly predictive of epilepsy, onset from sleep-like states (“pre-ictal pseudosleep”) is common in PNES.31 Given our focus on original presentation, distinguishing between such states may be of limited value in this context,43 though potentially of importance in ongoing management.42
We stress the difference between diagnostic triage and risk stratification tools. Our CDR provides the former and may help to enable non-expert clinicians to consider whether a cardiological or neurologic diagnosis is more likely and so direct investigations and referral appropriately. Each of our diagnostic classes are, however, heterogeneous, and clinicians need to consider underlying aetiology and risk stratification within each condition. Existing guidance and candidate CDRs exist to help clinicians once they have established a working TLOC cause2,4,44,45; the function of tools such as ours is to aid clinicians in directing patients down the appropriate TLOC pathway.
Several important limitations to this study should be addressed in future work. Most notably, we recruited participants from secondary/tertiary care settings to which patients had been referred for further investigation of TLOC. These patients are likely to differ from those at first presentation of TLOC in numerous respects, including: duration and severity of symptoms, diagnostic difficulty, response to first-line treatment, and knowledge of their own diagnosis. Given the difficulty in establishing gold-standard diagnoses for causes of TLOC, these disparities are inevitable when seeking to obtain a patient sample with objectively confirmed diagnoses. It is important that certain groups may be under-represented in our sample (e.g., “low-risk” reflex syncope not requiring secondary care referral, idiopathic generalised epilepsies not requiring vEEG confirmation for clinically established diagnosis, or patients with very infrequent seizures that would be unlikely to be captured during vEEG assessment). Because of the case identification method, focal-onset seizures and neutrally mediated syncope are probably over-represented in our sample. This limitation emphasises the need for stringent validation of any such tool within the target clinical setting prior to routine application; furthermore, differences between primary care settings need also be taken into account.46 Our specific sampling procedure may also have introduced bias: age and population prevalence are both important in determining prior probabilities of different conditions,15,34 but because of sampling bias in recruitment location for our syncope patients these are not taken into account in our analysis. The sex distribution of our respondents also does not match that seen in the general population for all of the conditions; while it is unclear why our recruitment procedure might have introduced this bias, it may have influenced outcomes.
Another potential source of bias comes from the response rate (28.2%), which is at the lower end of response rates for medical research.47 This may in part be because of the lengthy nature of the questionnaire and the potentially sensitive nature of some of the questions included. The variable reduction performed in this paper would permit further research to utilise a shorter questionnaire, which should improve response rates in future research.47,48 There is also the potential for recall bias, as participants completed the questionnaire up to 5 years after diagnostic confirmation. However, only 16% of participants stated they had not had a blackout in the last year, suggesting that recall should be adequate in the majority of participants, and in our sensitivity analysis not having experienced any seizures in the past year did not affect classifier performance. In terms of analysis, ideally we would have used separate samples for variable selection, training, and validation; a larger total number of participants would have permitted this.
To demonstrate its theoretical ability to distinguish all classes, the presented RF was trained on equi-sized diagnostic classes and hence aims to minimize the overall error rate in this context. However, in practical primary or emergency care settings the proportion of patients presenting from each class is unlikely to be equal. In addition, the consequences of patient misclassification are of differential seriousness. Higher patient costs to misclassification of certain classes should also be taken into account in a CDR. To provide the best diagnostic tool for clinical practice, the training of our RF can be tuned to account for both these factors by reweighting/adapting the bootstrap sampling accordingly.
The dependence of our classifier on computer-assisted data processing could introduce applicability challenges. Future research should explore whether predictors identified through computer-based analyses can be used to develop more easily interpretable algorithms suitable for use in the ED (e.g., simple scores or single classification trees). Alternatively, the increasing availability of portable computer-assisted decision aids (e.g., through smart phone applications) may make machine learning-based classifiers more widely applicable in the primary care setting, and the use of web-based decision aids could allow classifiers to learn and improve over time.
Despite these limitations, our results demonstrate the feasibility of developing a CDR utilising an easily implemented machine learning algorithm capable of distinguishing accurately between syncope and epilepsy or PNES. Pending validation in target clinical settings, the CDR, administered using an app and using a number of clinical features easily manageable in most primary or emergency care settings, should enable non-expert clinicians to direct patients to the most appropriate cardiological or neurologic investigation and management pathways. In addition to speeding up the diagnostic process and reducing the risk of misdiagnosis and inappropriate investigation or referral, the pre-test probability of particular diagnoses provided by such a CDR would enhance clinician interpretation of inter-episodal investigation findings (e.g., EEG, neuroimaging, ECG or tilt-table abnormalities).49
Appendix. Authors
Footnotes
Editorial, page 94
Class of Evidence: NPub.org/coe
Study funding
This research was supported by Sheffield Hospitals Charitable Trust. No industry funding was involved.
Disclosure
The authors report no disclosures relevant to the manuscript. Full disclosure form information provided by the authors is available with the full text of this article at Neurology.org/cp.
TAKE-HOME POINTS
→ Single symptoms or witness-reported features do not reliably distinguish between causes of TLOC.
→ Machine learning techniques can identify clusters of such features that more reliably indicate particular diagnoses, and can exploit nonlinear interactions that may outperform linear regression-based scoring systems.
→ A 36-question patient and witness questionnaire distinguished syncope from epilepsy and PNES with 100% sensitivity.
→ The classifier performed better when collateral history from witnesses was available than when relying solely on patient symptoms.
→ Computer-based classifiers could be useful in improving diagnosis, referral, and treatment for patients with TLOC.
References
- 1.O'Callaghan P. Transient loss of consciousness. Medicine (Baltimore) 2012;40:427–430. [Google Scholar]
- 2.Brignole M, Moya A, Lange D, et al. 2018 ESC guidelines for the diagnosis and management of syncope. Eur Heart J 2018;39:1883–1948. [DOI] [PubMed] [Google Scholar]
- 3.Petkar S, Cooper P, Fitzpatrick AP. How to avoid a misdiagnosis in patients presenting with transient loss of consciousness. Postgrad Med J 2006;82:630–641. [DOI] [PMC free article] [PubMed] [Google Scholar]
- 4.NICE CG109. Transient Loss of Consciousness (“blackouts”) in over 16s: National Institute for Health and Clinical Excellence; 2010. Available at nice.org.uk/guidance/cg109/. Accessed January 26, 2017. [Google Scholar]
- 5.Angus-Leppan H. Diagnosing epilepsy in neurology clinics: a prospective study. Seizure 2008;17:431–436. [DOI] [PubMed] [Google Scholar]
- 6.Baron-Esquivias G, Martinez-Alday J, Martin A, et al. Epidemiological characteristics and diagnostic approach in patients admitted to the emergency room for transient loss of consciousness: Group for syncope study in the emergency room (GESINUR) study. Europace 2010;12:869–876. [DOI] [PubMed] [Google Scholar]
- 7.Syed TU, Arozullah AM, Suciu GP, et al. Do observer and self-reports of ictal eye closure predict psychogenic nonepileptic seizures? Epilepsia 2008;49:898–904. [DOI] [PubMed] [Google Scholar]
- 8.Schramke CJ, Kay KA, Valeriano JP, Kelly KM. Using patient history to distinguish between patients with non-epileptic and patients with epileptic events. Epilepsy Behav 2010;19:478–482. [DOI] [PubMed] [Google Scholar]
- 9.Leach JP, Lauder R, Nicolson A, Smith DF. Epilepsy in the UK: misdiagnosis, mistreatment, and undertreatment? The Wrexham area epilepsy project. Seizure 2005;14:514–520. [DOI] [PubMed] [Google Scholar]
- 10.Zaidi A, Clough P, Cooper P, Scheepers B, Fitzpatrick AP. Misdiagnosis of epilepsy: many seizure-like attacks have a cardiovascular cause. J Am Coll Cardiol 2000;36:181–184. [DOI] [PubMed] [Google Scholar]
- 11.Malmgren K, Reuber M, Appleton R. Differential diagnosis of epilepsy. Oxford Textbook of Epilepsy and Epileptic Seizures. Oxford, UK: Oxford University Press; 2012:81–94. [Google Scholar]
- 12.Reuber M, Fernández G, Bauer J, Helmstaedter C, Elger CE. Diagnostic delay in psychogenic nonepileptic seizures. Neurology 2002;58:493–495. [DOI] [PubMed] [Google Scholar]
- 13.Reuber M, Baker GA, Gill R, Smith DF, Chadwick DW. Failure to recognize psychogenic nonepileptic seizures may cause death. Neurology 2004;62:834–835. [DOI] [PubMed] [Google Scholar]
- 14.Reuber M, Chen M, Jamnadas-Khoda J, et al. Value of patient-reported symptoms in the diagnosis of transient loss of consciousness. Neurology 2016;87:625–633. [DOI] [PMC free article] [PubMed] [Google Scholar]
- 15.Syed TU, Arozullah AM, Loparo KL, et al. A self-administered screening instrument for psychogenic nonepileptic seizures. Neurology 2009;72:1646–1652. [DOI] [PubMed] [Google Scholar]
- 16.Sheldon R, Rose S, Ritchie D, et al. Historical criteria that distinguish syncope from seizures. J Am Coll Cardiol 2002;40:142–148. [DOI] [PubMed] [Google Scholar]
- 17.Azar NJ, Pitiyanuvath N, Vittal NB, Wang L, Shi Y, Abou-Khalil BW. A structured questionnaire predicts if convulsions are epileptic or nonepileptic. Epilepsy Behav 2010;19:462–466. [DOI] [PubMed] [Google Scholar]
- 18.Stiell IG, Bennett C. Implementation of clinical decision rules in the emergency department. Acad Emerg Med 2007;14:955–959. [DOI] [PubMed] [Google Scholar]
- 19.Wardrope A, Newberry E, Reuber M. Diagnostic criteria to aid the differential diagnosis of patients presenting with transient loss of consciousness: a systematic review. Seizure 2018;61:139–148. [DOI] [PubMed] [Google Scholar]
- 20.Chen M, Jamnadas-Khoda J, Broadhurst M, et al. Value of witness observations in the differential diagnosis of transient loss of consciousness. Neurology 2019;92:e895–e904. [DOI] [PubMed] [Google Scholar]
- 21.Hippisley-Cox J, Coupland C, Brindle P. Development and validation of QRISK3 risk prediction algorithms to estimate future risk of cardiovascular disease: prospective cohort study. BMJ 2017;357:j2099. [DOI] [PMC free article] [PubMed] [Google Scholar]
- 22.National Emergency Laparotomy Audit. NELA Risk Calculator. Available at: data.nela.org.uk/riskcalculator/. Accessed August 4, 2018.
- 23.Prytherch DR, Whiteley MS, Higgins B, Weaver PC, Prout WG, Powell SJ. POSSUM and Portsmouth POSSUM for predicting mortality. Br J Surg 1998;85:1217–1220. [DOI] [PubMed] [Google Scholar]
- 24.LaFrance WC, Baker GA, Duncan R, Goldstein LH, Reuber M. Minimum requirements for the diagnosis of psychogenic nonepileptic seizures: a staged approach. Epilepsia 2013;54:2005–2018. [DOI] [PubMed] [Google Scholar]
- 25.Genuer R, Poggi JM, Tuleau-Malot C. Variable selection using random forests. Pattern Recognit Lett 2010;31:2225–2236. [Google Scholar]
- 26.Collins GS, Reitsma JB, Altman DG, Moons KGM. Transparent reporting of a multivariable prediction model for individual prognosis or diagnosis (TRIPOD): the TRIPOD statement. BMJ 2015;350:g7594. [DOI] [PubMed] [Google Scholar]
- 27.Breiman L. Random forests. Mach Learn 2001;45:5–32. [Google Scholar]
- 28.Díaz-Uriarte R, Alvarez de Andrés S. Gene selection and classification of microarray data using random forest. BMC Bioinformatics 2006;7:3. [DOI] [PMC free article] [PubMed] [Google Scholar]
- 29.Ramsay J, Richardson J, Carter YH, Davidson LL, Feder G. Should health professionals screen women for domestic violence? Systematic review. BMJ 2002;325:314. [DOI] [PMC free article] [PubMed] [Google Scholar]
- 30.Watson SB, Haynes SN. Brief screening for traumatic life events in female university health service patients. Int J Clin Health Psychol 2007;7 Available at: redalyc.org/resumen.oa?id=33717060001. Accessed February 16, 2018. [Google Scholar]
- 31.Avbersek A, Sisodiya S. Does the primary literature provide support for clinical signs used to distinguish psychogenic nonepileptic seizures from epileptic seizures? J Neurol Neurosurg Psychiatry 2010;81:719–725. [DOI] [PubMed] [Google Scholar]
- 32.Rugg-Gunn FJ, Harrison NA, Duncan JS. Evaluation of the accuracy of seizure descriptions by the relatives of patients with epilepsy. Epilepsy Res 2001;43:193–199. [DOI] [PubMed] [Google Scholar]
- 33.Stojanov A, Lukic S, Spasic M, Peric Z. Historical criteria that distinguish seizures from syncope: external validation of screening questionnaire. J Neurol 2014;261. [Google Scholar]
- 34.Hoefnagels WA, Padberg GW, Overweg J, van der Velde EA, Roos RA. Transient loss of consciousness: the value of the history for distinguishing seizure from syncope. J Neurol 1991;238:39–43. [DOI] [PubMed] [Google Scholar]
- 35.Robles L, Chiang S, Haneef Z. Review-of-systems questionnaire as a predictive tool for psychogenic nonepileptic seizures. Epilepsy Behav 2015;45:151–154. [DOI] [PMC free article] [PubMed] [Google Scholar]
- 36.Asadi-Pooya AA, Rabiei AH, Tinker J, Tracy J. Review of systems questionnaire helps differentiate psychogenic nonepileptic seizures from epilepsy. J Clin Neurosci 2016;34:105–107. [DOI] [PubMed] [Google Scholar]
- 37.Spinhoven P, Van Dyck R, Kuyk J. Hypnotic recall: a positive criterion in the differential diagnosis between epileptic and pseudoepileptic seizures. Epilepsia 1999;40:485–491. [DOI] [PubMed] [Google Scholar]
- 38.Ali F, Rickards H, Bagary M, Greenhill L, McCorry D, Cavanna AE. Ictal consciousness in epilepsy and nonepileptic attack disorder. Epilepsy Behav 2010;19:522–525. [DOI] [PubMed] [Google Scholar]
- 39.Bell WL, Park YD, Thompson EA, Radtke RA. Ictal cognitive assessment of partial seizures and pseudoseizures. Arch Neurol 1998;55:1456–1459. [DOI] [PubMed] [Google Scholar]
- 40.Rawlings GH, Jamnadas-Khoda J, Broadhurst M, et al. Panic symptoms in transient loss of consciousness: frequency and diagnostic value in psychogenic nonepileptic seizures, epilepsy and syncope. Seizure 2017;48:22–27. [DOI] [PubMed] [Google Scholar]
- 41.Hendrickson R, Popescu A, Ghearing G, Bagic A, Dixit R. Panic attack symptoms differentiate patients with epilepsy from those with psychogenic nonepileptic spells (PNES). Epilepsy Behav 2014;37:210–214. [DOI] [PubMed] [Google Scholar]
- 42.Latreille V, Baslet G, Sarkis R, Pavlova M, Dworetzky BA. Sleep in psychogenic nonepileptic seizures: time to raise a red flag. Epilepsy Behav 2018;86:6–8. [DOI] [PubMed] [Google Scholar]
- 43.Duncan R, Oto M, Russell A, Conway P. Pseudosleep events in patients with psychogenic non-epileptic seizures: prevalence and associations. J Neurol Neurosurg Psychiatry 2004;75:1009–1012. [DOI] [PMC free article] [PubMed] [Google Scholar]
- 44.NICE CG137. Epilepsies: Diagnosis and Management. London: National Institute for Health and Clinical Excellence; 2012. Available at: nice.org.uk/guidance/cg137/chapter/1-Guidance#diagnosis-2. Accessed December 11, 2017. [Google Scholar]
- 45.Costantino G, Casazza G, Reed M, et al. Syncope risk stratification tools vs clinical judgment: an individual patient data meta-analysis. Am J Med 2014;127:1126.e13–1126.e25. [DOI] [PubMed] [Google Scholar]
- 46.Olde Nordkamp LRA, van Dijk N, Ganzeboom KS, et al. Syncope prevalence in the ED compared to general practice and population: a strong selection process. Am J Emerg Med 2009;27:271–279. [DOI] [PubMed] [Google Scholar]
- 47.Nakash RA, Hutton JL, Jørstad-Stein EC, Gates S, Lamb SE. Maximising response to postal questionnaires–a systematic review of randomised trials in health research. BMC Med Res Methodol 2006;6:5. [DOI] [PMC free article] [PubMed] [Google Scholar]
- 48.Edwards PJ, Roberts I, Clarke MJ, et al. Methods to increase response to postal and electronic questionnaires. Cochrane Database Syst Rev 2009;MR000008. [DOI] [PMC free article] [PubMed] [Google Scholar]
- 49.Westbury CF. Bayes' rule for clinicians: an introduction. Front Psychol 2010;1:192. [DOI] [PMC free article] [PubMed] [Google Scholar]
Associated Data
This section collects any data citations, data availability statements, or supplementary materials included in this article.
Data Availability Statement
All data and statistical analyses are available from the authors on request.


