

Abstract
Bone marrow‐derived mesenchymal stem or stromal cells (MSC) have been shown to be recruited to various types of tumor tissues, where they interact with tumor cells to promote their proliferation, survival, invasion and metastasis, depending on the type of the tumor. We have previously shown that Ror2 receptor tyrosine kinase and its ligand, Wnt5a, are expressed in MSC, and Wnt5a‐Ror2 signaling in MSC induces expression of CXCL16, which, in turn, promotes proliferation of co–cultured MKN45 gastric cancer cells via the CXCL16‐CXCR6 axis. However, it remains unclear how CXCL16 regulates proliferation of MKN45 cells. Here, we show that knockdown of CXCL16 in MSC by siRNA suppresses not only proliferation but also migration of co–cultured MKN45 cells. We also show that MSC‐derived CXCL16 or recombinant CXCL16 upregulates expression of Ror1 through activation of STAT3 in MKN45 cells, leading to promotion of proliferation and migration of MKN45 cells in vitro. Furthermore, co–injection of MSC with MKN45 cells in nude mice promoted tumor formation in a manner dependent on expression of Ror1 in MKN45 cells, and anti–CXCL16 neutralizing antibody suppressed tumor formation of MKN45 cells co–injected with MSC. These results suggest that CXCL16 produced through Ror2‐mediated signaling in MSC within the tumor microenvironment acts on MKN45 cells in a paracrine manner to activate the CXCR6‐STAT3 pathway, which, in turn, induces expression of Ror1 in MKN45 cells, thereby promoting tumor progression.
Keywords: bone marrow‐derived mesenchymal stem cells, CXCL16, gastric cancer, Ror1, STAT3
We show that CXCL16 derived from human bone marrow‐derived mesenchymal stem cells (MSC) induces expression of Ror1 through activation of STAT3 in MKN45 gastric cancer cells, resulting in promotion of proliferation and migration of MKN45 cells in vitro. Furthermore, tumor formation of MKN45 cells in nude mice can be accelerated by co–injection of MSC, in a manner that is inhibited by anti–CXCL16 neutralizing antibody and is dependent on Ror1 expression in MKN45 cells. These findings indicate that CXCL16 derived from MSC induces expression of Ror1 through activation of the STAT3 pathway in MKN45 cells, leading to the promotion of tumor formation.
1. INTRODUCTION
The tumor stroma is a critical component of the tumor microenvironment, composed of many types of non–cancerous cells and non–cellular elements, including extracellular matrix (ECM).1, 2, 3 The major cellular constituents of tumor stroma are fibroblasts, specifically called cancer‐associated fibroblasts (CAF), which produce ECM and its remodeling proteins, such as matrix metalloproteinases, thereby providing mechanical support favorable for tumor progression.4 CAF also produce soluble mediators, that is, growth factors, cytokines and/or chemokines, which act on cancer cells in a paracrine fashion and affect their behaviors, such as proliferation and migration, while secretory proteins produced by cancer cells can regulate functions of CAF.5 Thus, the interaction between CAF and cancer cells might be bidirectional. In addition, CAF and cancer cells can communicate with each other through direct contact during tumor progression.5 CAF are heterogeneous in phenotype and function depending on the tumor type as well as the areas of individual tumors, due, in part, to their different origins.6 Traditionally, residential fibroblasts were considered to be the main source of CAF in the tumor microenvironment.7, 8 However, accumulating evidence demonstrates that there are additional sources of CAF, including endothelial cells,9, 10 adipocytes11, 12 and bone marrow‐derived mesenchymal stem/stromal cells (MSC).13, 14
Ror2 receptor tyrosine kinase is a receptor for Wnt5a, mediating the non–canonical Wnt signaling during developmental morphogenesis, tissue repair and tumor progression.15, 16 Ror2 and Wnt5a are highly expressed in various types of cancer cells, resulting in constitutive activation of Wnt5a‐Ror2 signaling in a cell‐autonomous manner, eventually contributing to tumor progression.16 However, expression of Ror2 is also observed in cellular components of tumor stroma, and higher levels of Ror2 expression in tumor stroma seem to be associated with poor prognosis in ovarian cancer and pancreatic ductal adenocarcinoma,17, 18 suggesting an important role of stromal Ror2 in tumor progression. We have previously shown that MSC express both Wnt5a and Ror2, even though Wnt5a‐Ror2 signaling in MSC seems not to affect proliferation and viability of themselves.19 Interestingly, however, when co–cultured with MKN45 gastric cancer cells, which express Wnt5a and Ror2 marginally if at all, MSC promote proliferation of MKN45 cells, depending on Ror2‐mediated expression and secretion of soluble CXCL16 from MSC and its paracrine action on MKN45 cells,19 indicating that Wnt5a‐Ror2 signaling in MSC plays an important role in tumor progression within the tumor microenvironment by interacting with cancer cells indirectly through soluble CXCL16.
Here, we show that CXCL16, derived from MSC, can bind to its receptor CXCR6 on MKN45 cells, thereby inducing expression of Ror1 through activation of STAT3 in MKN45 cells, eventually resulting in promotion of proliferation and migration of MKN45 cells. Furthermore, tumor formation of MKN45 cells in nude mice can be accelerated by co–injection of MSC but can be inhibited by an administration of anti–CXCL16 neutralizing antibody or by suppressed expression of Ror1 in MKN45 cells. These results indicate that CXCL16 derived from MSC induces expression of Ror1 through activation of the STAT3 pathway in MKN45 cells, leading to tumor formation in an in vivo animal model.
2. MATERIALS AND METHODS
2.1. Plasmids, siRNA and shRNA
The sequences of the siRNA used were as follows: si‐Ror1 #1, 5′‐CCCAGAAGCUGCGAACUGUUU‐3′ (sense) and 5′‐ACAGUUCGCAGCUUCUGGGUU‐3′ (anti–sense); si‐Ror1 #2, 5′‐CAGCAAUGGAUGGAAUUUCAAUU‐3′ (sense) and 5′‐UUGAAAUUCCAUCCAUUGCUGUU‐3′ (anti–sense); si‐Ror1 #3, 5′‐GCAAGCAUCUUUACUAGGAUU‐3′ (sense) and 5′‐UCCUAGUAAAGAUGCUUGCUU‐3′ (anti–sense); si‐Ror2 #1, 5′‐GCAAUGUGCUAGUGUACGAUU‐3′ (sense) and 5′‐UCGUACACUAGCACAUUGCUU‐3′ (anti–sense); si‐Ror2 #2, 5′‐GCAACCUUUCCAACUACAATT‐3′ (sense) and 5′‐UUGUAGUUGGAAAGGUUGCTT‐3′ (anti–sense); si‐CXCL16 #1, 5′‐CUCACUCGUCCCAAUGAAATT‐3′ (sense) and 5′‐UUUCAUUGGGACGAGUGAGTT‐3′ (anti–sense); si‐CXCL16 #2, 5′‐GGAUCACUGUCCUCGGACATT‐3′ (sense) and 5′‐UGUCCGAGGACAGUGAUCCTT‐3′ (anti–sense); si‐STAT3 #1, 5′‐GGAUAACGUCAUUAGCAGATT‐3′ (sense) and 5′‐UCUGCUAAUGACGUUAUCCTT‐3′ (anti–sense); si‐STAT3 #2, 5′‐GGUACAUCAUGGGCUUUAUTT‐3′ (sense) and 5′‐AUAAAGCCCAUGAUGUACCTT‐3′ (anti–sense); si‐CXCR6, 5′‐CCUACAACCAGCAAGCCAATT‐3′ (sense) and 5′‐UUGGCUUGCUGGUUGUAGGTT‐3′ (anti–sense); (Sigma‐Aldrich); si‐ctrl 5′‐GUACCGCACGUCAUUCGUAUC‐3′ (sense) and 5′‐UACGAAUGACGUGCGGUACGU‐3′ (anti–sense); si‐Wnt5a #1, 5′‐UAACCCUGUUCAGAUGUCAUU‐3′ (sense) and 5′‐UGACAUCUGAACAGGGUUAUU‐3′ (anti–sense); si‐Wnt5a #2, 5′‐AGUGCAAUGUCUUCCAAGUUU‐3′ (sense) and 5′‐ACUUGGAAGACAUUGCACUUU‐3′ (anti–sense) (Sigma‐Aldrich). Silencer select siRNA targeting human CXCL16 (si‐CXCL16 #3) and its negative control siRNA (Thermo Fisher Scientific) were used for primary MSC as described previously.19 To silence Ror1 with short hairpin RNA (shRNA), we used a shRNA vector for the PiggyBac Transposon System (PBSI505A‐1, System Biosciences) and the Super PiggyBac transposase expression vector (PB200PA‐1, System Biosciences). Oligonucleotides containing the following target sequences were annealed and subcloned into the shRNA vector, according to the manufacture's instructions: Ror1 (5′‐CAGCAATGGATGGAATTTCAA‐3′) and negative control (5′‐GTACCGCACGTCATTCGTA‐3′).
2.2. Cell culture and transfection
MKN45, MKN45‐Luc and KATOIII cells were obtained from JCRB Cell Bank (Osaka, Japan) and maintained in RPMI1640 medium (Nacalai Tesque) containing 10% FBS. UE6E7T‐12 cells, human bone marrow‐derived MSC that were immortalized by infection with recombinant retroviruses expressing the E6, E7 and hTERT,20 were kindly provided by Dr H. Yokozaki (Kobe University) and maintained in MSCGM medium (Lonza). Primary human MSC, purchased from Lonza, were maintained in MSCGM medium and used up to 5 passages. All cells were incubated at 37°C with 5% CO2 and 90% humidity. MKN45 and KATOIII cells were stimulated with human recombinant CXCL16 (at a final concentration of 10 ng/mL; R&D Systems) in Opti‐MEM (Thermo Fisher Scientific). In some experiments, cells were pretreated with 6 µmol/L STAT3 inhibitor VII (Merck Millipore) for 60 minutes. Cancer cells and MSC were co–cultured using Transwells with 0.4‐µm φ pore membrane (Costar), so that both types of cells could share media without making any direct contact and be harvested separately for western blot and RT‐PCR analyses.
Cells were transfected with the respective siRNA and plasmids by using Lipofectamine RNAiMax (Thermo Fisher Scientific) and Viafect (Promega) transfection reagents, respectively, according to the manufactures' instructions. Briefly, siRNA (40 nmol/L for MKN45 and KATOIII cells and 20 nmol/L for UE6E7T‐12 cells) or plasmids (1 µg/mL shRNA vector and 0.4 µg/mL Super PiggyBac transposase expression vector) were mixed with the transfection reagents diluted in Opti‐MEM (Thermo Fisher Scientific), incubated for 20 minutes at room temperature, and added to cultured cells. To select MKN45 cells stably expressing control (sh‐Ctrl/MKN45) or Ror1 shRNA (sh‐Ror1/MKN45), transfected cells were treated with 1 µg/mL puromycin (Nacalai Tesque).
2.3. Co–culture proliferation assay
A co–culture proliferation assay was carried out using Transwells with 0.4‐µm φ pore membranes in 12‐well plates (Costar). UE6E7T‐12 or primary MSC (1.0 × 10³ cells in 500 µL medium) were seeded in the upper chamber, and MKN45 or KATOIII cells (1.0 × 10³ cells in 1500 µL medium) were seeded in the lower chamber, using RPMI1640 medium containing 10% FBS for both chambers. After 9 days of co–culture, Transwells were removed, and cells in the lower chamber were incubated with fresh medium containing 10% WST‐8 (CCK‐8, Dojindo) for 150 minutes at 37℃. Subsequently, the absorbance of the culture supernatant was measured at 450 nm using the EnSpire Multimode Plate Reader (Perkin Elmer).
2.4. Co–culture migration assay
A Transwell migration assay was carried out as described previously.21 Transwells with 8‐µm φ pore size membranes in 12‐well plates were pre‐coated on both sides with 10 µg/mL fibronectin (Sigma). UE6E7T‐12 (1.0 × 10⁵ cells) or primary MSC (5.0 × 10⁴ cells) were suspended in 600 µL RPMI1640 medium containing 10% FBS and loaded in the lower chamber. After incubation for 4 hours, MKN45 cells (2.5 × 10⁴ cells) were suspended in 100 µL RPMI1640 medium containing 0.5% FBS and loaded in the upper chamber. After 24‐hours incubation, cells that had migrated to the lower surface of the membrane were counted.
2.5. Antibodies
The following antibodies (Abs) were purchased commercially: mouse anti–STAT3 Ab (9139, Cell signaling Technology), anti–Erk1/2 Ab (4696, Cell Signaling Technology), anti–Akt Ab (2920, Cell Signaling Technology) and anti–CXCR6 Ab (MAB699, R&D Systems); rabbit anti–Ror1 Ab (16 540 for western blot and 4102 for immunohistochemistry, Cell Signaling Technology), anti–α‐tubulin Ab (PM054, MBL), anti–pErk1/2 T202/Y204 Ab (4370, Cell Signaling Technology), anti–pAkt S473 (9271, Cell Signaling Technology) and anti–pSTAT3 S727 Ab (9134, Cell signaling Technology); rat anti–CXCL16 Ab (MAB976, R&D Systems) and control IgG (MAB006, R&D Systems).
2.6. Western blot analyses
Cells were solubilized in lysis buffer (50 mmol/L Tris‐HCl [pH 7.5], 150 mmol/L NaCl, 1% [v/v] Nonidet P‐40 [NP‐40], 1 mmol/L EDTA, 10 mmol/L NaF, 1 mmol/L Na3VO4, 10 µg/mL aprotinin, 10 µg/mL leupeptin, and 1 mmol/L p‐amidinophenylmethylsulfonyl fluoride) and centrifuged at 15 000 g for 15 minutes at 4℃. Protein concentration was determined using the BCA Protein Assay (Thermo Fisher Scientific). Proteins (10 µg) were separated by SDS‐PAGE and transferred onto Immobilon‐P membranes (Merck Millipore) using blotting device (ATTO). Membranes were blocked with 5% (w/v) dried skim milk or 2% BSA and immunoblotted with the respective primary antibodies, followed by HRP‐conjugated secondary antibodies. Immunoblotted bands were visualized with Western Lighting Plus‐ECL (Perkin Elmer) or Immunostar LD (Wako) and detected using the detection system (LAS‐1000; Fujifilm). The relative intensity of immunoblotted bands was determined with ImageJ software.
2.7. RNA isolation and quantitative RT‐PCR
RNA isolation, reverse transcription and quantitative RT‐PCR analysis were carried out as described previously.22 Total RNA were isolated using Isogen (Nippon Gene) and reverse‐transcribed using PrimeScript RT Reagent Kit (TAKARA Bio). Quantitative RT‐PCR was undertaken using LightCycler 480 SYBR Green I Master Mix (Roche Diagnostics). The amount of mRNA was normalized relative to that of 18S ribosomal RNA. The following primers were used: Wnt5a, 5′‐TAAGCCCAGGAGTTGCTTTG‐3′ (forward) and 5′‐GCAGAGAGGCTGTGCTCCTA‐3′ (reverse); Ror1, 5′‐TGCCAGCCCAGTGAGTAATCT‐3′ (forward) and 5′‐GCCAATGAAACCAGCAATCTG‐3′ (reverse); Ror2, 5′‐CAATTCCACTGGTCATCGCT‐3′ (forward) and 5′‐TGAGGGGCATTTCCATGTC‐3′ (reverse); 18S ribosomal RNA, 5′‐ATGGCCGTTCTTAGTTGGTG‐3′ (forward) and 5′‐CGCTGAGCCAGTCAGTGTAG‐3′ (reverse); CXCL16, 5′‐GGCCCCTCATTTAAAAACGG‐3′ (forward) and 5′‐GCCTGGTCAACATGGTGAAAC‐3′ (reverse); CXCR6, 5′‐ATGCCATGACCAGCTTTCACT‐3′ (forward) and 5′‐TTAAGGCAGGCCCTCAGGTA‐3′ (reverse).
2.8. Xenograft tumor formation assay
All the experiments using animals in this study were approved by the Institutional Animal Care and Use Committee (Permission number: P150505‐R2) and carried out according to the Kobe University Animal Experimentation Regulations. Four to six‐week‐old male BALB/c nude mice were obtained from SLC (Shizuoka, Japan). The mice received a dorsal subcutaneous transplantation of MKN45 (sh‐Ctrl/MKN45 or sh‐Ror1/MKN45) cells alone (monoculture: 5.0 × 10⁵ MKN45 cells) or together with UE6E7T‐12 cells (co–culture: 4.0 × 10⁵ MKN45 cells and 1.0 × 10⁵ UE6E7T‐12 cells) in PBS. Tumor volume was measured with calipers every week, and the mice were killed at 28 days after transplantation. To neutralize CXCL16, anti–CXCL16 antibody or control IgG (100 µg) were administrated around the tumor at 7 days after tumor transplantation. Tumor volume was measured three times for a week, and the mice were killed at 7 days after administration of anti–CXCL16 antibody. Tumor volume was determined using the following formula: (major axis) × (minor axis)2 × 0.5. At the end of the experiment, the tumors were isolated from the mice, fixed in 4% (w/v) paraformaldehyde at 4°C overnight and embedded in paraffin for sectioning. Tissue sections were stained with H&E for histological examination.
To detect metastasis of the transplanted cancer cells, MKN45‐Luc cells, which stably express luciferase, were transplanted subcutaneously alone or together with UE6E7T‐12 cells as described above. At 28 days after transplantation, mice were anesthetized and injected intraperitoneally with D‐luciferin (Summit Pharmaceuticals International) at a dose of 150 mg/kg body weight. Images were acquired using an IVIS Spectrum In Vivo Imaging System (Caliper Life Sciences).
For orthotopic transplantation, abdomens of the anesthetized nude mice were opened by a middle incision, the stomach was exteriorized, and MKN45 (sh‐Ctrl/MKN45 or sh‐Ror1/MKN45) cells alone (1.0 × 10⁶ MKN45 cells) or mixtures of MKN45 and UE6E7T‐12 cells (8.0 × 10⁵ MKN45 cells and 2.0 × 10⁵ UE6E7T‐12 cells) were injected into the subserosal layer of the stomach wall in PBS containing Matrigel (BD Biosciences). The stomach was then returned to the abdominal cavity, and the incision was closed. At 28 days after injection, the stomach was removed to measure the tumor volume and for histological examination, as described above.
2.9. Immunohistochemistry
Clinical tissue specimens were obtained and analyzed in accordance with procedures approved by the institutional review board of Kobe University Hospital (No. 180243). Primary gastric cancer specimens were resected from six patients at Kobe University Hospital, fixed, and embedded in paraffin for sectioning. Tissue sections were incubated with antibodies against Ror1, CXCR6 and STAT3, respectively, overnight at 4°C and visualized with the Histofine Simple Stain MAX‐PO (MULTI) kit (Nichirei). Nuclei were counterstained with hematoxylin.
2.10. Statistical analysis
Statistical significance was analyzed using the one‐way ANOVA with Tukey's honest significance difference (HSD) test (https://astatsa.com/OneWay_Anova_with_TukeyHSD/), Fisher's protected least significant difference (PLSD) post–hoc tests or Student's t test. P < 0.05 was considered statistically significant.
3. RESULTS
3.1. Ror2‐mediated expression of CXCL16 in mesenchymal stem or stromal cells promotes proliferation and migration of co–cultured MKN45 cells
We have previously shown that Ror2‐mediated signaling induces expression of CXCL16 in primary human bone marrow‐derived MSC, thereby promoting proliferation of co–cultured MKN45 gastric cancer cells, which express Wnt5a and Ror2 at marginal levels if any.19 Primary human MSC are easy to isolate but are difficult to study due to their limited life span. To overcome this problem, immortalized human MSC, including UE6E7T‐12 cells, were established.20 It has also been reported that proliferation of human gastric cancer cells can be accelerated by co–culture with UE6E7T‐12 MSC,23 which express both Wnt5a and Ror2 at substantial levels (Figure 1A and S1). We therefore mainly used UE6E7T‐12 cells as human MSC in this study. Consistent with our previous findings using primary MSC,19 suppressed expression of Ror2 decreased expression levels of CXCL16 in UE6E7T‐12 cells (Figure 1A). We also found that, when co–cultured indirectly using Transwells, UE6E7T‐12 cells can promote not only proliferation but also migration of MKN45 cells in a manner dependent on expression of Ror2 in UE6E7T‐12 cells (Figure 1B). Furthermore, knockdown of CXCL16 in UE6E7T‐12 cells inhibited their ability to promote proliferation and migration of co–cultured MKN45 cells (Figure 1C). These results indicate that Ror2‐mediated signaling induces expression of CXCL16 in UE6E7T‐12 cells, which then acts in a paracrine manner on MKN45 cells to promote their proliferation and migration.
Figure 1.

Ror2‐mediated expression of CXCL16 in UE6E7T‐12 cells leads to promotion of proliferation and migration of co–cultured MKN45 cells. A, UE6E7T‐12 cells were transfected with either control (ctrl) or Ror2 siRNA (#1, #2). After 72 h in culture, expression levels of Ror2 and CXCL16 mRNA were analyzed by quantitative RT‐PCR. B, C, UE6E7T‐12 cells were transfected with ctrl siRNA or siRNA against either Ror2 (B) or CXCL16 (C). MKN45 cells were monocultured or co–cultured with siRNA‐transfected UE6E7T‐12 cells, as indicated, and proliferation and migration of MKN45 cells were assessed as described in Section 2. Data are expressed as mean ± SD (n = 3). *P < 0.05, **P < 0.01, Tukey's honest significance difference test. Knockdown efficiency of si‐CXCL16 was evaluated by quantitative RT‐PCR (C, right panel)
3.2. CXCL16, produced by mesenchymal stem or stromal cells, induces activation of STAT3 in co–cultured MKN45 cells
We next sought to characterize signaling pathways that can mediate CXCL16‐induced proliferation and migration in MKN45 cells during co–culture with UE6E7T‐12 cells. CXCL16 has been shown to promote cancer cell proliferation and/or migration by regulating Erk or Akt pathways depending on the cancer cell type.24, 25 However, treatment of MKN45 cells with soluble recombinant human CXCL16 (rCXCL16) failed to induce phosphorylation of Erk or Akt in MKN45 cells (Figure S2). We then examined the effect of rCXCL16 on STAT3 activity because CXCL16 can induce activation of STAT3 in rheumatoid arthritis synovial fibroblasts.26 Interestingly, it was found that the levels of phosphorylation of STAT3 on serine 727 (pSTAT3 [S727]), a surrogate marker of STAT3 activation, were increased by treatment with rCXCL16 within 15 minutes (Figure 2A). Co–culture with UE6E7T‐12 cells (untreated or mock‐treated), but not si‐CXCL16‐treated UE6E7T‐12 cells, also leads to increased pSTAT3 levels in MKN45 cells (Figure 2B,C), suggesting that CXCL16 produced by UE6E7T‐12 cells can induce activation of STAT3 in co–cultured MKN45 cells. Furthermore, suppressed expression of STAT3 in MKN45 cells inhibited their proliferation and migration induced by co–culture with UE6E7T‐12 cells (Figure 2D). These findings indicate that CXCL16 produced by UE6E7T‐12 cells promotes proliferation and migration of MKN45 cells through activation of the STAT3 pathway.
Figure 2.

UE6E7T‐12 cell‐derived CXCL16 induces activation of STAT3 in co–cultured MKN45 cells to promote their proliferation and migration. A, MKN45 cells were treated with CXCL16 (10 ng/mL) for the indicated periods, and the levels of phosphorylated (pSTAT3 S727) and total STAT3 were analyzed by western blotting. The histograms indicate the relative band intensities of pSTAT3 normalized by those of total STAT3. Data are expressed as mean ± SD (n = 3). *P < 0.05, Tukey's honest significance difference (HSD) test. B, C, MKN45 cells were either monocultured or co–cultured with UE6E7T‐12 cells for 24 h. In (C), UE6E7T‐12 cells were transfected with either ctrl or CXCL16 siRNA 72 h before being subjected to co–culture experiments. The levels of pSTAT3 S727 and total STAT3 in MKN45 cells were analyzed by western blotting. The histograms indicate the relative band intensities of pSTAT3 normalized by those of total STAT3. Data are expressed as mean ± SD (n = 3). *P < 0.05, **P < 0.01 t test (B) or Tukey's‐HSD test (C). D, MKN45 cells transfected with either ctrl or STAT3 siRNA were monocultured or co–cultured with UE6E7T‐12 cells, as indicated, and proliferation and migration of MKN45 cells were assessed as described in Section 2. Data are expressed as mean ± SD (n = 3). **P < 0.01, Tukey's HSD test
3.3. STAT3 mediates expression of Ror1 in MKN45 cells, co–cultured with mesenchymal stem or stromal cells, to promote their proliferation and migration
STAT3 has been implicated in transcriptional activation of Ror1 at least in chronic lymphocytic leukemia cells.27 In contrast, accumulating evidence reveals that sustained expression of Ror1 is associated with progression of a variety of human tumors.28 We thus hypothesized that STAT3 might mediate expression of Ror1 in MKN45 cells to promote their proliferation and migration during co–culture with MSC. In fact, co–culture of MKN45 cells with UE6E7T‐12 cells (Figure 3A,B) resulted in increased expression of Ror1 in MKN45 cells. Knockdown of either Ror2 or CXCL16 in UE6E7T‐12 cells attenuated their ability to induce expression of Ror1 in co–cultured MKN45 cells (Figure 3C,D). Co–culture with primary MSC also increased expression of Ror1 in MKN45 cells in a manner dependent on CXCL16 in primary MSC (Figure S3). These results indicate that CXCL16 produced by MSC is at least partly responsible for induced expression of Ror1 in MKN45 cells during their co–culture. Furthermore, treatment of MNK45 cells with rCXCL16 leads to increased expression of Ror1 (Figure 3E), which can be abrogated by suppressed expression of either CXCR6 (Figure 3F) or STAT3 (Figure 3G,H), or by treatment with a STAT3 inhibitor (Figure 3I). These results suggest that CXCL16 produced by MSC acts in a paracrine fashion on co–cultured MKN45 cells to induce expression of Ror1 through the STAT3 pathway.
Figure 3.

CXCL16 derived from UE6E7T‐12 cells upregulates expression of Ror1 in co–cultured MKN45 cells through the STAT3 pathway. A, B, MKN45 cells were monocultured or co–cultured with UE6E7T‐12 cells for 24 h. Expression levels of Ror1 mRNA (A) and Ror1 protein (B) in MKN45 cells were analyzed by quantitative RT‐PCR and western blotting, respectively. Data are expressed as mean ± SD (n = 3). * P < 0.05, t test. C, D, UE6E7T‐12 cells were transfected with ctrl, Ror2 or CXCL16 siRNA, as indicated. MKN45 cells were monocultured or co–cultured with siRNA‐transfected UE6E7T‐12 cells for 24 h. Expression levels of Ror1 mRNA (C) and Ror1 protein (D) in MKN45 cells were analyzed by quantitative RT‐PCR and western blotting, respectively. The histograms in (D) indicate the relative band intensities of Ror1 normalized by those of α‐tubulin. Data are expressed as mean ± SD (n = 3). *P < 0.05, **P < 0.01, Tukey's honest significance difference (HSD) test. E, F, MKN45 cells, either untransfected (E) or transfected with ctrl or CXCR6 siRNA (F), were treated with CXCL16 (10 ng/mL) for the indicated periods. Expression levels of Ror1 and α‐tubulin were analyzed by western blotting. Knockdown efficiency of si‐CXCR6 was assessed by quantitative RT‐PCR (F, right panel). G, H, MKN45 cells were transfected with either ctrl or STAT3 siRNA and treated with CXCL16 (10 ng/mL) for the indicated periods (G) or 60 min (H). Expression levels of Ror1 mRNA (G) and Ror1, STAT3 and α‐tubulin proteins (H) were analyzed by quantitative RT‐PCR and western blotting, respectively. Data are expressed as mean ± SD (n = 3). *P < 0.05, **P < 0.01, ***P < 0.001, Tukey's HSD test. I, MKN45 cells were pretreated with either vehicle alone (DMSO) or STAT3 inhibitor VII (6 μmol/L) for 60 min and then treated with CXCL16 (10 ng/mL) for the indicated periods. Expression levels of Ror1 mRNA were analyzed by quantitative RT‐PCR. Data are expressed as mean ± SD (n = 3). **P < 0.01, Tukey's HSD test
3.4. Upregulated expression of Ror1 in MKN45 cells, co–cultured with mesenchymal stem or stromal cells, is required for their proliferation and migration
To gain further insight into the significance of increased expression of Ror1 in MKN45 cells during co–culture with MSC, MKN45 cells were treated with siRNA against Ror1 and their proliferation and migration ability in the absence or presence of co–cultured UE6E7T‐12 cells or primary MSC was assessed. Although siRNA against Ror1 failed to affect proliferation and migration of monocultured MKN45 cells, the siRNA significantly attenuated promoted proliferation and migration of MKN45 cells by co–culture with UE6E7T‐12 cells (Figure 4A). Essentially identical results were obtained using primary MSC, instead of UE6E7T‐12 cells (Figure 4B), indicating that increased expression of Ror1 in MKN45 cells is responsible for their promoted proliferation and migration during co–culture with MSC.
Figure 4.

Upregulated expression of Ror1 in MKN45 cells is required for their proliferation and migration stimulated by co–culture with mesenchymal stem or stromal cells (MSC). MKN45 cells were transfected with either ctrl or Ror1 siRNA. After 72 h in culture, MKN45 cells were monocultured or co–cultured with UE6E7T‐12 cells (A) or primary MSC (B), and proliferation and migration of MKN45 cells were assessed as described in Section 2. Knockdown efficiency of si‐Ror1 was evaluated by quantitative RT‐PCR (A, right panel). Data are expressed as mean ± SD (n = 3). **P < 0.01, Tukey's honest significance difference (HSD) test
To strengthen our findings, we used KATOIII cells, which are, like MKN45 cells, poorly differentiated gastric cancer cells. We found that, when co–cultured with UE6E7T‐12 cells, expression of Ror1 was upregulated in KATOIII cells (Figure S4A). Expression of Ror1 was also increased upon treatment with rCXCL16 in monocultured KATOIII cells (Figure S4B). Importantly, the effect of rCXCL16 on Ror1 expression was abrogated by knocking down STAT3 in KATOIII cells (Figure S4B). Furthermore, co–culture with UE6E7T‐12 cells could promote proliferation of KATOIII cells in a manner dependent on expression of Ror1 in KATOIII cells (Figure S4C). These results are consistent with our findings using MKN45 cells.
3.5. CXCL16 from mesenchymal stem or stromal cells and Ror1 induced by CXCL16 in MKN45 cells are required for mesenchymal stem or stromal cell‐mediated tumor formation of MKN45 cells in mice
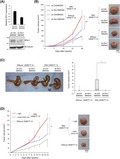
To study the role of Ror1 in MSC‐mediated growth of gastric cancer cells in vivo, we carried out tumor development experiments using mouse xenograft models. MKN45 cells stably expressing either control shRNA (sh‐Ctrl/MKN45) or Ror1 shRNA (sh‐Ror1/MKN45) were injected into nude mice subcutaneously in the absence or presence of UE6E7T‐12 cells (Figure 5A,B). Without UE6E7T‐12 cells, the mean tumor volumes of sh‐Ctrl/MKN45 and sh‐Ror1/MKN45 xenografts were comparable for at least 28 days after injection (Figure 5B). In contrast, co–injection of sh‐Ctrl/MKN45 cells with UE6E7T‐12 cells resulted in an approximately threefold increase in tumor volume compared to sh‐Ctrl/MKN45 cells alone at 28 days after injection (Figure 5B). Although UE6E7T‐12 cells also augmented the growth of sh‐Ror1/MKN45 xenografts, its volume was much smaller than that of sh‐Ctrl/MKN45 xenografts co–injected with UE6E7T‐12 cells (Figure 5B). Histological examination of the tumors isolated at 28 days after injection revealed that these tumors show similar patterns of tumor cell nests with necrotic cores surrounded by infiltrated mononuclear cells, although some parts of the sh‐Ctrl/MKN45 tumors co–injected with UE6E7T‐12 cells showed an irregular outline at the margin (Figure S5), probably representing their prominent growth activity. We then sought to examine whether co–injected UE6E7T‐12 cells could affect tumor metastasis. However, in vivo imaging of subcutaneously injected MKN45‐Luc cells showed robust luciferase activity at the primary tumor site, but not in other sites of the body, at 28 days after injection, irrespective of whether UE6E7T‐12 cells were co–injected (Figure S6), indicating that metastasis was unlikely to occur, at least under our experimental conditions. We further performed orthotopic transplantation of sh‐Ctrl/MKN45 or sh‐Ror1/MKN45 cells with or without UE6E7T‐12 cells on the stomach wall of nude mice. Consistent with the subcutaneous xenograft study, mice transplanted with sh‐Ctrl/MKN45 cells together with UE6E7T‐12 cells developed orthotopic tumors most prominently at 28 days after injection (Figure 5C). These results indicate that increased expression of Ror1 in MKN45 cells is critically important for their promoted growth in the presence of UE6E7T‐12 cells in vivo.
Figure 5.

Upregulated expression of Ror1 in MKN45 cells is required for their ability to form tumors stimulated by co–injection of UE6E7T‐12 cells. A, MKN45 cells stably expressing either ctrl or Ror1 shRNA were obtained as described in Section 2. Expression levels of Ror1 mRNA and Ror1 protein in these cells were assessed by quantitative RT‐PCR and western blotting, respectively. B, The shRNA‐expressing MKN45 cells were injected subcutaneously into nude mice with or without UE6E7T‐12 cells, and tumor volumes were measured at 7, 14, 21 and 28 d after injection, as described in Section 2 (left panel). Data are expressed as mean ± SD (n = 5 mice per each group). **P < 0.01, Tukey's HSD test. Representative images of xenograft tumors isolated at 28 d after tumor cell injection are shown (right panel). Scale bar, 5 mm. C, The shRNA‐expressing MKN45 cells were injected orthotopically into the stomach walls of nude mice with or without UE6E7T‐12 cells, and the stomachs were removed at 28 d after injection (left panel). An arrowhead indicates the tumor. Scale bar, 5 mm. Tumor volumes were measured as described in Section 2 (right panel). Data are presented as a box‐and‐whisker plot. n = 6 mice per each group. *P < 0.05, Fisher's protected least significant difference (PLSD) post–hoc tests test. D, MKN45 cells were injected subcutaneously into nude mice with or without UE6E7T‐12 cells. At 7 days after injection, anti–CXCL16 antibody or control IgG were administrated around the tumor. Tumor volume was measured at the indicated time points (left panel). Data are expressed as mean ± SD (n = 4 mice per each group). *P < 0.05, Tukey's HSD test. Representative images of xenograft tumors isolated at 14 days after tumor cell injection were shown (right panel). Scale bar, 5 mm
Because CXCL16 produced by MSC is responsible for induced expression of Ror1 in MKN45 cells in vitro, we next examined the effect of a neutralizing antibody against CXCL16 on MSC‐mediated growth of MKN45 xenografts. To this end, anti–CXCL16 antibody or isotype‐matched control IgG was injected peritumorally at 7 days after tumor injection, and then the tumors were allowed to grow for an additional 7 days. Compared to control IgG, treatment with anti–CXCL16 antibody significantly reduced the volume of MKN45 xenografts co–injected with UE6E7T‐12 cells (Figure 5C,D), indicating the critical role of CXCL16, produced by UE6E7T‐12 cells, in promoting the development of gastric cancer in vivo.
3.6. Immunohistochemical analysis of Ror1, CXCR6 and STAT3 proteins in gastric cancer tissues
It has been shown that Ror1 and CXCR6 are expressed highly in gastric cancer tissues, and their higher expression levels seem to be associated with progression of gastric cancer,29, 30, 31, 32 while STAT3 is expressed ubiquitously.33 We examined expression patterns of Ror1, STAT3 and CXCR6 in poorly differentiated gastric adenocarcinoma tissues by immunohistochemistry. Among the six cases examined, five cases contained tumor cells that were positive for all three of these proteins (Figure 6). CXCR6 was largely present in the nucleus, in addition to the cytoplasm and plasma membrane, as described,34 and Ror1 was detected in the cytoplasm and plasma membrane of the tumor cells (Figure 6).
Figure 6.

Expression of Ror1, CXCR6 and STAT3 proteins in gastric cancer tissues. Serial sections of gastric cancer tissues were analyzed by immunohistochemistry with anti–Ror1, anti–Ror2 and anti–STAT3 antibodies, respectively. Representative images from two cases are shown. N, normal gastric mucosal epithelium; T, tumor cell; R, reactive mucosal epithelium; S, stromal cell. Insets show magnified images of boxed regions. Scale bars, 100 μm
4. DISCUSSION
Expression of Ror2 in tumor cells is either increased or decreased depending on the type of tumor. For instance, osteosarcoma, melanoma and renal cell carcinoma cells express high levels of Ror2, conferring invasive properties on these tumor cells.21, 35, 36 In contrast, colorectal and gastric cancer cells express decreased levels of Ror2 due to epigenetic silencing of Ror2 gene, leading to their accelerated proliferation.37, 38, 39 Thus, Ror2 exhibits either tumor‐promotive or tumor‐suppressive function depending on the type of tumors. Furthermore, Ror2 is expressed in not only tumor cells but also tumor stroma, and high Ror2 expression in tumor stroma is associated with poor prognosis in ovarian cancer and pancreatic ductal adenocarcinoma,17, 18 suggesting that tumor progression can be promoted by Ror2‐mediated signaling in either tumor cells themselves or tumor stromal cells through tumor stroma interaction.
To study the role of Ror2 in stroma‐mediated tumor progression, we used MSC and MKN45 gastric cancer cells because MSC express Wnt5a and Ror2 at relatively high levels, while MKN45 cells express them marginally, if any.19 Our previous findings have shown that Wnt5a‐Ror2 signaling plays an important role in MSC to produce soluble CXCL16, which, in turn, acts on CXCR6, a receptor for CXCL16, expressed on MKN45 cells, to mediate the promotion of their proliferation.19 Here we show that MSC‐derived CXCL16 promotes not only proliferation but also migration of MKN45 cells, which is consistent with other reports showing that CXCR6 is expressed highly in cancer cells, including gastric cancer cells, and is involved in their migratory activities.31 Our results also indicate that tumor formation of injected MKN45 cells in nude mice can be accelerated by CXCL16 produced by co–injected MSC (Figure 5). However, it is unclear whether and how CXCL16‐induced migration of MKN45 cells can contribute to their tumor formation in nude mice. Because cell‐cell and cell‐ECM interactions can support the ability of the cells to survive and/or proliferate in various contexts, migratory activity of MKN45 cells may contribute to their proliferation and/or survival by facilitating their interaction with each other as well as with MSC and/or ECM in the tumor microenvironment, leading to promotion of tumor formation. Considering that CXCR6‐mediated signaling is involved in tumor invasion and metastasis,25, 31, 40 it is also envisaged that co–injected MSC would further promote invasive progression of the xenograft tumor by activating CXCL16/CXCR6 signaling in cancer cells.
It has been shown that Erk and Akt mediate CXCL16‐CXCR6 signaling to promote progression of breast and prostate cancers, respectively.24, 25 However, neither Erk nor Akt was activated by CXCL16 treatment in MKN45 cells (Figure S2). Instead, CXCL16 can induce activation of STAT3 in MKN45 cells (Figure 2). To the best of our knowledge, this is the first time that CXCL16‐CXCR6 signaling has been shown to mediate activation of STAT3 in cancer cells, although CXCL16‐induced activation of STAT3 has been reported in rheumatoid arthritis synovial fibroblasts.26 STAT3 is a transcription factor that is involved in a variety of biological functions, including tumor progression. Furthermore, STAT3 has been shown to mediate transcriptional activation of Ror1, at least in chronic lymphocytic leukemia cells,27 which prompted us to examine the possibility that CXCL16‐induced activation of STAT3 might mediate induced expression of Ror1 in MKN45 cells. Intriguingly, our findings indicate that CXCL16‐CXCR6 signaling, indeed, induces expression of Ror1, and that STAT3 is responsible, at least partly, for this induction in MKN45 cells (Figure 3). Furthermore, we show that Ror1 expression, induced in MKN45 cells by CXCL16, is required for their promoted proliferation and migration in vitro as well as tumor formation in vivo (Figures 4 and 5). It has been reported that CAF express CXCL16 to attract monocytes, which, in turn, enhance the formation of reactive stroma, contributing to the aggressive phenotype of triple‐negative breast cancers (TNBC).41 Because Ror1 is overexpressed in TNBC cells and involved in their aggressiveness, it would be intriguing to test whether CAF‐secreted CXCL16 promotes expression of Ror1 in TNBC. Because MSC can be a source of CAF,13, 14 our co–culture experiments, in which we used media containing 10% FBS, might induce differentiation of the MSC into CAF‐like cells. Unlike Ror2, Ror1 exhibits mainly, if not exclusively, tumor‐promoting functions in a variety of tumors, and increased expression of Ror1 has been shown in a broader range of cancers, including lung, breast, colon, pancreas, renal, ovarian and gastric cancers.29, 42, 43 Thus, further understanding of how Ror1 expression is regulated in various cancer cells is important for developing effective therapeutic strategies that target Ror1.
CONFLICT OF INTEREST
The authors declare that they have no conflicts of interest.
Supporting information
ACKNOWLEDGMENTS
We thank Dr H. Yokozaki (Kobe University) for UE6E7T‐12 cells. This work was supported in part by a grant from the Japan Agency for Medical Research and Development (AMED) (18gm5010001s0901 [YM]), a grant‐in‐aid for Scientific Research (C) (17K08634 [MN]) from MEXT, a grant from JSPS Bilateral Open Partnership Joint Research Projects (MN) (Grant/Award Number: “JU2019937”), and grants from the Mitsubishi Foundation (ID 29145 [YM]), from the Takeda Science Foundation (MN), and from the Setsuro Fujii Memorial Osaka Foundation for Promotion of Fundamental Medical Research (YM).
Ikeda T, Nishita M, Hoshi K, Honda T, Kakeji Y, Minami Y. Mesenchymal stem cell‐derived CXCL16 promotes progression of gastric cancer cells by STAT3‐mediated expression of Ror1. Cancer Sci. 2020;111:1254–1265. 10.1111/cas.14339
Contributor Information
Michiru Nishita, Email: nishita@fmu.ac.jp.
Yasuhiro Minami, Email: minami@kobe-u.ac.jp.
REFERENCES
- 1. Calvo F, Sahai E. Cell communication networks in cancer invasion. Curr Opin Cell Biol. 2011;23:621‐629. [DOI] [PubMed] [Google Scholar]
- 2. Souza P, Rizzardi F, Noleto G, et al. Refractory remodeling of the microenvironment by abnormal type V collagen, apoptosis, and immune response in non–small cell lung cancer. Hum Pathol. 2010;41:239‐248. [DOI] [PubMed] [Google Scholar]
- 3. Yokozaki H, Koma YI, Shigeoka M, Nishio M. Cancer as a tissue: the significance of cancer‐stromal interactions in the development, morphogenesis and progression of human upper digestive tract cancer. Pathol Int. 2018;68:334‐352. [DOI] [PubMed] [Google Scholar]
- 4. Barbazan J, Matic VD. Cancer associated fibroblasts: is the force the path to the dark side? Curr Opin Cell Biol. 2019;56:71‐79. [DOI] [PubMed] [Google Scholar]
- 5. Kalluri R. The biology and function of fibroblasts in cancer. Nat Rev Cancer. 2016;16:582‐598. [DOI] [PubMed] [Google Scholar]
- 6. Cirri P, Chiarugi P. Cancer‐associated‐fibroblasts and tumour cells: a diabolic liaison driving cancer progression. Cancer Metastasis Rev. 2012;31:195‐208. [DOI] [PubMed] [Google Scholar]
- 7. Desmouliere A, Guyot C, Gabbiani G. The stroma reaction myofibroblast: a key player in the control of tumor cell behavior. Int J Dev Biol. 2004;48:509‐517. [DOI] [PubMed] [Google Scholar]
- 8. Xu J, Clark RA. Extracellular matrix alters PDGF regulation of fibroblast integrins. J Cell Biol. 1996;132:239‐249. [DOI] [PMC free article] [PubMed] [Google Scholar]
- 9. Potenta S, Zeisberg E, Kalluri R. The role of endothelial‐to‐mesenchymal transition in cancer progression. Br J Cancer. 2008;99:1375‐1379. [DOI] [PMC free article] [PubMed] [Google Scholar]
- 10. Zeisberg EM, Potenta S, Xie L, Zeisberg M, Kalluri R. Discovery of endothelial to mesenchymal transition as a source for carcinoma‐associated fibroblasts. Cancer Res. 2007;67:10123‐10128. [DOI] [PubMed] [Google Scholar]
- 11. Jotzu C, Alt E, Welte G, et al. Adipose tissue‐derived stem cells differentiate into carcinoma‐associated fibroblast‐like cells under the influence of tumor‐derived factors. Anal Cell Pathol (Amst). 2010;33:61‐79. [DOI] [PMC free article] [PubMed] [Google Scholar]
- 12. Tan J, Buache E, Chenard MP, Dali‐Youcef N, Rio MC. Adipocyte is a non–trivial, dynamic partner of breast cancer cells. Int J Dev Biol. 2011;55:851‐859. [DOI] [PubMed] [Google Scholar]
- 13. Karnoub AE, Dash AB, Vo AP, et al. Mesenchymal stem cells within tumour stroma promote breast cancer metastasis. Nature. 2007;449:557‐563. [DOI] [PubMed] [Google Scholar]
- 14. Mishra PJ, Mishra PJ, Humeniuk R, et al. Carcinoma‐associated fibroblast‐like differentiation of human mesenchymal stem cells. Cancer Res. 2008;68:4331‐4339. [DOI] [PMC free article] [PubMed] [Google Scholar]
- 15. Endo M, Nishita M, Fujii M, Minami Y. Insight into the role of Wnt5a‐induced signaling in normal and cancer cells. Int Rev Cell Mol Biol. 2015;314:117‐148. [DOI] [PubMed] [Google Scholar]
- 16. Nishita M, Enomoto M, Yamagata K, Minami Y. Cell/tissue‐tropic functions of Wnt5a signaling in normal and cancer cells. Trends Cell Biol. 2010;20:346‐354. [DOI] [PubMed] [Google Scholar]
- 17. Huang J, Fan X, Wang X, et al. High ROR2 expression in tumor cells and stroma is correlated with poor prognosis in pancreatic ductal adenocarcinoma. Sci Rep. 2015;5:12991. [DOI] [PMC free article] [PubMed] [Google Scholar]
- 18. Henry CE, Emmanuel C, Lambie N, et al. Distinct patterns of stromal and tumor expression of ROR1 and ROR2 in histological subtypes of epithelial ovarian cancer. Transl Oncol. 2017;10:346‐356. [DOI] [PMC free article] [PubMed] [Google Scholar]
- 19. Takiguchi G, Nishita M, Kurita K, Kakeji Y, Minami Y. Wnt5a‐Ror2 signaling in mesenchymal stem cells promotes proliferation of gastric cancer cells by activating CXCL16‐CXCR6 axis. Cancer Sci. 2016;107:290‐297. [DOI] [PMC free article] [PubMed] [Google Scholar]
- 20. Mori T, Kiyono T, Imabayashi H, et al. Combination of hTERT and bmi‐1, E6, or E7 induces prolongation of the life span of bone marrow stromal cells from an elderly donor without affecting their neurogenic potential. Mol Cell Biol. 2005;25:5183‐5195. [DOI] [PMC free article] [PubMed] [Google Scholar]
- 21. Enomoto M, Hayakawa S, Itsukushima S, et al. Autonomous regulation of osteosarcoma cell invasiveness by Wnt5a/Ror2 signaling. Oncogene. 2009;28:3197‐3208. [DOI] [PubMed] [Google Scholar]
- 22. Nishita M, Park SY, Nishio T, et al. Ror2 signaling regulates Golgi structure and transport through IFT20 for tumor invasiveness. Sci Rep. 2017;7:1. [DOI] [PMC free article] [PubMed] [Google Scholar]
- 23. Nishimura K, Semba S, Aoyagi K, Sasaki H, Yokozaki H. Mesenchymal stem cells provide an advantageous tumor microenvironment for the restoration of cancer stem cells. Pathobiology. 2012;79:290‐306. [DOI] [PubMed] [Google Scholar]
- 24. Wang J, Lu Y, Wang J, Koch AE, Zhang J, Taichman RS. CXCR6 induces prostate cancer progression by the AKT/mammalian target of rapamycin signaling pathway. Cancer Res. 2008;68:10367‐10376. [DOI] [PMC free article] [PubMed] [Google Scholar] [Retracted]
- 25. Xiao G, Wang X, Wang J, et al. CXCL16/CXCR6 chemokine signaling mediates breast cancer progression by pERK1/2‐dependent mechanisms. Oncotarget. 2015;6:14165‐14178. [DOI] [PMC free article] [PubMed] [Google Scholar]
- 26. Zuo S, Zhu Z, Liu Y, Li H, Song S, Yin S. CXCL16 induces the progression of pulmonary fibrosis through promoting the phosphorylation of STAT3. Can Respir J. 2019;2019:2697376. [DOI] [PMC free article] [PubMed] [Google Scholar]
- 27. Li P, Harris D, Liu Z, Liu J, Keating M, Estrov Z. Stat3 activates the receptor tyrosine kinase like orphan receptor‐1 gene in chronic lymphocytic leukemia cells. PLoS ONE. 2010;5:e11859. [DOI] [PMC free article] [PubMed] [Google Scholar]
- 28. Saleh RR, Antras JF, Peinado P, et al. Prognostic value of receptor tyrosine kinase‐like orphan receptor (ROR) family in cancer: a meta‐analysis. Cancer Treat Rev. 2019;77:11‐19. [DOI] [PubMed] [Google Scholar]
- 29. Chang H, Jung WY, Kang Y, Lee H, Kim A, Kim BH. Expression of ROR1, pAkt, and pCREB in gastric adenocarcinoma. Ann Diagn Pathol. 2015;19:330‐334. [DOI] [PubMed] [Google Scholar]
- 30. Tao J, Zhi X, Zhang X, et al. miR‐27b‐3p suppresses cell proliferation through targeting receptor tyrosine kinase like orphan receptor 1 in gastric cancer. J Exp Clin Cancer Res. 2015;34:139. [DOI] [PMC free article] [PubMed] [Google Scholar]
- 31. Jin JJ, Dai FX, Long ZW, et al. CXCR6 predicts poor prognosis in gastric cancer and promotes tumor metastasis through epithelial‐mesenchymal transition. Oncol Rep. 2017;37:3279‐3286. [DOI] [PubMed] [Google Scholar]
- 32. Li Y, Fu LX, Zhu WL, Shi H, Chen LJ, Ye B. Blockade of CXCR6 reduces invasive potential of gastric cancer cells through inhibition of AKT signaling. Int J Immunopathol Pharmacol. 2015;28:194‐200. [DOI] [PubMed] [Google Scholar]
- 33. Zhong Z, Wen Z, Darnell JE Jr. Stat3 and Stat4: members of the family of signal transducers and activators of transcription. Proc Natl Acad Sci USA. 1994;91:4806‐4810. [DOI] [PMC free article] [PubMed] [Google Scholar]
- 34. Mir H, Singh R, Kloecker GH, Lillard JW Jr, Singh S. CXCR6 expression in non–small cell lung carcinoma supports metastatic process via modulating metalloproteinases. Oncotarget. 2015;6:9985‐9998. [DOI] [PMC free article] [PubMed] [Google Scholar]
- 35. O'Connell MP, Fiori JL, Xu M, et al. The orphan tyrosine kinase receptor, ROR2, mediates Wnt5A signaling in metastatic melanoma. Oncogene. 2010;29:34‐44. [DOI] [PMC free article] [PubMed] [Google Scholar]
- 36. Wright TM, Brannon AR, Gordan JD, et al. Ror2, a developmentally regulated kinase, promotes tumor growth potential in renal cell carcinoma. Oncogene. 2009;28:2513‐2523. [DOI] [PMC free article] [PubMed] [Google Scholar]
- 37. Lara E, Calvanese V, Huidobro C, et al. Epigenetic repression of ROR2 has a Wnt‐mediated, pro‐tumourigenic role in colon cancer. Mol Cancer. 2010;9:170. [DOI] [PMC free article] [PubMed] [Google Scholar]
- 38. Li L, Ying J, Tong X, et al. Epigenetic identification of receptor tyrosine kinase‐like orphan receptor 2 as a functional tumor suppressor inhibiting beta‐catenin and AKT signaling but frequently methylated in common carcinomas. Cell Mol Life Sci. 2014;71:2179‐2192. [DOI] [PMC free article] [PubMed] [Google Scholar]
- 39. Yan L, Du Q, Yao J, Liu R. ROR2 inhibits the proliferation of gastric carcinoma cells via activation of non–canonical Wnt signaling. Exp Ther Med. 2016;12:4128‐4134. [DOI] [PMC free article] [PubMed] [Google Scholar]
- 40. Singh R, Kapur N, Mir H, Singh N, Lillard JW Jr, Singh S. CXCR6‐CXCL16 axis promotes prostate cancer by mediating cytoskeleton rearrangement via Ezrin activation and alphavbeta3 integrin clustering. Oncotarget. 2016;7:7343‐7353. [DOI] [PMC free article] [PubMed] [Google Scholar]
- 41. Allaoui R, Bergenfelz C, Mohlin S, et al. Cancer‐associated fibroblast‐secreted CXCL16 attracts monocytes to promote stroma activation in triple‐negative breast cancers. Nat Commun. 2016;7:13050. [DOI] [PMC free article] [PubMed] [Google Scholar]
- 42. Zhang S, Chen L, Wang‐Rodriguez J, et al. The onco‐embryonic antigen ROR1 is expressed by a variety of human cancers. Am J Pathol. 2012;181:1903‐1910. [DOI] [PMC free article] [PubMed] [Google Scholar]
- 43. Balakrishnan A, Goodpaster T, Randolph‐Habecker J, et al. Analysis of ROR1 protein expression in human cancer and normal tissues. Clin Cancer Res. 2017;23:3061‐3071. [DOI] [PMC free article] [PubMed] [Google Scholar]
Associated Data
This section collects any data citations, data availability statements, or supplementary materials included in this article.
Supplementary Materials