Abstract
Triple negative breast cancer (TNBC) displays higher heterogeneity, stronger invasiveness, higher risk of metastasis and poorer prognosis compared with major breast cancer subtypes. KIF3A, a member of the kinesin family of motor proteins, serves as a microtubule‐directed motor subunit and has been found to regulate early development, ciliogenesis and tumorigenesis. To explore the expression, regulation and mechanism of KIF3A in TNBC, 3 TNBC cell lines, 98 cases of primary TNBC and paired adjacent tissues were examined. Immunohistochemistry, real‐time PCR, western blot, flow cytometry, short hairpin RNA (shRNA) interference, 3‐(4,5‐dimethylthiazol‐2‐yl)‐2,5‐diphenyltetrazolium bromide (MTT), colony formation techniques, transwell assays, scratch tests, and xenograft mice models were used. We found that KIF3A was overexpressed in TNBC and such high KIF3A expression was also associated with tumor recurrence and lymph node metastasis. Silencing of KIF3A suppressed TNBC cell proliferation by repressing the Rb‐E2F signaling pathway and inhibited migration and invasion by repressing epithelial‐mesenchymal transition. The tumor size was smaller and the number of lung metastatic nodules was lower in KIF3A depletion MDA‐MB‐231 cell xenograft mice than in the negative control group. In addition, KIF3A overexpression correlated with chemoresistance. These results suggested that high expression of KIF3A in TNBC was associated with the tumor progression and metastasis.
Keywords: epithelial‐mesenchymal transition, KIF3A, metastasis, Rb‐E2F signaling, Triple negative breast cancer
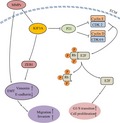
KIF3A,a member of kinesin super family, was over‐expressed in triple negative breast cancer (TNBC) tissues and such high KIF3A expression was associated with tumor recurrence and lymph node. Silencing of KIF3A suppressed TNBC cells proliferation, migration and invasion by repressing the Rb‐E2F signaling and EMT. And the tumor size and lung metastatic nodules were less in KIF3A depletion xenograft mice.
1. INTRODUCTION
Breast cancer is one of the most common causes of cancer death among women in developing counties and is the most frequent cancer in women around the world.1 Triple negative breast cancer (TNBC) represents a heterogenous group of breast carcinomas lacking expression of estrogen receptor (ER), progesterone receptor (PR) and human epidermal growth factor receptor‐2 (HER2). TNBC is characterized by a higher rate of early recurrence, distant metastasis to brain and lungs, and more aggressive biology.2, 3 TNBC has received wider attention because of the lack of targeted therapy, its chemoresistance to multiple anticancer drugs and the poor prognosis of patients.2 Therefore, novel molecules and pathways as therapeutic targets to treat TNBC are eagerly awaited.4
Retinoblastoma protein (Rb) is a tumor suppressor protein, which could prevent abnormal cell growth by inhibiting cell cycle progression at the G1/S checkpoint.5 Inactivation of the Rb tumor suppressor is a common event in many cancers.6 It has been suggested that Rb loses its E2F binding activity when phosphorylated; free E2F is then able to transactivate its cell cycle‐related target genes,7, 8, 9, 10 contributing to the cell cycle progression and cell proliferation.7, 11, 12, 13 P21 belongs to the cyclin‐dependent kinase inhibitor which includes p21, p27, and p57.14 P21 could interact with the cyclin/CDK complexes to suppress cyclin‐dependent kinases (CDKs) activity, which is required for the phosphorylation of Rb and subsequent E2F‐dependent gene expression.15 On account of the ability of p21 to inhibit cell proliferation, loss of expression or function of p21 has been found in the progression of many human cancers.16
Epithelial‐to‐mesenchymal transition (EMT) is not only a crucial event in embryonic development, wound healing, and tissue fibrosis but also for tumor invasion and metastasis. Its conversion involves dramatic phenotypic changes: epithelial cells lose cell‐cell junctions and cell polarity and acquire mesenchymal characteristics, including motility and invasiveness.17, 18, 19 Morphological changes are accompanied by a marked reduction in E‐cadherin and the increasing expression of mesenchymal factors such as vimentin.20, 21 A number of key transcription factors have been identified that play critical roles in the initiation and execution of an EMT, including ZEB1. ZEB1 is an EMT transcription factor by means of causing a migratory mesenchymal phenotype to facilitate carcinoma invasion and metastasis in cancer cells.22
Kinesin superfamily proteins (KIFs) are involved in several cellular processes, including intracellular organelle/macromolecule transportation, cell shape, cytoskeleton dynamics, cell migration and division.23, 24 KIF3, one subfamily of the KIFs, includes three members (KIF3A, KIF3B and KIF3C), and has been identified and characterized in mice.25, 26 KIF3B plays an important role in the regulation of vesicle transport and membrane expansion during mitotic progression.27 It was increased in human hepatocellular carcinoma (HCC) tissues and seminoma tissues. Suppression of KIF3B might inhibit HCC proliferation and promotes apoptosis.28 Downregulation of KIF3B impacts on cell proliferation and migration of seminoma.29 KIF3C is highly expressed in the nervous system,30 and it contributes to axon growth and regeneration by regulating and organizing the microtubule cytoskeleton in the growth cone.31 KIF3A, a member of the kinesin family of motor proteins, serves as a microtubule‐directed motor subunit and has been found to regulate early development, ciliogenesis and tumorigenesis.32 KIF3A protein binds the KIF3C or KIF3B, which are similar in sequence.33, 34, 35 KIF3A yields a heterotrimeric complex with KIF3B and the kinesin superfamily‐associated protein 3 (KAP3) to carry out long‐distance anterograde transport.35 In addition, regulation of KIF3A promotes cell proliferation and invasion in prostate cancer.36 KIF3A binding to β‐arrestin suppresses Wnt/β‐catenin signaling in lung cancer.37 KIF3A‐KIF3B proteins interact with the Wnt signaling component, adenomatous polyposis coli (APC), through an association with KAP3 to regulate cell migration.38 However, until recently, the expression and the potential effect of the KIF3A gene in TNBC with Rb‐E2F signaling and EMT were unknown.
In this study, we detected the expression and significance of KIF3A in TNBC and explored the role of KIF3A in tumor proliferation, invasion, metastasis and chemoresistance in TNBC cell lines.
2. MATERIALS AND METHODS
2.1. Tissue samples and cell lines
Ninety‐eight female patients with primary TNBC treated at the Affiliated Hospital of Qingdao University between 2011 and 2013 participated in this study. TNBC was defined as invasive breast carcinoma with ER and PR staining in less than 1% of the tumor cells by immunohistochemistry and without HER2 overexpression. All patients did not receive chemotherapy or radiotherapy before surgery and the related clinical information (Table 1) was obtained from all patients with written consent. Thirty‐two of the patients who had axillary lymph node dissection had lymph node metastasis. Specimens from cancer tissue and adjacent normal tissue were obtained during the surgery and were immediately dipped in 10% formalin for immunohistochemistry (IHC) analysis. Nine patients had both cancer and adjacent tissue sufficiently large so that a portion of the tissue was immediately frozen in liquid nitrogen and stored for RNA/protein analysis. This study was reviewed and approved by the Institutional Medical Ethics Committee of the Qingdao University Affiliated Hospital.
Table 1.
Association between KIF3A in triple negative breast cancer (TNBC) and patient characteristics
| Variables | n | Mean ± SD | P‐value |
|---|---|---|---|
| Age | |||
| ≤60 y | 55 | 5.709 ± 0.685 | 0.316 |
| >60 y | 43 | 5.581 ± 0.763 | |
| Tumor size (cm) | |||
| ≤2 | 40 | 5.725 ± 0.716 | 0.472 |
| >2 | 58 | 5.603 ± 0.724 | |
| Tumor grade | |||
| II | 38 | 5.790 ± 0.528 | 0.960 |
| III | 60 | 5.567 ± 0.810 | |
| Carcinoma | 98 | 5.653 ± 0.719 | <0.001* |
| Adjacent tissues | 98 | 4.143 ± 0.974 | |
| Lymph node metastasis | |||
| Negative | 66 | 5.379 ± 0.696 | 0.004* |
| Positive | 32 | 6.031 ± 0.647 | |
| Primary tumor | 32 | 6.031 ± 0.647 | <0.001* |
| Metastatic tumor in lymph nodes | 32 | 7.031 ± 0.740 | |
| Tumor recurrence | |||
| Positive | 27 | 6.074 ± 0.675 | 0.027* |
| Negative | 71 | 5.493 ± 0.673 | |
Significant at <0.05.
Human TNBC cell lines MDA‐MB‐231, BT549, MDA‐MB‐468 and BT20 were purchased from the Chinese Academy of Science (Shanghai, China). The cells were routinely cultured in DMEM (HyClone) supplemented with 10% FBS (Gibco) at 37℃ in 5% CO2.
2.2. Immunohistochemistry analysis
The procedure of IHC staining was performed as described previously. Anti–KIF3A (abcam, ab11259, dilution at 1:300), anti–phospho‐Rb, anti–E2F1, anti–Cyclin E1, anti–Cyclin D1, anti–P21, anti–ZEB1, anti–E‐cadherin, anti–vimentin, anti–MMP‐9 and anti–MMP‐2 (Bioworld Technology, all at dilution 1:200) were incubated overnight at 4°C. Each slide was photographed with a digital camera on an inverted Olympus IX81 microscope. The staining evaluation was made according to the semi–quantitative scoring system, as described previously. Briefly, the scores of positive tumor cell proportion (0, none; 1, <1/100; 2, 1/100 to 1/10; 3, 1/10 to 1/3; 4, 1/3 to 2/3; and 5,> 2/3) and staining intensity (0, none; 1, weak; 2, intermediate; and 3, strong) were added up to obtain a final total score, ranging from 0 to 8.
2.3. Plasmid construction and generation of stable cell lines
Suppression of KIF3A expression was performed by shRNA interference. KIF3A‐shRNA recombinant lentiviruses and the negative control (Scr‐shRNA) were purchased from HanBio. Uninfected cells were used for empty control (Mock). The target sequences of the KIF3A‐shRNA were as follows: 1#:5′‐ GAT CCGCCCAGACAAGATGATTGAAATGCAATTCAAGAGATTGCATTTCAATCATCTTGTCTGGGTTTTTTC‐3′, 2#:5′‐GATCCGACTATGCTGATGGCTGCAAAGTCATTCAAGAGATGACTTTGCAGCCATCAGCATAGTCTTTTTTC‐3′, 3#:5′‐GATCCGCGTTCTGCAAAGCCTGAAACTGTATTCAAGAGATACAGTTTCAGGCTTTGCAGAACGCTTTTTTC‐3′. Cells were infected with lentivirus particles and were selected in medium containing puromycin. MDA‐MB‐231 and BT549 cell stably expressing KIF3A‐shRNA, Scr‐shRNA plasmid were named KIF3A‐shRNA and Scr‐shRNA. The overexpression of KIF3A was performed by KIF3A overexpression vector plasmid (KIF3A‐pEX), the empty plasmid was used as a negative control (Vector). Plasmids were purchased from GeneChem. All constructs were confirmed by sequencing. MDA‐MB‐468 cells transfected with KIF3A overexpression vector plasmid and empty plasmid were named KIF3A‐pEX and Vector.
2.4. Real‐time RT‐PCR analysis
The fresh tissue total RNA was isolated using RNAiso reagent (Takara Bio, Japan) as instructed by the manufacturer. The next procedure was performed as described previously.39 Forward and reverse primer sequences for KIF3A and GAPDH were summarized in Table 2.
Table 2.
Primer sequences of KIF3A and GAPDH for real‐time RT‐PCR
| Gene | Sequence | Product size (bp) |
|---|---|---|
| KIF3A | 5‐TCCCGTTCCCATGCCATCTT‐3′ | 158 |
| 5‐GCTTCCTTTAGGCGCTGTCC‐3′ | ||
| GAPDH | 5‐CAGGAGGCATTGCTGATGAT‐3′ | 138 |
| 5‐GAAGGCTGGGGCTCATTT‐3′ |
2.5. Protein preparation and western blot analysis
Protein preparation and western blot assay were performed as described previously.39 Antibodies used were as follows: anti–KIF3A, anti–vimentin (Santa Cruz Biotechnology, dilution at 1:1000), anti–Cyclin D1, anti–Cyclin E1, anti–P21, anti–E2F1, anti–E‐cadherin, anti–MMP‐2, anti–ZEB1 (abcam, dilution at 1:1000), anti–MMP‐9 (Cloud‐Clone Corp, dilution at 1:1000), anti–β‐actin (TransGen Biotech, dilution at 1:4000) and anti–phospho‐Rb antibodies (Abcam, dilution at 1:5000).
2.6. MTT assay and colony‐formation assay
The MTT assay procedure was described previously.39 Cell viability was measured by using the MTT assay. Chemotherapeutic drugs doxorubicin (Solarbio) and cisplatin (Solarbio) were used. For colony formation assay, cells (3 × 10³ cells per well) were seeded into 6‐well plates for 2 weeks under regular culture conditions. Colonies formed were fixed with methanol for 30 minutes and were sequentially stained with 0.5% crystal violet for half an hour.
2.7. Cell cycle analysis
Cells were washed with ice‐cold PBS and harvested by trypsinization. After centrifugation for 5 min, the cells were washed with ice‐cold PBS and fixed with 70% ethanol overnight at 4°C. RNaseA (20 μg/mL) was added to the cells for 30 min (at 37°C). Propidium iodine (50 µg/mL) was added to the cells in the dark, which were analyzed by flow cytometry (BD Accuri C6).
2.8. Cell migration and invasion assay
A total of 8 × 10⁴ cells per well were suspended in serum‐free medium and loaded onto the upper compartment of the chamber coated with Matrigel (BD Biosciences). After being incubated at 37°C for 24 hours, the invasive cells that migrated through the Matrigel to the medium containing 15% serum in the lower compartment were stained with crystal violet. The numbers of invaded cells were counted in five random microscopic fields (100×). For migration assays, 4 × 10⁴ cells were plated on the upper chambers coated without Matrigel. The assay was then performed as for the invasive assay.
For the scratch test, cells in each group were seeded into 6‐well plates (5 × 10⁵ cells/well). Up to near confluence of the cell monolayer, a sterile pipette tip (200 µL) was used to draw a line across each well, followed by PBS washing to remove the debris or detached cells. The images of the scratch under a microscope were observed at 0 and 48 hours after scratching. Scratch widths were calculated using the Image J software. Cell migration distance equates to scratch width at 0 hour − scratch width at 48 hours.
2.9. Xenograft assays in nude mice
Scr‐shRNA and KIF3A‐shRNA MDA‐MB‐231 cells (4 × 10⁶) were inoculated subcutaneously into the right back areas of 6‐week‐old female BALB/c nude mice (n = 5 for each group), respectively. Tumor size and weight were measured every week and tumor volume was calculated with the formula: volume (mm3) = (width2 × length)/2. Other twenty 6‐week‐old female BABL/c mice were randomly assigned to two groups (10 mice per group) and injected with Scr‐shRNA and KIF3A‐shRNA MDA‐MB‐231 cells (2 × 10⁶) via the tail vein, respectively. The mice were killed 6 weeks later. The lungs of the mice were excised for H&E staining. Lung metastasis was quantified by counting the number of tumor foci in 10 randomly selected high‐power fields under a microscope. Animal experiments were approved by the Animal Ethics Committee of Qingdao University, China.
2.10. Statistical analysis
All statistical analyses were performed using SPSS 23.0 software. All values were presented as mean ± SD. Wilcoxon’s test was used for non–normal distributed data. The Student’s t test was used for data that were normally distributed. Differences were considered statistically significant at P < 0.05 and P < 0.01.
3. RESULTS
3.1. KIF3A mRNA and protein expression
We detected the KIF3A mRNA and protein levels in nine paired TNBC tissues and adjacent tissues by using western blot and real‐time RT‐PCR, respectively. The results showed that both mRNA (Figure 1A,B, P < 0.01) and protein levels (Figure 1C,D, P < 0.01) were significantly higher in TNBC tissues compared with that in adjacent tissues, suggesting that KIF3A was overexpressed in the TNBC tissues.
Figure 1.
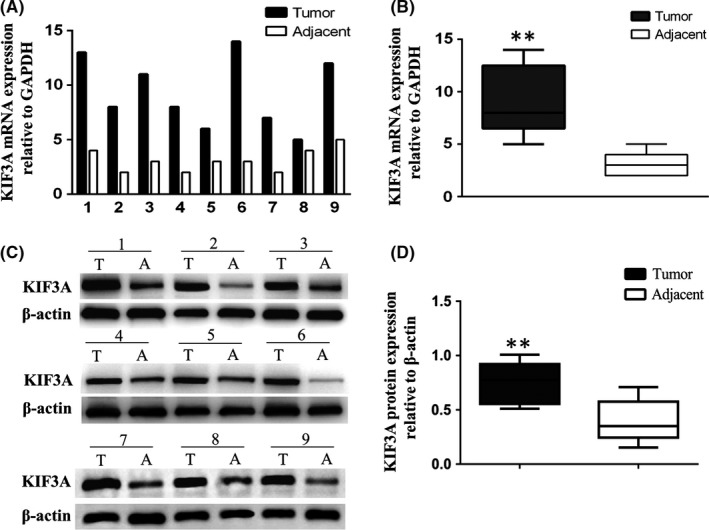
KIF3A mRNA and protein expressions were higher in triple negative breast cancer (TNBC) than in adjacent tissues. A, B, The KIF3A mRNA level was detected by real‐time RT‐PCR. C, D, The KIF3A protein level was detected by western blot assays. GAPDH and β‐actin were used as control, **P < 0.01
3.2. Immunohistochemistry assay
Immunohistochemistry staining showed that 70 out of 98 TNBC cases (71.4%) expressed higher levels of KIF3A (Figure 2A,B) than the adjacent tissues (Figure 2C,D). Strong positive staining is observed in the cytoplasm and membrane of tumor cells, and weak staining is observed in the normal duct epithelial cells (5.653 ± 0.719 vs 4.143 ± 0.974, Table 1, P < 0.001, Wilcoxon’s test). We also found that 25 of 32 cases (78.1%) showed stronger KIF3A expression in the metastatic cancer cells in the lymph node (Figure 2E) than in the primary cancer tissues (Figure 2F) (7.031 ± 0.740 vs 6.031 ± 0.647, Table 1, P < 0.001). Higher KIF3A expression was also observed in the primary tumors with lymph node metastasis than those without lymph node metastasis (Table 1, P < 0.01). In addition, patients with recurrence of carcinoma had higher KIF3A expression than those without recurrence (Table 1, P < 0.05). There were no significant differences between groups for age, tumor size or grade (Table 1).
Figure 2.
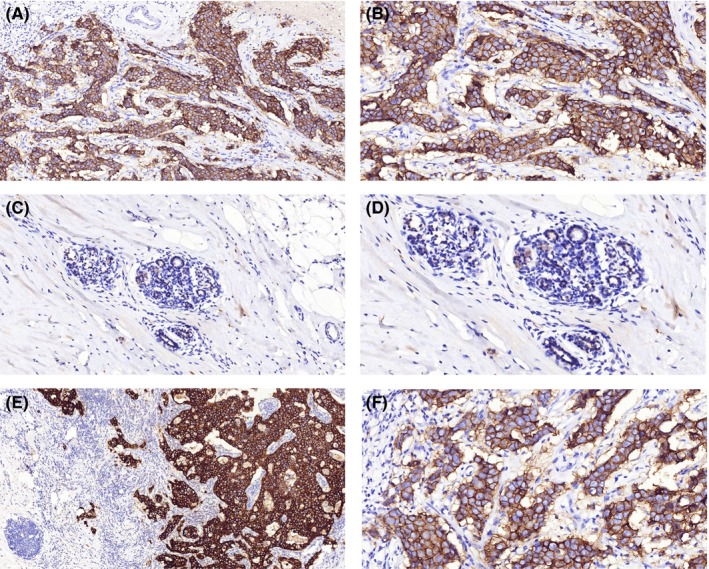
KIF3A was more highly expressed in triple negative breast cancer (TNBC) than in adjacent tissues by immunohistochemistry assay. A‐D, KIF3A was more highly expressed in cancer cells (A, B) than adjacent tissues (C, D). E, F, Moreover, the cancer cells metastasizing to lymph nodes (E) showed stronger KIF3A expression than the corresponding primary cancer cells (F). DAB (brown) served as chromogen (A, C and E 100×; B, D and F 200×)
3.3. Effect of KIF3A in different triple negative breast cancer cell lines
Western blot analyses of the KIF3A expression in MDA‐MB‐231, MDA‐MB‐468, BT549 and BT20 TNBC cell lines are shown in Figure 3A. Due to the higher expression of KIF3A, MDA‐MB‐231 and BT549 cells were chosen for silencing KIF3A gene expression by using KIF3A shRNA1#, 2# and 3#. The KIF3A‐shRNA 3# and 2# were more effective (Figure 3B, Figure S1) and were used for stably expressing KIF3A‐shRNA cell selection. Real‐time RT‐PCR (Figure 3C) and western blot analysis revealed that the expression of KIF3A mRNA and protein were obviously silenced. MDA‐MB‐468 cell line had the lowest expression of KIF3A protein (Figure 3A). Therefore, it was used to overexpress KIF3A (Figure 3D), and western blot analysis showed that the expression peak of KIF3A appeared at 48 h after KIF3A‐pEX transfection.
Figure 3.
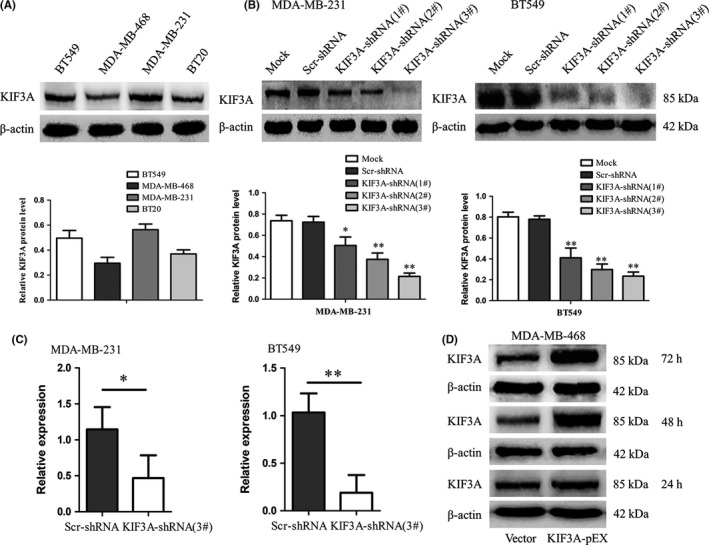
The silence and overexpression efficiency of KIF3A was detected. A, The cell lines MDA‐MB‐231, BT20, MDA‐MB‐468 and BT549 were detected by western blot for the expression of KIF3A, with both MDA‐MB‐231 and BT549 showing strong expression level. B, MDA‐MB‐231 and BT549 cells were chosen to deplete KIF3A using KIF3A‐shRNA (1#, 2# and 3#).The KIF3A‐shRNA 3# and 2# were used in the next experiment because of the higher efficiency in silencing of KIF3A. C, MDA‐MB‐231 and BT549 cells were detected to deplete KIF3A using KIF3A‐shRNA (3#) by real‐time RT‐PCR. D, MDA‐MB‐468 cells were used to overexpress KIF3A by KIF3A expression plasmid, and western blot analysis showed that the expression peak of KIF3A appeared at 48 h after KIF3A‐pEX transfection
3.4. Silencing of KIF3A suppresses tumor cell growth and induces G0/G1 phase arrest
To determine the effect of KIF3A depletion on cell proliferation, MTT and colony‐formation assays were performed. The growth curves were plotted in 5 days according to the OD values. The results showed that the growth of the KIF3A‐shRNA (3#) group was significantly slower than that of the Scr‐shRNA group in both MDA‐MB‐231 and BT549 cells. The growth of the KIF3A‐pEX group was significantly faster than that of the Vector group in MDA‐MB‐468 cells (Figure 4A, P < 0.01). As shown in Figure 4B, the colony numbers were 293.20 ± 20.93 versus 174.80 ± 46.26 in MDA‐MB‐231 cells (P < 0.01) and 251.20 ± 23.76 versus 142.20 ± 40.55 in BT549 cells (P < 0.01) before and after KIF3A knockdown. The colony numbers were 151.40 ± 68.58 versus 292.00 ± 75.59 in MDA‐MB‐468 cells (P < 0.05) before and after KIF3A overexpression. These results suggested that silencing of KIF3A inhibited cell proliferation.
Figure 4.
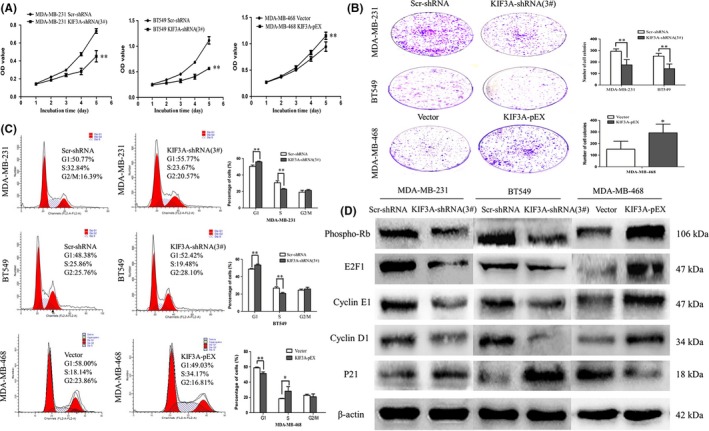
Silencing of KIF3A inhibits tumor cell growth and G1/S transition by repressing Rb‐E2F signaling. A, Cell proliferation was analyzed by MTT assay. Absorbance was measured at 490 nm. The data were presented as the means of six separated experiments, each performed in triplicate. B, Colony formation results of KIF3A depletion and overexpression were photographed and cell colony numbers are illustrated in a histogram. C, Flow cytometry results show the cell phase distribution of TNBC cell lines. Three independent experiments were conducted. *P < 0.05, **P < 0.01 D, The expressions of Phospho‐Rb, E2F1, Cyclin E1, Cyclin D1 and P21 were detected by western blot in MDA‐MB‐231, BT549 and MDA‐MB‐468 cells, respectively
To further validate the effect of KIF3A on the cell cycle, the flow cytometry technique was used. The cell phase distribution of Scr‐shRNA and KIF3A‐shRNA (3#) MDA‐MB‐231 cells was as follows: G1 phase: 50.36 ± 1.66% vs 55.94 ± 0.80% (P < 0.01); S phase: 30.53 ± 2.39% vs 22.81 ± 0.77% (P < 0.01); G2/M phase: 19.11 ± 2.38% vs 21.26 ± 1.15%. The cell phase distribution of Scr‐shRNA and KIF3A‐shRNA (3#) BT549 cells was as follows: G1 phase: 48.66 ± 0.79% vs 53.42 ± 1.08% (P < 0.01); S phase: 26.86 ± 1.53% vs 20.72 ± 1.12% (P < 0.01); G2/M phase: 24.48 ± 1.22% vs 25.86 ± 1.97%. Compared with Scr‐shRNA group cells, the proportion of cells in the G1 phase was significantly increased with a decrease in the proportion of cells in the S phase in KIF3A‐shRNA (3#) group cells (Figure 4C), suggesting induction of G0/G1 arrest. To confirm the above findings, cell cycle analysis was also performed in KIF3A overexpression MDA‐MB‐468 cells.
3.5. Silencing of KIF3A inhibits the G1/S transition by repressing the Rb‐E2F signaling pathway
To further explore the mechanism the effect of KIF3A on the cell proliferation and cell cycle, the expression of phospho‐Rb, E2F1, Cyclin D1, CyclinE1 and P21 was examined by western blot (Figure 4D). Phospho‐Rb, E2F1, CyclinD1 and CyclinE1 were decreased and P21 was increased in the KIF3A‐shRNA (3#) group of MDA‐MB‐231 and BT549 cells. Phospho‐Rb, E2F1, CyclinD1, CyclinE1 were increased and P21 was decreased in the KIF3A‐pEX group of MDA‐MB‐468 cells. These results further suggested that the G1/S transition was suppressed after silencing of KIF3A by repressing the Rb‐E2F signaling pathway.
3.6. Silencing of KIF3A inhibits tumor growth in nude mice
To further explore the tumor‐forming capacity of KIF3A in vivo, a human TNBC xenograft nude mice model was established. We found that the tumor size (842.67 ± 52.08 mm3 vs 1344.00 ± 91.02 mm3, P < 0.05, Figure 5A,B) and weight (206.80 ± 20.70 mg vs 418.90 ± 34.55 mg, P < 0.01, Figure 5C) in KIF3A‐shRNA (3#) cell xenografts were significantly decreased compared with the Scr‐shRNA MDA‐MB‐231 cell xenografts. Subsequently, the expressions of KIF3A, phospho‐Rb, E2F1, Cyclin E1, Cyclin D1, and P21 in xenografts were confirmed by IHC staining. The data showed an upregulation of P21 while downregulation of phospho‐Rb, E2F1, CyclinE1, and CyclinD1 in KIF3A‐shRNA (3#) cell xenografts (Figure 5D), which were consistent with the results in TNBC cell lines. It is obvious that suppression of KIF3A in MDA‐MB‐231 cells could inhibit tumor formation and growth.
Figure 5.
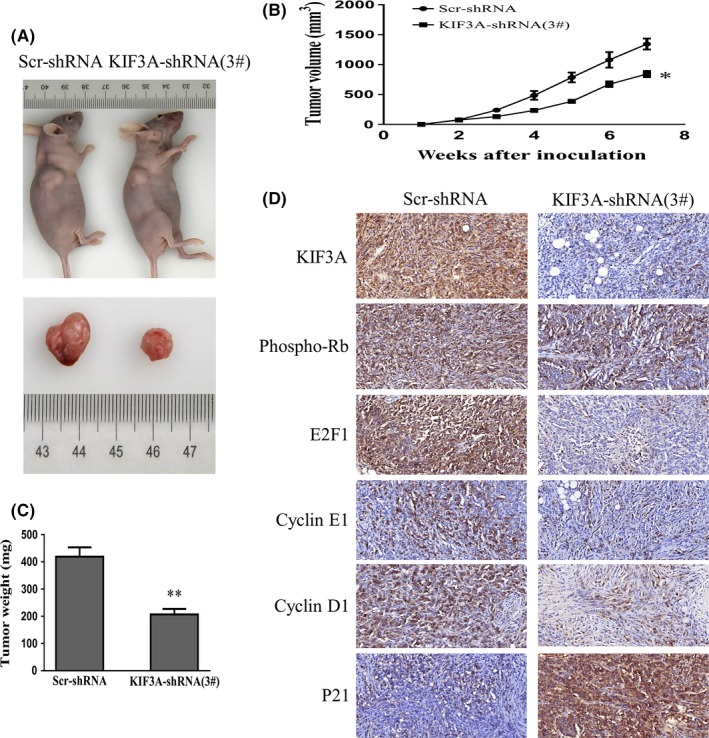
Silencing of KIF3A suppresses tumor growth on triple negative breast cancer (TNBC) cell xenograft. A, Images of Scr‐shRNA and KIF3A‐shRNA (3#) MDA‐MB‐231 cell xenograft tumor. B, C, Tumor growth curve and average weight were recorded and counted. *P < 0.05, **P < 0.01 D, Immunohistochemistry (IHC) staining in the tumor from KIF3A‐shRNA (3#) (400×) and control group (400×) is shown
3.7. Silencing of KIF3A inhibits cell migration and invasion by inhibiting epithelial‐mesenchymal transition in triple negative breast cancer cell lines
The metastatic potential of a tumor is dependent on the ability of tumor cells to migrate to distant sites. Transwell assays were performed in vitro to investigate the effects of KIF3A on the migration and invasion of TNBC cell lines. The result of the transwell assay showed that the numbers of migrated MDA‐MB‐231 cells were 222.80 ± 14.96 and 63.60 ± 8.14 in Scr‐shRNA and KIF3A‐shRNA (3#). The numbers of migrated BT549 cells were 313.00 ± 13.44 and 178.80 ± 10.23 in Scr‐shRNA and KIF3A‐shRNA (3#). These data suggested that cell migration was inhibited by KIF3A knockdown in MDA‐MB‐231 and BT549 cells (Figure 6A, P < 0.01). Furthermore, consistent with migration results, it was confirmed via the invasion assay results that the cell’s invasive ability was progressively suppressed by KIF3A depletion (Figure 6B, P < 0.01).
Figure 6.
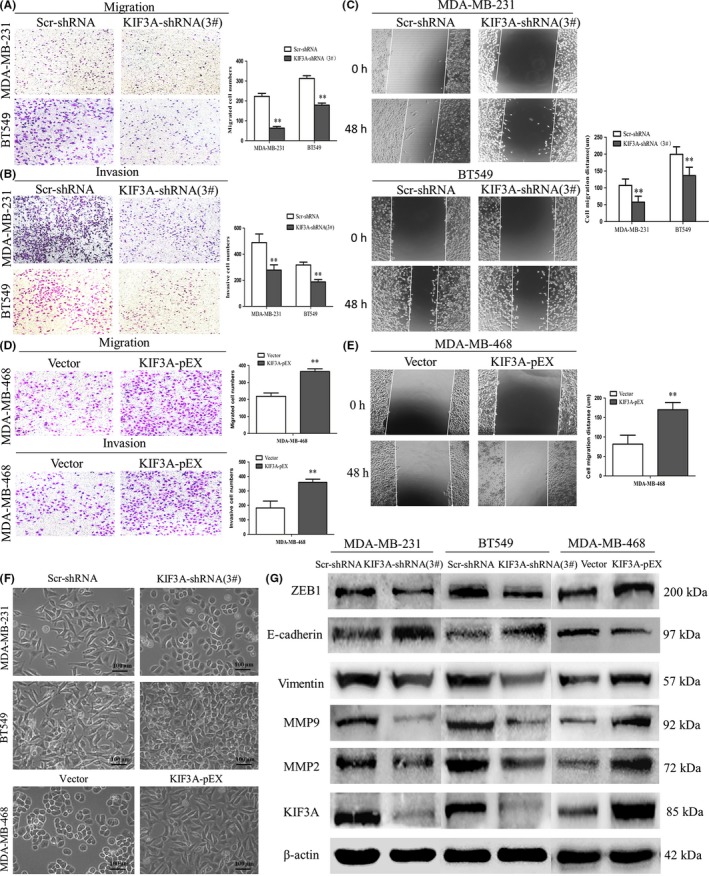
Silencing of KIF3A inhibits cell migration and invasion via epithelial‐to‐mesenchymal transition (EMT). A, B, Transwell and invasion assay showed the migrated and invasive cells of MDA‐MB‐231 and BT549 in Scr‐shRNA and KIF3A‐shRNA(3#). C, Images of scratch wound healing and comparison of migration distance of MDA‐MB‐231 and BT549 cells among Scr‐shRNA and KIF3A‐shRNA (3#) were detected by scratch test. D, E, The migration and invasive abilities of Vector and KIF3A‐pEX group cells were detected by migration and invasion assay in MDA‐MB‐468. Data were mean ± SD values from three experiments, each performed in triplicate. **P < 0.01. F, The morphology of Scr‐shRNA and KIF3A‐shRNA (3#) group cells was shown and the morphology of Vector and KIF3A‐pEX group cells was shown. G, The expressions of ZEB1, E‐cadherin, vimentin, MMP‐2, MMP‐9 and KIF3A were detected by western blotting
Similar to the results of the transwell assays, the results of scratch tests showed that migration distance was significantly reduced in the KIF3A‐shRNA (3#) group of MDA‐MB‐231 cells (57.57 ± 17.84 µm vs 107.20 ± 18.92 µm, P < 0.01, Figure 6C) and BT549 cells (136.30 ± 24.83 µm vs 199.50 ± 22.29 µm, P < 0.01, Figure 6C) compared to Scr‐shRNA groups.
To confirm the above findings, migration and invasion assays were also performed in KIF3A overexpression MDA‐MB‐468 cells and the results showed that the number of migrated MDA‐MB‐468 cells (364.40 ± 16.04 vs 218.40 ± 19.76, P < 0.01, Figure 6D) and the number of invasive MDA‐MB‐468 cells (359.40 ± 21.73 vs 182.40 ± 47.19, P < 0.01, Figure 6D) was increased in the KIF3A‐pEX group compared to the Vector group. The KIF3A‐pEX group showed significantly increased migration distance compared to the Vector group (170.00 ± 18.57 µm vs 81.73 ± 22.84 µm, P < 0.01, Figure 6E).
We also found that depletion of KIF3A led to morphological change of the TNBC cells. MDA‐MB‐231 and BT549 cells became shortened and more adherent to each other due to silencing of KIF3A (Figure 6F). In contrast, overexpression of KIF3A in MDA‐MB‐468 cells resulted to elongated morphological change and mesenchymal‐like properties (Figure 6F).
The EMT is a key step in cancer metastasis and invasion.40, 41 ZEB1, a key transcription factor, has been identified as mediating the initiation and execution of EMT. In addition, MMPs, a family of more than 28 enzymes, are thought to play a crucial role in tumor metastasis on the basis of their ability to degrade the extracellular matrix (ECM) and have been found to be upregulated in nearly all of the tumor types.42 MMP‐2 and MMP‐9, the two major members of the MMPs family, have been reported to be significant factors in breast cancer invasion and metastasis.43, 44
To further investigate the effect of KIF3A in EMT, E‐cadherin, vimentin (two hallmarks of EMT), ZEB1, MMP‐2, MMP‐9, and KIF3A were detected by western blot (Figure 6G). The expression level of E‐cadherin was increased, whereas the expression level of ZEB1, vimentin, MMP‐2, and MMP‐9 was decreased in KIF3A‐shRNA (3#) compared to Scr‐shRNA group cells in MDA‐MB‐231 and BT549 cells. This correlation was further confirmed by KIF3A overexpression in MDA‐MB‐468 cells, where decreased E‐cadherin expression and increased ZEB1, vimentin, MMP‐2, and MMP‐9 expressions were observed. These results indicated that KIF3A depletion might suppress cell migration and invasion by inhibiting EMT in TNBC cells. In addition, ZEB1 is required for KIF3A‐mediated EMT.
3.8. KIF3A depletion inhibits metastasis in vivo
Nude mice were injected with KIF3A‐shRNA (3#) MDA‐MB‐231 cells via the tail vein to confirm the effect of KIF3A knockdown on tumor migration and invasion in vivo. Body weight of the mice did not differ (Figure 7A) after 6 weeks of injection. However, compared with the control group, the lungs from the KIF3A‐shRNA (3#) group were significantly lighter (Figure 7B). Only 5 of 10 mice from the KIF3A‐shRNA (3#) group developed lung metastasis, while all 10 mice presented with lung metastasis in the control group. We also found that the number of tumor foci in the control group was much more than that in the KIF3A‐shRNA (3#) group (Figure 7C‐E). Furthermore, the expression of E‐cadherin was increased and expressions of vimentin, ZEB1, MMP‐2 and MMP‐9 were reduced in KIF3A‐shRNA (3#) cell xenografts compared with the control group based on IHC staining (Figure 7F), which were in accord with the results in TNBC cell lines. These data showed that KIF3A knockdown significantly inhibits TNBC metastasis in vivo and in vitro.
Figure 7.
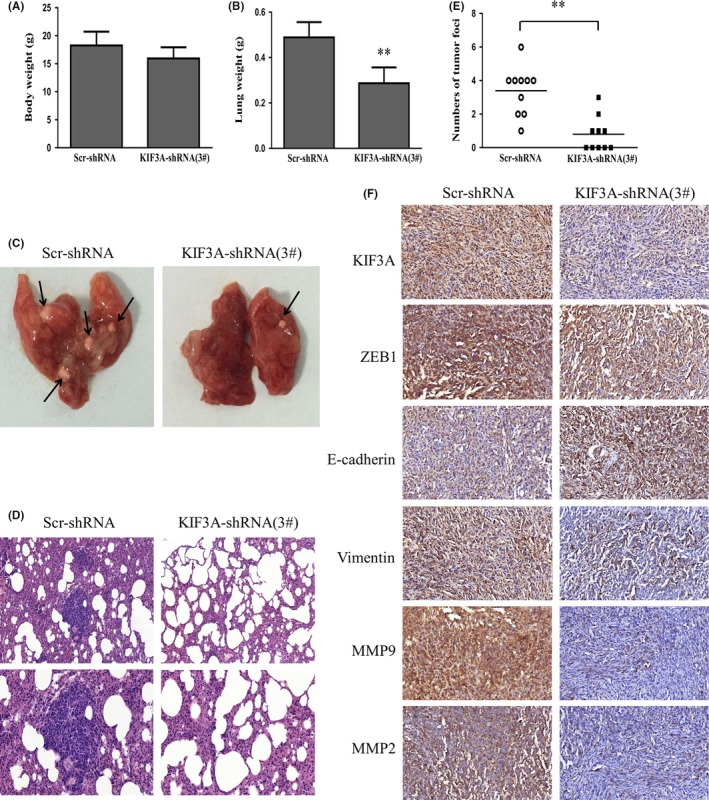
KIF3A knockdown suppresses triple negative breast cancer (TNBC) metastasis in vivo. Six‐week‐old female nude BALB/c mice were injected with 2 × 10⁶ Scr‐shRNA or KIF3A‐shRNA (3#) MDA‐MB‐231 cells via the tail vein. A, B, The body weight and the lung weight of the mice were measured 6 weeks later. **P < 0.01 C, D, Images of lung metastasis and H&E staining (upper: 200×; lower: 400×) are shown. E, The numbers of metastatic nodules in the lung were calculated in 10 randomly selected high‐power fields under a microscope. **P < 0.01 F, Immunohistochemical staining in xenograft (400×)
3.9. KIF3A overexpression correlates with chemoresistance
To evaluate whether KIF3A expression modulates chemoresistance, the cell viability assay showed that silencing of KIF3A evidently decreased the IC50 for doxorubicin in MDA‐MB‐231 cells (1.59 ± 0.46 μg/mL vs 2.51 ± 0.65 μg/mL, P < 0.05, Figure 8A), whereas silencing of KIF3A had little effect on cisplatin resistance in MDA‐MB‐231 cells (14.58 ± 5.86 μg/mL vs 14.98 ± 3.20 μg/mL, P > 0.05, Figure 8B). We also found that KIF3A overexpression evidently increased the IC50 for doxorubicin in MDA‐MB‐468 cells (0.83 ± 0.03 μg/mL vs 0.64 ± 0.03 μg/mL, P < 0.05, Figure 8C), whereas KIF3A overexpression had little impact on cisplatin resistance (1.74 ± 0.37 μg/mL vs 1.72 ± 0.15 μg/mL, P > 0.05, Figure 8D). However, KIF3A knockdown had little impact on doxorubicin and cisplatin resistance in BT549 cells (0.84 ± 0.19 μg/mL vs 1.04 ± 0.07 μg/mL, 2.61 ± 0.43 μg/mL vs 2.34 ± 0.27 μg/mL, P > 0.05, Figure 8E,F). These results suggested that knockdown of KIF3A might restore chemosensitivity of doxorubicin in TNBC but not to cisplatin.
Figure 8.
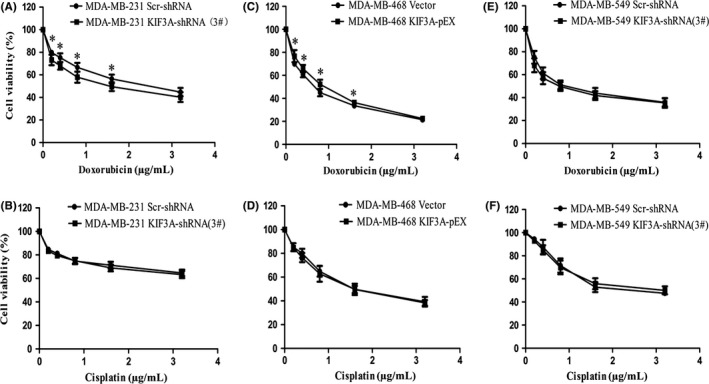
KIF3A induces doxorubicin‐resistance but not to cisplatin summary. A, C, E, IC50 of doxorubicin was determined using the MTT assay. Cells (2 × 10³) were seeded and exposed to doxorubicin for 48 h. B, D, F, IC50 of cisplatin was determined using the MTT assay. Cells (2 × 10³) were seeded and exposed to cisplatin for 48 h
4. DISCUSSION
In this study, we provide a comprehensive set of data suggesting significant roles for KIF3A in TNBC progression. We found that both the KIF3A mRNA and protein levels were significantly increased in TNBC tissues compared with the corresponding adjacent tissues. IHC analysis, consistent with these findings, showed that KIF3A was overexpressed in TNBC tissues compared to adjacent tissues and the higher expression was correlated significantly with tumor recurrence and lymph node metastasis, demonstrating a dramatic association of KIF3A expression with progression of TNBC, especially tumor growth and metastasis. KIF3A was shown to support the proper function of the Rb‐E2F pathway and EMT transcription program. Mouse xenograft experiments revealed the role of KIF3A in promoting TNBC tumorigenesis and metastasis in vivo. These findings suggested that KIF3A holds potential as a tumor promoter and prognostic biomarker for metastasis in TNBC, and serves as a therapeutic target.
The cell cycle is important in regulating cell growth.45 We showed that KIF3A inhibits p21 expression to promote activity of CDKs. Consequent Rb phosphorylation by Cyclin/CDK complexes leads to the dissociation of Rb‐E2F complexes, and dissociated E2F1 was released and translocated to the nucleus to enhance the transcription of its target genes (Figure 9). These results strongly suggest that silencing of KIF3A inhibits the G1/S transition by suppressing the Rb‐E2F signaling pathway. Previous data showed that KIF3A was associated with cyclin D1 in the genesis or progression of a few of human cancers.36, 37 EMT is accompanied by massive changes in cell behavior, such as cell migration and invasion.46, 47 ZEB1, a member of the zinc‐finger E‐box‐binding homeobox (ZEB) protein family, is a core factor responsible for mediating EMT in many types of cancers.22 Overwhelming evidence shows that tumor‐associated MMPs can also promote processes associated with EMT.48 We showed that KIF3A led to increased expression of MMPs and ZEB1. Tumor‐associated MMPs promoted processes associated with EMT, and ZEB1 directly promoted the repression of E‐cadherin at the transcriptional level, resulting in EMT and acceleration of migration and metastasis (Figure 9). Part of these results was consistent with the previous study demonstrating that knockdown of KIF3A significantly inhibited hypoxia‐induced migration and invasion and the EMT process in thyroid cancer.49 Consistent with the previous study, KIF3A depletion led to decreased expression of MMP‐9 in prostate cancer.36
Figure 9.
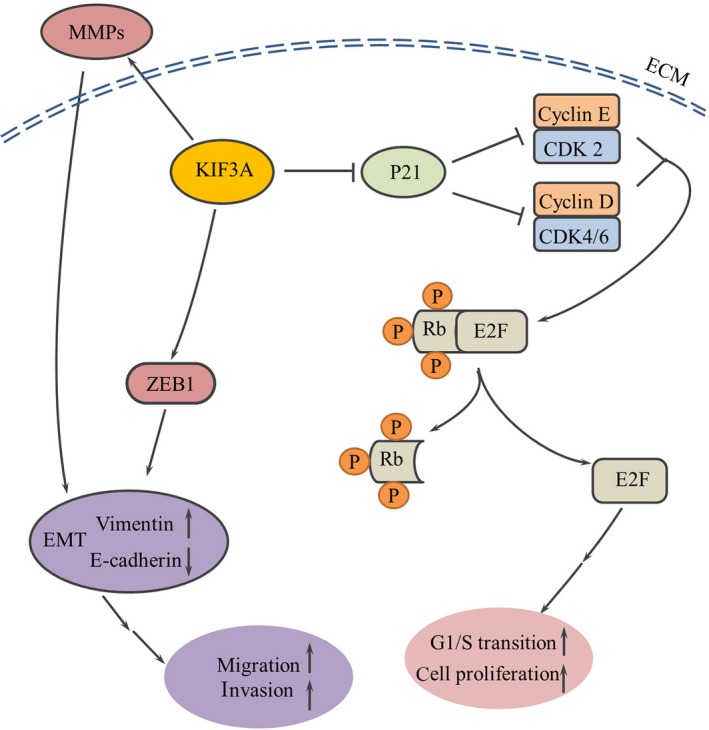
Schematic representation of KIF3A inducing triple negative breast cancer (TNBC) cell proliferation, migration and metastasis. KIF3A inhibits p21 expression to promote activity of cyclin‐dependent kinases (CDKs). Consequent Rb phosphorylation by Cyclin/CDK complexes leads to the release of Rb‐E2F complexes, resulting in increasing the expression of E2F and cell cycle‐related proteins, which increases cell cycle progression and finally promotes TNBC cell proliferation. KIF3A also leads to increased expression of MMPs and ZEB1, promoting processes of EMT, which finally accelerates TNBC cell migration and metastasis
Rb‐E2F signaling might also be related to epithelial‐mesenchymal transition. Depletion of Rb results in the downregulation of the epithelial marker E‐cadherin, and the inactivation of Rb contributes to tumor progression not only through loss of cell cycle control but also through upregulation of ZEB expression and induction of an invasive phenotype in breast cancer cells.50 It was previously demonstrated that mouse embryonic fibroblasts (MEF) with mutant Rb family members (Rb1, p107 and p130) led to tumor initiation in part through induction of the EMT transcription factor, ZEB1.51 Chellappan et al reported that E2F1 bind to, activate and increase expression of fibronectin and vimentin promoters and this further contributed to an EMT‐like phenotype in non–SCLC (NSCLC) cell lines, while Rb suppressed this induction.52
The chemotherapy resistance remains a major challenge for TNBC. It has been shown that overexpression of the kinesin KIFC3 was significantly correlated with resistance to both docetaxel and paclitaxel but not to platinum‐based chemotherapy in the NCI‐60 cell line dataset.53 Singel et al reported that KIF14 contributed to increasing resistance to docetaxel but not to doxorubicin, carboplatin or gemcitabine.54 Our results suggest that KIF3A overexpression confers chemoresistance to doxorubicin but not to cisplatin of TNBC cells. In addition, chemical resistance to doxorubicin might be related to TNBC cell lines, which may be caused by the high heterogeneity of TNBC.
In conclusion, KIF3A was overexpressed in TNBC and this overexpression was associated with tumor recurrence and lymph node metastasis. Furthermore, silencing of KIF3A suppresses proliferation, migration and invasion in TNBC cell lines. KIF3A might have potential as a therapeutic drug target for human TNBC.
CONFLICT OF INTEREST
The authors declare no conflict of interest.
Supporting information
ACKNOWLEDGMENTS
This research was supported by the National Natural Science Foundation of China (Nos. 81672606, 81702677 and 81602320).
Wang W, Zhang R, Wang X, et al. Suppression of KIF3A inhibits triple negative breast cancer growth and metastasis by repressing Rb‐E2F signaling and epithelial‐mesenchymal transition. Cancer Sci. 2020;111:1422–1434. 10.1111/cas.14324
REFERENCES
- 1. Bray F, Ferlay J, Soerjomataram I, Siegel RL, Torre LA, Jemal A. Global cancer statistics 2018: GLOBOCAN estimates of incidence and mortality worldwide for 36 cancers in 185 countries. CA Cancer J Clin. 2018;68:394‐424. [DOI] [PubMed] [Google Scholar]
- 2. Guney EG, Cecener G, Egeli U, Tunca B. Triple negative breast cancer: new therapeutic approaches and BRCA status. APMIS. 2018;126:371‐379. [DOI] [PubMed] [Google Scholar]
- 3. Malorni L, Shetty PB, De Angelis C, et al. Clinical and biologic features of triple‐negative breast cancers in a large cohort of patients with long‐term follow‐up. Breast Cancer Res Treat. 2012;136:795‐804. [DOI] [PMC free article] [PubMed] [Google Scholar]
- 4. Bianchini G, Balko JM, Mayer IA, Sanders ME, Gianni L. Triple‐negative breast cancer: challenges and opportunities of a heterogeneous disease. Nat Rev Clin Oncol. 2016;13:674‐690. [DOI] [PMC free article] [PubMed] [Google Scholar]
- 5. Nemajerova A, Talos F, Moll UM, Petrenko O. Rb function is required for E1A‐induced S‐phase checkpoint activation. Cell Death Differ. 2008;15:1440‐1449. [DOI] [PubMed] [Google Scholar]
- 6. Sherr CJ. Cancer cell cycles. Science. 1996;274:1672‐1677. [DOI] [PubMed] [Google Scholar]
- 7. Weinberg RA. The retinoblastoma protein and cell cycle control. Cell. 1995;81:323‐330. [DOI] [PubMed] [Google Scholar]
- 8. Bertoli C, Skotheim JM, Bruin RAMD. Control of cell cycle transcription during G1 and S phases. Nat Rev Mol Cell Biol. 2013;14:518. [DOI] [PMC free article] [PubMed] [Google Scholar]
- 9. Lee RJ, Albanese C, Fu M, et al. Cyclin D1 is required for transformation by activated Neu and is induced through an E2F‐dependent signaling pathway. Mol Cell Biol. 2000;20:672‐683. [DOI] [PMC free article] [PubMed] [Google Scholar]
- 10. Botz J, Zerfass‐Thome K, Spitkovsky D, et al. Cell cycle regulation of the murine cyclin E gene depends on an E2F binding site in the promoter. Mol Cell Biol. 1996;16:3401‐3409. [DOI] [PMC free article] [PubMed] [Google Scholar]
- 11. Dick FA, Rubin SM. Molecular mechanisms underlying RB protein function. Nat Rev Mol Cell Biol. 2013;14:297‐306. [DOI] [PMC free article] [PubMed] [Google Scholar]
- 12. Chellappan SP, Hiebert S, Mudryj M, Horowitz JM, Nevins JR. The E2F transcription factor is a cellular target for the RB protein. Cell. 1991;65:1053. [DOI] [PubMed] [Google Scholar]
- 13. Bagchi S, Weinmann R, Raychaudhuri P. The retinoblastoma protein copurifies with E2F‐I, an E1A‐regulated inhibitor of the transcription factor E2F. Cell. 1991;65:1063. [DOI] [PubMed] [Google Scholar]
- 14. Abukhdeir AM, Park BH. P21 and p27: roles in carcinogenesis and drug resistance. Expert Rev Mol Med. 2008;10:e19. [DOI] [PMC free article] [PubMed] [Google Scholar]
- 15. Gartel AL, Serfas MS, Tyner AL. p21–negative regulator of the cell cycle. Procsocexpbiolmed. 1996;213:138. [DOI] [PubMed] [Google Scholar]
- 16. Abbas T, Dutta A. p21 in cancer: intricate networks and multiple activities. Nat Rev Cancer. 2009;9:400‐414. [DOI] [PMC free article] [PubMed] [Google Scholar]
- 17. Klymkowsky MW, Savagner P. Epithelial‐mesenchymal transition: a cancer researcher’s conceptual friend and foe. Am J Pathol. 2009;174:1588‐1593. [DOI] [PMC free article] [PubMed] [Google Scholar]
- 18. Moustakas A, Heldin C. Signaling networks guiding epithelial‐mesenchymal transitions during embryogenesis and cancer progression. Cancer Sci. 2010;98:1512‐1520. [DOI] [PMC free article] [PubMed] [Google Scholar]
- 19. Singh A, Settleman J. EMT, cancer stem cells and drug resistance: an emerging axis of evil in the war on cancer. Oncogene. 2010;29:4741‐4751. [DOI] [PMC free article] [PubMed] [Google Scholar]
- 20. Gheldof A, Berx G. Cadherins and epithelial‐to‐mesenchymal transition. Prog Mol Biol Transl Sci. 2013;116:317. [DOI] [PubMed] [Google Scholar]
- 21. Al Moustafa AE, Achkhar A, Yasmeen A. EGF‐receptor signaling and epithelial‐mesenchymal transition in human carcinomas. Front Biosci. 2012;4:671. [DOI] [PubMed] [Google Scholar]
- 22. Zhang P, Sun Y, Ma L. ZEB1: at the crossroads of epithelial‐mesenchymal transition, metastasis and therapy resistance. Cell Cycle. 2015;14:481‐487. [DOI] [PMC free article] [PubMed] [Google Scholar]
- 23. Hirokawa N, Takemura R. Molecular motors and mechanisms of directional transport in neurons. Nat Rev Neurosci. 2005;6:201‐214. [DOI] [PubMed] [Google Scholar]
- 24. Hirokawa N, Noda Y. Intracellular transport and kinesin superfamily proteins, KIFs: structure, function, and dynamics. Physiol Rev. 2008;88:1089‐1118. [DOI] [PubMed] [Google Scholar]
- 25. Malicki J, Besharse JC. Kinesin‐2 family motors in the unusual photoreceptor cilium. Vision Res. 2012;75:33‐36. [DOI] [PMC free article] [PubMed] [Google Scholar]
- 26. Yang Z, Roberts EA, Goldstein LSB. Functional analysis of mouse C‐terminal kinesin motor KifC2. Mol Cell Biol. 2001;21:2463‐2466. [DOI] [PMC free article] [PubMed] [Google Scholar]
- 27. Keil R, Kiessling C, Hatzfeld M. Targeting of p0071 to the midbody depends on KIF3. J Cell Sci. 2009;122:1174. [DOI] [PubMed] [Google Scholar]
- 28. Xiaodong H, Fang L, Changlai Z, et al. Suppression of KIF3B expression inhibits human hepatocellular carcinoma proliferation. Dig Dis Sci. 2014;59:795. [DOI] [PMC free article] [PubMed] [Google Scholar]
- 29. Shen HQ, Xiao YX, She ZY, Tan FQ, Yang WX. A novel role of KIF3b in the seminoma cell cycle. Exp Cell Res. 2017;352:95. [DOI] [PubMed] [Google Scholar]
- 30. Junlin T, Tatemitsu R, Yosuke T, et al. The KIF3 motor transports N‐cadherin and organizes the developing neuroepithelium. Nat Cell Biol. 2005;7:474‐482. [DOI] [PubMed] [Google Scholar]
- 31. Gumy LF, Chew DJ, Tortosa E, et al. The kinesin‐2 family member KIF3C regulates microtubule dynamics and is required for axon growth and regeneration. J Neurosci. 2013;33:11329‐11345. [DOI] [PMC free article] [PubMed] [Google Scholar]
- 32. Huangfu D, Liu A, Rakeman AS, Murcia NS, Niswander L, Anderson KV. Hedgehog signalling in the mouse requires intraflagellar transport proteins. Nature. 2003;426:83‐87. [DOI] [PubMed] [Google Scholar]
- 33. Stephanie GL, Rank KC, Bensel BM, Taylor KC, Ivan R, Gilbert SP. Kinesin‐2 KIF3AC and KIF3AB can drive long‐range transport along microtubules. Biophys J. 2015;109:1472‐1482. [DOI] [PMC free article] [PubMed] [Google Scholar]
- 34. Muresan V, Abramson T, Lyass A, et al. KIF3C and KIF3A form a novel neuronal heteromeric kinesin that associates with membrane vesicles. Mol Biol Cell. 1998;9:637‐652. [DOI] [PMC free article] [PubMed] [Google Scholar]
- 35. Yamazaki H, Nakata T, Okada Y, Hirokawa N. KIF3A/B: a heterodimeric kinesin superfamily protein that works as a microtubule plus end‐directed motor for membrane organelle transport. J Cell Biol. 1995;130:1387‐1399. [DOI] [PMC free article] [PubMed] [Google Scholar]
- 36. Liu Z, Rebowe RE, Wang Z, et al. KIF3a promotes proliferation and invasion via Wnt signaling in advanced prostate cancer. Mol Cancer Res. 2014;12:491‐503. [DOI] [PMC free article] [PubMed] [Google Scholar]
- 37. Kim M, Suh YA, Oh JH, Lee BR, Kim J, Jang SJ. KIF3A binds to β‐arrestin for suppressing Wnt/β‐catenin signalling independently of primary cilia in lung cancer. Sci Rep. 2016;6:32770. [DOI] [PMC free article] [PubMed] [Google Scholar]
- 38. Takeshi J, Yoshihiro K, Ryo K, et al. Identification of a link between the tumour suppressor APC and the kinesin superfamily. Nat Cell Biol. 2002;4:323‐327. [DOI] [PubMed] [Google Scholar]
- 39. Wang CQ, Xiang FG, Li YJ, et al. Relation between the expression of mitotic centromere–associated kinesin and the progression of squamous cell carcinoma of the tongue. Oral Surg Oral Med Oral Pathol Oral Radiol. 2014;117:353‐360. [DOI] [PubMed] [Google Scholar]
- 40. Wu Y, Sarkissyan M, Vadgama JV. Epithelial‐mesenchymal transition and breast cancer. J Clin Med. 2016;5:13. [DOI] [PMC free article] [PubMed] [Google Scholar]
- 41. Bartis D, Mise N, Mahida RY, Eickelberg O, Thickett DR. Epithelial‐mesenchymal transition in lung development and disease: does it exist and is it important? Thorax. 2014;69:760‐765. [DOI] [PubMed] [Google Scholar]
- 42. Mao W, Sun Y, Zhang H, Cao L, Wang J, He P. A combined modality of carboplatin and photodynamic therapy suppresses epithelial‐mesenchymal transition and matrix metalloproteinase‐2 (MMP‐2)/MMP‐9 expression in HEp‐2 human laryngeal cancer cells via ROS‐mediated inhibition of MEK/ERK signalling pathway. Lasers Med Sci. 2016;31:1‐9. [DOI] [PubMed] [Google Scholar]
- 43. Talvensaarimattila A, Pääkkö P, Höyhtyä M, Blancosequeiros G, Turpeenniemihujanen T. Matrix metalloproteinase‐2 immunoreactive protein: a marker of aggressiveness in breast carcinoma. Cancer. 1998;83:1153. [DOI] [PubMed] [Google Scholar]
- 44. Remacle AG, Noël A, Duggan C, et al. Assay of matrix metalloproteinases types 1, 2, 3 and 9 in breast cancer. Br J Cancer. 1998;77:926. [DOI] [PMC free article] [PubMed] [Google Scholar]
- 45. Boxem M. Cyclin‐dependent kinases in C elegans . Cell Div. 2006;1:1‐12. [DOI] [PMC free article] [PubMed] [Google Scholar]
- 46. Blick T, Widodo E, Hugo H, et al. Epithelial mesenchymal transition traits in human breast cancer cell lines. Clin Exp Metastasis. 2008;25:629‐642. [DOI] [PubMed] [Google Scholar]
- 47. Trimboli AJ, Fukino K, Bruin AD, et al. Direct evidence for epithelial‐mesenchymal transitions in breast cancer. Cancer Res. 2008;68:937. [DOI] [PubMed] [Google Scholar]
- 48. Jung YS, Liu XW, Chirco R, Warner RB, Fridman R, Kim HR. TIMP‐1 induces an EMT‐like phenotypic conversion in MDCK cells independent of its MMP‐inhibitory domain. PLoS ONE. 2012;7:e38773. [DOI] [PMC free article] [PubMed] [Google Scholar]
- 49. Wang S‐C, Hu Z, Chai D‐S, Chen C‐B, Wang Z‐Y, Wang L. Knockdown of KIF3a inhibits hypoxia‐induced epithelial‐to‐mesenchymal transition via suppression of the Wnt/β‐catenin pathway in thyroid cancer. Int J Clin Exp Pathol. 2016;9:1014‐1021. [Google Scholar]
- 50. Yoshimi A, Hidemi H, Mikako S, et al. Induction of ZEB proteins by inactivation of RB protein is key determinant of mesenchymal phenotype of breast cancer. J Biol Chem. 2012;287:7896. [DOI] [PMC free article] [PubMed] [Google Scholar]
- 51. Yongqing L, Ester ST, Xiaoqin L, et al. Sequential inductions of the ZEB1 transcription factor caused by mutation of Rb and then Ras proteins are required for tumor initiation and progression. J Biol Chem. 2013;288:11572‐11580. [DOI] [PMC free article] [PubMed] [Google Scholar]
- 52. Pillai S, Trevino J, Rawal B, et al. β‐arrestin‐1 mediates nicotine‐induced metastasis through E2F1 target genes that modulate epithelial‐mesenchymal transition. Cancer Res. 2015;75:1009‐1020. [DOI] [PMC free article] [PubMed] [Google Scholar]
- 53. Min HT, De S, Bebek G, et al. Specific kinesin expression profiles associated with taxane resistance in basal‐like breast cancer. Breast Cancer Res Treat. 2012;131:849‐858. [DOI] [PMC free article] [PubMed] [Google Scholar]
- 54. Singel SM, Cornelius C, Zaganjor E, et al. KIF14 promotes AKT phosphorylation and contributes to chemoresistance in triple‐negative breast cancer 1 2. Neoplasia. 2014;16:247‐256.e2. [DOI] [PMC free article] [PubMed] [Google Scholar]
Associated Data
This section collects any data citations, data availability statements, or supplementary materials included in this article.
Supplementary Materials


