Abstract
Postoperative distant metastasis dramatically affects rectal cancer patients who have undergone neoadjuvant chemoradiotherapy (NACRT). Here, we clarified the association between NACRT‐mediated mammalian target of rapamycin (mTOR) signaling pathway activation and rectal cancer metastatic potential. We performed immunohistochemistry for phosphorylated mTOR (p‐mTOR) and phosphorylated S6 (p‐S6) on surgical specimen blocks from 98 rectal cancer patients after NACRT (cohort 1) and 80 colorectal cancer patients without NACRT (cohort 2). In addition, we investigated the association between mTOR pathway activity, affected by irradiation, and the migration ability of colorectal cancer cells in vitro. Based on the results of the clinical study, p‐mTOR was significantly overexpressed in cohort 1 (with NACRT) as compared to levels in cohort 2 (without NACRT) (P < .001). High p‐mTOR and p‐S6 levels correlated with the development of distant metastasis only in cohort 1. Specifically, high p‐S6 expression (HR 4.51, P = .002) and high pathological T‐stage (HR 3.73, P = .020) after NACRT were independent predictors of the development of distant metastasis. In vitro, p‐S6 levels and migration ability increased after irradiation in SW480 cells (TP53 mutation‐type) but decreased in LoVo cells (TP53 wild‐type), suggesting that irradiation modulates mTOR signaling and migration through cell type‐dependent mechanisms. We next assessed the expression level of p53 by immunostaining in cohort 1 and demonstrated that p‐S6 was overexpressed in samples with high p53 expression as compared to levels in samples with low p53 expression (P = .008). In conclusion, p‐S6 levels after NACRT correlate with postoperative distant metastasis in rectal cancer patients, suggesting that chemoradiotherapy might modulate the mTOR signaling pathway, promoting metastasis.
Keywords: chemoradiotherapy, distant metastasis, epithelial–mesenchymal transition, mTOR, rectal cancer
The postoperative distant recurrence is critical in rectal cancer patients who have received neoadjuvant chemoradiotherapy (NACRT). We investigated NACRT‐mediated mTOR activation and metastatic potential of rectal cancer, identifying p‐S6 expression as a NACRT predictor of postoperative distant metastasis in rectal cancer patients, suggesting that chemoradiotherapy may modulate the mTOR signaling pathway to promote metastasis.
![]()
1. INTRODUCTION
The combination of fluorouracil‐based neoadjuvant chemoradiotherapy (NACRT) and total mesenteric excision (TME) is the standard therapy for locally advanced rectal cancer. Although NACRT improves local control, its benefits for patient survival and distant recurrence remain unclear.1, 2, 3 Previous reports showed that 18.5%‐29.8% of patients with locally advanced rectal cancer who underwent NACRT with TME developed postoperative distant metastasis.3, 4
How NACRT modulates the rate of distant metastasis after surgery in rectal cancer remains controversial. Preclinical studies including colorectal cancer in vitro studies demonstrated irradiation‐induced metastasis in solid cancers.5, 6, 7 Tumor cells that survive ionizing radiation (IR) often acquire an aggressive phenotype characterized by high motility and invasiveness, such as the epithelial–mesenchymal transition (EMT) phenotype. In contrast, the inhibitory effect of IR on the growth of distant tumors, known as the abscopal effect, has also been reported.8, 9 In a previous clinical study of patients with rectal cancer receiving NACRT, postoperative recurrence was found to be more likely among patients with EMT‐like alterations in protein expression.10 These findings suggested that IR‐enhanced metastasis might occur in rectal cancer patients.
The PI3K/AKT/mTOR axis is a known intracellular signaling pathway that promotes distant metastasis through EMT induction.11, 12 Previously, we demonstrated activation of the mammalin target of rapamycin (mTOR) pathway by IR in two colorectal cancer (CRC) cell lines.13 However, it was unclear whether IR‐induced mTOR pathway activation promotes metastasis. Furthermore, suppression, and not activation, of the mTOR pathway by IR has been shown in other CRC cell lines,14 suggesting that irradiation‐mediated effects differ between cell lines. We hypothesized that the modulation of mTOR activity by NACRT influences the distant metastatic potential of rectal cancer after surgery. We tested our hypothesis using clinical resected specimens and in vitro cell lines, evaluating expression levels of phosphorylated S6 ribosomal protein (p‐S6), which is central to the mTOR pathway.
2. METHODS
2.1. Study design
A previous immunohistochemical (IHC) analysis of paraffin‐embedded advanced colorectal cancer samples demonstrated that phosphorylated mTOR pathway‐related proteins are overexpressed at the cancer invasion front.15 This revealed that IHC staining of biopsy samples is inappropriate for analyzing mTOR signaling activity in colorectal cancer. In our institution, patients with locally advanced lower rectal cancer undergo NACRT and curative surgery, whereas patients with middle and upper rectal cancer or colon cancer do not. Therefore, we utilized resected specimens from patients with low rectal cancer receiving NACRT (cohort 1). In addition, resected specimens from the curative surgery of patients with colon and rectal cancer also not receiving neoadjuvant therapy (cohort 2) were evaluated. The present study was approved by the ethics committee of our institution (No. 3252‐(8)) and written informed consent was obtained from all participants in the study.
2.2. Patients
A total of 98 consecutive patients diagnosed with lower rectal adenocarcinoma of clinical stage T3/4 or N positive and M0 disease who underwent NACRT and curative surgery between January 2003 and December 2013 were enrolled in cohort 1. In addition, 80 patients diagnosed with colorectal adenocarcinoma of a clinical stage comparable to that of cohort 1 who underwent curative surgery without neoadjuvant therapy between January and December 2012 were enrolled in cohort 2. All patients in cohort 1 received a total dose of 50.4 Gy of radiation in 25 fractions and concomitant 5‐fluorouracil‐based chemotherapy followed by radical surgery using the standard TME technique 6‐10 weeks after NACRT. Patients with synchronous cancer at the time of surgery (n = 8), those with pathological complete regression after NACRT (n = 10) and those with a small amount of residual tumor after NACRT (which was unevaluable by IHC staining; n = 5) were excluded.
All resected specimens from cohorts 1 and 2 were assessed pathologically and all patients underwent a standardized follow‐up schedule based on the eighth edition of the American Joint Committee on Cancer. The median follow‐up period was 80.4 months in cohort 1 and 67.2 months in cohort 2. Evaluated oncological outcomes included overall survival, relapse‐free survival and cumulative incidences of distant metastasis after surgery.
2.3. Immunohistochemistry of mammalian target of rapamycin‐related protein
Tissue sections (4‐mm thickness) from formalin‐fixed, paraffin‐embedded tissue blocks were deparaffinized in xylene and rehydrated in a graded ethanol series. Antigen retrieval was performed using citrate buffer (pH 6.0) in an autoclave at 121°C for 10 minutes. After blocking endogenous peroxidase activity with 0.3% hydrogen peroxide in methanol for 30 minutes, sections were incubated with 10% normal goat serum (Nichirei Biosciences) for 30 minutes. The sections were first incubated with primary rabbit monoclonal antibodies against mTOR (clone 7C10; Cell Signaling Technology [CST], Japan; 1:100 dilution), phosphorylated mTOR (p‐mTOR, Ser2448, clone 49F9; CST; 1:100 dilution), phosphorylated S6 ribosomal protein (p‐S6, Ser235/236, clone 91B2; CST; 1:200 dilution) or primary mouse monoclonal antibody against p53 protein (clone DO‐7; Dako; 1:100 dilution) overnight at 4°C, and then with biotin‐conjugated anti–rabbit secondary goat antibody or anti–mouse secondary rabbit antibody (Nichirei Biosciences) at room temperature for 20 minutes, and finally with peroxidase‐conjugated streptavidin (Nichirei Biosciences) for 10 minutes. Subsequently, the sections were incubated with 3,3′‐diaminobenzidine (Wako, Osaka, Japan) for 10 minutes and counterstained with hematoxylin. Sections incubated without primary antibodies served as negative controls.
Immunostaining for mTOR, p‐mTOR or p‐S6 was interpreted using a semiquantitative histology scoring method.16 The staining intensity was scored from 0 to 3 to indicate no, weak, moderate and strong staining, respectively. Representative staining images for each intensity score are shown in Figure 1. The percentage of stained cells was classified as follows: score 0, 0%‐10%; score 1, 11%‐25%; score 2, 26%‐50%; and score 3, 51%‐100%. The intensity and percentage scores were normalized as scores from 0 and 9, relative to the target protein in each specimen. Two independent blinded investigators evaluated the cytoplasmic and/or membranous staining of p‐mTOR and p‐S6 at the invasive front of cancer cells using high‐power field microscopy (×400). Moreover, immunostaining for p‐mTOR and p‐S6 was validated with other antibodies from different clones, specifically anti–p‐mTOR (Ser2448, clone EPR4262(2); Abcam; dilution 1:100) and anti–p‐S6 (Ser 235/236, clone D57.2.2E; dilution 1:200), in a randomized internal cohort (n = 20). For the assessment of p53 staining, moderate/strong nuclear staining in 50% or more tumor cells was interpreted as p53‐high expression.17
Figure 1.
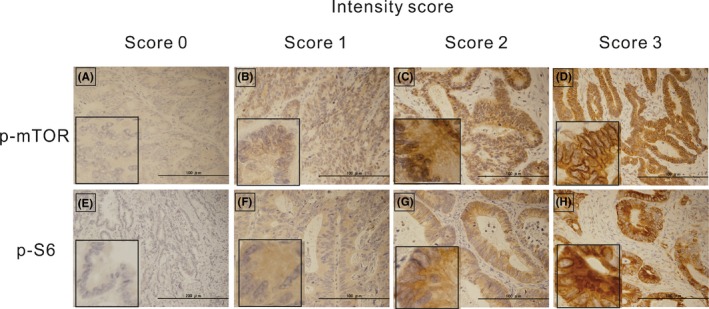
Representative immunohistochemical staining for phosphorylated mammalian target of rapamycin (p‐mTOR) (A–D) and phosphorylated S6 ribosomal protein (p‐S6) (E–H) in colon cancer tissues showing intensity scores of 0 (A, E), 1 (B, F), 2 (C, G) and 3 (D, H) (×100 magnification). The insert (left lower) shows higher magnification (×400)
2.4. Cell culture and reagents
The human colorectal cancer cell line SW480 (TP53 mutation‐type [R273H;P309S], KRAS mutation‐type [G12V], BRAF wild‐type, PTEN wild‐type, microsatellite stable [MSS]) and LoVo cells (TP53 wild‐type, KRAS mutation‐type [G13D;A14V], BRAF wild‐type, PTEN wild‐type, microsatellite instability [MSI]‐high), were purchased from the Japanese Cancer Research Resource Bank. Cells were cultured in RPMI 1640 medium (Sigma Aldrich) supplemented with 5% FBS and 1% antibiotic/antimycotic solution in a 5% CO2 incubator at 37℃. The experimental dose of the mTOR inhibitor temsirolimus (TEM) (Sigma Aldrich) was set at 80 nmol/L based on our previous report.13 The cells were pretreated with or without TEM for 1 hour, followed by exposure to ionizing radiation (IR) of 3 or 6 Gy (1.0 Gy/min) with an X‐ray generator (Pantac HF350; Kyoto, Japan).
2.5. Wound healing assay
Cells were seeded in six‐well plates and pretreated with or without TEM for 1 hour before IR exposure. After incubation for 24 hours, cell monolayers were wounded by scratching with 200‐µL micropipette tips and then kept in medium with 5% FBS. Cells were monitored at 0 and 48 hours under a microscope (BZ‐8100; Keyence) at ×40 magnification. The migration index was quantified using the following equation: (scratch distance at 0 hours − scratch distance at 48 hours)/scratch distance at 0 hours. Each experiment was performed in triplicate.
2.6. Western blot analysis
Cells were incubated for 24 hours with or without TEM after exposure to IR. Whole cell protein extracts were obtained by lysing cells in Bolt LDS Sample Buffer (Life Technologies). Forty micrograms of protein samples were separated by SDS‐PAGE and transferred to polyvinylidene difluoride membranes using the Bolt system (Life Technologies). Western blotting was performed using the iBind Western System (Life Technologies) according to the manufacturer’s instructions. The rabbit antibodies against p‐S6 (Ser235/236, 91B2, CST; 1:1000 dilution) and S6 ribosomal protein (5G10, #2217, CST; 1:1000 dilution) as a primary antibody, and alkaline phosphatase‐labeled goat anti–rabbit antibody (ab97048, Abcam; 1:2000 dilution) as a secondary antibody were used. The membranes were incubated in CDP‐star solution (Life Technologies) and chemiluminescence was detected using ChemiDoc XRS System (BIO RAD). The experiment was performed three times. The density of each band was measured using Image J software (version 1. 4. 3). The phosphorylated isoform fraction of S6 was normalized by the total S6 level.
2.7. Flow cytometry
Cells were prepared and treated as mentioned previously, and the harvested cells were immediately stained with the PE‐conjugated mouse antibody against CD324 (E‐cadherin; BD Pharmingen; 1:100 dilution). In addition, the other cells were stained with the PE‐conjugated mouse antibody against vimentin (BD Pharmingen; 1:100 dilution) after fixation with 4% formaldehyde and permeabilization with a 0.1% tween solution. The samples were analyzed using a BD FACSCalibur flow cytometer (BD Biosciences). Each experiment was performed in triplicate.
2.8. Statistical analysis
For the clinical study, the agreement rate of IHC score evaluation for p‐mTOR or p‐S6 expression between the two investigators was quantified with the kappa statistic. p‐mTOR or p‐S6 expression levels in cohorts 1 and 2 were compared using the Mann‐Whitney U test. Associations between patient characteristics and the expression score of p‐mTOR or p‐S6 were assessed using the χ 2 test or the Fisher exact test. Survival curves and the cumulative incidence of distant metastasis were estimated using the Kaplan‐Meier method and compared using the log‐rank test. Multivariate analysis of variables associated with distant metastasis was performed using the Cox proportional hazards model.
For the in vitro study, statistical significance of the differences was determined using a one‐way ANOVA followed by the Tukey post–test for multiple comparisons. All analyses were performed with JMP Pro 14.0 software (SAS Institute). A P‐value < .05 was considered statistically significant.
3. RESULTS
3.1. Clinical study
Representative images of IHC staining for p‐mTOR and p‐S6 in colorectal cancer without neoadjuvant therapy are shown in Figure 2. In agreement with a previous report,15 for most samples, p‐mTOR and p‐S6 staining intensities were stronger at the invasive front than on the surface. Given the heterogeneity of p‐mTOR and p‐S6 expression in cancer specimens, the strongest stained area within the invasive front was considered. The concordance degree for the evaluation of IHC staining scores between investigators was moderate, with a Kappa value of 0.787 for p‐mTOR and 0.732 for p‐S6. In addition, we confirmed the specific staining for p‐mTOR and p‐S6 based on the validation test using other antibodies from different clones (Figure S1 and S2).
Figure 2.
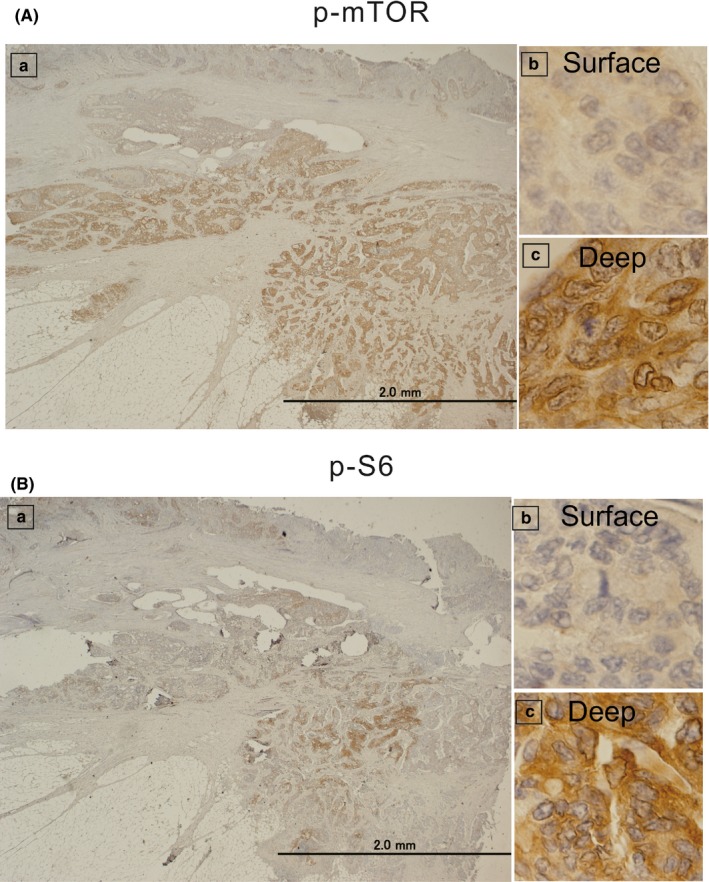
Immunohistochemical staining for phosphorylated mammalian target of rapamycin (p‐mTOR) (A) and phosphorylated S6 ribosomal protein (p‐S6) (B) in colon cancer tissues from patients who did not undergo neoadjuvant therapy. Left panels (a) represent all layers of the colon tissues at lower magnification (×20). Right‐upper panels (b) represent the surface layer, and right‐lower panels (c) represent the deep layer at higher magnification (×400). The intensities of p‐mTOR and p‐S6 staining in the deep layer (c) were stronger than those in the surface layer (b)
The clinical and pathological features of patients in cohorts 1 and 2 are shown in Table 1, and p‐mTOR and p‐S6 expression scores based on the IHC staining results are shown in Figure 3. The median p‐mTOR expression score for cohort 1 was 9, and that for cohort 2 was 6. p‐mTOR levels were significantly higher in samples from cohort 1 than in those from cohort 2 (P < .001); total‐mTOR expression levels followed a similar trend (P < .001, Figure S3).
Table 1.
Patients characteristics of cohort 1 and cohort 2
| Cohort 1 (n = 98) with NACRT | Cohort 2 (n = 80) without NACRT | ||
|---|---|---|---|
| Age,a y (range) | 65 (56‐75) | 65 (56‐75) | |
| Sex | Male | 59 (60%) | 46 (58%) |
| Location | Colon/Rectum | — | 66 (83%)/14 (17%) |
| Distance from AV,a cm (range) | 4 (2‐6) | — | |
| pT | T1/T2/T3/T4 | 11/30/49/8 | 0/10/51/19 |
| pN | Positive | 23 (23%) | 37 (46%) |
| LVI | Positive | 57 (58%) | 61 (76%) |
| Histological type | Differentiated | 91 (93%) | 76 (95%) |
| TRG | Responder | 36 (37%) | — |
| p‐mTOR expression scorea (range) | 9 (6‐9) | 6 (4‐8) | |
| p‐S6 expression scorea (range) | 3 (2‐6) | 3 (2‐6) | |
Abbreviations: AV, anal verge; Differentiated, well to moderately differentiated adenocarcinoma; Location, location of primary tumor; LVI, lymphovascular invasion; NACRT, neoadjuvant chemoradiotherapy; p‐mTOR expression score, phosphorylated mammalian target of rapamycin expression score based on the results of immunohistochemical staining; pN, pathological lymph node metastasis; p‐S6 expression score, phosphorylated S6 ribosomal protein expression score based on the result of immunohistochemical staining; pT, pathological T stage; TRG, tumor regression grade.
Data are expressed as median (range).
Figure 3.
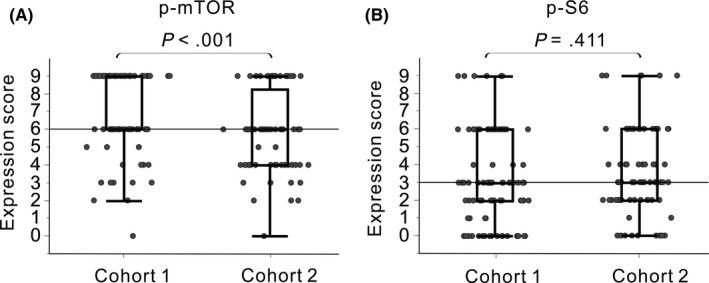
Immunohistochemical staining scores for phosphorylated mammalian target of rapamycin (p‐mTOR) (A) and phosphorylated S6 ribosomal protein (p‐S6) (B) in cohort 1 (patients with low rectal cancer treated with neoadjuvant chemoradiotherapy; left) and cohort 2 (patients with colorectal cancer not treated with neoadjuvant therapy; right). Horizontal lines represent the median expression scores of p‐mTOR (A, score of 6) and p‐S6 (B, score of 3) in cohort 2
Patients in each cohort were divided into two groups based on their p‐mTOR (low, score < 6; high, score ≥ 6) or p‐S6 expression score (low, score < 3; high, score ≥ 3); these cutoff scores were the median scores for p‐mTOR and p‐S6, respectively, in cohort 2. There were no differences in p‐mTOR and p‐S6 expression scores between colon and rectal cancers in cohort 2. Based on the association analyses between clinicopathological factors and mTOR signaling (Table 2), both p‐mTOR and p‐S6 expression levels did not correlate with cancer staging. The clinical features and tumor regression grade following NACRT also did not correlate, except for an association between sex and p‐S6 levels in cohort 1 and between the pathological N status and p‐mTOR levels in cohort 2. Similarly, total‐mTOR levels did not correlate with the clinicopathological factors in both cohorts, except for an association between the histological type and total‐mTOR levels in cohort 1 (Table S1).
Table 2.
The associations between patient characteristics and p‐mTOR or p‐S6 expression levels in cohort 1 and cohort 2
| Cohort 1 | p‐mTOR expression | p‐S6 expression | ||||
|---|---|---|---|---|---|---|
| Low (<score 6) | High (≥score 6) | P | Low (<score 3) | High (≥score 3) | P | |
| N = 15 | N = 83 | N = 39 | N = 59 | |||
| Agea, y (range) | 62 (58‐66) | 63 (57‐70) | .870 | 63 (58‐70) | 63 (57‐69) | .799 |
| Sex (Male) | 12 (80%) | 47 (57%) | .088 | 31 (79%) | 28 (47%) | .002a |
| Distance from AV (<4 cm) | 12 (80%) | 49 (59%) | .123 | 28 (72%) | 33 (56%) | .113 |
| pT (T1/T2/T3/T4) | 2/5/7/1 | 9/25/42/7 | .977 | 2/13/20/4 | 9/17/29/4 | .445 |
| pN (positive) | 4 (27%) | 19 (23%) | .751 | 8 (21%) | 15 (25%) | .575 |
| LVI (positive) | 6 (40%) | 51 (61%) | .121 | 23 (59%) | 34 (58%) | .895 |
| Histological type (differentiated) | 1 (7%) | 6 (7%) | .938 | 2 (5%) | 5 (8%) | .529 |
| TRG (responder) | 8 (53%) | 28 (34%) | .075 | 10 (26%) | 26 (44%) | .128 |
| Cohort 2 | N = 27 | N = 53 | N = 29 | N = 51 | ||
|---|---|---|---|---|---|---|
| Age,a y (range) | 69 (59‐75) | 64 (55‐72) | .192 | 68 (55‐78) | 64 (56‐74) | .911 |
| Sex (male) | 1 (4%) | 29 (55%) | .481 | 15 (52%) | 31 (61%) | .431 |
| Location (rectum) | 4 (15%) | 10 (19%) | .652 | 7 (24%) | 7 (14%) | .239 |
| pT (T2/T3/T4) | 3/19/5 | 7/32/14 | .666 | 4/20/5 | 6/31/14 | .587 |
| pN (positive) | 17 (63%) | 20 (38%) | .032a | 13 (45%) | 24 (47%) | .847 |
| LVI (positive) | 22 (81%) | 39 (74%) | .433 | 22 (76%) | 39 (77%) | .951 |
| Histological type (Differentiated) | 26 (96%) | 50 (94%) | .704 | 27 (93%) | 49 (96%) | .557 |
Abbreviations: AV, anal verge; Differentiated, well to moderately differentiated adenocarcinoma; Location, Location of primary tumor; LVI, lymphovascular invasion; p‐mTOR expression level, phosphorylated mammalian target of rapamycin expression level based on the results of immunohistochemical staining; pN stage, pathological lymph node metastasis; pN, pathological lymph node metastasis; p‐S6 expression level, phosphorylated S6 ribosomal protein expression level based on the result of immunohistochemical staining; pT, pathological T stage; pT, pathological T stage; TRG, tumor regression grade.
Data are expressed as median (range).
Next, we assessed the association between mTOR pathway activity and patient prognosis after surgery (Figure 4). In cohort 2, mTOR pathway activity was not associated with postoperative prognosis. However, in cohort 1, the recurrence rates after surgery for patients with high p‐S6 levels after NACRT tended to be increased, as compared to those in the low‐level group, although the differences were not statistically significant. Specifically, the p‐S6 expression level after NACRT was a factor that was strongly associated with distant metastasis after surgery. Total‐mTOR levels were not associated with postoperative prognosis in both cohorts (Table S2). Thus, we subsequently performed multivariate analyses on cohort 1 (Table 3). We found that a high p‐S6 expression level after NACRT was an independent factor to predict the development of distant metastasis after surgery (HR 4.51, P = .002), along with a high pathological T stage after NACRT (HR 3.73, P = .020).
Figure 4.
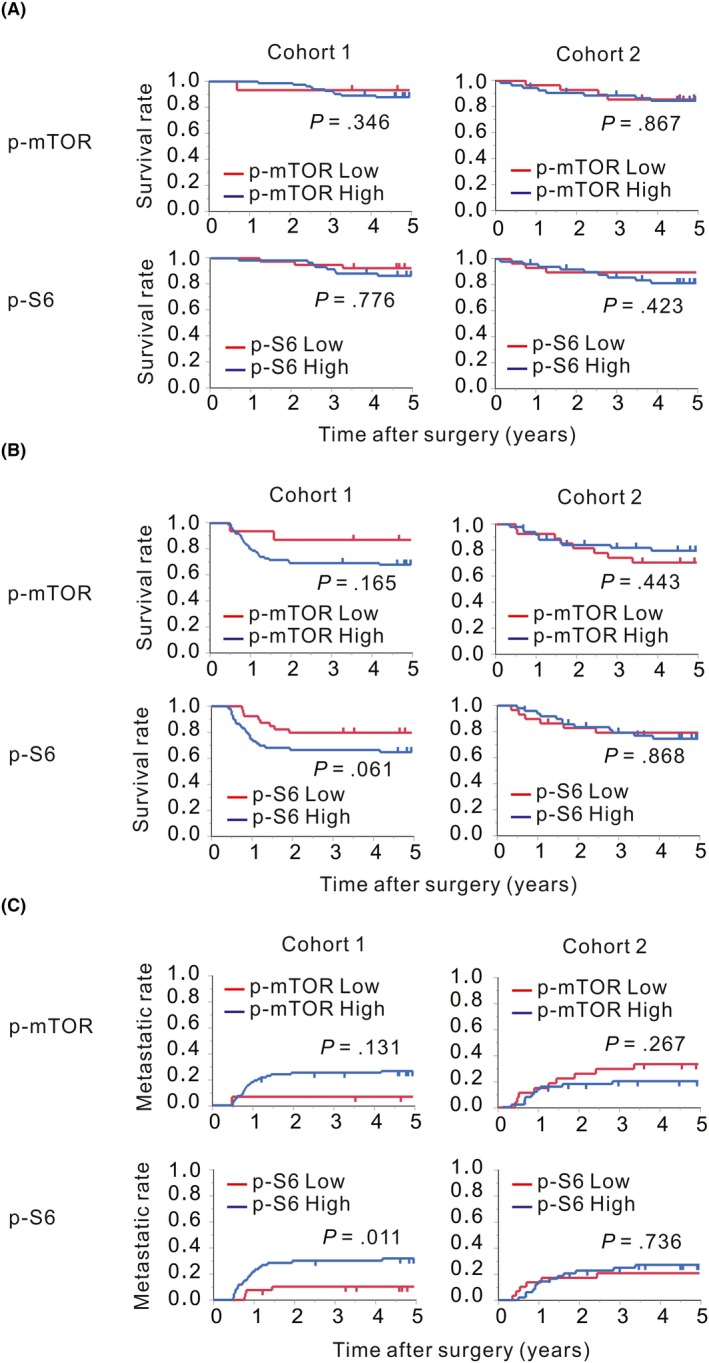
Survival curves and cumulative incidences of distance metastases after surgery. Patients in cohort 1 (left) and cohort 2 (right) were stratified according to the immunohistochemical (IHC) scores with cutoff values of a score of 6 for phosphorylated mammalian target of rapamycin (p‐mTOR) and a score of 3 for phosphorylated S6 ribosomal protein (p‐S6). The overall survival (A), the relapse‐free survival (B) and the distant metastasis rate (C) for patients with p‐mTOR and p‐S6 expression scores lower than each cutoff score are represented by red lines, and those for patients with expression scores equal to or higher than each cutoff score are represented by blue lines
Table 3.
Univariate and multivariate analysis of prognostic variables for distant metastasis in cohort 1, patients with rectal cancer treated with neoadjuvant chemoradiotherapy
| Univariate | Multivariate | |||
|---|---|---|---|---|
| P | HR | 95% CI | P | |
| Age (≤60 vs >60) | .321 | |||
| Sex (male vs female) | .417 | |||
| Distance from anal verge (≥4 cm vs <4 cm) | .013 | 2.07 | 0.89‐5.05 | .100 |
| pT stage (T1/2 vs T3/4)) | .002 | 3.73 | 1.22‐14.09 | .020* |
| pN (negative vs positive) | .037 | 1.97 | 0.80‐4.61 | .138 |
| LVI (negative vs positive) | .038 | 1.20 | 0.44‐3.70 | .732 |
| Histological type (differentiated vs others) | .196 | |||
| TRG (non‐responder vs responder) | .048 | 0.52 | 0.16‐1.49 | .229 |
| p‐mTOR expression (low vs high) | .057 | |||
| p‐S6 expression (low vs high) | .006 | 4.51 | 1.67‐15.69 | .002* |
Abbreviations: CI, confidence interval; Differentiated, well to moderately differentiated adenocarcinoma; HR, Hazard ratio; Location, Location of primary tumor; LVI, lymphovascular invasion; p‐mTOR expression, phosphorylated mammalian target of rapamycin expression level based on the results of immunohistochemical staining; pN, pathological lymph node metastasis; p‐S6 expression, phosphorylated S6 ribosomal protein expression level based on the result of immunohistochemical staining; pT, pathological T stage; TRG, tumor regression grade.
P < 0.05
3.2. In vitro study
To clarify the association between p‐S6 expression levels modulated by radiotherapy and tumor metastatic potential, western blotting and wound healing assays were performed using the human colorectal cancer cell lines SW480 (TP53 mutation‐type) and LoVo (TP53: wild‐type) exposed to different doses of IR (Figure 5). Results showed that p‐S6 expression levels and migration ability increased upon IR in SW480 cells (Figure 5A,C) but decreased in LoVo cells (Figure 5B,D). The addition of TEM markedly suppressed p‐S6 expression and migration in SW480 cells, in both irradiated and unirradiated cells. In LoVo cells, TEM also significantly suppressed p‐S6 expression, and consequently unirradiated cell migration. However, IR suppressed p‐S6 expression in LoVo cells, and the addition of TEM minimally affected p‐S6 expression in response to IR in these cells. The migration of LoVo cells after irradiation was unaffected by TEM. In addition, IR affected the expression levels of EMT‐related proteins (Figure 6). The expression level of E‐cadherin decreased after IR and that of vimentin increased in SW 480 cells; furthermore, the addition of TEM diminished these effects. In contrast, the expression level of E‐cadherin increased after IR and that of vimentin decreased in LoVo cells, whereas the addition of TEM minimally affected these levels.
Figure 5.
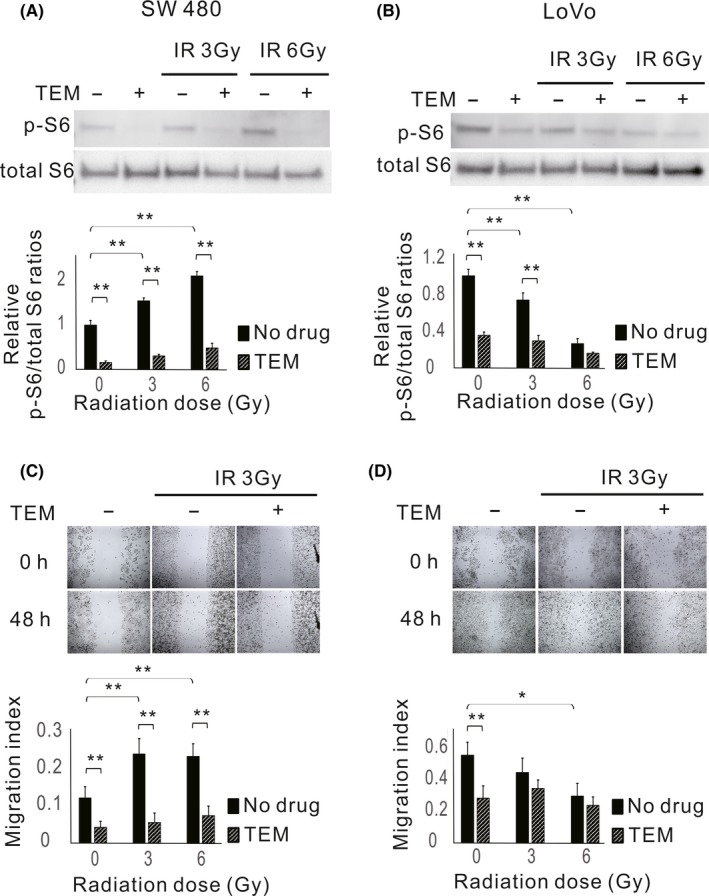
Expression levels of phosphorylated S6 ribosomal protein (p‐S6) and migration abilities in response to ionizing radiation (IR) in colorectal cancer cell lines. Cells were treated with or without 80 nmol/L temsirolimus (TEM) followed by 3 or 6 Gy radiotherapy and examined 24 h after radiotherapy. Western blot analysis of p‐S6 and total S6 expression in SW480 (A) and LoVo cells (B). Bar plots represent the relative expression levels of p‐S6 normalized to total S6 levels. The data are expressed as the mean ± SD. **P ˂ .01. Wounds in SW480 (C) and LoVo (D) cell monolayers at 0 and 48 h after scratching (×40 magnification). Bar blots represent the migration index of cells. The data are expressed as the mean ± SD. *P ˂ .05. **P ˂ .01
Figure 6.
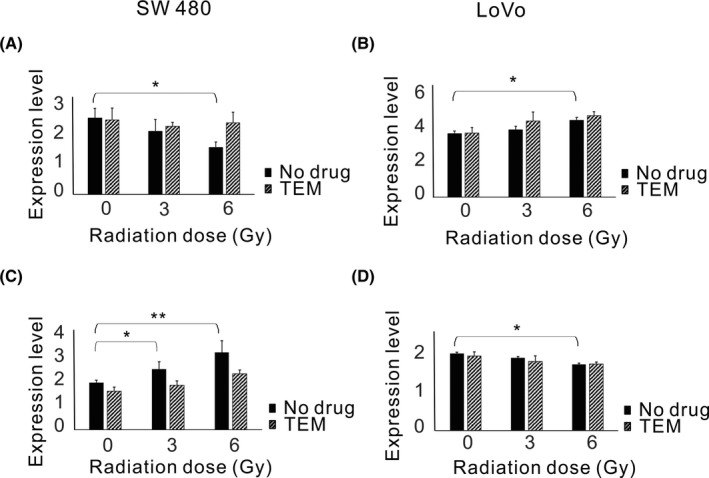
Expression levels of E‐cadherin and vimentin in response to ionizing radiation (IR) in colorectal cancer cell lines. Cells were treated with or without 80 nmol/L temsirolimus (TEM) followed by 3 or 6 Gy radiotherapy and examined 24 h after radiotherapy. FACS analysis of E‐cadherin and vimentin expression in SW480 (A, C) and LoVo cells (B, D). The data are expressed as the mean ± SD. *P ˂ .05. **P ˂ .01
3.3. Association between the expression level of p53 protein and p‐S6 after neoadjuvant chemoradiotherapy
The transcription factor p53 is known as a master regulator of both DNA damage and mTOR activity.18 To confirm the p53‐dependent mTOR regulation after chemoradiotherapy, IHC analysis for p53 was performed in the clinical setting after NACRT (cohort 1). Six samples with undetectable cancer cells were removed from the analysis, and the residual 92 samples were evaluated. Results showed that 55 of 92 (60.0%) samples had high expression of p53, and p‐S6 was overexpressed in samples with high p53 expression as compared to levels in samples with low expression (P < .008, Figure 7).
Figure 7.
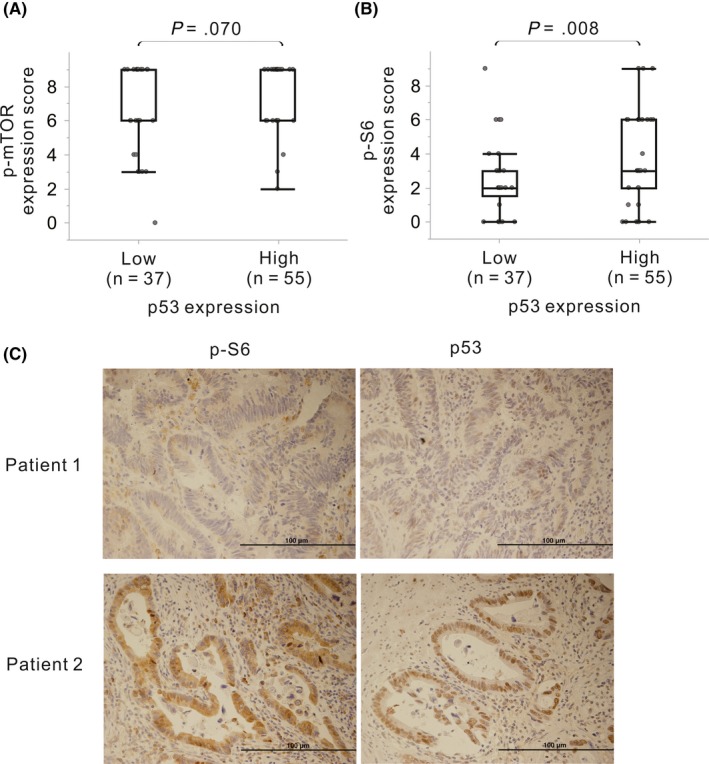
Immunohistochemical staining scores for phosphorylated mammalian target of rapamycin (p‐mTOR) (A) and phosphorylated S6 ribosomal protein (p‐S6) (B) in patients with high and low p53 expression. Representative immunohistochemical staining for p‐S6 and p53 in cohort 1 is shown in (C) (×100 magnification)
4. DISCUSSION
The PI3K/AKT/mTOR intracellular signaling pathway phosphorylates proteins downstream of tyrosine kinase receptors, ultimately resulting in the phosphorylation of ribosomal protein S6 and eukaryotic translation initiation factor 4E‐binding protein 1 (4E‐BP1). In cancer cells, mTOR activation promotes tumor growth and angiogenesis and inhibits apoptosis.12 Previous studies demonstrated that IR exposure enhances p‐S6 levels in colorectal cancer cells13 and phosphorylates AKT in endometrial cancer19 and breast cancer cells.20 In the present study, p‐mTOR expression was significantly higher in cohort 1 than in cohort 2 (Figure 3), suggesting that NACRT increases p‐mTOR levels in rectal cancer. In contrast, we found no difference in p‐S6 levels between the two cohorts. mTOR is known to consist of mTOR complex 1 (mTORC1) and complex 2 (mTORC2). mTORC1 phosphorylates downstream proteins of S6, but mTORC2 does not. p‐S6 levels were reported to be a specific indicator of the levels of phosphorylated mTORC1.12, 21 Therefore, it was suggested that p‐mTOR levels do not necessarily indicate mTORC1‐S6 axis activity. Our in vitro experiments demonstrated that irradiation activates the mTOR pathway only in one of the two CRC cell lines tested but inactivates it in the other (Figure 5). This result suggested that following NACRT, patients might have either enhanced or suppressed p‐S6 expression, which could contribute to the lack of differences in p‐S6 expression levels between the two cohorts. However, it is unknown whether mTORC2 is uniformly activated by chemoradiotherapy. Therefore, it is necessary to distinguish and evaluate mTORC1 and mTORC2 activities in response to irradiation in the future.
Activity of the mTOR pathway is known to be mediated by p53 in cells exposed to IR. In response to IR‐induced DNA damage, activated p53 suppresses mTOR through the activation of AMP‐responsive protein kinase (AMPK) and the induction of phosphatase and tensin homolog (PTEN). However, in cancer cells with a TP53 mutation, dysfunctional p53 might disrupt these pathways.18 SW480 cells, which showed IR‐dependent mTOR activation, are known to carry a mutated form of TP53, whereas LoVo cells, which showed inactivation of the mTOR pathway in response to IR, possess wild‐type TP53. In addition, DNA damage with high energy levels was reported to cause AKT phosphorylation through the induction of p38α, which consequently activates mTORC1.18, 22 These data suggested that p53 dysfunction due to TP53 mutations and the induction of p38α can consequently activate the mTOR pathway in SW480 cells after irradiation. In fact, p‐S6 was overexpressed in samples with high p53 expression as compared to levels in samples with low expression in the clinical setting after NACRT (Figure 7), suggesting that chemoradiotherapy might modulate the mTOR signaling pathway in a p53‐dependent manner.
A previous report showed that p‐mTOR overexpression correlates with lymph node metastasis and distant metastasis in colorectal cancer,23 whereas another report demonstrated no association between p‐mTOR expression levels and colorectal cancer progression.24 In this study, neither p‐mTOR nor p‐S6 expression showed a general association with the degree of cancer progression. In addition, a specific p‐mTOR or p‐S6 expression pattern, including tumor regression grade, was not observed for the NACRT cohort, although activation of the mTOR signaling by IR was previously deemed essential for radioresistance.25
We also assessed the association between activity of the mTOR pathway and patient prognosis. In the cohort of patients that did not receive neoadjuvant therapy, mTOR pathway activity was not associated with patient prognosis, in agreement with a previous report.24 In addition, previous clinical trials failed to demonstrate the survival benefit of mTOR inhibitors for metastatic colorectal cancer.26, 27 These results suggest that activity of the mTOR pathway in treatment‐naïve colorectal cancer does not contribute to the poor prognosis of the patients. In contrast, the association between mTOR pathway activity after NACRT and the prognosis of patients with rectal cancer treated with NACRT had not been investigated. In the present study, we observed a trend toward a higher incidence of recurrence in patients with high p‐S6 levels after NACRT as compared to that in individuals with low expression levels (Figure 4). Importantly, we found that high p‐S6 expression after NACRT was a strong indicator of the development of postoperative distant metastasis. A previous report demonstrated that mTOR contributes to the development of systemic metastasis of colorectal cancer through the induction of EMT in a mouse model.11 Therefore, it is likely that activation of the mTOR pathway by NACRT, and especially an increase in p‐S6 expression, differed between cases and that enhanced activation of this pathway might contribute to the development of distant metastasis after surgery.
To determine whether IR‐induced mTOR pathway activation promotes cancer metastasis, we performed a further in vitro study using colorectal cancer cells (Figures 5 and 6). We found that IR increased the p‐S6 expression level and, consequently, induced EMT‐like protein expression patterns and increased the migration of SW 480 cells (TP53 mutation‐type) but not LoVo cells (TP53 wild‐type). The mTOR inhibitor temsirolimus suppressed p‐S6 expression and, consequently, migration in SW480 cells regardless of irradiation. However, the addition of temsirolimus exerted little effect on the modulation of p‐S6 expression by IR in LoVo cells, and the migration of these cells after irradiation was also not affected by temsirolimus. These results suggested that the activation or inactivation of p‐S6 expression by IR might promote or reduce cell migration ability via EMT.
The novelty of our findings is as follows: (a) our study is the first report demonstrating that the response to irradiation can differ among cell lines of the same organ origin; (b) there have been no studies investigating whether the different mTOR responses to irradiation result in different migratory activities of irradiated cells, which was demonstrated in our study; and (c) our study is the first clinical report demonstrating the correlation between differences in the mTOR activation status after CRT and the postoperative development of distant metastasis.
Based on our results, the administration of intensive chemotherapy before or after surgery might be beneficial to suppress the development of distant metastasis after surgery in patients with rectal cancer showing NACRT‐induced mTOR pathway activation. In addition, several gene products including KRAS, BRAF or PTEN, and TP53 are known to regulate the mTOR pathway.12, 28, 29 Therefore, clarifying the association between the status of these molecular markers and mTOR pathway activity affected by NACRT in rectal cancer might be helpful to predict distant metastasis after surgery. Furthermore, if these gene profiles could predict mTOR signaling activity after NACRT and the development of distant metastasis, the administration of mTOR inhibitors combined with NACRT, according to the patient‐specific gene profile, might help to prevent the development of distant metastasis after surgery.
There were several limitations to the present study. First, this clinical study evaluated only a small number of patients from a single institution. Furthermore, factors that determine activation or suppression of the mTOR pathway and the mechanism through which activation of the mTOR pathway by IR enhances cancer cell migration were not investigated and require further studies. In conclusion, our results identified high p‐S6 expression after NACRT as an independent predictor of the development of distant metastasis after surgery in patients with locally advanced lower rectal cancer. These findings suggested that chemoradiotherapy‐induced mTOR pathway activation might promote the metastasis of rectal cancer.
DISCLOSURE
The authors declare no conflicts of interest.
Supporting information
ACKNOWLEDGMENTS
This research was supported by Grants‐in‐Aid for Scientific Research (C: grant number; 17K10620, C: grant number; 17K 10621, C: grant number; 17K10623, C: grant number; 18K07194, C: grant number; 19K09114, C: grant number; 19K09115) from the Japan Society for the Promotion of Science. This research was supported by the Project for Cancer Research and Therapeutic Evolution (P‐CREATE), grant number: JP 19cm0106502 from the Japan Agency for Medical Research and Development (AMED).
Shiratori H, Kawai K, Okada M, et al. Metastatic role of mammalian target of rapamycin signaling activation by chemoradiotherapy in advanced rectal cancer. Cancer Sci. 2020;111:1291–1302. 10.1111/cas.14332
REFERENCES
- 1. van Gijn W, Marijnen CA, Nagtegaal ID, et al. Preoperative radiotherapy combined with total mesorectal excision for resectable rectal cancer: 12‐year follow‐up of the multicentre, randomised controlled TME trial. Lancet Oncol. 2011;12:575‐582. [DOI] [PubMed] [Google Scholar]
- 2. Bosset JF, Calais G, Mineur L, et al. Fluorouracil‐based adjuvant chemotherapy after preoperative chemoradiotherapy in rectal cancer: long‐term results of the EORTC 22921 randomised study. Lancet Oncol. 2014;15:184‐190. [DOI] [PubMed] [Google Scholar]
- 3. Rodel C, Graeven U, Fietkau R, et al. Oxaliplatin added to fluorouracil‐based preoperative chemoradiotherapy and postoperative chemotherapy of locally advanced rectal cancer (the German CAO/ARO/AIO‐04 study): final results of the multicentre, open‐label, randomised, phase 3 trial. Lancet Oncol. 2015;16:979‐989. [DOI] [PubMed] [Google Scholar]
- 4. Sauer R, Liersch T, Merkel S, et al. Preoperative versus postoperative chemoradiotherapy for locally advanced rectal cancer: results of the German CAO/ARO/AIO‐94 randomized phase III trial after a median follow‐up of 11 years. J Clin Oncol. 2012;30:1926‐1933. [DOI] [PubMed] [Google Scholar]
- 5. Vilalta M, Rafat M, Graves EE. Effects of radiation on metastasis and tumor cell migration. Cell Mol Life Sci. 2016;73:2999‐3007. [DOI] [PMC free article] [PubMed] [Google Scholar]
- 6. Moncharmont C, Levy A, Guy JB, et al. Radiation‐enhanced cell migration/invasion process: a review. Crit Rev Oncol Hematol. 2014;92:133‐142. [DOI] [PubMed] [Google Scholar]
- 7. Lin S, Chen S, Chen Z, Dai Q, Ke C. X‐ray‐induced epithelial‐mesenchymal transition in SW480 colorectal cancer cells and its potential mechanisms. J BUON. 2017;22:1457‐1462. [PubMed] [Google Scholar]
- 8. Yasuda K, Nirei T, Tsuno NH, Nagawa H, Kitayama J. Intratumoral injection of interleukin‐2 augments the local and abscopal effects of radiotherapy in murine rectal cancer. Cancer Sci. 2011;102:1257‐1263. [DOI] [PubMed] [Google Scholar]
- 9. Brix N, Tiefenthaller A, Anders H, Belka C, Lauber K. Abscopal, immunological effects of radiotherapy: Narrowing the gap between clinical and preclinical experiences. Immunol Rev. 2017;280:249‐279. [DOI] [PubMed] [Google Scholar]
- 10. Kawamoto A, Yokoe T, Tanaka K, et al. Radiation induces epithelial‐mesenchymal transition in colorectal cancer cells. Oncol Rep. 2012;27:51‐57. [DOI] [PubMed] [Google Scholar]
- 11. Gulhati P, Bowen KA, Liu J, et al. mTORC1 and mTORC2 regulate EMT, motility, and metastasis of colorectal cancer via RhoA and Rac1 signaling pathways. Can Res. 2011;71:3246‐3256. [DOI] [PMC free article] [PubMed] [Google Scholar]
- 12. Saxton RA, Sabatini DM. mTOR signaling in growth, metabolism, and disease. Cell. 2017;168:960‐976. [DOI] [PMC free article] [PubMed] [Google Scholar]
- 13. Shiratori H, Kawai K, Hata K, et al. The combination of temsirolimus and chloroquine increases radiosensitivity in colorectal cancer cells. Oncol Rep. 2019;42:377‐385. [DOI] [PubMed] [Google Scholar]
- 14. Seiwert N, Neitzel C, Stroh S, et al. AKT2 suppresses pro‐survival autophagy triggered by DNA double‐strand breaks in colorectal cancer cells. Cell Death Dis. 2017;8:e3019. [DOI] [PMC free article] [PubMed] [Google Scholar]
- 15. Lee H. Phosphorylated mTOR expression profiles in human normal and carcinoma tissues. Dis Markers. 2017;2017:1397063. [DOI] [PMC free article] [PubMed] [Google Scholar]
- 16. Shim BY, Sun S, Won HS, et al. Role of autophagy‐related protein expression in patients with rectal cancer treated with neoadjuvant chemoradiotherapy. BMC Cancer. 2016;16:207. [DOI] [PMC free article] [PubMed] [Google Scholar]
- 17. Ogino S, Brahmandam M, Kawasaki T, Kirkner GJ, Loda M, Fuchs CS. Combined analysis of COX‐2 and p53 expressions reveals synergistic inverse correlations with microsatellite instability and CpG island methylator phenotype in colorectal cancer. Neoplasia. 2006;8:458‐464. [DOI] [PMC free article] [PubMed] [Google Scholar]
- 18. Hasty P, Sharp ZD, Curiel TJ, Campisi J. mTORC1 and p53: clash of the gods? Cell Cycle. 2013;12:20‐25. [DOI] [PMC free article] [PubMed] [Google Scholar]
- 19. Miyasaka A, Oda K, Ikeda Y, et al. PI3K/mTOR pathway inhibition overcomes radioresistance via suppression of the HIF1‐alpha/VEGF pathway in endometrial cancer. Gynecol Oncol. 2015;138:174‐180. [DOI] [PubMed] [Google Scholar]
- 20. Albert JM, Kim KW, Cao C, Lu B. Targeting the Akt/mammalian target of rapamycin pathway for radiosensitization of breast cancer. Mol Cancer Ther. 2006;5:1183‐1189. [DOI] [PubMed] [Google Scholar]
- 21. Li S, Kong Y, Si L, et al. Phosphorylation of mTOR and S6RP predicts the efficacy of everolimus in patients with metastatic renal cell carcinoma. BMC Cancer. 2014;14:376. [DOI] [PMC free article] [PubMed] [Google Scholar]
- 22. Lai KP, Leong WF, Chau JF, et al. S6K1 is a multifaceted regulator of Mdm2 that connects nutrient status and DNA damage response. EMBO J. 2010;29:2994‐3006. [DOI] [PMC free article] [PubMed] [Google Scholar]
- 23. Lu Q, Wang J, Yu G, Guo T, Hu C, Ren P. Expression and clinical significance of mammalian target of rapamycin/P70 ribosomal protein S6 kinase signaling pathway in human colorectal carcinoma tissue. Oncol Lett. 2015;10:277‐282. [DOI] [PMC free article] [PubMed] [Google Scholar]
- 24. Melling N, Simon R, Izbicki JR, et al. Expression of phospho‐mTOR kinase is abundant in colorectal cancer and associated with left‐sided tumor localization. Int J Clin Exp Pathol. 2015;8:7009‐7015. [PMC free article] [PubMed] [Google Scholar]
- 25. Chen H, Ma Z, Vanderwaal RP, et al. The mTOR inhibitor rapamycin suppresses DNA double‐strand break repair. Radiat Res. 2011;175:214‐224. [DOI] [PMC free article] [PubMed] [Google Scholar]
- 26. Ng K, Tabernero J, Hwang J, et al. Phase II study of everolimus in patients with metastatic colorectal adenocarcinoma previously treated with bevacizumab‐, fluoropyrimidine‐, oxaliplatin‐, and irinotecan‐based regimens. Clin Cancer Res. 2013;19:3987‐3995. [DOI] [PMC free article] [PubMed] [Google Scholar]
- 27. Spindler KL, Sorensen MM, Pallisgaard N, et al. Phase II trial of temsirolimus alone and in combination with irinotecan for KRAS mutant metastatic colorectal cancer: outcome and results of KRAS mutational analysis in plasma. Acta Oncol. 2013;52:963‐970. [DOI] [PubMed] [Google Scholar]
- 28. Di Nicolantonio F, Arena S, Tabernero J, et al. Deregulation of the PI3K and KRAS signaling pathways in human cancer cells determines their response to everolimus. J Clin Investig. 2010;120:2858‐2866. [DOI] [PMC free article] [PubMed] [Google Scholar]
- 29. He K, Chen D, Ruan H, et al. BRAFV600E‐dependent Mcl‐1 stabilization leads to everolimus resistance in colon cancer cells. Oncotarget. 2016;7:47699‐47710. [DOI] [PMC free article] [PubMed] [Google Scholar]
Associated Data
This section collects any data citations, data availability statements, or supplementary materials included in this article.
Supplementary Materials


