Abstract
The identification of useful biomarkers is an urgent issue in cancer treatment, particularly for immunotherapy, as only some patients experience benefits from this treatment. The early induction of the IgG response has been reported as a useful biomarker of favorable prognosis for cancer patients treated with a personalized peptide vaccination, but a portion of these patients (IgG nonresponders) fail to achieve an early induction of IgG response yet experience long‐term survival. It is thus necessary to identify other biomarkers of favorable prognosis among these patients. Here we report the usefulness of classical T‐cell markers (ie, the CD8 content and the CD4/CD8 ratio in peripheral blood) in IgG nonresponders among advanced or recurrent ovarian cancer patients treated with a personalized peptide vaccination. Among IgG nonresponders (n = 25), the overall survival (OS) of the increased‐CD8 group (n = 7) was significantly longer than that of the decreased‐CD8 group (n = 18; P = .018), and the OS of the patients with a decreased CD4/CD8 ratio (n = 10) was significantly longer than that of the patients with an increased ratio (n = 15; P = .0055). Thus, an increased content of CD8 and a decreased CD4/CD8 ratio are each favorable prognosis markers in IgG nonresponders treated with a personalized peptide vaccination.
Keywords: CD4, CD8 ratio, IgG, ovarian cancer, peptide vaccine, prognostic factor
Early induction of the IgG response has been reported as a useful biomarker of favorable prognosis for cancer patients treated with a peptide vaccination, but a portion of these patients (IgG nonresponders) fail to achieve an early induction of IgG response yet experience long‐term survival. Here we found the usefulness of classical T‐cell markers (ie, the CD8 content and the CD4/CD8 ratio in peripheral blood) as biomarkers in IgG nonresponders among ovarian cancer patients treated with a personalized peptide vaccination.
1. INTRODUCTION
The identification of useful biomarkers is an urgent issue in cancer treatment, particularly for immunotherapy, as only some patients experience benefits from this treatment. For example, approximately 30% or less of patients treated with anti‐programmed cell death‐1 (PD‐1) Abs have achieved prolonged overall survival (OS) in various cancers such as melanoma, non‐small cell lung cancer, gastric cancer, colorectal cancer, and ovarian cancer.1, 2, 3, 4, 5, 6 Similar results were also obtained in patients treated with anti‐PD ligand 1 Abs.7, 8
Response rates were increased with the use of a combination of PD‐1 blockade with other immune checkpoint blockades (such as anti‐CTL‐associated protein 4 Abs), yet only a portion of the patients benefited from this treatment.1, 9 We established a personalized peptide vaccination in which the vaccine peptides were selected based on individual patients’ human leukocyte antigen (HLA) types and preexisting immunity, from among 31 CTL‐epitope peptides derived from a variety of tumor‐associated antigens.10, 11, 12, 13, 14, 15, 16 Among the patients who received the personalized peptide vaccinations, only some showed a treatment benefit.10, 11, 12, 13, 14, 15, 16
The early induction of IgG response has been described as one of the useful biomarkers of favorable prognosis for cancer patients treated with a personalized peptide vaccination.10, 11, 12, 13, 14, 15, 16 The portion of these patients who did not show an early induction of IgG response, ie, the IgG nonresponders, has also included patients who nevertheless achieved long‐term survival. It is thus necessary to identify other biomarkers of favorable prognosis that will contribute to further treatment planning for IgG nonresponders treated with a personalized peptide vaccination, eg, whether to continue the vaccination or switch to other methods.
Here we report the usefulness of 2 classical T‐cell markers, the CD8 content and the CD4/CD8 ratio in the peripheral blood of IgG nonresponders among advanced or recurrent ovarian cancer patients treated with a personalized peptide vaccination.
2. MATERIALS AND METHODS
2.1. Clinical samples
Peripheral blood samples were obtained from patients with a histological diagnosis of ovarian cancer who were enrolled in a personalized peptide vaccination during the period from January 2009 to December 2015. The study protocols were approved by the Kurume University Ethics Committee and were registered with the UMIN Clinical Trial Registry (UMIN3083 and UMIN1482). All of the patients were enrolled in these studies after providing informed consent. The entry criteria and precise vaccination protocols have been reported.10 Briefly, a maximum of 4 peptides selected (based on the individual patient’s HLA type and preexisting immunity) from a vaccine peptide panel consisting of 31 CTL‐epitope peptides derived from a variety of tumor‐associated antigens were s.c. injected together with the oil adjuvant Montanide ISA 51 VG (Seppic). One vaccination cycle consisted of a 1 vaccination per week for 6 or 8 weeks. The patients’ characteristics are summarized in Table 1. The characteristics of the 26 patients enrolled in the study during the period from January 2009 to July 2012 who were subjected to the initial analysis (named the “discovery cohort”) were reported by Kawano et al.10 The patients of the “validation cohort” were enrolled in the more recent study conducted during the period from August 2012 to December 2015. All the patients described in the present study completed at least 1 cycle of vaccine treatment.
Table 1.
Characteristics of ovarian cancer patients treated with peptide vaccine who were analyzed in this study
| Discovery cohort a | Validation cohort | |
|---|---|---|
| n | 26 | 26 |
| Age, y | ||
| Median (range) | 57.5 (33‐74) | 59 (23‐75) |
| Histology | ||
| Serous adenocarcinoma | 18 | 13 |
| Endometrioid adenocarcinoma | 2 | 5 |
| Mucinous adenocarcinoma | 1 | 1 |
| Clear cell adenocarcinoma | 2 | 2 |
| Others | 3 | 5 |
| Stage | ||
| IIIa | 1 | 0 |
| IIIc | 5 | 2 |
| IV | 1 | 1 |
| Recurrent | 19 | 23 |
| Performance status | ||
| 0 | 23 | 21 |
| 1 | 3 | 5 |
| 2 or more | 0 | 0 |
Patients’ data of the discovery cohort have been reported previously.10
2.2. Flow cytometry
Peripheral blood mononuclear cells (1 × 10⁵) were suspended in PBS supplemented with 20% human AB serum and then incubated for 30 minutes on ice with the appropriate dilution of the Ab anti‐CD4‐FITC (clone RPA‐T4), anti‐CD8‐PerCP‐Cy5.5 (clone RPA‐T8), or anti‐CD279 (PD‐1)‐APC (clone MIH4); all of these Abs including isotype‐matched negative controls were purchased from BD Biosciences. The stained cells were analyzed on a BD FACSCanto II flow cytometry system with FACS Diva software (BD Biosciences).
2.3. Measurement of peptide‐reactive IgG and CTLs
The IgG levels of the serum samples subjected to the vaccine candidate panel consisting of 31 CTL‐epitope peptides were measured using the Luminex analyzer (Luminex) as described.10 The patients’ IgG levels are expressed as fluorescence intensity units, and if the values were increased to 2‐fold or more of the patient’s prevaccination level, the response was considered augmented.
The CTL responses were measured by an interferon‐gamma ELISPOT assay as described.10 The vaccination‐induced CTL responses were evaluated by the difference between the number of spots produced in response to each corresponding peptide and that produced in response to the control HIV peptide, and if the value was increased to 2‐fold or more of the prevaccination number, the response was considered augmented regardless of whether or not the peptides were used for the vaccination.
2.4. Statistical analyses
The survival curves were plotted by the Kaplan‐Meier method. We compared the increased and not increased (or decreased) groups for each variable by using a Cox hazard model. We used Pearson’s χ2 test to analyze the T cell responses specific to the vaccinated peptides, Fisher’s exact test to analyze the IgG responses to the vaccine peptides, the pairwise Student’s t test to analyze the T cell phenotypes, and Fisher’s exact test to analyze the relationships among the CD4/CD8 ratio, the CTL response, and PD‐1 expression. JMP version 13 software (SAS) was used for the analyses, and P values less than .05 were considered significant.
3. RESULTS
3.1. Vaccination‐induced alteration of CD4 and CD8 T‐cell subsets in the discovery cohort
Flow cytometry was used to determine the CD4 and CD8 subsets of circulating T cells in patients with advanced or recurrent ovarian cancer treated with a personalized peptide vaccination. The initial analyses included the 26 patients from the Kawano et al10 study, ie, the discovery cohort, whose PBMCs at both pre‐ and post‐first vaccination cycle were available. The mean percentages of the pre‐ and post‐vaccination contents of CD4 and CD8 T cells were as follows: 41.8 ± 13.3 and 42.2 ± 13.9 for CD4 T cells, and 22.5 ± 8.8 and 21.6 ± 10.0 for CD8 T cells. The alterations during 1‐cycle vaccination (post‐value − pre‐value) were 0.32 (95% confidence interval [CI], 3.24 to −2.60) for CD4 T cells and −0.89 (95% CI, 0.84 to − 2.52) for CD8 T cells. The respective pre‐ and post‐vaccination CD4/CD8 ratios were 2.26 ± 1.26 and 2.56 ± 1.70. The alteration during the vaccination period was 0.29 (95% CI, 0.60 to −0.01; Table 2).
Table 2.
Vaccination‐induced alteration of CD4 and CD8 T‐cell subsets in peptide vaccine‐treated ovarian cancer patients
| Discovery cohort | Validation cohort | |||
|---|---|---|---|---|
| Mean (SD) | 95% CI | Mean (SD) | 95% CI | |
| CD4 | ||||
| Pre | 41.80 (13.10) | 36.50, 47.20 | 47.30 (9.70) | 43.40, 51.20 |
| Post | 42.20 (13.90) | 36.60, 47.80 | 45.40 (10.70) | 41.00, 49.70 |
| Difference | 0.32 (7.23) | −2.60, 3.24 | −1.95 (6.08) | −4.40, 0.50 |
| CD8 | ||||
| Pre | 22.50 (8.80) | 18.90, 25.00 | 22.20 (6.71) | 19.50, 24.90 |
| Post | 21.60 (9.98) | 17.60, 25.60 | 21.40 (7.74) | 18.20, 24.50 |
| Difference | −0.89 (4.03) | −2.52, 0.74 | −0.87 (3.49) | −2.28, 0.54 |
| CD4/CD8 | ||||
| Pre | 2.26 (1.26) | 1.76, 2.77 | 2.56 (1.75) | 1.86, 3.27 |
| Post | 2.56 (1.70) | 0.33, 1.87 | 2.59 (1.74) | 1.89, 3.30 |
| Difference | 0.29 (0.75) | −0.01, 0.60 | 0.03 (0.46) | −0.16, 0.21 |
Abbreviation: CI, confidence interval.
3.2. Relationship between vaccination‐induced alterations of T‐cell subsets and prognosis in discovery cohort
We divided the 26 patients of the discovery cohort based on high and low CD4 or CD8 contents and based on the pre‐ and postvaccination CD4/CD8 ratios. We analyzed the relationships of each of these 3 parameters to the patients’ OS by determining the Kaplan‐Meier plot. The median of each T‐cell subset percentage or ratio was used for the definition of “high” and “low” contents or rates. The results showed that the CD4 T cell content and the CD8 T cell content at both pre‐ and postvaccination were not correlated with the OS (data not shown).
We next divided the patients into groups based on decreased vs increased (ie, altered) contents of CD4 and CD8 and the CD4/CD8 ratio at pre‐ and postvaccination, and the relationship between these parameters with the patients’ OS was analyzed by Kaplan‐Meier plots (Figure 1A). The OS of the increased‐CD8 group of patients (n = 9) was significantly longer than that of the decreased‐CD8 group (n = 17) with the median survival times (MSTs) of 1114 and 439 days, respectively (hazard ratio [HR] 0.26; 95% CI, 0.08‐0.68; P = .0054). Similarly, the OS of the decreased‐CD4/CD8 ratio group (n = 10) was significantly longer than that of the increased‐CD4/CD8 ratio group (n = 16), with MSTs of 886 and 628 days, respectively (HR 0.33; 95% CI, 0.11‐0.83; P = .0178). In contrast, there was no significant difference between the 2 CD4 T‐cell groups in terms of OS.
Figure 1.
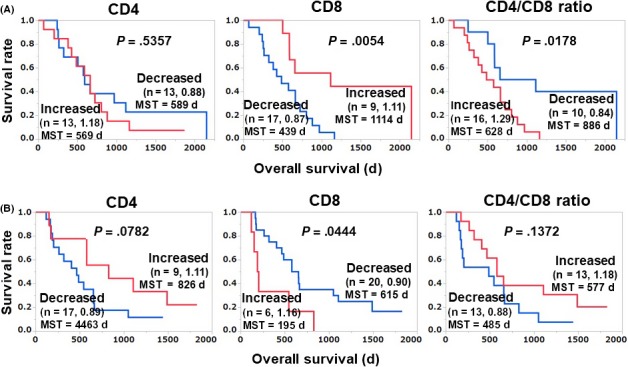
Relationship between vaccination‐induced alteration of T cell subsets and overall survival (OS) in the discovery cohort (A) and validation cohort (B) of advanced or recurrent ovarian cancer patients treated with a personalized peptide vaccination. Each cohort was comprised of 26 (different) patients. The mean of the post‐/pre‐values of each group is shown after the number of patients. MST, mean survival time
3.3. Relationship between vaccination‐induced alterations of T‐cell subsets and prognosis in validation cohort
To further test our results obtained from the discovery cohort, we evaluated an additional 26 patients enrolled more recently as the validation cohort. Surprisingly, opposite tendencies were observed in the validation cohort: the OS of the decreased‐CD8 group (n = 20) was significantly longer than that of the increased‐CD8 group (n = 6) (HR 0.34; 95% CI, 0.13‐0.97; P = .044), and the OS of the increased‐CD4/CD8 ratio group (n = 13) tended to be longer than that of the decreased‐CD4/CD8 ratio group (n = 13) (HR 0.52; 95% CI, 0.21‐1.24; P = .137) (Figure 1B). As shown in Table 1, the characteristics of the patients in the validation cohort were not significantly different from those of the patients in the discovery cohort.
We further analyzed the IgG and CTL responses of the discovery and validation cohorts, and we observed a significant difference in the IgG response between the 2 groups. The IgG response rate after the first vaccination cycle in the discovery cohort was 34.6%, which is significantly lower than that of the validation cohort (69.2%; P = .0254). These results indicated that the majority of patients in the discovery cohort were IgG nonresponders, whereas the majority of the validation cohort patients were IgG responders.
To test these results, we divided both the validation and discovery cohorts into IgG responder and nonresponder groups and undertook a survival analysis; the results are illustrated in Figure 2. In the IgG nonresponder group (the major group) of the discovery cohort (n = 17), our initial findings were confirmed: the OS of the increased‐CD8 group (n = 5) was significantly longer than that of the decreased‐CD8 group (HR 0.14; 95% CI, 0.02‐0.54; P = .0029), and the OS of the decreased‐CD4/CD8 ratio group (n = 6) was significantly longer than that of the increased‐CD4/CD8 ratio group (HR 0.23; 95% CI, 0.05‐0.77; P = .016) (Figure 2A). Similar tendencies were also observed in the IgG nonresponders of validation cohort (n = 8), but without significance as this number of nonresponder patients was too small (Figure 2B).
Figure 2.
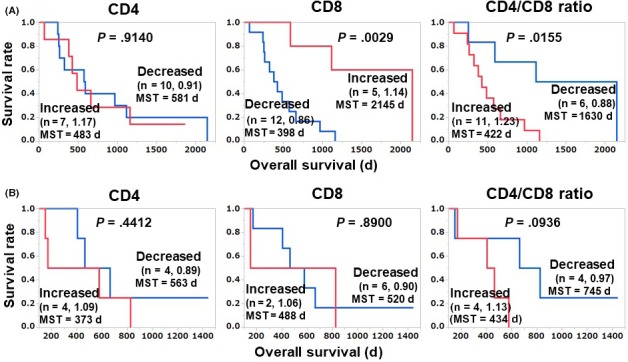
Relationship between vaccination‐induced alteration of T cell subsets and overall survival in IgG nonresponder patients of discovery (n = 17; A) and validation (n = 8; B) cohorts of patients with advanced or recurrent ovarian cancer treated with a personalized peptide vaccination. The mean of the post‐/pre‐values of each group is shown after the number of patients. MST, mean survival time
We next merged the IgG subgroups of the discovery and validation cohorts and undertook a survival analysis (Figure 3). In the IgG nonresponder group (n = 25) of the merged cohort, our initial findings were confirmed, ie, the OS of the increased‐CD8 group (n = 7) was significantly longer than that of the decreased‐CD8 group (P = .018), and the OS of the decreased‐CD4/CD8 ratio group (n = 10) was significantly longer than that of the increased‐CD4/CD8 ratio group (HR 0.26; 95% CI, 0.09‐0.68; P = .0055; Figure 3A). These results suggest that an increase in the CD8 content and a decrease in the CD4/CD8 ratio are both favorable prognosis markers following treatment of IgG nonresponders with personalized peptide vaccinations. However, no drastic increase in the percentage of CD8 T cells or decrease in the CD4/CD8 ratio was observed in the patients with good prognoses. It is also notable that in the IgG responder group of our present merged cohort, the OS of the patients with an increased CD4/CD8 ratio was also significantly longer than that of the patients whose CD4/CD8 ratio was not increased (HR 0.40; 95% CI, 0.17‐0.95; P = .037; Figure 3B).
Figure 3.
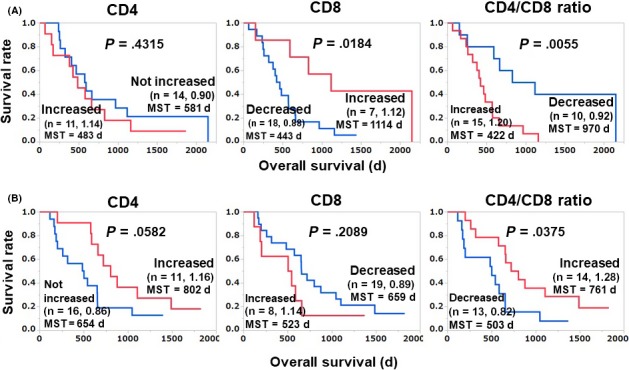
Relationship between vaccination‐induced alteration of T‐cell subsets and overall survival in IgG nonresponders (n = 25; A) and IgG responders (n = 27; B) in the merged cohort of patients with advanced or recurrent ovarian cancer treated with a personalized peptide vaccination. The mean of the post‐/pre‐values of each group is shown after the number of patients. MST, mean survival time
3.4. Relationships among CD4/CD8 ratio, the CTL response, and PD‐1 expression
We reported that induction of CTL responses and the increase of circulating PD‐1+ CD8 T cells were favorable prognosis markers following peptide vaccination.11, 17 In the present study we therefore analyzed the relationships among the circulating CD8+ T cell content, the CD4/CD8 ratio, the CTL response, and circulating PD‐1+ CD8 T cells in the IgG nonresponders (Figure 4). The CD4/CD8 ratio showed a significant relationship with both the CTL response and PD‐1+ CD8 T cells: 50% of the patients in the decreased‐CD4/CD8 ratio group showed a CTL response against vaccination peptides, whereas no CTL response was detected in the increased‐CD4/CD8 ratio group. Similarly, 66.7% of the patients in the decreased‐CD4/CD8 ratio group showed an increased level of PD‐1+ CD8 T cells, whereas only 9.1% of the increased‐CD4/CD8 ratio group did so. There was no significant relationship between the circulating CD8+ T cell content and CTL response or PD‐1+ CD8 T cells.
Figure 4.
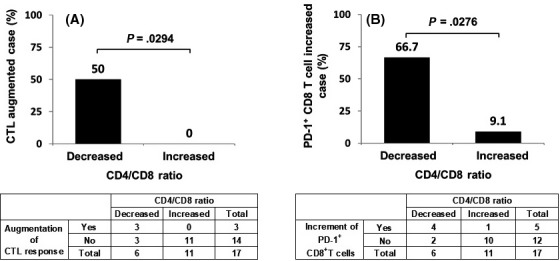
Relationship between CD4/CD8 ratio and CTL response (A) and the relationship between CD4/CD8 ratio and programmed cell death‐1 (PD‐1)+ CD8 T cells (B) in the IgG nonresponders of the merged cohort of patients with advanced or recurrent ovarian cancer treated with a personalized peptide vaccination
4. DISCUSSION
We have reported several biomarkers that are correlated with the prognoses of patients with various types of cancers treated with personalized peptide vaccines. Early clinical studies of the personalized peptide vaccine indicated that an early induction of the IgG response to the vaccine’s component peptides was correlated with the patient prognosis, although the component peptides were CTL‐epitope peptides and the induction of IgG responses was an off‐target effect.10, 11, 12, 13, 14, 15, 16 In contrast to the detection of CTL responses, the measurement of IgG has several benefits, ie, it is easier and more robust than the time‐consuming CTL assay. Several research groups are thus using the IgG response as a prognostic biomarker for vaccine therapy.18, 19
Features of delayed hypersensitivity (such as a skin reaction) have also been reported as biomarkers.20, 21, 22 In addition to immune response‐related biomarkers, we have reported inflammation‐related markers such as C‐reactive protein, interleukin‐6, serum amyloid A, and high‐mobility group box 1.23, 24, 25, 26, 27, 28 More recently, we reported that the level of circulating PD‐1+ CD8 T cells was a biomarker for vaccine therapy in patients with non‐small cell lung cancer or cervical cancer.11, 17 Our present findings indicated that the circulating CD8 T cell content and the CD4/CD8 ratio were each a possible vaccine therapy biomarker in patients with ovarian cancer. We observed that in the IgG nonresponders, an increase in the CD8 content and a decrease in the CD4/CD8 ratio were both favorable prognosis markers following peptide vaccination. The decrease in the CD4/CD8 ratio was reflected mainly by the increase in the CD8 T cell content. We also analyzed circulating PD‐1+ CD8 T cells in ovarian cancer patients, and no correlation was observed between the PD‐1+ CD8 T cell content and prognosis.
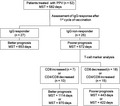
Figure 5 provides a diagram of the OS of each subgroup divided by IgG response and the T cell marker analysis. The IgG responder group (in which the IgG response to the vaccine peptides was detectable after the first cycle of vaccination) had more favorable prognoses than the IgG nonresponder group; the MSTs were 653 (n = 27) and 572 days (n = 25), respectively. When the IgG nonresponder group was further divided into the increased‐ and decreased‐CD8 groups, the respective MSTs were 1114 and 443 days. When the IgG nonresponder group was divided into decreased‐ and increased‐CD4/CD8 ratio groups, the respective MSTs were 970 and 422 days. These results indicate that the combination of the IgG response and the CD8 T cell content or the CD4/CD8 ratio at pre‐ and post‐first cycle vaccination might be helpful for physicians’ decision‐making regarding further treatment.
Figure 5.
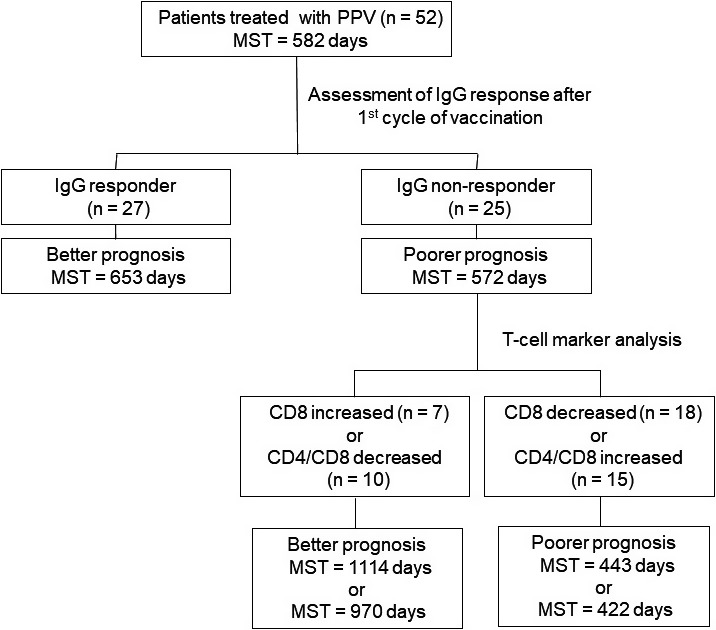
Overall survival of each subgroup of patients with advanced or recurrent ovarian cancer treated with a personalized peptide vaccination, divided by IgG response and T‐cell marker analysis. MST, mean survival time
It is unclear why a decreased CD4/CD8 ratio or an increased CD8 content was a favorable prognostic marker in the IgG nonresponders but not in the IgG responders. One of the possible mechanisms is as follows. All of the patients enrolled in this study had a history of chemotherapy, and the effects of the chemotherapy on the patients’ lymphoid cells might be carried over during the vaccination period. In the IgG nonresponders, the reactivity of B cells and CD4 T cells against vaccine peptides as well as tumor antigens might be suppressed. If the antigen reactivity of CD8 T cells (ie, CTLs) has remained in the IgG nonresponders, the numbers of CD8 T cells against the vaccinated peptides as well as tumor antigens are expanded and contribute to a favorable prognosis. In this case, the CD8 contents are increased and the CD4/CD8 ratio is decreased. In the IgG responders, the reactivity of B cells and CD4 T cells has remained and expanded in response to the vaccine peptides as well as tumor antigens. In this case, the expansion of CD8 cells has less effect on the CD4/CD8 ratio. In conclusion, the usefulness of the 2 classical T cell markers (the CD8 content and the CD4/CD8 ratio in peripheral blood) as biomarkers in IgG nonresponders among advanced or recurrent ovarian cancer patients treated with personalized peptide vaccinations was revealed by the results of our present analyses.
DISCLOSURE
Akira Yamada is a board member of Bright Path Biotherapeutics (Kawasaki, Japan). The other authors have no conflict of interest.
Waki K, Kawano K, Tsuda N, Komatsu N, Yamada A. CD4/CD8 ratio is a prognostic factor in IgG nonresponders among peptide vaccine‐treated ovarian cancer patients. Cancer Sci. 2020;111:1124–1131. 10.1111/cas.14349
REFERENCES
- 1. Wolchok JD, Chiarion‐Sileni V, Gonzalez R, et al. Overall survival with combined nivolumab and ipilimumab in advanced melanoma. N Engl J Med. 2017;377:1345‐1356. [DOI] [PMC free article] [PubMed] [Google Scholar]
- 2. Borghaei H, Paz‐Ares L, Horn L, et al. Nivolumab versus docetaxel in advanced nonsquamous non‐small‐cell lung cancer. N Engl J Med. 2015;373:1627‐1639. [DOI] [PMC free article] [PubMed] [Google Scholar]
- 3. Brahmer J, Reckamp KL, Baas P, et al. Nivolumab versus docetaxel in advanced squamous‐cell non–small‐cell lung cancer. N Engl J Med. 2015;373:123‐135. [DOI] [PMC free article] [PubMed] [Google Scholar]
- 4. Kang Y‐K, Boku N, Satoh T, et al. Nivolumab in patients with advanced gastric or gastro‐oesophageal junction cancer refractory to, or intolerant of, at least two previous chemotherapy regimens (ONO‐4538‐12, ATTRACTION‐2): a randomised, double‐blind, placebo‐controlled, phase 3 trial. Lancet. 2017;390:2461‐2471. [DOI] [PubMed] [Google Scholar]
- 5. Overman MJ, McDermott R, Leach JL, et al. Nivolumab in patients with metastatic DNA mismatch repair‐deficient or microsatellite instability‐high colorectal cancer (CheckMate 142): an open‐label, multicentre, phase 2 study. Lancet Oncol. 2017;18:1182‐1191. [DOI] [PMC free article] [PubMed] [Google Scholar]
- 6. Varga A, Piha‐Paul S, Ott PA, et al. Pembrolizumab in patients with programmed death ligand 1‐positive advanced ovarian cancer: Analysis of KEYNOTE‐028. Gynecol Oncol. 2019;152:243‐250. [DOI] [PubMed] [Google Scholar]
- 7. Schmid P, Adams S, Rugo HS, et al. Atezolizumab and nab‐paclitaxel in advanced triple‐negative breast cancer. N Engl J Med. 2018;379:2108‐2121. [DOI] [PubMed] [Google Scholar]
- 8. Rittmeyer A, Barlesi F, Waterkamp D, et al. Atezolizumab versus docetaxel in patients with previously treated non‐small‐cell lung cancer (OAK): a phase 3, open‐label, multicentre randomised controlled trial. Lancet. 2017;389:255‐265. [DOI] [PMC free article] [PubMed] [Google Scholar]
- 9. Larkin J, Chiarion‐Sileni V, Gonzalez R, et al. Combined nivolumab and ipilimumab or monotherapy in untreated melanoma. N Engl J Med. 2015;373:23‐34. [DOI] [PMC free article] [PubMed] [Google Scholar]
- 10. Kawano K, Tsuda N, Matsueda S, et al. Feasibility study of personalized peptide vaccination for recurrent ovarian cancer patients. Immunopharmacol Immunotoxicol. 2014;36:224‐236. [DOI] [PubMed] [Google Scholar]
- 11. Kawano K, Tsuda N, Waki K, et al. Personalized peptide vaccination for cervical cancer patients who have received prior platinum‐based chemotherapy. Cancer Sci. 2015;106:1111‐1117. [DOI] [PMC free article] [PubMed] [Google Scholar]
- 12. Yoshimura K, Minami T, Nozawa M, et al. A phase 2 randomized controlled trial of personalized peptide vaccine immunotherapy with low‐dose dexamethasone versus dexamethasone alone in chemotherapy‐naive castration‐resistant prostate cancer. Eur Urol. 2016;70:35‐41. [DOI] [PubMed] [Google Scholar]
- 13. Noguchi M, Kakuma T, Uemura H, et al. A randomized phase II trial of personalized peptide vaccine plus low dose estramustine phosphate (EMP) versus standard dose EMP in patients with castration resistant prostate cancer. Cancer Immunol Immunother. 2010;59:1001‐1009. [DOI] [PMC free article] [PubMed] [Google Scholar]
- 14. Yamada A, Sasada T, Noguchi M, Itoh K. Next‐generation peptide vaccines for advanced cancer. Cancer Sci. 2013;104:15‐21. [DOI] [PMC free article] [PubMed] [Google Scholar]
- 15. Noguchi M, Mine T, Yamada A, et al. Combination therapy of personalized peptide vaccination and low‐dose estramustine phosphate for metastatic hormone refractory prostate cancer patients: an analysis of prognostic factors in the treatment. Oncol Res. 2007;16:341‐349. [DOI] [PubMed] [Google Scholar]
- 16. Noguchi M, Mine T, Komatsu N, et al. Assessment of immunological biomarkers in patients with advanced cancer treated by personalized peptide vaccination. Cancer Biol Ther. 2010;10:1266‐1279. [DOI] [PubMed] [Google Scholar]
- 17. Waki K, Yamada T, Yoshiyama K, et al. PD‐1 expression on peripheral blood T‐cell subsets correlates with prognosis in non‐small cell lung cancer. Cancer Sci. 2014;105:1229‐1235. [DOI] [PMC free article] [PubMed] [Google Scholar]
- 18. Kanekiyo S, Hazama S, Takenouchi H, et al. IgG response to MHC class I epitope peptides is a quantitative predictive biomarker in the early course of treatment of colorectal cancer using therapeutic peptides. Oncol Rep. 2018;39:2385‐2392. [DOI] [PubMed] [Google Scholar]
- 19. Oji Y, Hashimoto N, Tsuboi A, et al. Association of WT1 IgG antibody against WT1 peptide with prolonged survival in glioblastoma multiforme patients vaccinated with WT1 peptide. Int J Cancer. 2016;139:1391‐1401. [DOI] [PMC free article] [PubMed] [Google Scholar]
- 20. Chamani R, Ranji P, Hadji M, Nahvijou A, Esmati E, Alizadeh AM. Application of E75 peptide vaccine in breast cancer patients: a systematic review and meta‐analysis. Eur J Pharmacol. 2018;831:87‐93. [DOI] [PubMed] [Google Scholar]
- 21. Chen G, Gupta R, Petrik S, et al. A feasibility study of cyclophosphamide, trastuzumab, and an allogeneic GM‐CSF‐secreting breast tumor vaccine for HER2+ metastatic breast cancer. Cancer Immunol Res. 2014;2:949‐961. [DOI] [PMC free article] [PubMed] [Google Scholar]
- 22. Perez SA, Anastasopoulou EA, Papamichail M, Baxevanis CN. AE37 peptide vaccination in prostate cancer: identification of biomarkers in the context of prognosis and prediction. Cancer Immunol Immunother. 2014;63:1141‐1150. [DOI] [PMC free article] [PubMed] [Google Scholar]
- 23. Shirahama T, Muroya D, Matsueda S, et al. A randomized phase II trial of personalized peptide vaccine with low dose cyclophosphamide in biliary tract cancer. Cancer Sci. 2017;108:838‐845. [DOI] [PMC free article] [PubMed] [Google Scholar]
- 24. Kibe S, Yutani S, Motoyama S, et al. Phase II study of personalized peptide vaccination for previously treated advanced colorectal cancer. Cancer Immunol Res. 2014;2:1154‐1162. [DOI] [PubMed] [Google Scholar]
- 25. Yutani S, Komatsu N, Yoshitomi M, et al. A phase II study of a personalized peptide vaccination for chemotherapy‐resistant advanced pancreatic cancer patients. Oncol Rep. 2013;30:1094‐1100. [DOI] [PubMed] [Google Scholar]
- 26. Yoshitomi M, Yutani S, Matsueda S, et al. Personalized peptide vaccination for advanced biliary tract cancer: IL‐6, nutritional status and pre‐existing antigen‐specific immunity as possible biomarkers for patient prognosis. Exp Ther Med. 2012;3:463‐469. [DOI] [PMC free article] [PubMed] [Google Scholar]
- 27. Yoshiyama K, Terazaki Y, Matsueda S, et al. Personalized peptide vaccination in patients with refractory non‐small cell lung cancer. Int J Oncol. 2012;40:1492‐1500. [DOI] [PubMed] [Google Scholar]
- 28. Waki K, Kawano K, Tsuda N, Ushijima K, Itoh K, Yamada A. Plasma levels of high‐mobility group box 1 during peptide vaccination in patients with recurrent ovarian cancer. J Immunol Res. 2017;2017:1423683. [DOI] [PMC free article] [PubMed] [Google Scholar]


