Abstract
Background
Tumor growth can be addicted to vital oncogenes, but whether long noncoding RNAs (lncRNAs) are essential to cancer survival is largely uncharacterized.
Methods
We retrieved Gene Expression Omnibus datasets to identify lncRNA overexpression in 257 cancers vs 196 normal tissues and analyzed the association of ST8SIA6-AS1 (termed Aurora A/Polo-like-kinase 1 [PLK1]–associated lncRNA, APAL) with the clinical outcomes of multiple types of cancer from public RNA sequencing and microarray datasets as well as from in-house cancer cohorts. Loss- and gain-of-function experiments were performed to explore the role of APAL in cancers in vitro and in vivo. RNA pulldown and RNA immunoprecipitation were used to investigate APAL-interacting proteins. All statistical tests were two-sided.
Results
APAL is overexpressed in multiple human cancers associated with poor clinical outcome of patients. APAL knockdown causes mitotic catastrophe and massive apoptosis in human breast, lung, and pancreatic cancer cells. Overexpressing APAL accelerates cancer cell cycle progression, promotes proliferation, and inhibits chemotherapy-induced apoptosis. Mechanism studies show that APAL links up PLK1 and Aurora A to enhance Aurora A-mediated PLK1 phosphorylation. Notably, targeting APAL inhibits the growth of breast and lung cancer xenografts in vivo (MCF-7 xenografts: mean tumor weight, control = 0.18 g [SD = 0.03] vs APAL locked nucleic acids = 0.07 g [SD = 0.02], P < .001, n = 8 mice per group; A549 xenografts: mean tumor weight control = 0.36 g [SD = 0.10] vs APAL locked nucleic acids = 0.10 g [SD = 0.04], P < .001, n = 9 mice per group) and the survival of patient-derived breast cancer organoids in three-dimensional cultures.
Conclusions
Our data highlight the essential role of lncRNA in cancer cell survival and the potential of APAL as an attractive therapeutic target for a broad-spectrum of cancers.
An ideal therapeutic strategy against cancer is to selectively target the genetic alterations essential for cancer cell survival. Cancer cells depend on abnormally expressed oncogenes for continuous growth and maintenance of their malignant phenotypes, termed oncogene addiction (1,2). Recently, loss-of-function screening has identified a number of protein-coding oncogenes that cancer cells are addicted to (1). Usually, such vital genes are overexpressed in cancer cells vs the corresponding normal tissue cells, making them potential therapeutic targets for cancer treatment (1,3).
Long noncoding RNAs (lncRNAs) are a large class of nonprotein coding transcripts that play important roles in tumorigenesis (4). However, few lncRNAs have been found to be essential for cancer cell survival, especially those critical for a wide range of cancer types. Here, we aimed to identify lncRNAs whose expression was associated with clinical outcomes of multiple types of cancers and investigated whether the lncRNAs might serve as potential therapeutic targets for multiple cancer types by regulating essential signal pathways.
Methods
Detailed methods on all in vitro experiments are provided in the Supplementary Methods (available online).
Mouse Models
Mouse studies were carried out according to the ethical regulations approved by the Sun Yat-Sen University Animal Care and Use Committee. Nude mice were purchased from and housed in the Center of Experimental Animal of Sun Yat-Sen University. Xenograft experiments (n = 8 mice per group for MCF-7 xenografts and n = 9 mice per group for A549 xenografts) are described in the Supplementary Methods (available online).
Patient Sample Collection
Paraffin-embedded breast cancer (n = 199) and lung cancer (n = 64) tissues and three fresh breast tumors for organoid cultures were obtained without any treatment before surgery. All samples were collected with signed informed consents from patients according to the internal review and ethics board of Sun Yat-Sen Memorial Hospital.
Statistical Analyses
Data of mitotic nuclei, in situ hybridization (ISH), immunohistochemistry, and terminal deoxynucleotidyl transferase dUTP nick end labeling (TUNEL) assay were blindly scored. For comparisons, independent sample t test, paired sample t test, chi-square test, and post hoc test were performed using SPSS 17. Kaplan-Meier curves were generated using X-tile to select the best cut-point (5) and GraphPad Prism 7 for log-rank test. All statistical tests were two-sided, and P less than .05 was considered statistically significant.
Results
APAL Expression in Multiple Cancer Types
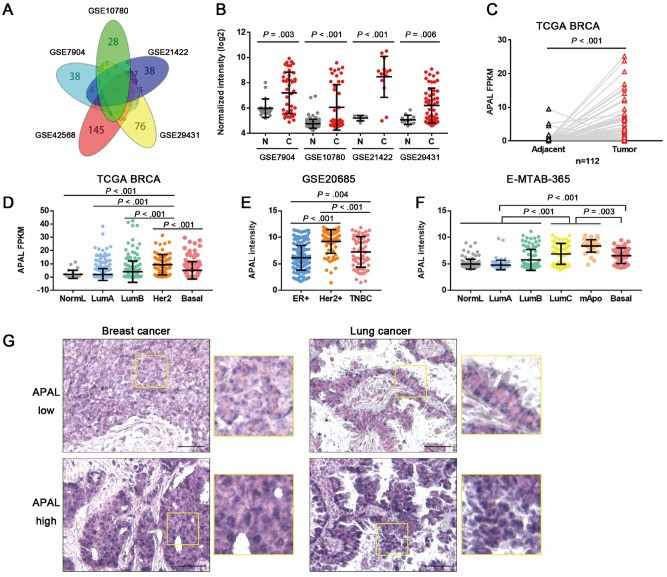
To identify the overexpressed lncRNAs essential for cancer growth, we retrieved five breast cancer microarray datasets (6–9) (Supplementary Figure 1A, available online) and found 21 lncRNAs, including HOTAIR and ST8SIA6-AS1, which we termed APAL (Aurora A/Polo-like-kinase 1 [PLK1]–associated lncRNA), exhibited increased expression in the tumors as compared with the normal tissues (Figure 1, A and B). In the paired The Cancer Genome Atlas (TCGA) breast cancer data (TCGA BRCA), APAL was approximately 2.4-fold higher in the tumors than adjacent normal tissues (P < . 001, 95% confidence interval [CI] = 1.43 to 3.37) (Figure 1C). Moreover, lower APAL expression was found in the relatively slow-growing subtypes, such as the luminal A or B subtypes, but a higher APAL level was found in the more aggressive subsets, including HER2+, basal-like, as well as luminal C and molecular apocrine breast cancer (10,11) (Figure 1, D–F). Further, we found by searching LncRNAtor that APAL was overexpressed in a broad spectrum of cancer types, including breast, lung, liver, kidney, and prostate cancers [12) (Supplementary Figure 1B, available online).
Figure 1.
Expression of Aurora A/PLK1–associated long noncoding RNAs (lncRNAs) (APAL) in cancer tissues. A) Venn diagram of differentially expressed lncRNAs in five breast cancer datasets with fold changes greater than 1.5 (P < .01) as analyzed by two-sided independent sample t test. B) APAL expression in breast cancer datasets as analyzed by independent-sample two-sided t test. C) APAL expression in the tumors and normal tissues of paired TCGA breast cancer data (BRCA) data as analyzed by two-sided paired sample t test. D–F) APAL expression in different subtypes of breast cancer in The Cancer Genome Atlas (TCGA) BRCA (n = 813), GSE20685 (n = 327), and E-MTAB-365 (n = 426) datasets. G) APAL expression in representative paraffin-embedded tissues of breast cancer (n = 199) and lung cancer tissues (n = 64), as detected by in situ hybridization (ISH). ISH signals are detected as blue-purple staining with nuclei counterstained by nuclear fast red. Scale bar = 50 μm. See also Supplementary Figure 1 (available online).
ISH for APAL in surgical resection specimens demonstrated that intensive APAL signals were located mainly in the nuclei of tumor cells, which were detected in 42.7% (85 of 199) of the breast cancer tissues and in 46.9% (30 of 64) of the lung cancer tissues (Figure 1G). High APAL level was statistically significantly associated with advanced tumor grading and staging in all breast cancer patients and in the non triple-negative breast cancers (TNBC) patients (Supplementary Table 1, available online).
Association of APAL Expression With the Clinical Outcome of Cancer Patients
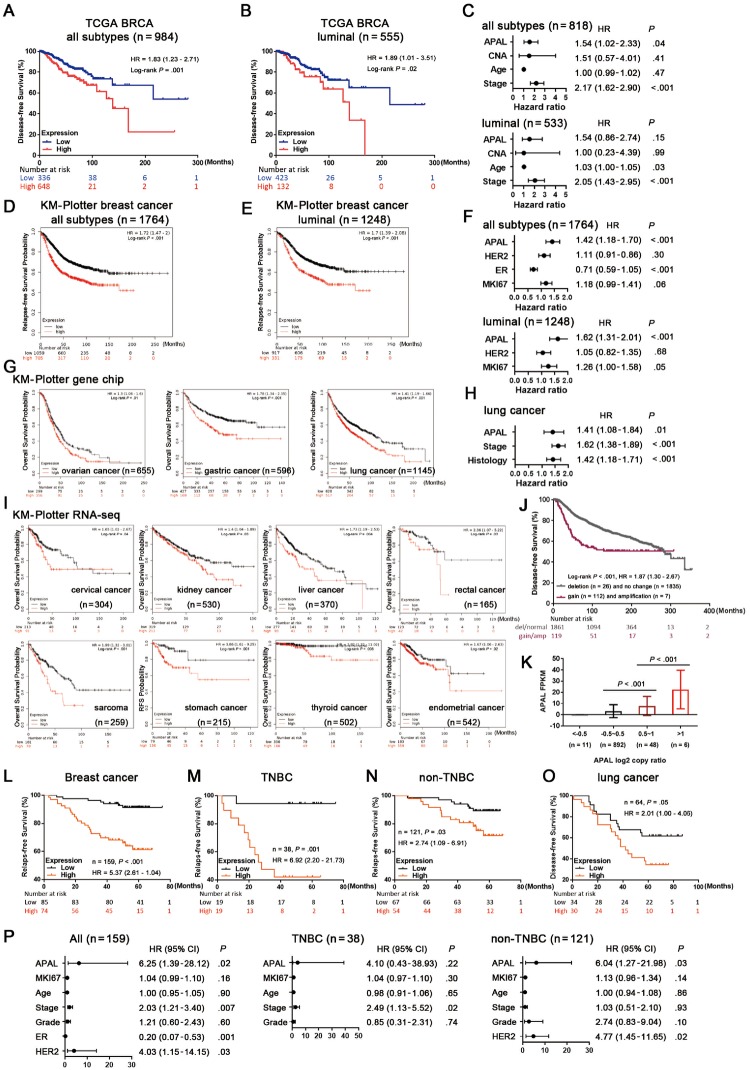
Next we found higher APAL level was associated with poorer disease-free survival (DFS) in TCGA BRCA (P = .001, hazard ratio [HR] = 1.83, 95% CI = 1.23 to 2.71) and poorer relapse-free survival (RFS) in the gene-chip dataset of KM-Plotter breast cancer (13) (P < .001, HR = 1.72, 95% CI = 1.47 to 2.00) (Figure 2, A and D), especially in the luminal subgroup (Figure 2, B and E). Strikingly, in multiple Kaplan-Meier Plotter (KM-Plotter) cancer datasets (14), high APAL expression was statistically significantly associated with poor survival of ovarian, gastric, lung, cervical, kidney, liver, rectal, thyroid, and uterine cancers, etc (Figure 2, G and I). However, it was not associated with the survival of bladder carcinoma, esophageal carcinoma, head-neck squamous cell carcinoma, and renal papillary cell carcinoma, etc (Supplementary Figure 1E, available online).
Figure 2.
Association of Aurora A/PLK1–associated long noncoding RNAs (APAL expression with clinical outcome of cancer patients. A–B) Association of APAL expression with disease-free survival (DFS) in all breast cancer patients (n = 984) and luminal breast cancer subtype (n = 555) in The Cancer Genome Atlas (TCGA) BRCA. C) Multivariable Cox regression for APAL, copy number alteration burden, age, and tumor stage with DFS in all breast cancer patients (n = 818) and luminal subtype (n = 533) in TCGA BRCA. D–E) Association of APAL expression with relapse-free survival (RFS) in all breast cancer patients (n = 1764) and luminal subtype (n = 1248) in the Kaplan-Meier Plotter (KM-Plotter) database with gene chip meta data. F) Multivariable Cox regression for APAL, HER2, estrogen receptor (ER), and MKI67 expression with RFS in all breast cancer patients (n = 1764) and luminal subtype (n = 1248) in the KM-Plotter database with gene chip metadata. G) Association of APAL expression with overall survival (OS) in ovarian, gastric, and lung cancer patients in the KM-Plotter database with gene chip metadata. H) Multivariable Cox regression for APAL, tumor stage, and histology with OS in the KM-Plotter database with lung cancer gene chip metadata. I) Association of APAL expression with patient outcomes of pan-cancer in the KM-Plotter database with RNA sequence metadata. J) Association of APAL gene gain or amplification with DFS in METABRIC breast cancer data. K) APAL expression in tumors with gene amplification (log2 copy ratio>1), genomic gains (log2 copy ratio 0.5∼1), or those without genomic gains (log2 copy ratio < 0.5) in TCGA BRCA (n = 957). L–N) Association of APAL in situ hybridization (ISH) staining in paraffin-embedded tissues with RFS of all breast cancer patients and triple-negative breast cancer (TNBC) or non-TNBC subgroups in the in-house cohort of breast cancer. O) Association of APAL ISH staining in paraffin-embedded tissues with DFS of the in-house cohort of lung cancer patients. P) Cox regression for APAL and other predictors with RFS in all breast cancer, TNBC, and non-TNBC patients. P value was based on two-sided log-rank test for Kaplan-Meier curves or Cox regression test for multivariable analysis. See also Supplementary Figure 1 (available online). CI = confidence interval; HR = hazard ratio.
Moreover, genomic gain of APAL was observed in breast, prostate, and gastric cancers, with the highest frequency being 6.0% in breast cancer (15). APAL genomic gain or amplification was also associated with decreased DFS in the METABRIC breast cancer dataset (16) (P < .001, HR = 1.87, 95% CI = 1.30 to 2.67) (Figure 2J). Although copy number alteration of APAL and its neighbor genes was not frequent in cancer patients (Supplementary Figure 1, C and D, available online), APAL expression was higher in the tumors with gene amplification than those only with genomic gains or those without genomic gains in the TCGA BRCA dataset (Figure 2K).
Consistent with the publicly available datasets, APAL expression in our cohorts was positively associated with poor RFS of breast cancer patients and with poor DFS of lung cancer patients (Figure 2, L and O). Subtype analysis demonstrated that high APAL level was associated with RFS of both TNBC and the non-TNBC subgroup (Figure 2, M and N).
Cox regression analysis revealed that APAL was associated with survival as a continuous variable in GSE20685 (n = 327, P = .005) and E-MTAB-365 (n = 426, P = .004), but not in the TCGA breast cancer dataset (n = 984, P = .65) (Supplementary Figure 1F, available online). Multivariable analysis showed that APAL independently predicted DFS when adjusted for copy number alteration burden or together with age and staging in all TCGA BRCA patients (Figure 2C;Supplementary Figure 1G, available online), or when adjusted for MKI67, HER2, and ER expression in the KM-Plotter breast cancer patients (Figure 2F) as well as when adjusted for tumor staging and histology in KM-Plotter lung cancer patients (Figure 2H). Additionally, in our in-house breast cancer cohort, APAL served as an independent prognostic factor for all breast cancer samples and the non-TNBC patients (Figure 2P). Together, the prognostic data suggest that APAL is associated with patient survival in multiple cancer types.
The Role of APAL in Survival and Mitotic Catastrophe of Cancer Cells
Although previous RNA sequencing showed that APAL had multiple splicing variants, we found its major isoform in breast cancer cells was a 1700-nt transcript by 5’ and 3’ RACE (Supplementary Figure 2A, available online). We confirmed APAL as a noncoding RNA using the Protein Coding Potential Calculator (17) and NCBI ORF finder (18). Further, quantitative reverse transcriptase-polymerase chain reaction (qRT-PCR) demonstrated that APAL expression was almost undetectable in the normal or immortalized breast epithelial cell lines but was much higher in multiple breast cancer cell lines (Supplementary Figure 2B, available online). Also, high APAL expression was observed in prostate, breast, lung, and liver cancer cell lines in the Cancer Cell Line Encyclopedia (https://portals.broadinstitute.org/ccle) (Supplementary Figure 2C, available online).
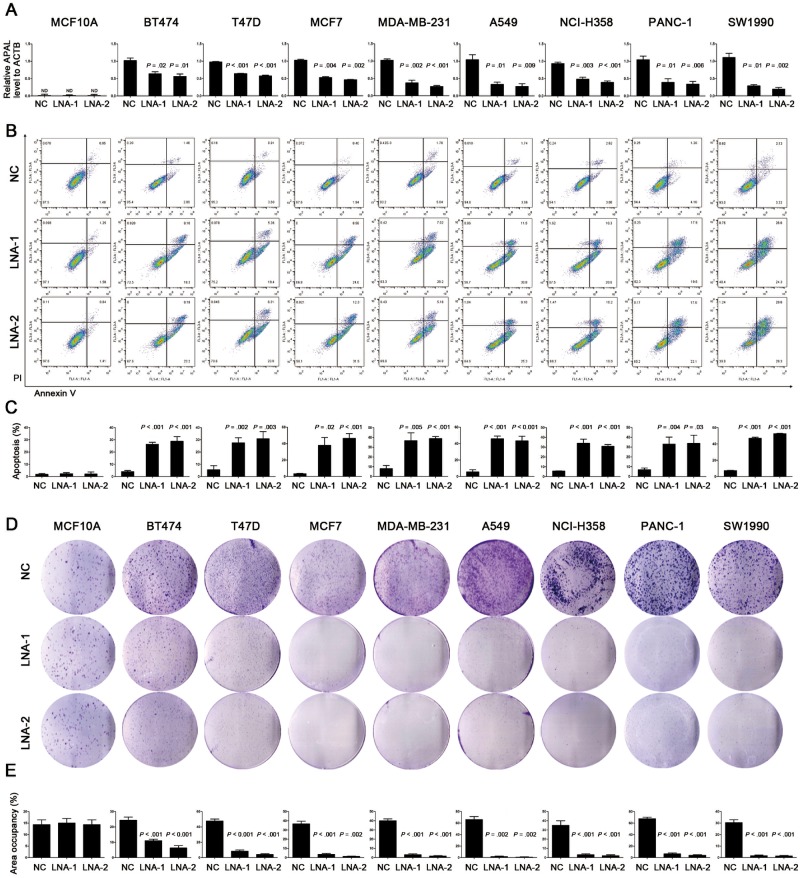
Cell fractionation followed both by qRT-PCR and fluorescence ISH showed that the majority of APAL was distributed in the nuclei of MCF7 cells (Supplementary Figure 2, D and E, available online). Thus, we silenced its expression by locked nucleic acids (LNAs) to induce RNase-H–mediated degradation rather than using small interfering RNAs (siRNAs) (19). Surprisingly, APAL knockdown induced massive apoptosis in multiple breast cancer lines, including MCF-7, BT474, T47D, and MDA-MB-231, with distinct molecular subtyping (Figure 3, A–C). Similarly, transfection of APAL-LNAs also induced statistically significant apoptosis in A549 and NCI-H358 lung cancer cells as well as PANC-1 and SW1990 pancreatic cancer cells (Figure 3, A–C). In contrast, silencing APAL did not influence the survival of MCF-10A or HCT116 and HT-29 colon cancer cells with undetectable APAL expression by qRT-PCR (Figure 3, A–C;Supplementary Figure 2F, available online). Consistently, colony formation assay demonstrated that APAL knockdown tremendously reduced the clonogenicity of breast, lung, and pancreatic cancer cells (Figure 3, D and E), suggesting that APAL was essential for survival of the cancer cells that are addicted to its expression.
Figure 3.
Effects of Aurora A/PLK1–associated long noncoding RNAs (APAL knockdown on cancer cell death. A) Knockdown efficiency of APAL in cancer cell lines. Cells were transiently transfected with negative control (NC) locked nucleic acid (LNA) or LNA targeting APAL (LNA-1 and LNA-2). ND = nondetectable. B–C) The effect of APAL knockdown on apoptosis. Cell apoptosis was measured by costaining of annexin V and propidium iodide followed by flow cytometric analysis. D–E) Effects of APAL knockdown on colony formation. Cells transfected with LNA were seeded in six-well plates at a density of 2000 cells per well. Seven days after transfection cells were fixed with methanol and stained with crystal violet (D). Colony formation of each cell line is presented as the percentage of area occupancy (E). Bar graphs represent means ± SD of experimental triplicates. Two-sided independent sample t test was used to compare APAL LNA- and NC LNA-treated cells. See also Supplementary Figure 2 (available online).
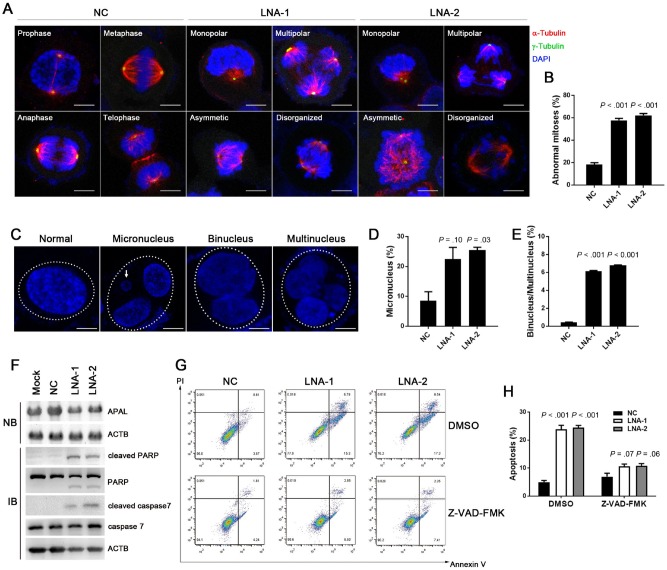
To investigate the cellular events that triggered apoptosis upon APAL silencing, we examined the mitosis of the APAL-knockdown cells before they underwent cell death. Immunostaining of the microtubules (α-tubulin) and the centrosomes (γ-tubulin) in T47D cells showed that APAL knockdown led to around 60% of abnormal mitosis, as evidenced by monopolar, multipolar, asymmetric, and disorganized spindles (Figure 4, A and B), indicating characteristic mitotic catastrophe in cells. We also observed that a portion of the APAL-knockdown T47D cells exit mitosis before undergoing cell death, forming giant cells with micronucleation, which defined mitotic errors (20), as well as binucleation and multinucleation, manifesting cells that would eventually undergo mitotic catastrophe (21) (Figure 4, C and E). Thus, our data suggest that loss of APAL causes severe mitotic abnormalities and triggers mitotic catastrophe in cancer cells, leading to massive cell death.
Figure 4.
Effects of Aurora A/PLK1–associated long noncoding RNAs (APAL) knockdown in mitotic catastrophe. A–B) The effect of APAL knockdown on mitosis. T47D cells transfected with locked nucleic acids (LNAs) were immunostained with α-tubulin and γ-tubulin. The percentages of abnormal mitotic cells were calculated in B. Scale bar = 10 μm. C–E) The effect of APAL knockdown on generating micronuclei and multinuclei. T47D cells transfected with LNAs were counterstained with 4′,6-diamidino-2-phenylindole. The percentages of abnormal nuclei are calculated in D and E. Dotted ellipses indicate nuclei derived from one cell. Scale bar = 10 μm. F) Northern blot (NB) for APAL in MCF7 cells transiently transfected with LNA (top) and immunoblot (IB) of PARP and caspase-7 cleavage (bottom). G–H) The effect of treating LNA-transfected MCF7 cells with caspase inhibitor Z-VAD-FMK. Bar graphs represent means ±SD of experimental triplicates. Two-sided independent sample t test was used to compare APAL LNA- and NC LNA-treated cells. ACTB = beta-actin; PARP = Poly ADP-ribose polymerase; DMSO = dimethyl sulfoxide; NC = negative control; PI = propidium iodide.
Herein we verified the cell death was apoptosis by showing that cleaved PARP and caspase-7 could be detected in MCF7 transfected with APAL-LNAs, but not the control LNA (Figure 4F). Also the pan-caspase inhibitor Z-VAD-FMK inhibited the apoptosis induced by APAL knockdown in MCF7 (Figure 4, G and H), suggesting that the cell death was indeed apoptosis.
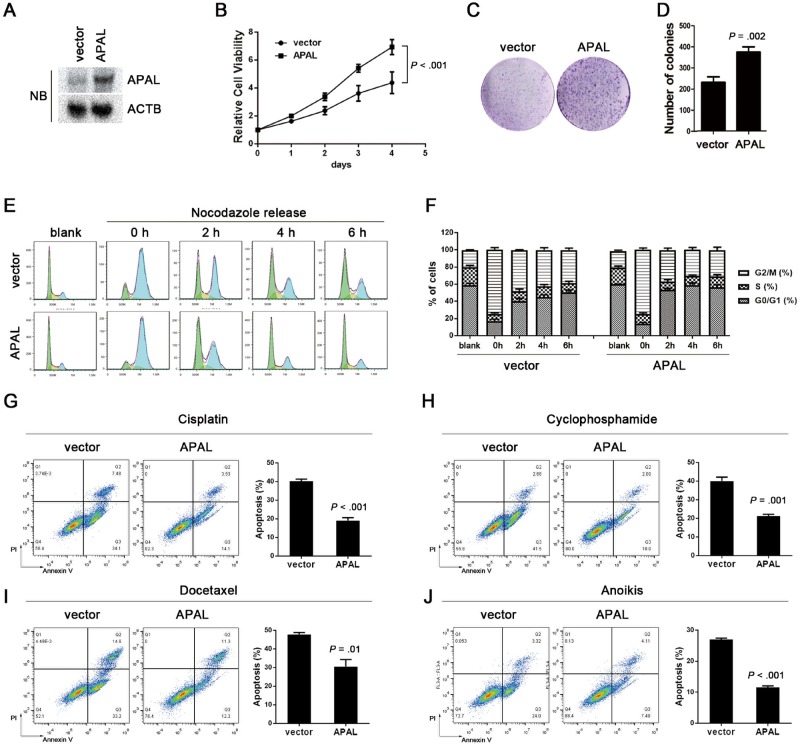
Using the SnoVector, a construct generated for stable nuclear lncRNA expression (22), we overexpressed APAL in MDA-MB-231 cells (Figure 5A). Overexpressing APAL dramatically increased the cell viability and colony-forming capacity of MDA-MB-231 (Figure 5, B–D). Upon releasing from the nocodazole-induced G2/M synchronization, APAL-overexpressing cells progressed more rapidly in the cell cycle than control cells did (Figure 5, E and F). Moreover, enforced APAL expression protected MDA-MB-231 from the apoptosis induced by cisplatin, docetaxel, and cyclophosphamide, as well as anoikis, but did not affect apoptosis in the untreated cells (Figure 5, G and I).
Figure 5.
Effects of Aurora A/PLK1–associated long noncoding RNAs (APAL overexpression on cell cycle progression. A–B) The effect of APAL overexpression on tumor cell proliferation. APAL overexpression in MDA-MB-231 was detected by northern blot (A). CellTiter-Glo assay showed proliferation of MDA-MB-231 cells stably expressing APAL or control Sno-vector at a density of 1000 cells per well in 96-well plates. P value was based on the general linear model of repeated measures and was two-sided. C–D) Colony formation of MDA-MB-231 cells stably expressing APAL or control Sno-vector. A total of 1000 cells per well were seeded in six-well plates in triplicates. E) M-phase progression of APAL-overexpressing or control cells. MDA-MB-231 cells stably transfected with APAL or control vector were treated with nocodazole (100 ng/mL) for 16 hours. Mitotic cells were harvested using the mitotic shake-off method. Cell cycle profile was analyzed at the indicated time points after the cells were released. F) Mitosis progression of APAL-overexpressing or control MDA-MB-231 cells. G–J) Effects of chemotherapy drug treatments and anoikis on APAL-overexpressing or control MDA-MB-231 cells. Cells were treated with 5 μM cisplatin (48 hours), 5 nM docetaxel (24 hours), 200 nM cyclophosphamide (48 hours), or cultured in suspension (36 hours) followed by costaining of annexin V and propidium iodide (PI) for flow cytometric analysis. Graphs represent means ±SD of experimental triplicates. Two-sided independent sample t test was used to compare APAL-overexpressing and control cells in bar graphs.
Interaction of APAL with PLK1 and Its Kinase Aurora A
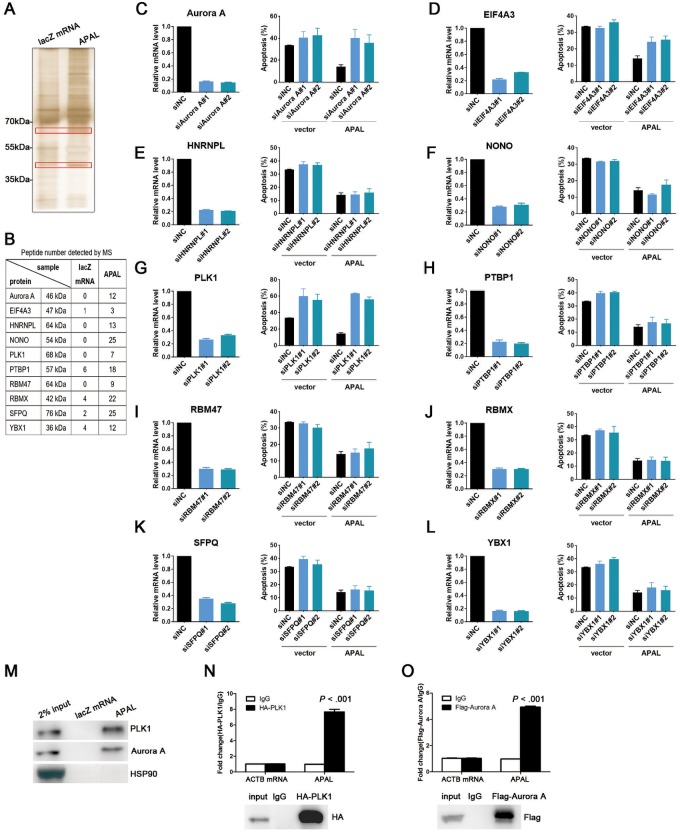
We found that APAL knockdown in MCF7 did not affect the expression of ST8SIA6, the protein-coding sense counterpart of APAL, or its neighboring genes (Supplementary Figure 3, A and B, available online). To explore the molecular mechanisms of APAL, we employed RNA pulldown followed by mass spectrometry in MCF7 to identify the proteins interacting with APAL. We subjected two protein bands (35–55 kDa and 55–70 kDa) that were specifically enriched in the APAL pulldown complex, but not in the control RNA, to mass spectrometry (Figure 6A) and identified more than 30 proteins that might interact with APAL. We selected 10 candidates for validation, which were identified as essential genes for cancer growth by high throughput screenings (2,23–25) (Figure 6B). We silenced their gene expression in APAL-expressing MDA-MB-231 and evaluated apoptosis upon cisplatin treatment. Interestingly, silencing PLK1, a key regulator of cell cycle and DNA damage repair (26), not only abrogated the protective effect of APAL on apoptosis (Figure 6, C–L) but also induced massive apoptosis in untreated cells (Supplementary Figure 3C, available online), which was reminiscent of the phenotype of silencing APAL (Figure 3, B and C). Similar effects were observed when silencing Aurora A (AURKA) but were not as dramatic as silencing PLK1 (Figure 6C;Supplementary Figure 3C, available online).
Figure 6.
Identification of Aurora A/PLK1–associated long noncoding RNAs (APAL-binding proteins. A–B) RNA pulldown of APAL in MCF7 cells followed by mass spectrometry (MS) identifications. Specific bands on the sodium dodecyl sulfate-polyacrylamide gel electrophoresis gel of proteins bound to APAL or negative control (NC) (lacZ messenger RNA [mRNA]) were identified by mass spectrometry, and the number of detected peptides for candidate proteins is shown in B. C–L) Effects of silencing candidate genes on cisplatin-induced apoptosis in MDA-MB-231. Each candidate gene was silenced by two small interfering RNAs in vector or APAL overexpressing-MDA-MB-231 cells, with the knockdown efficiency measured by quantitative reverse transcriptase-polymerase chain reaction (qRT-PCR). Apoptotic cells were stained by annexin V/propidium iodide and analyzed by flow cytometry. M) RNA pulldown of APAL with PLK1 and Aurora A in MCF7 cells. RNA pulldown assay was performed using APAL or lacZ messenger RNA (mRNA) followed by immunoblot detection of PLK1 and Aurora A. N–O) RNA immunoprecipitation (IP) of PLK1 and Aurora A in MCF7 cells. APAL was retrieved by HA-PLK1 (N) or Flag-Aurora A (O) IP, compared with immunoglobulin (IgG), as detected by qRT-PCR in MCF7 cells. Bar graphs represent means ±SD of experimental triplicates. See also Supplementary Figure 3 (available online). HA = hemagglutinin.
Given that Aurora A was a kinase of PLK1, we hypothesized that APAL may link PLK1 (55–70 kDa) to its kinase, Aurora A (35–55 kDa), to enhance their interaction. RNA pulldown in MCF7 with biotin-labeled APAL followed by immunoblot confirmed the interaction of APAL with PLK1 and Aurora A, but not with unrelated proteins HSP90 (Figure 6M). We then performed RNA immunoprecipitation in MCF7 using hemagglutinin (HA) or Flag-tagged antibodies against HA-PLK1 or Flag-Aurora A and revealed profound enrichment of APAL with HA or Flag antibodies as compared with the immunoglobulin G control (Figure 6, N and O). These data suggest that APAL specifically binds to PLK1 and Aurora A.
The Mechanism of APAL-Regulated PLK1 Phosphorylation
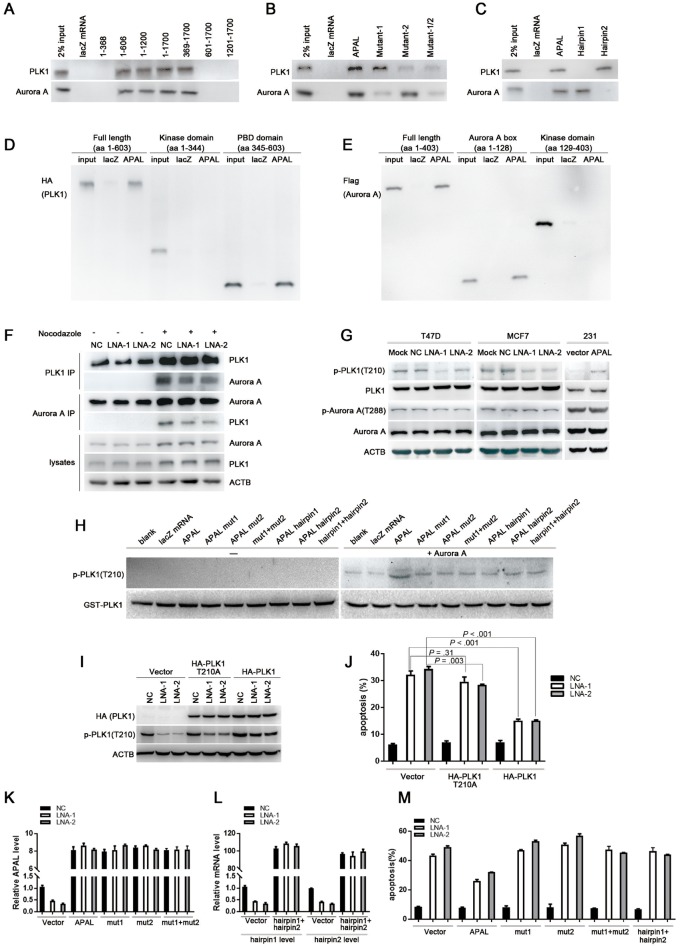
We generated a series of truncated segments of APAL and found that nucleotides (nt) 369–606 in APAL were indispensable for the interaction with either PLK1 or Aurora A in MCF7 (Figure 7A). RNA structure software Mfold (27) and RNAfold (28) independently predicted two hairpins within nt 369–606 (Supplementary Figure 4, A and B, available online), so we generated APAL mutants by deleting hairpin 1 (mut1) or hairpin 2 (mut2). Mut1 and mut2 abolished interaction of APAL with PLK1 and Aurora A, respectively (Figure 7B). RNA pulldown using the synthesized biotinylated hairpins demonstrated that hairpin 2 (nt 427–520) bound to PLK1, and hairpin 1 (nt 521–639) bound to Aurora A, respectively (Figure 7C). Moreover, biotinylated APAL preferentially retrieved the polo-box domain of PLK1 and the Aurora A box domain of Aurora A in MCF7 (Figure 7, D and E), suggesting that APAL linked up PLK1 and Aurora A without interfering with their kinase domains.
Figure 7.
The role of Aurora A/PLK1–associated long noncoding RNAs (APAL in regulating the phosphorylation of PLK1 by Aurora A. A–C) RNA pulldown assay determines the hairpins in APAL interacting with PLK1 and Aurora A in MCF7 cells. RNAs corresponding to different fragments of APAL (A), mutation of each hairpin (B), or synthesized hairpins (C) were used to pull down PLK1 and Aurora A, as detected by immunoblot. D) The interaction of APAL with PLK1 domains. MCF7 cells were transfected with HA-PLK1 full length, or kinase domain, or polo-box domain. RNA pulldown assay was performed using APAL or lacZ messenger RNA (mRNA), followed by immunoblot detection of HA (PLK1). E) The interaction of APAL with Aurora A domains. MCF7 cells were transfected with Flag-Aurora A full length, Aurora A box, or kinase domain. RNA pulldown assay was performed using APAL or lacZ mRNA followed by immunoblot detection of Flag (Aurora A). F) The effect of silencing APAL on the interaction between PLK1 and Aurora A. T47D cells were treated with 100 ng per mL nocodazole for 16 hours to increase the expression and interaction of PLK1 and Aurora A. G) The effect of altering APAL expression on PLK1 phosphorylation. APAL was knocked down by locked nucleic acid (LNA) in T47D and MCF7 cells or overexpressed in MDA-MB-231. Total and phospho-PLK1 or Aurora A were detected by immunoblots. H) In vitro kinase assay of PLK1 phosphorylation using recombinant Aurora A and GST-PLK1. I–J) The effect of PLK1and PLK1-210A on apoptosis induced by APAL LNAs. MCF7 cells were transfected with negative control (NC) or APAL LNAs and then 8 hours later transfected with wild-type or mutant HA-PLK1. Apoptosis was detected by annexin V/propidium iodide (PI) staining and flow cytometry analysis. K–M) The effect of full-length APAL, mutants, or hairpins on apoptosis induced by APAL LNAs. MCF7 cells were transfected with NC or APAL LNAs and then 8 hours later transfected with full-length APAL, mutants, or hairpins. Apoptosis was detected by annexin V/PI staining and flow cytometry analysis. Graphs represent means ±SD of experimental triplicates. See also Supplementary Figure 4 (available online).
Furthermore, we evaluated whether APAL enhanced the interaction of PLK1 and Aurora A. We synchronized T47D and enriched the mitotic cells with peak expression of PLK1 and Aurora A and found silencing APAL reduced the association of PLK1 with Aurora A, as assayed by reciprocal immunoprecipitation (Figure 7F).
Then we examined whether APAL affected Aurora A-mediated PLK1 phosphorylation. APAL knockdown inhibited PLK1 phosphorylation at T210 in T47D and MCF7, whereas APAL overexpression enhanced PLK1 phosphorylation in MDA-MB-231 (Figure 7G). Aurora A phosphorylation at T288 was not affected upon altering APAL expression (Figure 7G), suggesting that APAL enhanced PLK1 activation without affecting Aurora A activity.
Next, we employed the in vitro kinase assay and found active recombinant Aurora A phosphorylated PLK1 at T210 at a relatively low rate, whereas addition of APAL, but not the control lacZ mRNA, enhanced the phosphorylating efficiency of Aurora A toward PLK1 (Figure 7H). Intriguingly, addition of mut1 or mut2, and hairpin 1 or 2, individually or in combination, failed to enhance PLK1 phosphorylation (Figure 7H), suggesting that APAL harboring both hairpins that interacted with PLK1 and Aurora A served as a scaffold to bind the two proteins together, thereby promoting efficient phosphorylation of PLK1 by Aurora A.
Additionally, ectopic expression of HA-PLK1 could rescue the effects of APAL knockdown by reducing the apoptosis in MCF7, whereas vector control or non phosphorylatable PLK1 mutant (T210A) was unable to reverse the phenotype (Figure 7, I and J; Supplementary Figure 4C, available online). Moreover, we employed APAL mutants or the lncRNA segments of hairpins for the rescue experiments. Although ectopic expression of the full-length APAL partially reversed the apoptosis of MCF-7 induced by APAL-LNAs (Figure 7, K and M;Supplementary Figure 4D, available online), enforced expression of the APAL mutants or combined transfection of the vectors expressing hairpin 1 and 2, respectively, could not rescue the apoptosis (Figure 7, L and M;Supplementary Figure 4D, available online). Therefore, our data demonstrate that APAL prevents tumor cells from apoptosis by enhancing Aurora A-mediated PLK1 activation.
Therapeutic Effects of Targeting APAL in Cancer Xenografts and Patient-Derived Organoids
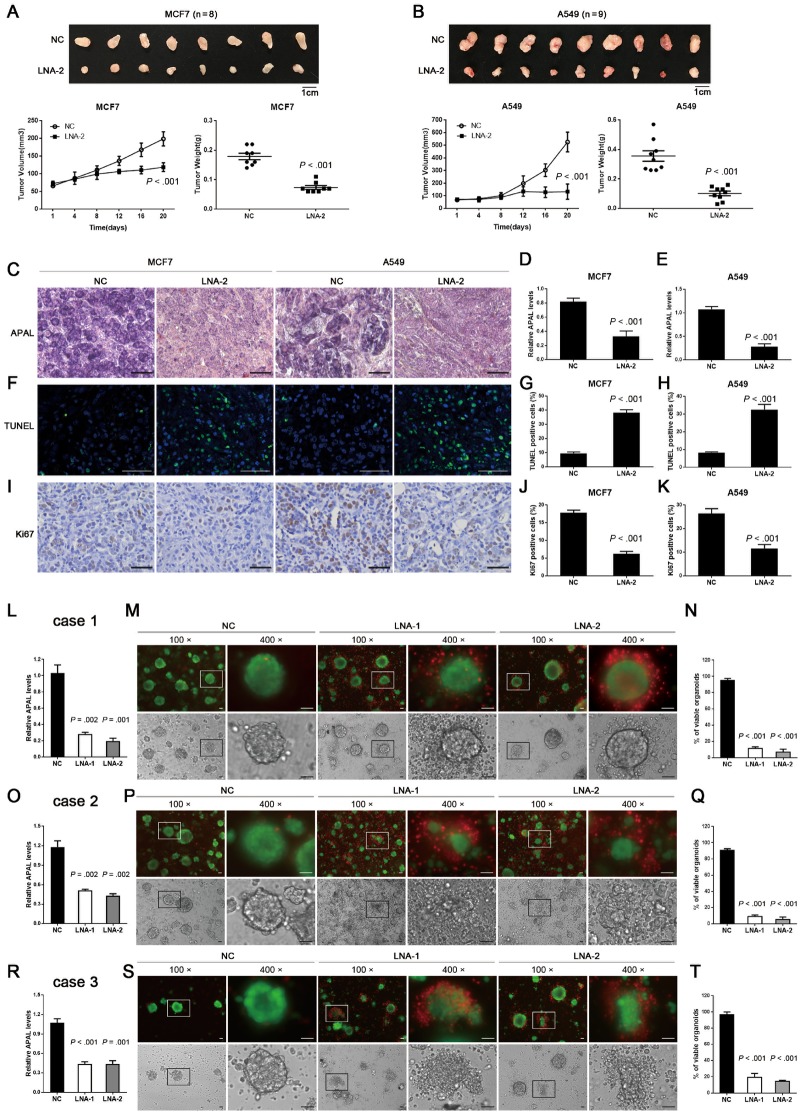
To evaluate the therapeutic potential of targeting APAL in vivo, we injected MCF-7 breast cancer cells or A549 lung cancer cells subcutaneously in nude mice. Tumor growth both of MCF-7 and A549 xenografts was statistically significantly suppressed upon intraperitoneal injection of APAL LNA, whereas the mice treated with control LNAs continued to form large tumors (mean [SD] of tumor weights, control vs APAL LNA was 0.18 [0.03] vs 0.07 [0.02] for MCF-7 xenografts, P < .001, and 0.36 [0.10] vs 0.10 [0.04] for A549 xenografts, P < .001) (Figure 8, A and B). The efficiency of APAL knockdown by LNA injection in vivo was confirmed by ISH and qRT-PCR (Figure 8, C–E). As measured by Ki67 staining and TUNEL assay, targeting APAL in vivo reduced cell proliferation and increased apoptosis of the tumor cells, respectively (Figure 8, F–K).
Figure 8.
Effects of targeting Aurora A/PLK1–associated long noncoding RNAs (APAL) in human tumor xenografts and patient-derived organoids. A–B) Growth curves and tumor weights of MCF7 and A549 xenografts in nude mice treated with locked nucleic acids (LNAs). MCF7 (A) and A549 (B) were injected as xenografts in nude mice. LNAs were injected intraperitoneally after the tumor volumes reached 100 mm3. C) In situ hybridization (ISH) of APAL for MCF7 and A549 xenografts. Representative ISH in paraffin-embedded sections of xenografts in A and B show the knockdown effect of LNA injection. Scale bar = 50 μm. D–E) Quantitative reverse transcriptase-polymerase chain reaction (qRT-PCR) shows the knockdown efficiency of APAL by LNA injection. F–K) Terminal deoxynucleotidyl transferase dUTP nick end labeling assays (F–H) and Ki-67 staining (I–K) in the paraffin-embedded sections of xenografts in A and B. Scale bar = 50 μm. L, O, R) The knockdown efficiency of APAL by LNA transfection was measured by qRT-PCR in three cases of organoids cultured from fresh breast cancer tissues. M, P, S) APAL knockdown causes dramatic cell death in breast cancer organoids. Viable and dead cells were stained by calcein AM (green) and EthD-1 (red), respectively. Scale bar = 50 μm. N, Q, T) Quantification for the percentages of viable organoids. The organoids with less than 10% of cells stained with EthD-1 (red) were counted as viable organoids. Graphs represent means ±SD of experimental triplicates. Two-sided independent sample t test was used to compare APAL LNA and negative control (NC) LNA treatment.
Patient-derived organoids in three-dimensional (3D) cultures have been reported to maintain the molecular and cytological characteristics of primary tumors (29). We performed organoid cultures of three surgically resected breast tumor tissues (Supplementary Table 2, available online). Transfection of LNAs efficiently inhibited APAL expression in organoids (Figure 8, L, O, and R). To measure the viability of tumor cells in organoids, we stained the 3D-organoids with calcein AM for viable cells and EthD-1 for dead cells (30). APAL-LNAs induced massive tumor cell death 48 hours after transfection, whereas organoids treated with control LNA continued to survive (Figure 8, L–T). Together, these data suggest that targeting APAL effectively killed cancer cells and suppressed tumor growth in vivo, which may serve as a novel therapeutic anticancer strategy.
Discussion
Aurora A-mediated activation of PLK1, the central kinase regulating multiple stages of mitosis, is fundamental for PLK1 to exert its oncogenic function in malignant cells (31). Inhibiting PLK1 activities causes mitotic catastrophe and apoptosis in various cancer types, whereas PLK1 inhibition in normal cells does not induce such severe effects because normal cells are not addicted to PLK1 for mitosis as cancer cells are (32). Therefore, PLK1 activation is essential for tumor growth and is the “Achilles heel” of cancer cells. Herein, we have identified that Aurora A-mediated PLK1 activation is tightly regulated by an lncRNA, APAL. To our knowledge, APAL is the first reported lncRNA that regulates PLK1 activation involved in mitotic catastrophe. Although proteins such as Bora, Fry, AIBp, and Gravin were shown to interact with Aurora A and PLK1, which may affect PLK1 activity (33–36), these proteins seem not to be able to maintain continuous phosphorylation of PLK1-T210 (33), whereas by specifically interacting with PLK1 and Aurora A, APAL plays an indispensable role in promoting and maintaining PLK1 activities in cancer cells. These findings not only broaden the regulatory mechanisms for PLK1 activation but also contribute to a growing appreciation that a major class of lncRNAs exerts their functions by interacting with signaling proteins to induce their posttranslational modification [4).
LncRNAs have emerged as valuable biomarkers and important drug targets for cancer (4,37). Here, publicized datasets and our own cancer patient cohorts have shown that APAL expression is generally elevated in breast, lung, prostate, and liver cancers but is relatively low in esophageal and colon cancers, etc. APAL is associated with patient survival as a continuous variable in two of three breast cancer datasets but can serve as a strong dichotomized variable when the X-tile optimized cut-point rather than the median is used to define high and low APAL levels.
As a caveat, the limited sample size of breast cancer patients in the publicized datasets is not sufficient to provide precise estimation for the value of APAL as a survival predictor, especially as a continuous variable. Moreover, further studies are needed to evaluate the appropriate methods for APAL detection as a biomarker for the prognosis of cancer patients. Importantly, APAL knockdown induced dramatic apoptosis only in tumor cells that highly expressed APAL but not the corresponding normal epithelial cells or tumor cells with undetectable APAL expression, which makes APAL a promising therapeutic target for cancers that are addicted to its expression. Recently, therapies designed to target lncRNAs are under intensive investigation. The siRNA- and antisense oligonucleotide (ASOs)-based technologies create realistic optimism for manipulating lncRNA levels in vivo (4). Preclinical investigation has documented the therapeutic efficacy of ASOs targeting the nuclear lncRNA Malat1 in breast cancer (38). In our current study, we used LNAs, which are modified ASOs, to efficiently silence the nucleus-expressing APAL in vivo by episodes of intraperitoneal injection. Although intraperitoneal injection is not commonly used in humans, previous studies have shown that intravenous administration of LNAs is efficient to silence lncRNAs (39). Together, our present study provides a proof of principle that effective anticancer therapy could be potentially achieved by targeting vital lncRNAs for tumor cell survival.
Funding
This work was supported by grants from the National Key Research and Development Program of China (2016YFC1302301), the Natural Science Foundation of China (81490750, 81572890, 81621004, 81720108029, 81802752, 81872370), Guangdong Science and Technology Department (2016B030229004, 2017B030314026), Guangzhou Science Technology and Innovation Commission (201803040015), and Elite Young Scholars Program of Sun Yat-Sen Memorial Hospital (Y201701). The research is partly supported by the Fountain-Valley Life Sciences Fund of the University of Chinese Academy of Sciences Education Foundation.
Notes
The study sponsors played no role in the design of the study; the collection, analysis, and interpretation of the data; the writing of the manuscript; or the decision to submit the manuscript for publication.
We declare no conflict of interest for this article.
Supplementary Material
References
- 1. Fraser A. Essential human genes. Cell Syst. 2015;1(6):381–382. [DOI] [PubMed] [Google Scholar]
- 2. Tsherniak A, Vazquez F, Montgomery PG, et al. Defining a cancer dependency map. Cell. 2017;170(3):564–576; e16. [DOI] [PMC free article] [PubMed] [Google Scholar]
- 3. Torti D, Trusolino L.. Oncogene addiction as a foundational rationale for targeted anti-cancer therapy: promises and perils. EMBO Mol Med. 2011;3(11):623–636. [DOI] [PMC free article] [PubMed] [Google Scholar]
- 4. Schmitt AM, Chang HY.. Long noncoding RNAs in cancer pathways. Cancer Cell. 2016;29(4):452–463. [DOI] [PMC free article] [PubMed] [Google Scholar]
- 5. Camp RL, Dolled-Filhart M, Rimm DL.. X-tile: a new bio-informatics tool for biomarker assessment and outcome-based cut-point optimization. Clin Cancer Res. 2004;10(21):7252–7259. [DOI] [PubMed] [Google Scholar]
- 6. Chen DT, Nasir A, Culhane A, et al. Proliferative genes dominate malignancy-risk gene signature in histologically-normal breast tissue. Breast Cancer Res Treat. 2010;119(2):335–346. [DOI] [PMC free article] [PubMed] [Google Scholar]
- 7. Clarke C, Madden SF, Doolan P, et al. Correlating transcriptional networks to breast cancer survival: a large-scale coexpression analysis. Carcinogenesis. 2013;34(10):2300–2308. [DOI] [PubMed] [Google Scholar]
- 8. Kretschmer C, Sterner-Kock A, Siedentopf F, et al. Identification of early molecular markers for breast cancer. Mol Cancer. 2011;10(1):15.. [DOI] [PMC free article] [PubMed] [Google Scholar]
- 9. Richardson AL, Wang ZC, De Nicolo A, et al. X chromosomal abnormalities in basal-like human breast cancer. Cancer Cell. 2006;9(2):121–132. [DOI] [PubMed] [Google Scholar]
- 10. Kao KJ, Chang KM, Hsu HC, et al. Correlation of microarray-based breast cancer molecular subtypes and clinical outcomes: implications for treatment optimization. BMC Cancer. 2011;11(1):143.. [DOI] [PMC free article] [PubMed] [Google Scholar]
- 11. Guedj M, Marisa L, de Reynies A, et al. A refined molecular taxonomy of breast cancer. Oncogene. 2012;31(9):1196–1206. [DOI] [PMC free article] [PubMed] [Google Scholar]
- 12. Park C, Yu N, Choi I, et al. lncRNAtor: a comprehensive resource for functional investigation of long non-coding RNAs. Bioinformatics. 2014;30(17):2480–2485. [DOI] [PubMed] [Google Scholar]
- 13. Györffy B, Lanczky A, Eklund AC, et al. An online survival analysis tool to rapidly assess the effect of 22,277 genes on breast cancer prognosis using microarray data of 1,809 patients. Breast Cancer Res Treat. 2010;123(3):725–731. [DOI] [PubMed] [Google Scholar]
- 14. Györffy B, Surowiak P, Budczies J, et al. Online survival analysis software to assess the prognostic value of biomarkers using transcriptomic data in non-small-cell lung cancer. PLoS One. 2013;8(12):e82241.. [DOI] [PMC free article] [PubMed] [Google Scholar]
- 15. Gao J, Aksoy BA, Dogrusoz U, et al. Integrative analysis of complex cancer genomics and clinical profiles using the cBioPortal. Sci Signal. 2013;6(269):pl1.. [DOI] [PMC free article] [PubMed] [Google Scholar]
- 16. Curtis C, Shah SP, Chin SF, et al. The genomic and transcriptomic architecture of 2,000 breast tumours reveals novel subgroups. Nature. 2012;486(7403):346–352. [DOI] [PMC free article] [PubMed] [Google Scholar]
- 17. Kong L, Zhang Y, Ye ZQ, et al. CPC: assess the protein-coding potential of transcripts using sequence features and support vector machine. Nucleic Acids Res. 2007;35(Web Server issue):W345–W349. [DOI] [PMC free article] [PubMed] [Google Scholar]
- 18. Wheeler DL, Church DM, Federhen S, et al. Database resources of the National Center for Biotechnology. Nucleic Acids Res. 2003;31(1):28–33. [DOI] [PMC free article] [PubMed] [Google Scholar]
- 19. Lennox KA, Behlke MA.. Cellular localization of long non-coding RNAs affects silencing by RNAi more than by antisense oligonucleotides. Nucleic Acids Res. 2016;44(2):863–877. [DOI] [PMC free article] [PubMed] [Google Scholar]
- 20. Liu B, Sun L, Liu Q, et al. A cytoplasmic NF-kappaB interacting long noncoding RNA blocks IkappaB phosphorylation and suppresses breast cancer metastasis. Cancer Cell. 2015;27(3):370–381. [DOI] [PubMed] [Google Scholar]
- 21. Lin A, Li C, Xing Z, et al. The LINK-A lncRNA activates normoxic HIF1alpha signalling in triple-negative breast cancer. Nat Cell Biol. 2016;18(2):213–224. [DOI] [PMC free article] [PubMed] [Google Scholar]
- 22. Yin QF, Hu SB, Xu YF, et al. SnoVectors for nuclear expression of RNA. Nucleic Acids Res. 2015;43(1):e5.. [DOI] [PMC free article] [PubMed] [Google Scholar]
- 23. Hart T, Chandrashekhar M, Aregger M, et al. High-resolution CRISPR screens reveal fitness genes and genotype-specific cancer liabilities. Cell. 2015;163(6):1515–1526. [DOI] [PubMed] [Google Scholar]
- 24. Marcotte R, Sayad A, Brown KR, et al. Functional genomic landscape of human breast cancer drivers, vulnerabilities, and resistance. Cell. 2016;164(1–2):293–309. [DOI] [PMC free article] [PubMed] [Google Scholar]
- 25. McDonald ER III, de Weck A, Schlabach MR, et al. Project DRIVE: a compendium of cancer dependencies and synthetic lethal relationships uncovered by large-scale, deep RNAi screening. Cell. 2017;170(3):577–592.e10. [DOI] [PubMed] [Google Scholar]
- 26. Strebhardt K. Multifaceted polo-like kinases: drug targets and antitargets for cancer therapy. Nat Rev Drug Discov. 2010;9(8):643–660. [DOI] [PubMed] [Google Scholar]
- 27. Zuker M. Mfold web server for nucleic acid folding and hybridization prediction. Nucleic Acids Res. 2003;31(13):3406–3415. [DOI] [PMC free article] [PubMed] [Google Scholar]
- 28. Denman RB. Using RNAFOLD to predict the activity of small catalytic RNAs. Biotechniques. 1993;15(6):1090–1095. [PubMed] [Google Scholar]
- 29. Shamir ER, Ewald AJ.. Three-dimensional organotypic culture: experimental models of mammalian biology and disease. Nat Rev Mol Cell Biol. 2014;15(10):647–664. [DOI] [PMC free article] [PubMed] [Google Scholar]
- 30. Crasta K, Ganem NJ, Dagher R, et al. DNA breaks and chromosome pulverization from errors in mitosis. Nature. 2012;482(7383):53–58. [DOI] [PMC free article] [PubMed] [Google Scholar]
- 31. Lens SM, Voest EE, Medema RH.. Shared and separate functions of polo-like kinases and aurora kinases in cancer. Nat Rev Cancer. 2010;10(12):825–841. [DOI] [PubMed] [Google Scholar]
- 32. Christoph DC, Schuler M.. Polo-like kinase 1 inhibitors in mono- and combination therapies: a new strategy for treating malignancies. Expert Rev Anticancer Ther. 2011;11(7):1115–1130. [DOI] [PubMed] [Google Scholar]
- 33. Seki A, Coppinger JA, Jang CY, et al. Bora and the kinase Aurora a cooperatively activate the kinase Plk1 and control mitotic entry. Science. 2008;320(5883):1655–1658. [DOI] [PMC free article] [PubMed] [Google Scholar]
- 34. Chou CH, Loh JK, Yang MC, et al. AIBp regulates mitotic entry and mitotic spindle assembly by controlling activation of both Aurora-A and Plk1. Cell Cycle. 2015;14(17):2764–2776. [DOI] [PMC free article] [PubMed] [Google Scholar]
- 35. Hehnly H, Canton D, Bucko P, et al. A mitotic kinase scaffold depleted in testicular seminomas impacts spindle orientation in germ line stem cells. Elife. 2015;4:e09384. [DOI] [PMC free article] [PubMed] [Google Scholar]
- 36. Ikeda M, Chiba S, Ohashi K, et al. Furry protein promotes aurora A-mediated Polo-like kinase 1 activation. J Biol Chem. 2012;287(33):27670–27681. [DOI] [PMC free article] [PubMed] [Google Scholar]
- 37. Matsui M, Corey DR.. Non-coding RNAs as drug targets. Nat Rev Drug Discov. 2017;16(3):167–179. [DOI] [PMC free article] [PubMed] [Google Scholar]
- 38. Arun G, Diermeier S, Akerman M, et al. Differentiation of mammary tumors and reduction in metastasis upon Malat1 lncRNA loss. Genes Dev. 2016;30(1):34–51. [DOI] [PMC free article] [PubMed] [Google Scholar]
- 39. Leucci E, Vendramin R, Spinazzi M, et al. Melanoma addiction to the long non-coding RNA SAMMSON. Nature. 2016;531(7595):518–522. [DOI] [PubMed] [Google Scholar]
Associated Data
This section collects any data citations, data availability statements, or supplementary materials included in this article.


