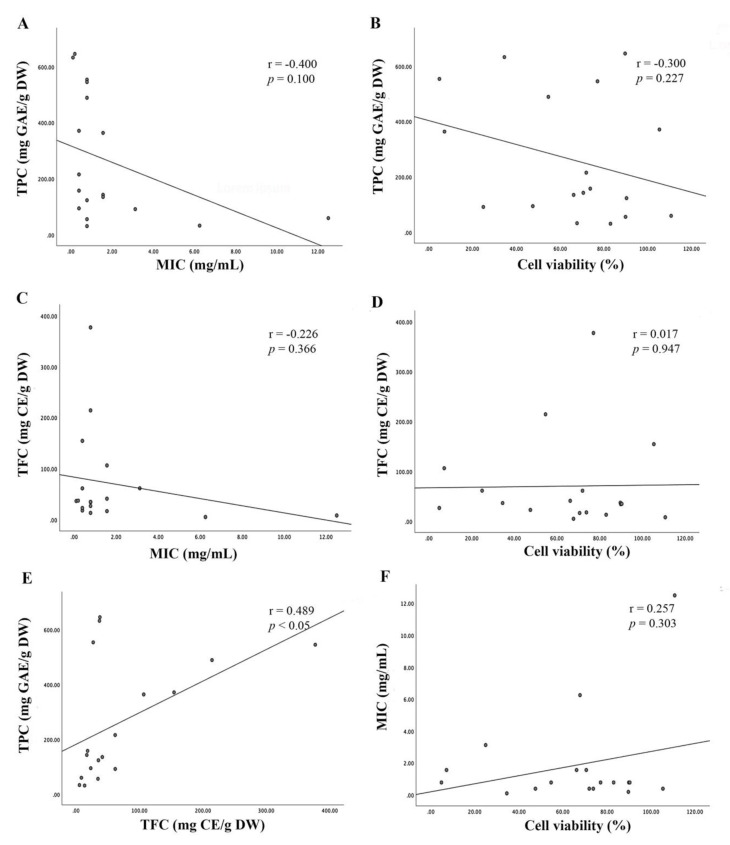
Figure 4.
Pearson correlation analysis. (A) Correlation of total phenolic content (TPC) with minimum inhibitory concentration (MIC). (B) Correlation of TPC with cell viability (%) at 100 µg/mL. (C) Correlation of total flavonoid content (TFC) with MIC. (D) Correlation of TFC with cell viability (%). (E) Correlation of TPC with TFC. (F) Correlation of MIC with cell viability (%).

