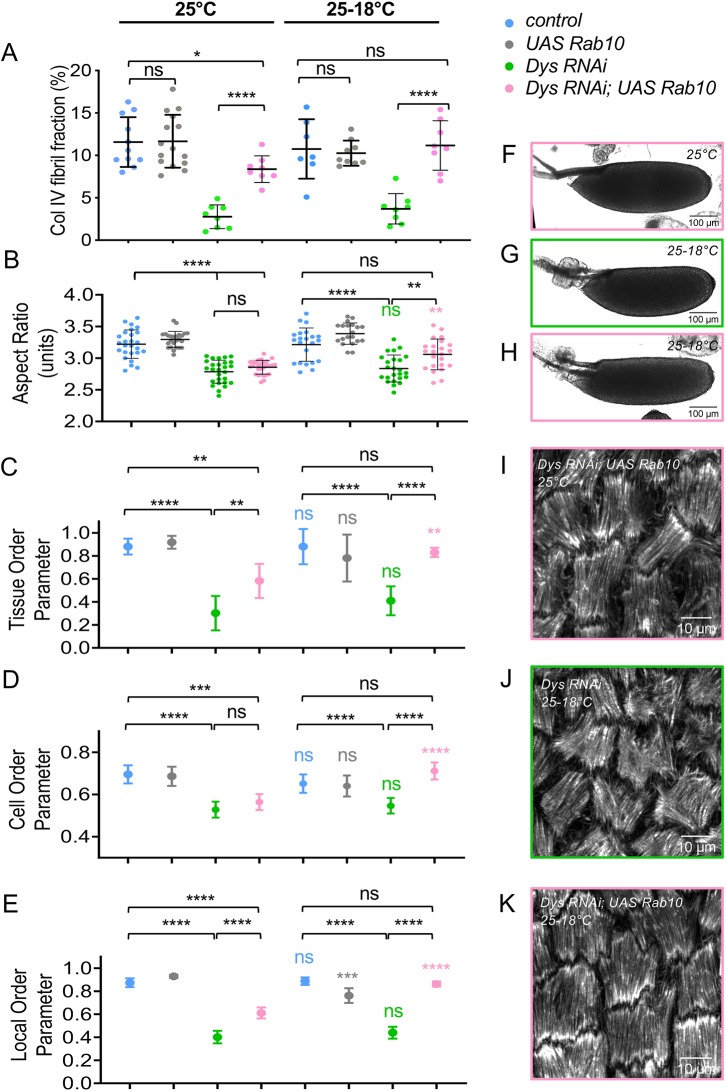
Fig. 7.
BM fibrils provide a cue for DAPC-dependent F-actin orientation. (A) Quantification of the BM fibril fraction at stage 8 for the indicated genotypes at 25°C (n>8). (B-E) For the indicated genotypes, without (25°C) or with (25-18°C) a switch to non-permissive temperature, quantification of the aspect-ratio of mature eggs (B), the Tissue-OP (n>7 follicles) (C), the Cell-OP (D), and the Local-OP at stage 13 (n>45 cells) (E). (A,B) unpaired t-test; (C-E) two-way ANOVA performed, followed by applicable post-hoc pairwise comparisons (Tukey). (F-K) Representative images of mature eggs (F-H) and of stress fibers (I-K) at stage 13 for the indicated genotypes without (25°C) or with (25-18°C) a switch to non-permissive temperature. For all panels, error bars represent s.d.; *P<0.01, **P<0.005, ***P<0.001, ****P<0.0001. Colored asterisks (or ns) correspond to the statistical test for the same genotype between 25°C and 25-18°C conditions. ns, not significant.

