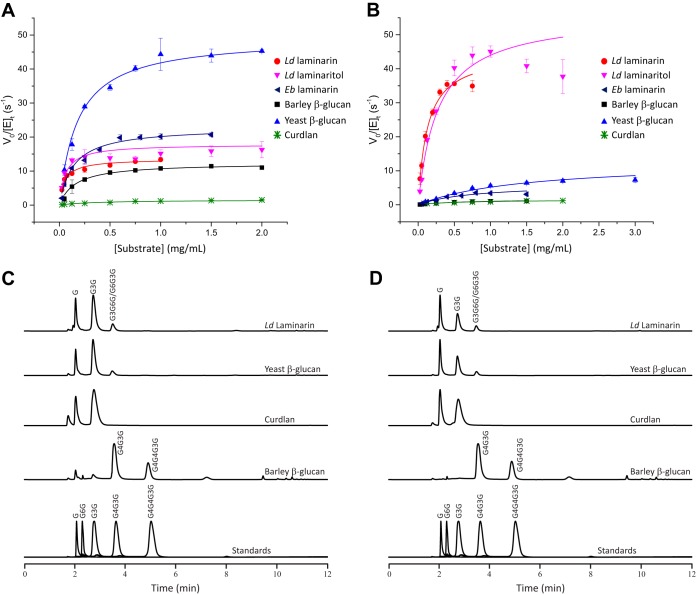
FIG 3.
Hydrolysis of β-glucans by BuGH16 and BuGH158. (A and B) Initial-rate kinetics analysis of BuGH16 (A) and BuGH158 (B). V0/[E]t = initial rate per total enzyme concentration. Curves represent fits of the Michaelis-Menten equation to the average data points (n = 3); error bars represent standard deviations from the means. (C and D) HPAEC-PAD analysis of limit-digest products of BuGH16 (C) and BuGH158 (D) at 37°C.

