

Abstract
Antibody-immobilized AlGaN/GaN high electron mobility transistors (HEMTs) were used to detect a short peptide consisting of 20 amino acids. One-binding-site model and two-binding-site model were used for the analysis of the electrical signals, revealing the number of binding sites on an antibody and the dissociation constants between the antibody and the short peptide. In the binding-site models, the surface coverage ratio of the short peptide on the sensor surface is relevant to the electrical signals resulted from the peptide–antibody binding on the HEMTs. Two binding sites on an antibody were observed and two dissociation constants, 4.404×10⁻¹¹ M and 1.596×10⁻⁹ M, were extracted from the binding-site model through the analysis of the surface coverage ratio of the short peptide on the sensor surface. We have also shown that the conventional method to extract the dissociation constant from the linear regression of curve-fitting with Langmuir isotherm equation may lead to an incorrect information if the receptor has more than one binding site for the ligand. The limit of detection (LOD) of the sensor observed in the experimental result (∼10 pM of the short peptide) is very close to the LOD (around 2.7–3.4 pM) predicted from the value of the smallest dissociation constants. The sensitivity of the sensor is not only dependent on the transistors, but also highly relies on the affinity of the ligand-receptor pair. The results demonstrate that the AlGaN/GaN HEMTs cannot only be used for biosensors, but also for the biological affinity study.
Keywords: GaN, High electron mobility transistors, Binding affinity, Sensors, Dissociation constants
Highlights
► AlGaN/GaN high electron mobility transistors detected a short peptide. ► Antibody immobilized on transistors bind the peptide to form a complex. ► Binding affinity of the complex was studied using binding-site models. ► Dissociation constants and the number of binding sites were revealed.
1. Introduction
There is a great interest and increasing need for studying ligand–receptor binding affinity due to the important role in drug development(Bertucci and Cimitan 2003), ligand selection(Morrill et al. 2003), antibody(Kim et al. 2012) and nuclei acid(Krusinski et al. 2010) developments, and understanding the mechanism of biomolecular interactions as well(Bertucci and Cimitan 2003; Kim et al. 2012; Krusinski et al. 2010; Morrill et al. 2003). A variety of methods have been developed for characterizing ligand–receptor interactions such as enzyme-linked immunosorbent assay (ELISA)(Orosz and Ovadi 2002), isothermal titration calorimetry (ITC)(Chiad et al. 2009), ultra-violet/visible light (UV/VIS) spectrum(del Toro et al. 2008), surface plasmon resonance (SPR)(Homola 2008), surface acoustic wave devices (SAW)(Dragusanu et al., 2010, Mitsakakis and Gizeli, 2011) and quartz crystal microbalance (QCM)(Liu et al. 2005). The ELISA(Gochin et al. 2006) and UV/VIS spectrum require probe-labeling (del Toro et al. 2008). ITC usually needs a large sample amount(Jing and Bowser 2011). SPR has led to a commercialized equipment (BIAcore), which has been successfully utilized for ligand–receptor interaction study(Bertucci and Cimitan 2003). However, the commercialized SPR equipment is still expensive and the cost for research is high. On the other hand, biosensors have been successfully used for detecting biomolecules and studying ligand–receptor interactions(Chen et al., 2012, Dragusanu et al., 2010, Lin et al., 2010, Liu et al., 2005, Mitsakakis and Gizeli, 2011, Wang et al., 2005). Field-effect-transistor (FET)-based sensors have advantages such as low-cost, high sensitivity, label-free and real-time detection. Si-nanowire FETs, carbon nanotubes and graphene-based FETs have been used to find out the dissociation constants for protein–protein interaction by using Langmuir equation for a one-binding site model(Chen et al., 2012, Lin et al., 2010, Wang et al., 2005). However, a receptor may have more than one binding site. It is very important to identify the number of binding sites on the receptor and the dissociation constants between the receptor and ligands at different binding sites. To the best of our knowledge, FET sensors have not yet been used for identifying the number of binding sites on a receptor and the dissociation constants of the receptor–ligand complex, simultaneously.
Among various FET sensors, AlGaN/GaN HEMT-based sensors have been demonstrated for gas, chemical, and bio-sensing applications(Chen et al. 2008b; Kang et al. 2007; Pearton et al. 2010; Wang et al. 2008; Yu et al. 2008). GaN-based materials are chemically stable, biocompatible, and also stable in high temperature. Reliable detections of biological agents in real-time have been proved by using AlGaN/GaN HEMT-based biosensors (Chen et al. 2008a; Chu et al. 2008; Kang et al. 2005; Pearton et al. 2010; Wang et al. 2009). These sensors only need a small quantity of samples and have small sizes with low manufacturing costs, thanks to the matured semiconductor microfabrication technique.
In this study, anti-ferritin heavy chain (FHC) antibodies were immobilized on the AlGaN/GaN HEMTs for detecting the antigen (a short peptide). One-binding-site model and two-binding-site model were fitted with experimental results in the analysis of the surface coverage ratio. The surface coverage ratio is defined as the ratio of the amount of peptide–antibody complexes to that of the total antibodies immobilized on a transistor. The analysis of the surface coverage ratio reveals how many binding sites a ligand/receptor system may have and what the dissociation constants are at different binding sites for that system. Our results show that the sensor cannot only detect the analytes but also can be used to study the binding affinity between ligands and receptors, simultaneously.
2. Experimental
2.1. Fabrication of AlGaN/GaN HEMT devices
The HEMT structure consisted of a 3 μm-thick undoped GaN buffer, 150 Å-thick undoped Al0.25Ga0.75N and 10 Å-thick undoped GaN cap layer. The AlGaN layer was designed to induce high spontaneous polarization, which generated a two-dimensional electron gas beneath the AlGaN layer. The epilayers were grown by metal–organic chemical vapor deposition (MOCVD) on sapphire substrates. Mesa isolation was performed using an Inductively Coupled Plasma (ICP) etching system with Cl2/BCl3 gases under ICP power of 300 W at 2 MHz and a process pressure of 10 m Torr. Ohmic contacts (60×60 μm2) separated with gaps of 30 μm consisted of e-beam deposited Ti/Al/Ni/Au and was annealed at 850 °C, 45 sec under flowing N2. 100 Å-thick gold was deposited on the gate region. Photoresist of 1.8 μm (Shipley S1818) was used to encapsulate the source/drain regions, with only the gate region open to allow the liquid solutions to cross the surface.
2.2. Immobilization of antibodies on HEMTs
1-ethyl-3-(3-N,Ndimethylaminopropyl)-carbodiimide hydrochloride (EDC) was purchased from Sigma-Aldrich. N-hydroxysulfosuccinimide (sulfo-NHS) was purchased from Thermo Fisher Scientific Pierce Biotechnology. 20 mM of EDC and 50 mM of sulfo-NHS were prepared in 2-(morpholino)ethanesulfonic acid (MES) buffer solution consisting of 10 mM of 6-Mercaptohexanoic acid at pH=5 and allowed 15 min to react thoroughly at room temperature. The mixture was then titrated to increase pH value to 7.4. The anti-ferritin heavy chain (FHC) antibody purchased from Santa Cruz Biotechnology Inc. (cat. #sc-14416) was then added into the mixture and allowed 2 h to react at room temperature. Tris(2-carboxyethyl)phosphine hydrochloride (TCEP) purchased from Sigma-Aldrich (cat. #C4706) was then added into the antibody-containing mixture, and then allowed for 2 h to react. 100 mM of TCEP and 1 mM of 6-Mercaptohexanoic acid were prepared in the final mixture. The HEMT devices were then submerged into this mixture and stored at 4 °C for 12 h. This resulted in binding of the thiolated-antibody to the gold surface on the gate area of the HEMTs. The HEMTs were then rinsed with Phosphate buffered saline (PBS), followed by being submerged in bovine serum albumin (BSA) solution for 3 h for surface blocking. After incubation, the sensor was thoroughly rinsed off with PBS and dried by a nitrogen blower. Fig. 1(a) and (b) show the schematics of the antibody-immobilized AlGaN/GaN HEMT sensor and the plan-view microphotograph of the device, respectively.
Fig. 1.

(a) Schematic of the AlGaN/GaN HEMT sensor. The Au-coated gate area was functionalized with FHC antibodies (b) plan-view microphotograph of a completed device.
2.3. Sensor measurements
The characteristics of source-drain current–voltage of the sensor was measured at 20 °C using an Agilent B1500 parameter analyzer with the gate region exposed. The source-drain bias was fixed at 0.5 V. The antigen, a short peptide, consisting of 20 amino acids was purchased from Santa Cruz Biotechnology Inc. (cat. #sc-14416 P). This peptide can specifically bind to the FHC antibody. Different concentrations of the peptides were sequentially dropped on the sensor in a real-time detection. A background test was also conducted with different concentrations of the short peptide at a constant bias of 0.5 V. The chip for the background test was processed with the similar surface modification procedure (6-Mercaptohexanoic acid immobilized and BSA blocking) with the real sensor but no antibodies were immobilized on the chip.
3. Results and discussion
Fig. 2(a) shows the real time detection of the peptide at constant bias of 500 mV for the sensor. 0.1 fold of PBS solution at pH=7.4 was initially dropped on the sensor. When an additional PBS solution was added on the sensor, an abrupt deep peak appeared and then quickly recovered to the baseline. This abrupt peak occurred due to the mechanical disturbance resulted from dropping the PBS droplet with a micropipette by hands. After the current went back to the original baseline, there was no net current change observed around 100 s. When the target concentration of 0.5 pM of the peptide was dropped onto the surface of the gate area, there was no significant current change. In sharp contrast, when the target concentration of 5 pM of the peptide was added, a clear current change was observed as the system reached a steady state. Real-time current monitoring spanned the range of target concentrations from 0.5 pM to 5 μM of the peptide. Upon these target concentrations of the peptide, the 50 pM gave a most significant current change. The current change gradually saturated as the peptide concentration increased. Eventually, no more current change increase was observed at high concentration of the peptide, as shown in Fig. 2(a). The background test (control experiment) was conducted with different concentrations of the short peptide showing no significant current change which demonstrated that there was no any non-specific binding on the chip, as shown in Fig. 2(b). Therefore, the signals generated from the sensors were attributed to the specific antibody–antigen interaction. Fig. 3(a) and (b) show the current change versus the target concentration of the peptide in linear scale and in log scale, respectively. From Fig. 3(b), the limit of detection of this sensor was estimated about 10 pM of the peptide in the buffer solution.
Fig. 2.
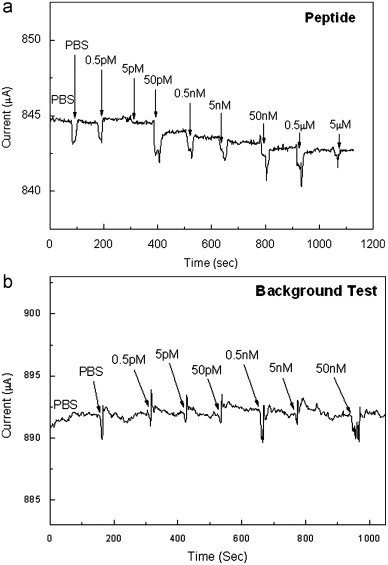
(a) Real-time detection of the peptide from 0.5 pM to 5 μM at a constant bias of 500 mV. (b) The background test (control experiment) with different concentrations of the peptide at a constant bias of 500 mV.
Fig. 3.

The current change versus the peptide target concentration (a) in linear scale and; (b) in log scale.
The chemical reaction for the surface-immobilized receptor (antibody) and the free ligand (antigen: the peptide) in bulk solution can be expressed as the following equations.
| (1) |
| (2) |
where K is the equilibrium constant for formula (1), K A is the association constant, and K D is the dissociation constant. [Ab] is the concentration of the unbound antibody immobilized on the sensor surface. [Ag] is the antigen concentration in the bulk solution. [AbAg] is the concentration of the antibody–antigen complex on the sensor surface.
To estimate the dissociation constant, the Langmuir isotherm equation was used to extract the dissociation constant. Here the current changes were introduced to the Langmuir equation for calculating the dissociation constant.
| (3) |
where ΔI is the current change at the bulk concentration of antigen [Ag], and is the saturated current change.
The dissociate constant can be extracted from the linear regression by using eq. (3), as shown in Fig. 4(a). The y-axis and the x-axis are [Ag]/ΔI and [Ag], respectively. The slope and the y-intercept are and , respectively. The line-fitting shown in Fig. 4 gives a very good linear regression correlation coefficient (r 2=0.99992). The extracted maximum current change was about 1.91 μA, which is very close to the experimental observed one, 1.90 μA. The extracted dissociation constant was obtained as 1.37×10⁻⁹M, which is also in the reasonable range for most IGg antibody–antigen complexes(Dragusanu et al., 2010, Kim et al., 2012, Mitsakakis and Gizeli, 2011).
Fig. 4.

(a) [Ag]/ΔI versus [Ag] and the dissociation constant extracted from the linear regression using Langmuir adsorption isotherm; (b) Surface coverage ratio as a function of the antigen concentration calculated with the dissociation constant extracted from Fig. 4a. The from the experiment are shown as dots versus the antigen concentration.
The Langmuir equation shown in eq. (3) can be rearranged as the following expression.
| (4) |
The right-hand side of the eq. (4) is equal to the ratio of antibody–antigen complex concentration [Ab−Ag] to the total antibody concentration . Here this ratio is defined as the surface coverage ratio α, as shown in eq. (5).
| (5) |
Here the total antibody concentration is the sum of the unbound antibody concentration and the antibody–antigen complex concentration. The equation is shown as .
Fig. 4(b) shows the curve of surface coverage ratio from eq. (5) using the dissociation constant extracted from Fig. 4(a) and the obtained from the experimental results shown as dots versus the antigen concentration in log scale. It is obvious that the curve of the surface coverage ratio does not match well with those experimental dots. From eq. (5), it is shown that the surface coverage ratio actually depends on the ratio of dissociation constant to the concentration of antigen, that is K D/[Ag]. When K D equals to 10 folds or 10% of [Ag], the surface coverage ratio goes to around 9.09% and 90.91%, respectively. Beyond 90.91% or below 9.09% of the surface coverage ratio, increasing or decreasing the concentration of antigen does not change the surface coverage ratio much. Therefore, we conclude that for a one binding-site model, the most significant change of the surface coverage ratio is within the range of the antigen concentration between one order higher and one order lower than the value of the dissociation constant. This was also shown by experimental data in literature(Maehashi et al. 2009). Thus, ideally once the dissociation constant is determined, the highest sensitivity for the sensor is only within this two-order range of antigen concentration. On the other hand, for any experimental result, the surface coverage ratio between 9.09% and 90.91% should only cover two orders of antigen concentration for an ideal one-binding site model. However, in Fig. 4(b), it is significant that between 9.09% and 90.91% of the surface coverage, the experimental data points cover almost 4 orders of the antigen concentration. Therefore, it is not possible to fit these experimental points well into the surface coverage ratio with the one-binding site model. The wide range of the antigen concentration within that coverage ratio (9.09–90.91%) may be resulted from multiple binding-sites of the receptor. Compared with Fig. 4(a) and (b) is clearly more sensitive to see whether the model using the extracted dissociation constant can really fit into the experimental data. Thus, the surface coverage ratio versus the antigen concentration will be used for finding out the number of binding sites and the associated dissociation constants. Here a two-binding-site model is proposed as the following.
In the two-binding-site model, the chemical equations are described as below,
| (6) |
| (7) |
where the K D1 and K D2 are the dissociation constants for the two binding sites on a receptor. The total current change is assumed to be the sum of the current change resulted from antibody–antigen complex at site 1 and at site 2, respectively, as shown in eqs. (8), (9).
| (8) |
| (9) |
| (10) |
where α 1 and α 2 are the surface coverage ratio at site 1 and site 2 of the antibody. If we assume antigens bind at the two different binding sites of an antibody equally affect the conductance of the transistor, it is quite reasonable to allow . Then the total surface coverage ratio α can be expressed as the average of the two individual ones (α1 and α2) at the two binding sites as shown in eq. (11). We then fit this two-binding-site model into the experimental data points to find out the two dissociation constants, K D1 and K D2.
| (11) |
Fig. 5(a) shows the average surface coverage ratio with error bars (standard deviation) from three measurements versus the antigen concentration. The model and the experimental data points perfectly fit together. The K D1 and K D2 are 4.404×10⁻¹¹ M and 1.596×10⁻⁹ M, respectively. The correlation coefficient, r 2 is 0.9948. These two binding constants are in a reasonable range of regular antibody–antigen binding constants(Kim et al., 2012, Mitsakakis and Gizeli, 2011). The antigen, the peptide, consisting of only 20 amino acids is pretty small and the antibody is allowed to bind two antigens on its two binding sites. Because the two binding sites of an antibody are usually regarded as identical structures, the site 1 and site 2 in this reaction should not be recognized as two different sites. Instead, they are more preferably regarded as the binding sequence with the antigens. The difference between these two dissociation constants is probably ascribed to the stereo hindrance resulted from the first antigen–antibody complex for the second one. It may be arguing that whether the assumption of equal maximum current changes for the two binding complexes is appropriate or not. If and are allowed to be variables and eq. (9) is used for the curve fitting (assuming and ), we can get c1=0.6862, c2=0.3079, K D1=7.875×10⁻¹¹ M M, K D2=4.667×10⁻⁹ M and r 2=0.9979. Fig. 5(b) shows the average surface coverage ratios derived from this non-equal maximum current changes for the two binding complexes. It is widely known that antibodies have two almost identical binding sites, as our experimental results predict. Therefore, this technique is adequate to determine the number of the binding sites of a receptor for its analyte. These two dissociation constants have less than one order of magnitude shift compared with the ones derived from the equal maximum current change for the two binding complexes. What happened if the high sensitivity region covers 5∼6 orders of magnitude? In that case, we may further need to consider a three-binding-site model. Now when we look back at the detection limit of the sensor, which is between 5–50 pM of the antigen is just consistent with the lower-half high sensitivity region of K D1 (between one order lower and the order of the dissociation constant). This result shows that the AlGaN/GaN HEMTs are still very sensitive in low antigen concentration. However, the detection limit for the antigen of this sensor is not depending on the transistor, but on the affinity of the antibody–antigen complex, that is, depending on its dissociation constant.
Fig. 5.

(a) Average surface coverage ratio as a function of the antigen concentration with equal maximum current changes for the two binding complexes on an antibody (b) Average surface coverage ratio as a function of the antigen concentration with non-equal maximum current changes for the two binding complexes on an antibody.
4. Conclusions
In summary, AlGaN/GaN HEMTs immobilized with antibodies can detect a short peptide consisting of 20 amino acids in a low detection limit (∼10 pM) which is proved to be depending on the dissociation constants between the short peptide and the antibody. It has been found that directly using the conventional linear regression of Langmuir isotherm equation to extract the dissociation constant may lead to incorrect dissociation constants due to ignoring the number of binding sites on the receptor for the ligand. Instead, through the analysis of surface coverage ratio versus the ligand concentration in the binding-site model, the number of binding sites of a receptor and the dissociation constants can be determined. In this study, two binding sites of the FHC antibody are predicted and two dissociation constants, 4.404×10⁻¹¹ M and 1.596×10⁻⁹ M, are extracted by the analysis of experimental results with the binding-site model. The AlGaN/GaN HEMTs and the analysis of the surface coverage ratio are demonstrated to be good tools for the biological affinity study. Our future works will be utilizing this platform to study DNA–protein and protein–drug interactions such as the applications for DNA-SARS (severe acute respiratory syndrome) virus protein package and HIV (human immunodeficiency virus) drug development. Another future work is the advance toward to the binding-site models for different ligands competing with one another for the same receptors on our HEMT-based sensors.
Acknowledgments
This work was partially supported by National Science Council grant (No.99B20495A) and by the research grant (100N2049E1) at National Tsing Hua University. We thank Dr. Jen-Inn Chyi and Dr. Hui-Teng Cheng for providing us the AlGaN/GaN epi wafers and the antibody, respectively, and for consulting as well.
Footnotes
Supplementary data associated with this article can be found in the online version at 10.1016/j.bios.2012.09.066
Appendix A. Supplementary materials
Supplementary data
References
- Bertucci C., Cimitan S. Journal of Pharmaceutical and Biomedical Analysis. 2003;32(4-5):707–714. doi: 10.1016/s0731-7085(03)00178-x. [DOI] [PubMed] [Google Scholar]
- Chen K.H., Kang B.S., Wang H.T., Lele T.P., Ren F., Wang Y.L., Chang C.Y., Pearton S.J., Dennis D.M., Johnson J.W., Rajagopal P., Roberts J.C., Piner E.L., Linthicum K.J. Applied Physics Letters. 2008;92(19):192103. [Google Scholar]
- Chen K.H., Wang H.W., Kang B.S., Chang C.Y., Wang Y.L., Lele T.P., Ren F., Pearton S.J., Dabiran A., Osinsky A., Chow P.R. Sensors and Actuators B-Chemical. 2008;134(2):386–389. [Google Scholar]
- Chen Y.N., Vedala H., Kotchey G.P., Audfray A., Cecioni S., Imberty A., Vidal S., Star A. ACS Nano. 2012;6(1):760–770. doi: 10.1021/nn2042384. [DOI] [PMC free article] [PubMed] [Google Scholar]
- Chiad K., Stelzig S.H., Gropeanu R., Weil T., Klapper M., Mullen K. Macromolecules. 2009;42(19):7545–7552. [Google Scholar]
- Chu B.H., Kang B.S., Ren F., Chang C.Y., Wang Y.L., Pearton S.J., Glushakov A.V., Dennis D.M., Johnson J.W., Rajagopal P., Roberts J.C., Piner E.L., Linthicum K.J. Applied Physics Letters. 2008;93(4):042114. [Google Scholar]
- del Toro M., Gargallo R., Eritja R., Jaumot J. Analytical Biochemistry. 2008;379(1):8–15. doi: 10.1016/j.ab.2008.04.044. [DOI] [PubMed] [Google Scholar]
- Dragusanu M., Petre B.A., Slamnoiu S., Vlad C., Tu T.T., Przybylski M. Journal of the American Society for Mass Spectrometry. 2010;21(10):1643–1648. doi: 10.1016/j.jasms.2010.06.011. [DOI] [PubMed] [Google Scholar]
- Gochin M., Savage R., Hinckley S., Cai L.F. Biological Chemistry. 2006;387(4):477–483. doi: 10.1515/BC.2006.063. [DOI] [PMC free article] [PubMed] [Google Scholar]
- Homola J. Chemical Reviews. 2008;108(2):462–493. doi: 10.1021/cr068107d. [DOI] [PubMed] [Google Scholar]
- Jing M., Bowser M.T. Analytica Chimica Acta. 2011;686(1-2):9–18. doi: 10.1016/j.aca.2010.10.032. [DOI] [PMC free article] [PubMed] [Google Scholar]
- Kang B.S., Ren F., Wang L., Lofton C., Tan W.H.W., Pearton S.J., Dabiran A., Osinsky A., Chow P.P. Applied Physics Letters. 2005;87(2):023508. [Google Scholar]
- Kang B.S., Wang H.T., Ren F., Pearton S.J., Morey T.E., Dennis D.M., Johnson J.W., Rajagopal P., Roberts J.C., Piner E.L., Linthicum K.J. Applied Physics Letters. 2007;91(25):252103. [Google Scholar]
- Kim D.H., Seo S.M., Paek S.H., Lim G.S. Analytical Biochemistry. 2012;420(1):54–60. doi: 10.1016/j.ab.2011.09.006. [DOI] [PubMed] [Google Scholar]
- Krusinski T., Ozyhar A., Dobryszycki P. Nucleic Acids Research. 2010;38:9. doi: 10.1093/nar/gkq049. [DOI] [PMC free article] [PubMed] [Google Scholar]
- Lin T.W., Hsieh P.J., Lin C.L., Fang Y.Y., Yang J.X., Tsai C.C., Chiang P.L., Pan C.Y., Chen Y.T. Proceedings of the National Academy of Sciences, USA. 2010;107(3):1047–1052. doi: 10.1073/pnas.0910243107. [DOI] [PMC free article] [PubMed] [Google Scholar]
- Liu Y., Tang X.L., Liu F., Li K. Analytical Chemistry. 2005;77(13):4248–4256. doi: 10.1021/ac050026e. [DOI] [PubMed] [Google Scholar]
- Maehashi K., Matsumoto K., Takamura Y., Tamiya E. Electroanalysis. 2009;21(11):1285–1290. [Google Scholar]
- Mitsakakis K., Gizeli E. Biosensors and Bioelectronics. 2011;26(11):4579–4584. doi: 10.1016/j.bios.2011.05.030. [DOI] [PubMed] [Google Scholar]
- Morrill P.R., Millington R.B., Lowe C.R. Journal of Chromatography B-Analytical Technologies in the Biomedical and Life Sciences. 2003;793(2):229–251. doi: 10.1016/s1570-0232(03)00282-4. [DOI] [PubMed] [Google Scholar]
- Orosz F., Ovadi J. Journal of Immunological Methods. 2002;270(2):155–162. doi: 10.1016/s0022-1759(02)00295-8. [DOI] [PubMed] [Google Scholar]
- Pearton S.J., Ren F., Wang Y.L., Chu B.H., Chen K.H., Chang C.Y., Lim W., Lin J.S., Norton D.P. Progress in Materials Science. 2010;55(1):1–59. [Google Scholar]
- Wang W.U., Chen C., Lin K.H., Fang Y., Lieber C.M. Proceedings of the National Academy of Sciences, USA. 2005;102(9):3208–3212. doi: 10.1073/pnas.0406368102. [DOI] [PMC free article] [PubMed] [Google Scholar]
- Wang Y.L., Chu B.H., Chen K.H., Chang C.Y., Lele T.P., Papadi G., Coleman J.K., Sheppard B.J., Dungen C.F., Pearton S.J., Johnson J.W., Rajagopal P., Roberts J.C., Piner E.L., Linthicum K.J., Ren F. Applied Physics Letters. 2009;94(24):243901. [Google Scholar]
- Wang Y.L., Chu B.H., Chen K.H., Chang C.Y., Lele T.P., Tseng Y., Pearton S.J., Ramage J., Hooten D., Dabiran A., Chow P.P., Ren F. Applied Physics Letters. 2008;93(26):262101. [Google Scholar]
- Yu X., Li C., Low Z.N., Lin J., Anderson T.J., Wang H.T., Ren F., Wang Y.L., Chang C.Y., Pearton S.J., Hsu C.H., Osinsky A., Dabiran A., Chow P., Balaban C., Painter J. Sensors and Actuators B-Chem. 2008;135(1):188–194. [Google Scholar]
Associated Data
This section collects any data citations, data availability statements, or supplementary materials included in this article.
Supplementary Materials
Supplementary data