

ABSTRACT
Efficient migration on adhesive surfaces involves the protrusion of lamellipodial actin networks and their subsequent stabilization by nascent adhesions. The actin-binding protein lamellipodin (Lpd) is thought to play a critical role in lamellipodium protrusion, by delivering Ena/VASP proteins onto the growing plus ends of actin filaments and by interacting with the WAVE regulatory complex, an activator of the Arp2/3 complex, at the leading edge. Using B16-F1 melanoma cell lines, we demonstrate that genetic ablation of Lpd compromises protrusion efficiency and coincident cell migration without altering essential parameters of lamellipodia, including their maximal rate of forward advancement and actin polymerization. We also confirmed lamellipodia and migration phenotypes with CRISPR/Cas9-mediated Lpd knockout Rat2 fibroblasts, excluding cell type-specific effects. Moreover, computer-aided analysis of cell-edge morphodynamics on B16-F1 cell lamellipodia revealed that loss of Lpd correlates with reduced temporal protrusion maintenance as a prerequisite of nascent adhesion formation. We conclude that Lpd optimizes protrusion and nascent adhesion formation by counteracting frequent, chaotic retraction and membrane ruffling.
This article has an associated First Person interview with the first author of the paper.
KEY WORDS: Lamellipodium, VASP, Arp2/3, WAVE regulatory complex
Summary: Genetic ablation of the prominent actin- and VASP-binding protein lamellipodin, combined with software-aided protrusion analysis, uncovers mechanistic insights into its cellular function during cell migration.
INTRODUCTION
The protrusion of lamellipodia and filopodia at the plasma membrane is crucial for various processes, ranging from migration of individual, mesenchymal or tumour cells to neuronal growth cone advance or epithelial zippering during adherens junction formation (Bachir et al., 2017; Omotade et al., 2017; Rottner et al., 2017). Lamellipodin (Lpd), a member of the Mig10/RIAM/Lpd (MRL) family of adaptor proteins, localizes at the edges or tips of protruding lamellipodia and filopodia and interacts with multiple factors involved in the regulation of actin assembly (Coló et al., 2012; Krause and Gautreau, 2014). Lpd supports lamellipodia protrusion and cell migration, to promote cancer cell invasion and neural crest migration. It also supports neuronal morphogenesis, endocytosis and localizes to the interface between Vaccinia virus and their actin tails (Bodo et al., 2017; Boucrot et al., 2015; Carmona et al., 2016; Chan Wah Hak et al., 2018; Hansen and Mullins, 2015; Krause et al., 2004; Law et al., 2013; Vehlow et al., 2013). All these functions are mediated by individual Lpd domains (Fig. S1), but we still need a better understanding of how Lpd functions via its respective binding partners. For example, plasma membrane localization of Lpd is clearly facilitated by its pleckstrin homology (PH) domain, which interacts with phosphatidylinositol 3,4-bisphosphate [PI(3,4)P2] membrane phospholipids (Bae et al., 2014; Krause et al., 2004; Smith et al., 2010a). Nevertheless, actin filament binding through C-terminal sequences lacking the PH domain is necessary and sufficient for Lpd enrichment at the lamellipodium edge (Hansen and Mullins, 2015).
Lpd can regulate lamellipodia formation and cell migration through interactions with the WAVE regulatory complex (WRC) (Law et al., 2013), a potent activator of the Arp2/3 complex (Rottner and Schaks, 2019; Schaks et al., 2018), or with both WRC and Ena/VASP family proteins, depending on the cell system and conditions (Carmona et al., 2016; Krause and Gautreau, 2014; Krause et al., 2004). Lpd binds directly to the SH3 domain of Abl-interacting protein 1 (Abi-1), a WRC subunit, and this interaction is positively regulated by Rac binding to the Ras association (RA) domain of Lpd, as well as by c-Abl- and c-Src-dependent phosphorylation (Law et al., 2013). In contrast, the association between Lpd and Ena/VASP proteins is specifically regulated by Abl proteins, but not by Src family kinases, and occurs through its C-terminal Ena/VASP homology 1 (EVH1)-binding sites (Hansen and Mullins, 2015; Krause et al., 2004; Michael et al., 2010). The potential relevance of this interaction to lamellipodial dynamics is supported by the prominent accumulation of both Lpd and Ena/VASP proteins at the edges of protruding lamellipodia (Hansen and Mullins, 2015; Krause et al., 2004; Rottner et al., 1999a). Mechanistically, the actin filament-binding activity of Lpd, which can occur independently of Ena/VASP binding, was proposed to tether the latter to growing plus ends, thereby increasing their processive polymerase activity (Hansen and Mullins, 2015).
Lpd promotes migration processes in diverse developmental processes, ranging from neural crest-derived melanoblast migration in mice to border cell migration in Drosophila (Law et al., 2013). Through its Ena/VASP and WRC interactions, Lpd also increases cancer cell invasion, and its increased expression in breast cancer samples correlates with poor patient prognosis (Carmona et al., 2016). At a cellular level, Lpd overexpression increases the speed of lamellipodia protrusion, while its knockdown by RNA interference (RNAi) or conditional genetic knockout impairs their formation (Carmona et al., 2016; Krause et al., 2004; Law et al., 2013). However, the consequences of permanent loss of Lpd function by genetic ablation in growing cell lines has not been studied. Lpd has also been implicated in various additional processes either involving or at least impacting on actin dynamics. These processes include additional types of protrusion, such as those mediating cell-to-cell spreading of pathogenic Listeria monocytogenes (Wang et al., 2015), but also integrin activation through its binding to talin (Lagarrigue et al., 2015; Lee et al., 2009; Watanabe et al., 2008) or the fast endophilin-mediated endocytosis (FEME) pathway (Boucrot et al., 2015; Chan Wah Hak et al., 2018). How Lpd is recruited to and regulated within these distinct subcellular structures remains to be investigated.
In this study, we generated B16-F1 mouse melanoma cell lines genetically disrupted for Lpd by CRISPR/Cas9, to precisely determine the consequences of the complete loss of Lpd function. We also describe a novel cell-edge analysis workflow that employs edge detection via ImageJ with quantitative morphodynamic analysis to retrieve a large number of parameters to describe complex cellular protrusion and retraction phenotypes. Our analysis reveals that, while not essential, Lpd optimizes leading-edge protrusion, but without qualitatively or quantitatively affecting the rates of lamellipodial actin network polymerization. Instead, Lpd loss of function leads to changes in nascent adhesion number and distribution. We conclude that Lpd contributes to the efficiency of cell migration by helping to coordinate actin dynamics with cell-substratum adhesion.
RESULTS
Genetic deletion of Lpd reduces lamellipodial protrusion and rates of migration
To investigate the effects of eliminating Lpd expression on lamellipodial protrusion, we disrupted the Lpd gene in murine B16-F1 melanoma cells using CRISPR/Cas9. Multiple B16-F1 cell clones were isolated from the CRISPR/Cas9 transfection pool, of which three clones were randomly selected for further characterization (termed Lpd KO#3, #8 and #10). Sequences of disrupted alleles present in each clone, including respective stop codon positions, as well as the location of CRISPR/Cas9-induced frameshifts relative to prominent Lpd domains are shown in Fig. S1A–C. Immunoblot analyses with three different antibodies confirmed the absence of Lpd expression in the selected cell lines (Fig. 1A; Fig. S1D,E). Individual clones harboured distinct numbers of disrupted, but no wild-type alleles (Fig. 1B; Fig. S1A,B). Stop codons in disrupted alleles were induced just upstream of the RA domain of Lpd, so a potential truncated protein – if at all present – would be devoid of all major regulatory domains of Lpd (Fig. S1C). Immunofluorescence analysis with an antibody specific for the C-terminus of Lpd revealed that the localization of Lpd at lamellipodia edges seen in wild-type B16-F1 cells (Krause et al., 2004) was absent in the three Lpd gene-disrupted cell lines (Fig. S1F). We also explored the expression of RIAM/PREL1 (also known as APBB1IP), the second member of the MRL family, but, consistent with previous observations (Jenzora et al., 2005), the protein was undetectable by western blotting in B16-F1 wild-type cells in contrast to NIH 3T3 fibroblasts (Fig. S1G). RIAM/PREL1 was also not upregulated in our Lpd-deficient cell lines (Fig. S1H).
Fig. 1.

Lpd deletion in B16-F1 cells reduces rates of lamellipodial protrusion and random migration. (A) Immunoblot analysis using an antibody recognizing the C-terminus of Lpd demonstrates that the Lpd KO #3, #8 and #10 cell lines do not contain detectable levels of the protein. GAPDH represents a loading control. (B) The table summarizes DNA sequencing of the genomic target in Lpd KO#3, #8 and #10 cell lines from at least 20 sequencing reactions each. (C) Kymographs of protruding lamellipodia of B16-F1 wild-type and Lpd KO cells, or either cell type expressing EGFP-Lpd, as indicated over a 5-min interval. (D) Quantitation of average lamellipodial advancement rates using kymography as raw data. (E) Trajectory plots derived from manual tracking of individually migrating cells of the indicated genotypes on laminin. (F) Quantitation of the data shown in E. (G) Mean square displacement over time of B16-F1 control and the Lpd KO pool derived from data in E. All quantified data are displayed as arithmetic means±s.e.m., with asterisks above bars indicating statistically significant differences between designated groups: *P<0.05, n=number of cells analysed.
Interestingly, we observed that lamellipodia were still able to form in the absence of Lpd in our B16-F1 CRISPR/Cas9 KO lines (Fig. S1F, insets, see also below). To assess the impact of the loss of Lpd on lamellipodial dynamics, we initially performed a manual, kymography-based analysis, determining the protrusion and retraction behaviour in B16-F1 wild-type and Lpd KO clones with or without expression of EGFP-Lpd over 5 min (Fig. 1C). This analysis revealed that protrusions were more irregular and less efficient (Fig. 1C,D). Moreover, the reduction of protrusion was fully rescued by expression of EGFP-Lpd (Fig. 1C,D), confirming that the observed phenotypes are only dependent on Lpd. EGFP-Lpd expression in wild-type cells did not increase lamellipodial protrusion rates in a statistically significant manner (Fig. 1D), suggesting that Lpd function in protrusions is saturated in this cell type. Since the efficiency of cell migration is highly dependent on lamellipodia in B16-F1 cells (Dolati et al., 2018; Schaks et al., 2018), we also examined random cell migration of our cell lines on laminin (Movie 1). Individual cell migration trajectory plots and corresponding quantifications revealed a moderate, but statistically significant, reduction in random migration rates in the absence of Lpd (by ∼22%; Fig. 1E,F). This was also reflected by reduced mean square displacement of Lpd KO cells compared to wild-type controls (Fig. 1G). Together, our results reveal that B16-F1 cells lacking Lpd have reduced, but not eliminated, lamellipodia protrusion activity and decreased cell migration efficiency.
To confirm these results in a different cell type and by an alternative, more transient approach, we transfected Rat2 fibroblasts with our CRISPR/Cas9 constructs that also target rat Lpd (Fig. 2A). Rat2 cells constitute the only fibroblasts in our hands lacking detectable levels of RIAM/PREL1 (Jenzora et al., 2005), excluding interference of the latter with any Lpd loss-of-function phenotypes. Interestingly, and although analysed as a bulk population instead of single-cell clones, phenotypes were highly comparable to our results obtained with individually isolated B16-F1 clones. Essentially, the vast majority of Lpd-deficient cells displayed lamellipodia that were indistinguishable in appearance to control cell lamellipodia (Fig. 2B). Moreover, the reduction of random cell migration in the transiently CRISPR/Cas9-treated population compared to controls was also highly reminiscent of what was observed in B16-F1 Lpd KO clones (reduction by ∼14.5%; Fig. 2C,D, compare with Fig. 1E,F).
Fig. 2.

Lpd deletion in Rat2 cells reduces rates of random migration. (A) Immunoblot analysis using an antibody recognizing the C-terminus of Lpd demonstrates that a Rat2 cell population transfected with a CRISPR/Cas9 construct targeting the Lpd gene and selected for puromycin resistance gene expression from the same plasmids (see Materials and Methods) displays hardly detectable Lpd expression (Lpd KO). Cells going through an identical procedure but with non-targeting CRISPR/Cas9 vector were used as a control cell population, and GAPDH was employed as a loading control. (B) Representative images of Rat2 cell populations treated as indicated (control versus Lpd KO) and migrating on laminin, fixed and stained for F-actin with phalloidin. (C) Trajectory plots derived from manual tracking of individually migrating cells on laminin of cell populations as indicated. (D) Quantitation of the data shown in C. (E) Mean square displacement over time of Rat2 control and Lpd KO cell populations derived from data in C. All quantified data are displayed as arithmetic means±s.e.m., with the asterisk above bars indicating statistically significant differences between designated groups: *P<0.05, n=number of cells analysed.
Loss of Lpd induces a shift towards a chaotic lamellipodial phenotype
To uncover the basis for reduced lamellipodial protrusion upon Lpd deletion, we explored lamellipodial protrusion patterns in our B16-F1 cell lines in further detail. Not surprisingly, we observed that, at any given time point, lamellipodial protrusion phenotypes can differ significantly between cells within the same population. Lamellipodial dynamics also display heterogeneous patterns over time, even at the single-cell level (Wang et al., 2018). To deal with the variability inherent in the system and to unambiguously display the heterogeneity in morphodynamic cell-edge behaviours, we used semi-automatic cell-edge tracking in cell lines expressing plasma membrane-targeted CAAX-EGFP. To achieve this, we used an ImageJ-based plug-in called JFilament (Smith et al., 2010b), followed by quantitative analysis of lamellipodial morphodynamics (see Materials and Methods). The spatiotemporal evolution of tracked lamellipodial contours over representative time periods of 2 min reveals there are three basic types of lamellipodial protrusion classes designated as smooth, intermediate and chaotic within B16-F1 control and Lpd knockout (KO) cell populations (Fig. 3A). Lamellipodia corresponding to the smooth phenotype protruded in a steady and persistent manner. Lamellipodia of intermediate phenotype protruded in a fluctuating manner, and chaotic lamellipodia underwent rapid cycles of protrusion and retraction, with the cell edge frequently folding backwards. Velocity and curvature maps allow clear visualization of the spatiotemporal differences of tracked cell edges between the three protrusion classes, with spatial fluctuations in both parameters clearly increasing from smooth to chaotic over time (Fig. 3B,C; Movies 2 and 3).
Fig. 3.

Deletion of Lpd in B16-F1 cells changes the balance between lamellipodial protrusion phenotypes. (A) Illustration of three distinct types of lamellipodial protrusion phenotypes in B16-F1 wild-type cells using computer-aided analyses of cell-edge dynamics. Phenotypes are represented by the spatiotemporal evolution of measured cell-edge contours, with time increasing from blue to red over 120 s. (B) Example velocity maps, representing smooth, intermediate and chaotic lamellipodial phenotypes, as derived by plotting the velocities of individual points into a 2D-coordinate system, with normalized distance of points along the edge on the y-axis and time on the x-axis. Retraction velocities are indicated in blue and protrusion velocities in red (µm/s). (C) Example curvature maps for each protrusion phenotype, as indicated, and individually derived by plotting local curvatures of individual points into a 2D-coordinate system, with normalized distance of points along the edge on the y-axis and time on the x-axis. Concave and convex curvatures are indicated in blue and red, respectively. (D) Quantification of the fraction of cells with the indicated genotypes displaying each lamellipodial phenotype (smooth, intermediate or chaotic). Lpd KO cells represent a pool of the three KO clones.
Since we observed that Lpd KO clones have a reduced average rate of lamellipodial protrusion, we investigated whether the fraction of cells for a given protrusion class is altered compared to controls. Analysis of movies revealed that the fraction of cells with smooth and intermediate protrusions was significantly reduced in Lpd KO cells (>two times for smooth; Fig. 3D), whereas the chaotic class increased by a factor of 3.82 (Fig. 3D; see also Movie 1). These data show there is a clear correlation between Lpd expression and lamellipodial protrusion stability.
Lpd loss impacts on multiple morphodynamic parameters of lamellipodial protrusion
Software-aided, semi-automatic cell-edge tracking and analysis allowed the definition of 20 parameters, 18 of which are separated into groups associated with protrusion-, retraction-, dynamics/velocity- or curvature/geometry-related characteristics of the cell edge (for description of each parameter, see Table S1). The averaged and normalized values of these 20 parameters from B16-F1 wild-type versus Lpd KO cells are provided (for pooled data see Fig. 4 and individual clones Fig. S2). Multiple conclusions can be drawn from reviewing the 20 morphodynamic parameters in Fig. 4. First, a significant reduction in ‘Average Advancement Velocity’ (parameter #1) was observed in the absence of Lpd, confirming the results from our manual, kymograph-based analysis (Fig. 1D). Aside from parameter #1, which considers both protrusion and retraction episodes, we also dissected protrusion and retraction events individually. This analysis indicates that Lpd KO cells display reduced values of some, but not all, protrusion-related parameters, including ‘Effective Protrusion’ (parameter #2; Fig. 4 and Fig. S2). This parameter only considers the rate of lamellipodial protrusion at the measured edge, without retraction, but averaged for the entire duration of acquisition (120 s). Another parameter reduced in a statistically significant manner by loss of Lpd is the ‘Protruding Edge Fraction’ (parameter #3), which reports how many pixels, on average, relative to the analysed periphery are protruding. The reduction in parameters #2 and #3 reveals that lamellipodial protrusion activity in the absence of Lpd is compromised not only by the effective, average rate of protrusion, but also the percentage of cell periphery capable of protruding at any given time. We also found that Lpd KO cells display reduced average velocity during individual protrusion episodes (‘Protrusion Episode Velocity’, parameter #5). The difference in values obtained from this parameter, however, is subtler than for parameters #1 and #2. Furthermore, when maximal protrusion rates are displayed (‘Maximal Velocity during Protrusion’, parameter #6), it becomes evident that Lpd KO cells can transiently reach the same protrusion speed as B16-F1 controls, although this rate is not maintained as efficiently as in the presence of Lpd, explaining reductions observed in protrusion-related parameters #2–5.
Fig. 4.

Morphodynamic analysis of lamellipodial protrusion of B16-F1 control and Lpd KO cells. Parameters characterizing protrusion-, retraction-, dynamics/velocity- or geometry-related characteristics of cell-edge movements in B16-F1 wild-type and Lpd KO cells, as derived from quantitative, morphodynamic analysis of lamellipodial protrusion. Data are represented as arithmetic means±s.e.m. (*P<0.05). In order to facilitate the visualization of relative differences in lamellipodial morphodynamics between wild-type (marked with the blue line) and Lpd KO cells (marked with the red line), 20 selected morphodynamic parameters (indicated with green numbers on the y-axis) were each normalized by assigning their respective means to 0 and scaling their s.d. values to 1. For description of each parameter, see Table S1.
Our analysis of ‘Average Advancement Velocity’ (parameter #1) in cells lacking Lpd reveals that it is also influenced by retraction-related parameters (#7–11), as their average values are all increased in the absence of Lpd. This then contributes to the observation that the ‘Retraction to Protrusion Ratio’ (parameter #12) is significantly increased in Lpd KO cells compared to controls. Furthermore, examination of the dynamics of lamellipodia reveals that, relative to B16-F1 controls, Lpd KO cells, on average, tend to display more frequent membrane oscillations or fluctuations (‘Frequency of Oscillations’, parameter #13) and velocity changes (‘Variance of Edge Acceleration’, parameter #14), and have stronger and less predictable fluctuations (parameters #15 and #16, respectively). In spite of this variability in velocity-related features, curvature-related parameters indicated that the leading edges of Lpd KO cells have longer concave and convex segments (parameters #17 and #18), caused by the fact that changes of curvature profile over time (‘Curvature Change over Time’, parameter #19) and along the edge (‘Curvature Variability along Edge’, parameter #20) are strongly reduced in the absence of Lpd. All these data suggest that Lpd also contributes to local flexibility and plasticity of cell-edge protrusion, constituting a feature not previously dissected out for any protrusion regulator characterized so far.
Focusing on individual morphodynamic parameters allows us to draw specific conclusions on how individual aspects of lamellipodial protrusion, retraction, dynamics or geometry differ between Lpd KO and wild-type cells. However, analysis of individual parameters does not uncover the precise quantitative contributions of all protrusion- versus retraction-related parameters to the overall phenotype. Employing more sophisticated data analysis approaches can provide tools for potentially extracting such information. To this end, we applied principal component analysis (PCA), which reduces multi-dimensional data sets to two-hybrid parameters with specific characteristics – principal component 1 (PC1) and principal component 2 (PC2) – using the data obtained from our morphodynamic analyses for Lpd KO and B16-F1 control cells (Fig. 5). Static parameters such as those related to geometry/curvature were excluded in this case, allowing us to investigate features that relate to cell-edge dynamics. Eleven parameters were found to have the highest contribution to PC1, the majority of which define fluctuation- or retraction-related characteristics of the cell edge (Fig. 5A). In contrast, the majority of parameters with the highest contribution to PC2 were those associated with protrusion-related characteristics of the cell edge (Fig. 5B). Thus, PC2 can be considered to define ‘protrusion activity’ and PC1 ‘retraction activity’. PC1 and PC2 contain 88% of the total variance of the data set. When displayed in a 2D-coordinate system, results revealed that high PC1 values (abscissa) almost entirely include cells of the Lpd KO population, suggesting higher retraction activity upon loss of Lpd (Fig. 5C). In contrast, the majority of B16-F1 control cells display low or even negative values for PC1, indicating much lower retraction activity. In contrast, both B16-F1 wild-type and Lpd KO cells seem to be equally spread throughout the PC2 axis, indicating higher heterogeneity in protrusion features within both populations. Together with the individual assessment of morphodynamic parameters described above, these results suggest that the major phenotype upon deletion of Lpd is characterized by an enhancement of different aspects of retraction activity. By considering the distribution of individual cells on the PC1/PC2 2D-coordinate system, two regimes of lamellipodial activity are apparent. The first regime, containing a mixture of Lpd KO cells and the majority of cells in the B16-F1 control population, was characterized by negative correlation between PC1 and PC2, indicating that cells of higher protrusion activity display lower retraction activity. Interestingly, a second regime of lamellipodial protrusion, including the majority of the Lpd KO population, featured a positive correlation between PC2 and PC1. This implies that cells with greater retraction activity also have higher protrusion activity in this regime (Fig. 5C). In order to further investigate this counterintuitive behaviour of lamellipodial dynamics, we examined the correlation between values of ‘Maximal Velocity during Protrusion’ (parameter #6) and ‘Maximal Velocity during Retraction’ (parameter #11), irrespective of genotype, but considering and separately displaying each of the three lamellipodial protrusion patterns – smooth, intermediate and chaotic (Fig. S3A–D). We found that a positive correlation exists between these two parameters, with cells of the chaotic phenotype displaying both the highest velocity during protrusion and the highest velocity during retraction. Only with cells of smooth phenotype, most of which harbour Lpd, we failed to detect a statistically significant correlation between protrusion and retraction velocities (Fig. 3; Fig. S3A–D). Finally, we also assessed the probability of a cell of given genotype to fall into either regime. Thus, the probability to follow regime 1 was ∼0.8 (1 representing 100%) for a given control cell, but dropped down to half if lacking Lpd, and accordingly rising from 0.2 (control) to 0.6 (KO) roughly in the case of regime 2. Together, these data show that loss of Lpd can bias stronger and more frequently occurring changes in the direction of cell-edge movements, coinciding with compromised lamellipodial stability.
Fig. 5.

PCA reveals distinct lamellipodial protrusion regimes for B16-F1 control versus Lpd KO cells. (A,B) Figures display the loadings contributed by the individual parameters (derived from quantitative morphodynamic analysis) to principal components (PCs) 1 and 2 (A, PC1; B, PC2). The larger the absolute value of a given loading, the stronger a given parameter contributes to respective PC. Loadings of high contribution are marked in yellow or orange. The parameter numbers correspond to those displayed in Fig. 3 and Table S1, except for curvature or geometry-related parameters, which were excluded. Based on respective parameter contributions, PC1 mostly reflects retraction and PC2 reflects protrusion activity. (C) B16-F1 control cells (blue) and Lpd KO cells (red) are plotted in a 2D-coordinate system with PC1 (containing 58% of total variance) and PC2 (containing 30% of total variance) on the x- and y-axis, respectively. Each dot indicates a single cell, and spatiotemporal, lamellipodial contours of eight selected cells (circles) are arranged radially around the graph, to exemplify the dynamic, lamellipodial patterns of individual, representative cells located in different sections of the PC1–PC2 plane (time colour code as described for Fig. 2A). Cells with enhanced retraction are characterized by higher PC1 values and thus shifted towards the right of the x-axis. Cells with enhanced protrusion are characterized by higher PC2 values and shifted towards the top of the y-axis. Based on this type of data representation, two major protrusion regimes can be distinguished in our cells. Regime 1, containing most cells of the B16-F1 wild-type population and characterized by a negative correlation between PC1 and PC2 (indicated with the pink line and Spearman correlation coefficient of −0.74, P<0.001). Probability of B16-F1 wild-type cells falling into Regime1 was calculated as 0.8 (with 1 equalling 100%), while that of Lpd KO cells was calculated as 0.4. Regime 2, comprised mostly of cells of the Lpd KO population and characterized by a positive correlation between PC1 and PC2 (indicated with the green line and Spearman correlation coefficient of 0.58, P<0.001). Probability of B16-F1 wild-type cells falling into Regime 2 was calculated as 0.2, while that of Lpd KO cells was calculated as 0.6. Dominance of a specific parameter in the characterization of the morphodynamics of a cell corresponds to a parameter-specific direction in the PC1–PC2 plane (green numbers). The morphodynamic characterization of cells positioned on a line from the origin to a specific green number is dominated by the parameter with this number.
Lpd knockout does not alter the lamellipodial actin network
Our analysis reveals that Lpd deletion reduces net lamellipodial protrusion, associated with reduced persistency of protrusion caused by enhanced retraction and oscillation events. Given this, we investigated whether loss of Lpd results in general morphological or dynamic defects in lamellipodial actin networks. To our surprise, there were no obvious morphological defects or significant differences in intensity or width of lamellipodial actin in Lpd KO cells, compared to B16-F1 wild-type cells (Fig. 6A-C). Furthermore, loss of Lpd does not impact on the rate of actin network polymerization and the intensity of Arp2/3 complex in lamellipodia (Fig. S3E–H). These observations indicate that reduced lamellipodial protrusion and cell migration rates upon deletion of Lpd are not caused by defects in lamellipodial actin network formation and Arp2/3 complex incorporation.
Fig. 6.

Lpd KO cells lack discernible defects in lamellipodial actin networks. (A) B16-F1 cells of indicated genotype migrating on laminin, and fixed and stained for F-actin with phalloidin. (B,C) Graphs show quantitation of lamellipodial F-actin intensity (B) and lamellipodial width (C) of individual Lpd KO clones and the pooled population compared to controls. n=number of cells, and data are represented as arithmetic means±s.e.m. Statistics revealed no significant differences between any pair of experimental groups (not shown).
Lpd stabilizes VASP, but does not recruit VASP or Abi to lamellipodia
Lpd has previously been implicated in the recruitment and/or stabilization of Ena/VASP proteins at the lamellipodium edge or their tethering to growing actin filaments (Bae et al., 2010; Hansen and Mullins, 2015; Krause and Gautreau, 2014; Krause et al., 2004; Michael et al., 2010; Pula and Krause, 2008). We thus speculated that potential alterations in VASP dynamics and/or regulation might be responsible for the defects in protrusion caused by the loss of Lpd. However, there was no discernible difference in VASP localization or intensity at the very front of lamellipodia between Lpd KO and B16-F1 wild-type cells (Fig. 7A,B). Similar results were obtained for Mena (also known as ENAH) (Fig. S3I,J). Immunofluorescence analysis shows that VASP and Mena accumulate at lamellipodial edges in the absence of Lpd, but does not address whether Lpd affects their kinetics. Using fluorescent recovery after photobleaching (FRAP)-based approaches, we found that the half-time of recovery of VASP, but not the overall extent of recovery, is reduced in the absence of Lpd compared to B16-F1 controls (Fig. 7C,D). These data suggest that Lpd contributes to the stabilization of Ena/VASP proteins at lamellipodial edges, in spite of being dispensable for their recruitment.
Fig. 7.

Analysis of VASP intensity and turnover at lamellipodia edges in the presence and absence of Lpd. (A) Immunofluorescence analysis showing the localization of VASP at lamellipodia edges in both B16-F1 control and Lpd KO cells. (B) Quantification of VASP intensities at lamellipodia edges in B16-F1 wild-type and Lpd KO cells, displayed individually and as a pooled population. n=number of cells, and data are arithmetic means±s.e.m. (C) The graph shows the recovery curves of EGFP-tagged VASP at the leading edge after bleaching in B16-F1 cells and individual Lpd KO clones, as indicated. Half-times of recovery (in seconds) obtained from curve fitting are displayed on the right. Each time point after the bleach is represented as arithmetic mean±s.e.m. (D) Fluorescent recovery curve fits of lamellipodial FRAP data of B16-F1 wild-type and pooled Lpd KO cells as well as derived t1/2-values, as indicated on the right. n=number of FRAP events analysed. A significant statistical difference in t1/2-values between B16-F1 wild-type and pooled Lpd KO cells is indicated in red (*P<0.001).
Lpd is thought to promote cell migration via its interaction with the WRC during lamellipodium protrusion (Law et al., 2013). Immunofluorescence analysis of Abi proteins, subunits of the WRC, reveals that WRC accumulation at lamellipodia edges in the absence of Lpd is increased rather than decreased compared to control B16-F1 cells (Fig. S4A,B). However, EGFP-Abi (WRC) dynamics at the leading edge was identical in both cell types (Fig. S4C,D). This suggests that the presence of Lpd antagonizes WRC recruitment to the lamellipodium edge by a hitherto unknown mechanism. Immunoblotting confirmed there were no changes in expression levels of VASP, as well as of the WRC subunits Abi, Nap1 (also known as NCKAP1) and WAVE2 (also known as WASF2), in Lpd KO clones compared to B16-F1 wild type (Fig. S4E–H). These results exclude that the relatively modest phenotypes we see are due to compensatory changes in expression levels of respective components.
Lpd loss reduces nascent adhesion formation underneath lamellipodia
Since cells lacking Lpd are characterized by fluctuating and rapidly retracting lamellipodia, we hypothesized that lack of stability of these structures might be caused by defects in adhesion to the substratum. In order to test this hypothesis, we expressed EGFP-paxillin in Lpd KO and B16-F1 control cells, and performed live-cell imaging to quantify the number of nascent adhesions during lamellipodia formation (Fig. 8A). We distinguished between front and back halves of the lamellipodium and found that nascent adhesion distributions strongly depended on respective lamellipodial protrusion class in both cell types (Fig. 8A; Movie 4). Taking all protrusion classes together, there was a clear reduction in the number of new adhesions in the absence of Lpd (Fig. 8B, left panel). Subcategorization showed that the number of new adhesions was not significantly reduced in the absence of Lpd in cells with smooth or chaotic protrusions (Fig. 8B, right panel). In contrast, the intermediate class of protrusions had a statistically significant reduction in adhesion number if Lpd was absent. This combined with the fact that the chaotic phenotype (with much lower adhesion numbers) increased in frequency in Lpd KO cells (Fig. 3D) explains the overall reduction of new adhesions in the absence of Lpd (Fig. 8B).
Fig. 8.

Lpd deletion compromises nascent adhesion and promotes mature, focal adhesion formation. (A) Representative, EGFP-paxillin and phase-contrast images of protrusive regions of B16-F1 wild-type or Lpd KO cells, with the front halves of their lamellipodia encircled with cyan, and the back halves with yellow. Images display distributions of nascent adhesions in the three distinct lamellipodial protrusion phenotypes defined in Fig. 3. (B) Quantification of nascent adhesion numbers in lamellipodia of each protrusion phenotype (smooth, intermediate or chaotic), as well as averaged for all phenotypes and displayed for both genotypes (B16-F1 wild type and Lpd KO) separately (left). Quantifications are also separated for front and back lamellipodial regions, again highlighted as cyan and yellow bars, respectively (right). (C) Table indicating cell fractions belonging to each protrusion phenotype (smooth, intermediate or chaotic) for both control and Lpd KO cell populations upon EGFP-paxillin expression. The Lpd KO population corresponds to data from Lpd KO#3. The ratio of Lpd KO over B16-F1 wild-type cells for each protrusion phenotype is shown in the rightmost column, again confirming significantly reduced cell numbers among Lpd KO cells compared to controls harbouring the smooth lamellipodial phenotype, and vice versa for the chaotic phenotype. (D) B16-F1 wild-type or Lpd KO clones were seeded onto laminin and mature focal adhesions stained with zyxin-reactive antibody. Green arrows point at typical clusters of focal adhesions more frequently observed in Lpd KO clones. (E) Quantitation of average focal adhesion area (relative to cell area) as determined in distinct cell types, as indicated, demonstrating that Lpd removal enhances the area occupied by focal adhesions. All data are arithmetic means±s.e.m., with asterisks above bars indicating statistically significant differences between designated groups: *P<0.05), n=numbers of cells analysed.
Although cells expressing EGFP-paxillin displayed an increase in the smooth, i.e. most efficiently protruding phenotype at the apparent expense of the intermediate phenotype in both genotypes (compare Fig. 8C with Fig. 3D), our analysis suggests that Lpd deficiency reduces the average probability of nascent adhesions to be formed below newly protruding lamellipodia.
A closer look at the spatial distribution of adhesion formation reveals that approximately a third of new adhesions form at the front part of smoothly protruding lamellipodia (Fig. 8B; Movie 4). This is consistent with new adhesions being continuously formed close to the front, with a subset being stabilized and maturing into focal adhesions, as the lamellipodium persistently moves forward. In contrast, despite having a higher total number of adhesions, cells with intermediate protrusions have a significantly lower ratio of adhesion numbers in front over back parts of the lamellipodium (Fig. 8B). Moreover, adhesions appeared to accumulate at the lamellipodium–lamella border, with lower numbers of new adhesions at the front. Finally, cells with chaotic lamellipodial phenotype had very low numbers of nascent adhesions compared to the other two classes, which probably accounts for their lack of stability and frequent cycles of protrusion and retraction or collapse.
We thus conclude that Lpd helps stabilize and/or maintain nascent adhesions, which must occur indirectly since Lpd does not apparently localize to these adhesions (Fig. S1C, Movie 5). One of the earliest regulators of actin dynamics implicated in nascent adhesion formation constitutes the Rho-family GTPase Rac (encoded by three isogenes in mammals, Rac1, Rac2 and Rac3), which is also essential for lamellipodia protrusion and promotes the formation of Rac-induced focal complexes (Nobes and Hall, 1995; Rottner et al., 1999b; Schaks et al., 2018; Steffen et al., 2013). We thus explored to what extent the reduction of nascent adhesion upon Lpd KO occurs through potentially compromised Rac signalling. First, Lpd KO clones are completely unchanged, compared to controls, in their respective activities of endogenous Rac GTPases (Fig. S5A). Second, although ectopic Rac1 (wild-type) expression increases the number of EGFP-paxillin-containing, nascent adhesions in Lpd KO cells, the situation is complex, as the opposite trend was seen upon Rac transfection in control cells (Fig. S5B). Likewise, EGFP-Rac expression and subsequent analysis of protrusion parameters revealed that a sole increase in wild-type Rac levels increases ‘Average Advancement Velocity’ (parameter #1) only in Lpd KOs (and not in controls; Fig. S5C), and this is due to counteracting retraction and not by increasing protrusion (compare e.g. parameters #5 and #12 in Fig. S5D and E, respectively). Comparison of all parameters showed that retraction-related parameters (#7–12) are reduced upon Rac expression in Lpd KO cells. Nevertheless, these data, and the variety of changes observed upon Rac1 expression in both control and Lpd KO cells, clearly illustrate that changes in Rac levels or activity are not causative of phenotypes in protrusion and nascent adhesion observed upon Lpd removal (Fig. S6). Consistent with the aforementioned role of Lpd in stabilization and/or maintenance of nascent adhesions, Lpd loss also strongly shifted the balance between nascent and mature adhesions towards the latter, as Lpd KOs display an increased area of more mature adhesions containing zyxin (Fig. 8D,E). This shift may explain the reduced efficiency of early, integrin-dependent cell spreading, in particular observed on fibronectin, but also, albeit less prominently, on laminin (Fig. S4I,J). Taken together, our data establish that loss of Lpd leads to a Rac signalling-independent defect in nascent adhesion formation accompanied by their increased maturation, likely contributing to the destabilization of lamellipodial protrusions.
Lpd regulates the number but not speed of Vaccinia-induced actin tails
Vaccinia virus promotes its actin-dependent cell-to-cell spread at the plasma membrane by activating the Arp2/3 complex in a Nck, WIP (also known as WIPF1) and N-WASP dependent fashion (Frischknecht et al., 1999b; Moreau et al., 2000; Welch and Way, 2013). Curiously, and like lamellipodia protrusion, this pathway also involves Rac signalling at the plasma membrane (Alvarez and Agaisse, 2013). Furthermore, as Vaccinia motility and lamellipodium protrusion share various features of actin-based motility, such as dependence on Arp2/3 complex activation at the plasma membrane as well as recruitment of Lpd (Krause et al., 2004) and VASP (Frischknecht et al., 1999a; Grosse et al., 2003), we investigated whether Lpd depletion affects motility of the virus. Consistent with previous immunofluorescence analysis (Krause et al., 2004), we first confirmed that both EGFP-tagged and endogenous Lpd are recruited to Vaccinia-induced actin tails in HeLa cells (Fig. S7A). Indeed, RNAi-mediated knockdown of Lpd in these cells reduced the number of Vaccinia-induced actin tails (Fig. S8A,B). Effective Lpd knockdown could be documented both by immunoblotting of bulk cell populations (Fig. S8A) and immunolabelling at the single-cell level (Fig. S7B). However, the length of actin tails and speed of viral movement, the latter of which is powered by actin polymerization, were unchanged upon Lpd knockdown (Fig. S8B). Defects in Vaccinia tail formation frequency occurred in spite of equal numbers of extracellular virus, so derived from effects on tail initiation and/or maintenance (Fig. S7C). Similar results were obtained upon tamoxifen treatment-mediated Lpd gene removal (Lpd KO) in mouse embryonic fibroblasts (MEFs) originating from conditional Lpd (Lpdfl/fl) KO mice (Fig. S8C,D) (Law et al., 2013). Both tail formation frequency and tail length were reduced in the absence of Lpd in these fibroblasts, but viral speed as a direct readout of actin assembly was again unchanged (Fig. S8D). This observation was fully consistent with recruitment in the absence of Lpd, Nck and N-WASP, the latter of which operates as an essential Arp2/3 complex activator in the Vaccinia system and in analogy to the WRC in lamellipodia, as well as of the Lpd-interactor VASP (Fig. S7D). Taken together, these experiments suggest that Lpd contributes to formation frequency and maintenance of specific actin structures at the plasma membrane, such as lamellipodia and Vaccinia-induced actin tails, but its removal does not eliminate these structures nor compromise the efficiency of actin filament assembly in them.
DISCUSSION
Here, we explored the mechanistic function of lamellipodin (Lpd) in migrating B16-F1 cells using CRISPR/Cas9-mediated gene disruption. In agreement with previous studies, RNAi-mediated knockdown and conditional knockout of Lpd in MEFs (Krause et al., 2004; Law et al., 2013), our data confirm that Lpd is a positive regulator of lamellipodial protrusion and cell migration on 2D substrates. Importantly though, it is not obligatory for lamellipodia formation in all cell types and conditions, consistent, for instance, with reduction but not loss of lamellipodia formation upon Lpd knockdown in MTLn3 breast cancer cells (Carmona et al., 2016). However, we cannot exclude compensatory mechanisms occurring during permanent or more short-term CRISPR/Cas9 treatment in our model systems, since tamoxifen-induced, conditional Lpd KO MEFs had previously shown impaired lamellipodia formation and stronger migration phenotypes than those observed here (Law et al., 2013). Nevertheless, loss of Lpd does not phenocopy loss of the WRC (see e.g. Schaks et al., 2018). This is also consistent with the observation that Lpd knockout in mice is compatible at least with embryonic development and life until early after birth (Law et al., 2013). However, this contrasts with mice lacking obligatory lamellipodial regulators, such as WRC subunits (Rakeman and Anderson, 2006; Yamazaki et al., 2003) or Rac1 (Sugihara et al., 1998), which display early embryonic lethality.
The approach of growing permanently deleted cell lines allowed us to precisely explore mechanistic changes in lamellipodia formation accompanied by Lpd loss of function, while key features of our phenotypes could also be confirmed upon more short-term, CRISPR/Cas9-mediated gene disruption. Migration of B16-F1 melanoma cells on laminin is characterized by distinct protrusion phenotypes, varying from ‘smooth’ to ‘chaotic’ as two extremes as well as an ‘intermediate’ phenotype, the relative frequencies of which change upon Lpd knockout. By means of semi-automated cell-edge tracking combined with quantitative, morphodynamic analysis, we found that defects in lamellipodial persistence in Lpd KO cells are associated with an increase in the retraction and oscillation features of their cell edges. Surprisingly, however, Lpd KO cells are capable of reaching lamellipodial protrusion velocities similar to those of wild-type cells. These observations agree with the lack of detectable lamellipodial actin network defects, including F-actin densities, lamellipodial Arp2/3 complex incorporation or actin polymerization rates. Due to the coincident increase rather than decrease of accumulation of its interaction partner Abi-1, a subunit of the lamellipodial Arp2/3 complex activator WRC, we conclude the physical interaction between Lpd and Abi proteins to have regulatory functions instead of contributing to WRC recruitment and/or accumulation. As opposed to the WRC subunit Abi-1, Lpd can increase the dwell time at the lamellipodium edge of the Ena/VASP family member VASP, which may also affect the activity of the latter on growing actin filaments, as suggested previously (Hansen and Mullins, 2015). However, such changes are likely too subtle for detection in the context of the multitude of factors potentially regulating lamellipodial actin polymerization and protrusion.
When comparing the impact of Lpd on the two different types of actin-based protrusion at the plasma membrane studied here, lamellipodia and Vaccinia virus-induced actin tails, we found two major commonalities. First, little effect on upstream regulation and incorporation of the major actin assembly factor in these protrusions, the Arp2/3 complex, and second, a peculiar contribution in both cases to formation frequency and stability of these structures. More specifically, the lamellipodia in cells lacking Lpd had problems with efficiently advancing forward, at least on average, and displayed a higher likelihood to chaotically collapse or retract. Thus, an increased tendency to retract into the cortex might also be the cause for reduced Vaccinia tail numbers, if indeed analogous. If translating this into lamellipodial activity, an increased probability of continuous, smooth protrusion, as observed in the presence of Lpd, will clearly correlate with the likelihood of depositing material for nascent adhesion formation. And indeed, although not essential, the presence of Rac and thus protruding lamellipodia is known to clearly promote nascent adhesion formation by increasing the mobile fractions of various actin-binding proteins present in these structures, including paxillin, zyxin and VASP (Steffen et al., 2013). Consistently, numbers of nascent adhesions in lamellipodia of Lpd KO cells were found, on average, reduced relative to those in B16-F1 controls, and those of mature focal adhesions increased. These data suggest a shift in activities from protrusive, Rac-dependent behaviour towards more contractile, Rho-dependent activity in the absence of Lpd. However, this does not mean that we can explain defects observed upon Lpd removal by sole reduction of Rac signalling, or rescue them by increased Rac activity. In fact, experiments revealed that Lpd removal did not impact on Rac activity, and upregulation of cellular Rac dose, in spite of creating a condition for improvement of retraction-related phenotypes and slight increase in nascent adhesion numbers in Lpd KO cells, did not restore the complexity of differences in protrusion behaviour between control and Lpd KO cells.
Aside from this, apparent defects in adhesion regulation may also be linked to the various interactions of Lpd with established adhesion components such as talin or integrins (Lagarrigue et al., 2015; Lee et al., 2009; Watanabe et al., 2008). Moreover, a potential involvement of Rac in Lpd-dependent regulation of nascent adhesions may derive from defective transduction of extracellular matrix engagement through FAK (also known as PTK2) and Cas (also known as BCAR1) signalling (Bae et al., 2014), but mechanistic details remain to be determined. Whatever mechanism, Lpd loss of function clearly increases the likeliness of retraction and rearward folding of lamellipodia.
Repeated cycles of protrusion and retraction were previously reported for a variety of cell types and with a broad range of periods and amplitudes (Burnette et al., 2011; Enculescu et al., 2010; Gholami et al., 2008; Giannone et al., 2004, 2007; Koestler et al., 2008; Machacek and Danuser, 2006; Zimmermann and Falcke, 2014). The chaotic behaviour that we find in Lpd KOs shows similarities to spreading fibroblasts exhibiting so-called periodic contractions, which coincide with brief interruptions of protrusion accompanied by integrin and adhesion clusters formation close to the cell edge (Giannone et al., 2004, 2007). Although protrusion and retraction events are less clearly separated in B16-F1 lamellipodia protruding on laminin, Lpd appears to interfere with the coordination of these activities. The precise changes observed upon Lpd removal concern multiple parameters, either reflecting decreased protrusion and increased retraction or cell-edge activities to become less predictable, less robust, with lower plasticity and overall more chaotic. The combination of all these phenotypic parameters reduces the efficiency of protrusion and nascent adhesion formation and turnover for productive forward advancement of the lamellipodium, and ultimately the efficiency of cell migration. While confirming this particular aspect of previously published literature and, at the same time, specifying the phenotypic changes caused by Lpd removal, the precise mechanistic reasons for these changes remain to be elucidated.
MATERIALS AND METHODS
Cell culture, transfection conditions, RNAi and induced Lpd knockout
B16-F1 mouse melanoma cells (purchased from American Type Culture Collection, Manassas, VA) were cultivated according to standard tissue culture conditions. Cells were grown at 37°C/7.5% CO2 in Dulbecco's modified Eagle medium (DMEM) containing 4.5 g/l glucose (Life Technologies, Thermo Fisher Scientific, Germany) and 10% fetal calf serum (FCS; PAA Laboratories, Linz, Austria), 2 mM glutamine (Life Technologies) and 1% penicillin-streptomycin (Life Technologies). For transfections of cells with DNA vectors described below, JetPei transfection reagent (Polyplus Transfection, Illkirch, France) was used according to the manufacturer's instructions. For microscopy experiments, B16-F1 cells were plated onto glass coverslips pre-coated for 1 h at room temperature with 25 μg/ml laminin (L-2020; Sigma-Aldrich, Germany) in 50 mM Tris-HCl, pH 7.4, and 150 mM NaCl or 25 μg/ml fibronectin (Roche) in PBS.
Rat2 fibroblasts and NIH-3T3 mouse fibroblasts were grown at 37°C/7.5% CO2 in DMEM containing 4.5 g/l glucose and 10% fetal bovine serum (FBS; 054M3396, Sigma-Aldrich), 2 mM glutamine, 1 mM sodium pyruvate (Life Technologies), 1% non-essential amino acids (Life Technologies) and 1% penicillin-streptomycin.
HeLa cells were maintained in DMEM supplemented with 10% FBS and antibiotics (penicillin-streptomycin). To perform short hairpin RNA (shRNA)-mediated knockdown, HeLa cells were transfected with Lpd-specific or scramble shRNA as a control using Fugene HD (Roche) transfection reagent, as described (Carmona et al., 2016). Following transfections, cells were incubated for 24 h before undergoing 48–72 h of selection with 2 μg/ml puromycin, and then subjected to viral infections and analyses as described below.
Tamoxifen-inducible MEFs (Lpdfl/fl-CreER MEFs) from conditional Lpd KO mice were generated and grown as described (Law et al., 2013). To prepare KO MEFs prior to infections, Lpdfl/fl-CreER MEFs were incubated in medium containing 0.6 µM Tamoxifen (Sigma-Aldrich) for 2 days, followed by 6 days incubation with 0.3 µM Tamoxifen.
All cell lines in our laboratory are routinely authenticated for induced gene modifications, both by ourselves and local authorities, and routinely screened for mycoplasma contaminations at regular frequency.
Generation of B16-F1 Lpd KO cell lines
Generation of B16-F1 mouse melanoma Lpd KO clones was performed analogous to the method used for generating FMNL2/3 KO clones described previously (Kage et al., 2017). CRISPR/Cas9 guide design was performed using a publicly available CRISPR design tool (then http://crispr.mit.edu), with the DNA sequence of exon 5 of Lpd/Raph1 being used [base pairs 937–1014 of complementary DNA (cDNA) of NM_001045513.3]. A guide with the highest available aggregate score of 75/100 was selected, targeting the following genomic DNA sequence: 5′-TGAGAAGATCCGAGTTGCTC-3′. Forward and reverse guide oligonucleotide sequences, 5′-CACCGTGAGAAGATCCGAGTTGCTC-3′ and 5′-AAACGAGCAACTCGGATCTTCTCAC-3′, respectively, were annealed for 4 min at 95°C, followed by 10 min incubation at 70°C and gradual cooling at room temperature in a buffer containing 100 mM KAc, 2 mM MgAc, 30 mM HEPES-KOH (pH 4.7). Annealed sequences were cloned into an expression vector pSpCas9(BB)-2A-Puro(px459) (Addgene plasmid #48138) using BbsI restriction enzyme. Successful cloning was confirmed by sequencing with primer 5′-AGGCTGTTAGAGAGATAATTGG-3′. For generation of Lpd KO cell clones, B16-F1 cells were transfected with the cloned plasmid encoding puromycin resistance and the CRISPR guide sequence targeting Lpd. Transfected cells were cultured for 4 days with B16-F1 culture medium containing 2.5 mg/ml puromycin. Single colonies were isolated and expanded until confluent. Confirmation of genetic knockout was validated by both western blotting and DNA sequencing of genomic DNA. For guide DNA extraction, B16-F1 cells were pelleted and incubated at 55°C overnight in lysis buffer (100 mM Tris-HCl pH 8.5, 5 mM EDTA, 0.2% SDS, 200 mM NaCl) containing 40 µg/ml proteinase K. Standard phenol/chloroform precipitation was performed for extraction of nucleic acids. Genomic DNA sequence of 364 bp, flanking the Lpd target sequence, was amplified by Phusion High-Fidelity Polymerase (New England Biolabs) with 5′-GAACGGGCCATTTTAAAATTGTGC-3′ and 5′-AGACATTAGGAAGAATACAGTTTTACC-3′ as forward and reverse primers, respectively. Amplified sequence was purified with NucleoSpin Gel and a PCR clean-up kit according to the manufacturer's instructions (Macherey&Nagel), cloned into a Zero Blunt TOPO vector using Zero Blunt TOPO Cloning Kit (Invitrogen) and transformed into competent bacteria. Single bacterial colonies were isolated and inoculated, plasmid DNA purified using a NucleoSpin Plasmid kit (Macherey&Nagel) and sequenced by MWG-Biotech (Ebersberg, Germany) using sequencing primer 5′-CAGGAAACAGCTATGAC-3′. Clones with frameshift mutations on all alleles causing stop codons downstream of the target site were selected for further characterization.
CRISPR/Cas9 treatment of Rat2 fibroblasts
Lpd gene disruption in Rat2 fibroblasts as shown in Fig. 2 was as described for B16-F1 cells above, except that cells were analysed after transient gene disruption as mixed cell populations in this case. Transfections with respective CRISPR/Cas9 construct (with specific target sequence being identical for murine and rat Lpd sequences) were followed by 4 days of puromycin selection and 1–2 days of recovery and growth to near-confluence of surviving cells for further processing for experiments, i.e. replating onto plastic dishes for random cell migration experiments or onto coverslips for cell staining. Thus, cells were analysed roughly 7 days after transfections with CRISPR/Cas9 construct.
Live-cell imaging equipment and conditions
All live-imaging experiments were performed with either an inverted Axio Observer (Carl Zeiss, Jena, Germany) equipped with an automated stage, a DG4 light source (Sutter Instrument, Novato, CA) for epifluorescence illumination, a VIS-LED for phase-contrast imaging, an acousto-optic tunable filter (AOTF)-controlled 405 nm diode laser for FRAP and a CoolSnap-HQ2 camera (Photometrics, Tucson, AZ), driven by VisiView software (Visitron Systems, Puchheim, Germany), or an inverted microscope (Axiovert 100 TV; Carl Zeiss), equipped with an HXP 120 lamp for epifluorescence illumination, a halogen lamp for phase-contrast imaging, a CoolSnap-HQ2 camera and electronic shutters driven by MetaMorph software (Molecular Devices, Sunnyvale, CA) for image acquisition. Cells, seeded on cover glasses, were mounted on an open heating chamber (Warner Instruments, Hemden, CT) linked to a heating controller (TC-324 B) maintaining a constant temperature of 37°C. During high-magnification, live-imaging experiments, B16-F1 cells were incubated in microscopy medium [Ham's F-12 4-(2-hydroxyethyl)-1-piperazineethanesulfonic acid-buffered medium; Sigma-Aldrich] including 10% FCS (PAA Laboratories), 2 mM glutamine and 1% penicillin-streptomycin (both purchased from Life Technologies).
Lamellipodium protrusion rate measurements by kymograph-based analysis
Manual determination of average lamellipodium protrusion rate was performed as previously described (Dimchev et al., 2017). Kymographs were obtained using MetaMorph from time-lapse phase-contrast movies of either B16-F1 wild-type cells, of Lpd KO clones or of both overexpressing EGFP-tagged Lpd. Experiments were performed with either 63×/1.4 NA apochromatic or 100×/1.4 NA Plan apochromatic oil objectives. Average values of lamellipodial protrusion rates were displayed in μm/min.
Random migration assays
Random migration rates of B16-F1 and Rat2 wild-type and Lpd KO cells, seeded on 25 μg/ml laminin pre-coated μ-slide four-well glass bottom microscopy chambers (Ibidi, Martinsried, Germany), were determined using phase-contrast time-lapse movies taken with a 10×/0.15NA Plan Neofluar objective over a period of 10 h, and time intervals of 10 min. Microscopy chambers were mounted on a stage equipped with an incubator maintaining a constant temperature of 37°C and 7.5% CO2. Analysis was performed in ImageJ using the Manual tracking plugin and Chemotaxis and Migration Tool by Ibidi. Average values of random migration rates were displayed in μm/min.
DNA constructs
EGFP-actin and EGFP-CAAX (pEGFP-F, farnesylated) were purchased from Clontech (Mountain View, CA), and remaining constructs published previously as follows: EGFP-Lpd (Krause et al., 2004), EGFP-Abi-1 (Innocenti et al., 2005), EGFP-tagged VASP and paxillin (Rottner et al., 2001), and the PREL1/RIAM expression construct, termed mmPREL1-CMV-Sport6 (Jenzora et al., 2005). pRK5-myc-Rac1 (wt) co-expressed with EGFP-paxillin for nascent adhesion formation analysis in Fig. S5B was generated by site-directed mutagenesis of pRK5-myc-Rac1-Q61L, kindly provided by Dr Laura Machesky (Beatson Institute, Glasgow, UK). EGFP-Rac1(wt) used for the generation of data shown in Fig. S5C–E was generated by fusing human RAC1 cDNA into EGFP-C1 (Clontech) and kindly provided by Dr Wolfgang Kranewitter (Hospital Barmherzige Schwestern, Linz, Austria).
Immunoblotting and antibodies
For confirmation of CRISPR/Cas9-mediated gene disruption by immunoblotting, protein lysates were prepared in a buffer containing 50 mM Tris-HCl (pH 7.5), 150 mM NaCl, 1 mM EDTA, 1% Triton X-100, supplemented with a Complete mini EDTA-free Protease Inhibitor Cocktail pill (Roche). For obtaining total protein lysates, cells were lysed in Laemmli sample buffer (60 mM Tris-HCl pH 6.8, 2% SDS, 10% glycerol, 5% β-mercaptoethanol, 0.01% Bromophenol Blue), syringed multiple times and incubated for 20 min with benzonase nuclease (0.5 μl per volume of 30 μl) at 37°C in order to reduce solution viscosity caused by genomic DNA. Protein concentrations were quantified using a Pierce BCA Protein Assay Kit (Thermo Fisher Scientific). All lysates were brought to a final amount of 30 μg, and boiled for 10 min at 95°C before being loaded on SDS-PAGE gels. Blotting was performed according to standard procedures using primary antibodies as follows: two Lpd-specific antibodies were purchased from Sigma-Aldrich (HPA016744 recognising the N-terminus, 1:1000) and Santa Cruz Biotechnology (European Support, Heidelberg, Germany; E-12 antibody, epitope unknown, 1:200). A third anti-Lpd antibody raised against the C-terminus of the protein was as described (1:2000, Krause et al., 2004). Anti-GAPDH antibody (clone #6C5, 1:5000) was purchased from Calbiochem (Merck-Millipore, Germany), anti-β-actin antibody (ab8227, 1:1000) was purchased from Abcam, Germany, and anti-vinculin antibody (V9131, 1:5000) was purchased from Sigma-Aldrich. Remaining primary antibodies were as previously published: polyclonal VASP (1:2000) and PREL1 antisera (1:2000, Jenzora et al., 2005), and Nap1-B (#4953-B, 1:5000) antiserum (Steffen et al., 2004); WAVE2 (1:1000, Innocenti et al., 2004) and Abi-1 (1:2000, Biesova et al., 1997) antisera were kindly provided by Dr Giorgio Scita (IFOM Milan, Italy). Peroxidase-coupled anti-mouse IgG or anti-rabbit IgG secondary antibodies (1:5000) were purchased from Dianova (Germany).
Quantification of active Rac proteins
Quantification of GTP-loaded Rac1, 2 and 3 proteins in cell lysates of B16-F1 and Lpd KO cells, grown to 30–50% confluency, was performed using the Rac1, 2, 3 G-LISA™ Activation Assay (purchased from Cytoskeleton Inc.), according to the manufacturer's instructions. Results were averaged for three independent repetitions, each performed in triplicate for wild-type and Lpd KO cell clones. Functionality of the assay was confirmed with a provided positive control (Rac control protein), quantifications of which were excluded from the final results.
Phalloidin staining and immunolabelling
For phalloidin staining, cells were fixed for 20 min with a mixture of pre-warmed (37°C) 4% paraformaldehyde (PFA) and 0.25% glutaraldehyde, followed by permeabilization in 0.1% Triton X-100/PBS for 1 min. For immunostaining of endogenous proteins, the same procedure was employed, except that cells were fixed with 4% PFA alone, and for zyxin staining, cells were permeabilized first using 0.3% Triton X-100 in 4% PFA/PBS for 1 min followed by fixation for 20 min with 4% PFA/PBS. In the case of immunolabelling, samples were blocked with 5% horse serum in 1% BSA/PBS for 30–60 min. ATTO-488- and ATTO-594-labelled phalloidin (1:200) were purchased from ATTO-TEC (Germany). The following primary antibodies were used: monoclonal anti-Mena antibody A351F7D9 (undiluted supernatant, Lebrand et al., 2004), monoclonal anti-Abi antibody (clone W8.3, supernatant diluted 1:50), kindly provided by Dr Giorgio Scita (IFOM Milan, Italy), monoclonal anti-p16A/ArpC5A 323H3 (undiluted supernatant, Olazabal et al., 2002) and monoclonal anti-zyxin (undiluted supernatant, Rottner et al., 2001) antibodies. Polyclonal antibodies against murine full-length VASP (residues 1–375) were raised by immunizing a female New Zealand White rabbit with recombinant protein following five boosts at 2-week intervals by standard procedures (glycerol stock 1:400).
Lamellipodial width, actin filament and protein intensity measurements
Lamellipodial F-actin intensity was determined by measuring the average pixel intensities of lamellipodial regions of phalloidin-stained cells, microspikes excluded, with intensities of background regions being subtracted from lamellipodial actin intensity values. Quantitation of Arp2/3 complex intensities (p16A subunit) in the lamellipodia of different cell lines was performed as described (Dimchev et al., 2017). For determining lamellipodial intensities of VASP and Abi, intensity scans from 3-pixel-wide lines drawn across lamellipodia at three random cellular locations were generated using MetaMorph. Upon subtraction of the minimum intensity of each scan defined as background outside the cell, peak intensities from the three individual measurements were averaged and expressed as maximum intensity counts per pixel. Lamellipodial width was quantified with MetaMorph using images of phalloidin-stained cells, by drawing lines from lamellipodia tips into more proximal cellular regions up to distal edges of the lamella, followed by measuring their lengths. For each cell, lamellipodial widths in three random cellular locations were measured, and values averaged in order to derive the respective single value per cell; obtained values were expressed in µm.
FRAP for investigating protein turnover or actin network polymerization rates
FRAP experiments were performed on an Axio Observer (Carl Zeiss, Jena) using a 100×/1.4 NA Plan-Apochromat oil immersion objective. EGFP-VASP and -Abi, localizing at the tip of lamellipodial regions, were bleached by employing a 2D-VisiFRAP Realtime Scanner (Visitron Systems) using 60 mW output power of a 405 nm diode laser (Visitron Systems), in order to achieve nearly complete bleaching for each component at the lamellipodial tip. A time interval of 1500 ms and an exposure time of 500 ms were used for image acquisition. All intensity values were derived by region measurements using MetaMorph software. Lamellipodial intensities before and after the bleach were corrected for background and acquisition photobleaching using regions outside and inside the cell, respectively, and processed using Microsoft Excel. Data were fitted in SigmaPlot 12.0 (Scientific Solutions SA, Pully-Lausanne, Switzerland) using dynamic curve fits for exponential rise to maximum and half-times of recovery calculated using t1/2=−1/b×ln(0.5), as described (Dimchev and Rottner, 2018; Steffen et al., 2013).
Lamellipodial actin polymerization rates in B16-F1 wild-type and Lpd KO cells were obtained by photobleaching incorporated, EGFP-tagged actin. A region exceeding the lamellipodial area was bleached in each case. This allowed monitoring the recovery of fluorescence in the entire actin network over time, essentially as described previously (Dimchev and Rottner, 2018; Kage et al., 2017; Steffen et al., 2013). Final actin network assembly rates were expressed in µm/min.
Cell spreading quantification of adhesion area
Cells were seeded onto coverslips pre-coated with either 25 μg/ml laminin or 25 μg/ml fibronectin (as described above). Then, 15 min, 60 min or 3 h following cell seeding, coverslips were fixed with 4% PFA/0.25% glutaraldehyde, permeabilized with 0.1% Triton X-100/PBS for 1 min and stained for F-actin with phalloidin (as described above). Images were taken with a 40×/1.3NA Apochromat oil objective. Cell area measurements were derived from drawing cell contours encompassing the full cell area with ImageJ, following calibration to respective objective magnification. Final data were averaged for all cells measured and displayed in µm2.
Quantification of adhesion area in cells stained for zyxin was performed using ImageJ by manually adjusting appropriate thresholds and employing the particle analysis plugin. For enhancing accuracy, the area around the nuclear region, characterized with non-specific background fluorescence, was excluded from measurements. Since it was challenging to separate individual adhesions in computer-aided analyses, we presented data as average, adhesion-occupied areas as a percentage of whole-cell area.
Nascent adhesion quantification
Cells were transfected with EGFP-paxillin or co-transfected with EGFP-paxillin and pRK5-myc-Rac1 (wt) in the case of Fig. S5B, and dual-channel time-lapse movies (EGFP fluorescence and phase contrast) acquired on an Axio observer microscope (Carl Zeiss, see above) with 100×/1.3NA Neofluar oil immersion objective and 20 s time interval between frames. Time-lapse movies were opened in MetaMorph and brightness and contrast adjusted to optimize visualization of lamellipodia and nascent adhesions. Lamellipodia width could be determined in both fluorescence and phase-contrast channels, due to these structures appearing as slightly brighter and darker in respective channels, which was due to the increased concentration of actin filaments in this region. Contours encompassing the entire width of lamellipodial regions were manually drawn on MetaMorph for each timeframe measured, and further separated into back and front lamellipodial regions. This was implemented by drawing multiple perpendicular lines connecting the front and back of the lamellipodial region at multiple locations, and marking the middle of each perpendicular line. Connecting the middle parts of all perpendicular lines with the MetaMorph multi-line tool then allowed the separation of the lamellipodium into two essentially equal halves. Nascent adhesions in lamellipodia were manually counted in four consecutive frames, and individually for back and front parts of the lamellipodium. For each cell, the number of adhesions in each region measured (either front or back) were averaged for the four consecutive frames, thus deriving the average number of adhesions present in each region over the course of 80 s. Data were presented as number of nascent adhesions per 10 µm2, grouped into the lamellipodial phenotype categories defined above (smooth, intermediate and chaotic), and displayed separately for back and front parts of lamellipodia.
Vaccinia virus infections
Cell lines were infected with the WR strain of Vaccinia virus and processed for immunofluorescence as previously described (Arakawa et al., 2007a,b). HeLa cells were fixed at 9 h post-infection and KO MEFs at 15 h post-infection. The following antibodies were used for immunofluorescence: anti-Nck (Millipore), anti-N-WASP (Moreau et al., 2000), anti-VASP (BD Transduction Laboratories), anti-Lpd (Krause et al., 2004) and anti-B5 (Hiller and Weber, 1985). Actin tails were stained with Texas Red or Alexa Fluor 488-phalloidin (Invitrogen), and viral DNA was observed using 4′,6-diamidino-2-phenylindole (DAPI) staining. Quantification of the number of actin tails and number of extracellular viruses was performed through manual counting; all other analyses were performed as described previously (Humphries et al., 2014). For all quantifications, counts were performed over multiple cells in three separate experiments, with the n in each case given in the figure legend. Graphs and statistics were compiled using Prism (GraphPad software, USA), and comparison of two data sets was carried out using an unpaired Student's t-test.
Cell-edge tracking for lamellipodial morphodynamic analysis
Cells were transfected with EGFP-CAAX construct, or EGFP-Rac1 (wt) in case of the data shown of Fig. S5C–E, and time-lapse movies were acquired on an inverted microscope (Axiovert 100 TV; Carl Zeiss) using a 100×/1.4NA Plan-apochromatic oil immersion objective, with a time interval of 1 s. To enhance cell-edge detection, acquired fluorescent time-lapse movies were processed on ImageJ with smooth, Gaussian blur, enhance contrast and find edges filters. Brightness and contrast levels were further adjusted to obtain optimal separation of edge from background. Cell-edge analysis was initiated with ImageJ using the JFilament 2D plugin (Smith et al., 2010b). The following JFilament parameters were found optimal for B16-F1 cell-edge detection with the aforementioned acquisition settings: Alpha=15, Beta=10, Gamma=4000, Weight=0.3, Stretch Force=15, Deform iterations=400, Point Spacing=5, Image Smoothing=1.01. To obtain ‘snake’ files (or snakes), 120 frames (i.e. 2 min of acquisition time) were processed, each one containing the spatiotemporal positions of the tracked cell contour, defined by x and y coordinates of a given number of points. Snake files were processed in MATLAB R2017a (MathWorks, Natick, MA), in order to derive velocity, curvature maps and specific morphodynamic parameters.
MATLAB script and displacement field of the contour
Following cell-edge tracking and obtaining contour coordinates from JFilament for every frame, a MATLAB script was employed to calculate the displacement and velocity fields, using a method aiming to determine the correspondences of points on the measured cell-edge contour over subsequent frames. We employ uniform springs and normal springs to find the corresponding positions of points between the curve in time step t (i.e. Ct), and the curve in time step t+1 (i.e. Ct+1), where t is an arbitrary time frame. Uniform springs connect neighbouring points of a contour Ct+1. Normal springs connect these points to the points representing the continuation of the normal direction of the contour Ct. For regions in which curves in two subsequent frames are parallel, the assumption is that each point is moved in the normal direction and the correspondence between curves is achieved by following the normal vectors from Ct to Ct+1. For regions of high deformations and enhanced convexity or concavity in one of the curves, meaning the curves not being parallel to each other, a normal mapping would not be reliable. In these situations, uniform mapping is employed resulting in evenly spaced distribution of points on Ct+1. In order to add an adaptivity feature to the correspondence algorithm, normal and uniform mappings along the curves were combined, but with variable weights, the latter being defined as a function of local deformation or parallelism degree. The variability of weights enabled constructing the basis of the mapping between two curves, relying on the normal mapping method in the regions of low deformation, followed by using uniform mapping to interpolate the mapping in the regions of high deformation. In order to implement this principle, a mechanical spring model was employed similar to the one described previously (Machacek and Danuser, 2006), containing two types of springs: springs of normal or uniform mapping. Unlike the mechanical model used by Machacek and Danuser (2006), in our model, the springs responsible for normal mapping were also considered as linear springs and all the springs are assumed to be bound to the cell boundary. This simplifies the nonlinear spring system to a linear one in the 1D arc length coordinate and facilitates the computations.
At each time point t, there are N fixed nodes Qi, i=1:N on Ct, the coordinates of which are obtained by applying the same procedure in the previous time frame, and the aim of the algorithm is to find the position of their corresponding nodes Pi, i=1:N on Ct+1.
Nodes on Ct+1 are connected by two kinds of springs. Uniform mapping springs connect neighbouring nodes and their rest length is defined as l0t+1=Lt+1/N, where Lt+1 is total length of the curve Ct+1.
Normal mapping springs connect each node Pi to its normally mapped position Mi, i=1:N, which is defined as the intersection of curve Ct+1 and normal vector from Qi on curve Ct. The rest length of these springs is zero, thus they tend to attract nodes toward their normally mapped positions Mi. The strength of this attraction depends on the spring constant, the latter depending on deformation degree.
The degree of deformation at each node Pi was defined as:
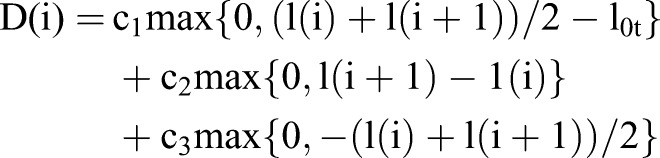 |
where c1, c2, c3 are constants and l(i) is the length of the segment of Ct+1 between Mi−1 and Mi, which can be negative if Mi appears before Mi−1.
The first term in the aforementioned equation decreases in the regions where curves Ct and Ct+1 are close to parallelism, i.e. it measures the similarity of the direction of curves Ct and Ct+1 at any point i. The second term captures the similarity of the curvature of curves Ct and Ct+1 at any point i. The third term penalizes the regions in which the order of M points does not match the order of Q nodes. In these regions, the additional increase in deformation degree caused by the third term reduces the possibility of topological violations, which is the difference between the order of P nodes and Q nodes.
Spring constants for normal mapping springs and uniform mapping springs were defined as functions of the degree of deformation:
 |
 |
where k1, k2 and k3 are constants.
These relations indicate the predominance of uniform and normal mapping in high and low deformation regions, respectively.
For each time point t, a system of N nodes on Ct+1 was constructed, which are connected by different springs, as explained above. In order to find unknown positions of nodes Pi, N force balance equations were solved. By using the positions of nodes Qi and their corresponding nodes Pi, the displacement and velocity fields of the curve Ct were found. The effects of curve ends on the mapping were taken into consideration. The result of the mapping, especially in the regions close to ends, can depend on the position of end points of the curves in different time frames, and, in order to compensate for this dependency, 5% of the snake lengths at both ends of tracked contours were removed. The MATLAB script is available upon request.
Quantitative analysis of cell-edge morphodynamic metrics and PCA
Finding the corresponding location of each point on the tracked cell edge allowed us to derive the trajectory of each point over time and to obtain the velocity of each point between different frames. Once the local velocities of points along the cell boundary had been calculated, velocity maps were constructed by plotting velocity data in a 2D-coordinate system, with time and position along the cell boundary defined as x- and y-axis, respectively. The velocity at any point on the curve and any time was indicated by colours, as shown in Fig. 3. For the morphodynamic behaviour of the leading edge, only the normal component of the velocity was considered. Similarly, maps for curvature along the cell boundary in time were constructed. Since the curve in our model is a piecewise linear curve represented by a finite number of points, the local curvature at any point was calculated using the position data of the point and its two neighbouring points. The velocity and curvature maps contain the majority of morphodynamical information of the analysed edge. The morphodynamical behaviour of cells was subsequently quantified by defining descriptors based on these maps (explained in Table S1). PCA was performed on the defined morphodynamical metrics, using MATLAB.
Image processing and statistical analysis
Brightness and contrast levels were adjusted using MetaMorph software v7.7.8.0. Figures were processed and assembled on Adobe Photoshop CS4 (Adobe Systems, San Jose, CA). Data analyses were performed with MetaMorph, Fiji or ImageJ, Microsoft Excel 2010 and SigmaPlot 12.0 (Systat Software, Erkrath, Germany). Data sets were routinely repeated three or more independent times, and statistically compared with paired Student's t-tests (if normally distributed) or, alternatively, non-parametric Mann–Whitney rank sum tests using SigmaPlot. Probability of error of 5% or less (*P<0.05) was considered as statistically significant.
Supplementary Material
Acknowledgements
We thank Drs Giorgio Scita, Laura Machesky and Wolfgang Kranewitter for reagents; Dr Naoko Kogata (Francis Crick Institute, London, UK) for help with assembling Vaccinia-related figures; Dr Frieda Kage (Geisel School of Medicine at Dartmouth, Hanover, NH) for fruitful discussions; and Brigitte Denker for excellent technical assistance.
Footnotes
Competing interests
The authors declare no competing or financial interests.
Author contributions
Conceptualization: G.D., T.E.B.S., M.W., M.F., K.R.; Methodology: G.D., B.A., A.C.H., M.F., K.R.; Software: G.D., B.A., M.F.; Validation: G.D., M.S., V.D., T.E.B.S., M.W., M.F., K.R.; Formal analysis: G.D., A.C.H., M.S., V.D., K.R.; Investigation: G.D., A.C.H., M.S., V.D., K.R.; Resources: G.D., M.S., T.E.B.S., J.F., M.K., M.W.; Data curation: M.W., K.R.; Writing - original draft: G.D., B.A., A.C.H., K.R.; Writing - review & editing: T.E.B.S., J.F., M.K., M.W., K.R.; Visualization: G.D., B.A.; Supervision: M.W., M.F., K.R.; Project administration: M.F., K.R.; Funding acquisition: M.W., M.F., K.R.
Funding
This work was supported in part by Deutsche Forschungsgemeinschaft (DFG) [GRK2223/1, RO2414/5-1 (to K.R.), FA350/11-1 (to M.F.) and FA330/11-1 (to J.F.)], as well as by intramural funding from the Helmholtz Association (to T.E.B.S. and K.R.). G.D. was additionally funded by the Austrian Science Fund (FWF) Lise Meitner Program [M-2495]. A.C.H. and M.W. are supported by the Francis Crick Institute, which receives its core funding from Cancer Research UK [FC001209], the Medical Research Council [FC001209] and the Wellcome Trust [FC001209]. M.K. is supported by the Biotechnology and Biological Sciences Research Council [BB/F011431/1, BB/J000590/1, BB/N000226/1]. Deposited in PMC for release after 6 months.
Supplementary information
Supplementary information available online at http://jcs.biologists.org/lookup/doi/10.1242/jcs.239020.supplemental
Peer review history
The peer review history is available online at https://jcs.biologists.org/lookup/doi/10.1242/jcs.239020.reviewer-comments.pdf
References
- Alvarez D. E. and Agaisse H. (2013). The formin FHOD1 and the small GTPase Rac1 promote vaccinia virus actin-based motility. J. Cell Biol. 202, 1075-1090. 10.1083/jcb.201303055 [DOI] [PMC free article] [PubMed] [Google Scholar]
- Arakawa Y., Cordeiro J. V., Schleich S., Newsome T. P. and Way M. (2007a). The release of vaccinia virus from infected cells requires RhoA-mDia modulation of cortical actin. Cell Host Microbe 1, 227-240. 10.1016/j.chom.2007.04.006 [DOI] [PubMed] [Google Scholar]
- Arakawa Y., Cordeiro J. V. and Way M. (2007b). F11L-mediated inhibition of RhoA-mDia signaling stimulates microtubule dynamics during vaccinia virus infection. Cell Host Microbe 1, 213-226. 10.1016/j.chom.2007.04.007 [DOI] [PubMed] [Google Scholar]
- Bachir A. I., Horwitz A. R., Nelson W. J. and Bianchini J. M. (2017). Actin-based adhesion modules mediate cell interactions with the extracellular matrix and neighboring cells. Cold Spring Harb. Perspect Biol. 9, a023234 10.1101/cshperspect.a023234 [DOI] [PMC free article] [PubMed] [Google Scholar]
- Bae Y. H., Ding Z., Das T., Wells A., Gertler F. and Roy P. (2010). Profilin1 regulates PI(3,4)P2 and lamellipodin accumulation at the leading edge thus influencing motility of MDA-MB-231 cells. Proc. Natl. Acad. Sci. USA 107, 21547-21552. 10.1073/pnas.1002309107 [DOI] [PMC free article] [PubMed] [Google Scholar]
- Bae Y. H., Mui K. L., Hsu B. Y., Liu S.-L., Cretu A., Razinia Z., Xu T., Pure E. and Assoian R. K. (2014). A FAK-Cas-Rac-lamellipodin signaling module transduces extracellular matrix stiffness into mechanosensitive cell cycling. Sci. Signal. 7, ra57 10.1126/scisignal.2004838 [DOI] [PMC free article] [PubMed] [Google Scholar]
- Biesova Z., Piccoli C. and Wong W. T. (1997). Isolation and characterization of e3B1, an eps8 binding protein that regulates cell growth. Oncogene 14, 233-241. 10.1038/sj.onc.1200822 [DOI] [PubMed] [Google Scholar]
- Bodo C., Fernandes C. and Krause M. (2017). Brain specific Lamellipodin knockout results in hyperactivity and increased anxiety of mice. Sci. Rep. 7, 5365 10.1038/s41598-017-05043-3 [DOI] [PMC free article] [PubMed] [Google Scholar]
- Boucrot E., Ferreira A. P. A., Almeida-Souza L., Debard S., Vallis Y., Howard G., Bertot L., Sauvonnet N. and McMahon H. T. (2015). Endophilin marks and controls a clathrin-independent endocytic pathway. Nature 517, 460-465. 10.1038/nature14067 [DOI] [PubMed] [Google Scholar]
- Burnette D. T., Manley S., Sengupta P., Sougrat R., Davidson M. W., Kachar B. and Lippincott-Schwartz J. (2011). A role for actin arcs in the leading-edge advance of migrating cells. Nat. Cell Biol. 13, 371-381. 10.1038/ncb2205 [DOI] [PMC free article] [PubMed] [Google Scholar]
- Carmona G., Perera U., Gillett C., Naba A., Law A.-L., Sharma V. P., Wang J., Wyckoff J., Balsamo M., Mosis F. et al. (2016). Lamellipodin promotes invasive 3D cancer cell migration via regulated interactions with Ena/VASP and SCAR/WAVE. Oncogene 35, 5155-5169. 10.1038/onc.2016.47 [DOI] [PMC free article] [PubMed] [Google Scholar]
- Chan Wah Hak L., Khan S., Di Meglio I., Law A.-L., Lucken-Ardjomande Häsler S., Quintaneiro L. M., Ferreira A. P. A., Krause M., McMahon H. T. and Boucrot E. (2018). FBP17 and CIP4 recruit SHIP2 and lamellipodin to prime the plasma membrane for fast endophilin-mediated endocytosis. Nat. Cell Biol. 20, 1023-1031. 10.1038/s41556-018-0146-8 [DOI] [PMC free article] [PubMed] [Google Scholar]
- Coló G. P., Lafuente E. M. and Teixidó J. (2012). The MRL proteins: adapting cell adhesion, migration and growth. Eur. J. Cell Biol. 91, 861-868. 10.1016/j.ejcb.2012.03.001 [DOI] [PubMed] [Google Scholar]
- Dimchev G. and Rottner K. (2018). Micromanipulation techniques allowing analysis of morphogenetic dynamics and turnover of cytoskeletal regulators. J. Vis. Exp. e57643 10.3791/57643 [DOI] [PMC free article] [PubMed] [Google Scholar]
- Dimchev G., Steffen A., Kage F., Dimchev V., Pernier J., Carlier M.-F. and Rottner K. (2017). Efficiency of lamellipodia protrusion is determined by the extent of cytosolic actin assembly. Mol. Biol. Cell 28, 1311-1325. 10.1091/mbc.e16-05-0334 [DOI] [PMC free article] [PubMed] [Google Scholar]
- Dolati S., Kage F., Mueller J., Müsken M., Kirchner M., Dittmar G., Sixt M., Rottner K. and Falcke M. (2018). On the relation between filament density, force generation, and protrusion rate in mesenchymal cell motility. Mol. Biol. Cell 29, 2674-2686. 10.1091/mbc.E18-02-0082 [DOI] [PMC free article] [PubMed] [Google Scholar]
- Enculescu M., Sabouri-Ghomi M., Danuser G. and Falcke M. (2010). Modeling of protrusion phenotypes driven by the actin-membrane interaction. Biophys. J. 98, 1571-1581. 10.1016/j.bpj.2009.12.4311 [DOI] [PMC free article] [PubMed] [Google Scholar]
- Frischknecht F., Cudmore S., Moreau V., Reckmann I., Röttger S. and Way M. (1999a). Tyrosine phosphorylation is required for actin-based motility of vaccinia but not Listeria or Shigella. Curr. Biol. 9, 89-92. 10.1016/S0960-9822(99)80020-7 [DOI] [PubMed] [Google Scholar]
- Frischknecht F., Moreau V., Röttger S., Gonfloni S., Reckmann I., Superti-Furga G. and Way M. (1999b). Actin-based motility of vaccinia virus mimics receptor tyrosine kinase signalling. Nature 401, 926-929. 10.1038/44860 [DOI] [PubMed] [Google Scholar]
- Gholami A., Falcke M. and Frey E. (2008). Velocity oscillations in actin-based motility. New J. Phys. 10, 033022 10.1088/1367-2630/10/3/033022 [DOI] [Google Scholar]
- Giannone G., Dubin-Thaler B. J., Döbereiner H.-G., Kieffer N., Bresnick A. R. and Sheetz M. P. (2004). Periodic lamellipodial contractions correlate with rearward actin waves. Cell 116, 431-443. 10.1016/S0092-8674(04)00058-3 [DOI] [PubMed] [Google Scholar]
- Giannone G., Dubin-Thaler B. J., Rossier O., Cai Y., Chaga O., Jiang G., Beaver W., Döbereiner H.-G., Freund Y., Borisy G. et al. (2007). Lamellipodial actin mechanically links myosin activity with adhesion-site formation. Cell 128, 561-575. 10.1016/j.cell.2006.12.039 [DOI] [PMC free article] [PubMed] [Google Scholar]
- Grosse R., Copeland J. W., Newsome T. P., Way M. and Treisman R. (2003). A role for VASP in RhoA-Diaphanous signalling to actin dynamics and SRF activity. EMBO J. 22, 3050-3061. 10.1093/emboj/cdg287 [DOI] [PMC free article] [PubMed] [Google Scholar]
- Hansen S. D. and Mullins R. D. (2015). Lamellipodin promotes actin assembly by clustering Ena/VASP proteins and tethering them to actin filaments. Elife 4, e06585 10.7554/eLife.06585.032 [DOI] [PMC free article] [PubMed] [Google Scholar]
- Hiller G. and Weber K. (1985). Golgi-derived membranes that contain an acylated viral polypeptide are used for vaccinia virus envelopment. J. Virol. 55, 651-659. 10.1128/JVI.55.3.651-659.1985 [DOI] [PMC free article] [PubMed] [Google Scholar]
- Humphries A. C., Donnelly S. K. and Way M. (2014). Cdc42 and the Rho GEF intersectin-1 collaborate with Nck to promote N-WASP-dependent actin polymerisation. J. Cell Sci. 127, 673-685. 10.1242/jcs.141366 [DOI] [PubMed] [Google Scholar]
- Innocenti M., Zucconi A., Disanza A., Frittoli E., Areces L. B., Steffen A., Stradal T. E. B., Di Fiore P. P., Carlier M.-F. and Scita G. (2004). Abi1 is essential for the formation and activation of a WAVE2 signalling complex. Nat. Cell Biol. 6, 319-327. 10.1038/ncb1105 [DOI] [PubMed] [Google Scholar]
- Innocenti M., Gerboth S., Rottner K., Lai F. P. L., Hertzog M., Stradal T. E. B., Frittoli E., Didry D., Polo S., Disanza A. et al. (2005). Abi1 regulates the activity of N-WASP and WAVE in distinct actin-based processes. Nat. Cell Biol. 7, 969-976. 10.1038/ncb1304 [DOI] [PubMed] [Google Scholar]
- Jenzora A., Behrendt B., Small J. V., Wehland J. and Stradal T. E. B. (2005). PREL1 provides a link from Ras signalling to the actin cytoskeleton via Ena/VASP proteins. FEBS Lett. 579, 455-463. 10.1016/j.febslet.2004.10.110 [DOI] [PubMed] [Google Scholar]
- Kage F., Winterhoff M., Dimchev V., Mueller J., Thalheim T., Freise A., Bruhmann S., Kollasser J., Block J., Dimchev G. A. et al. (2017). FMNL formins boost lamellipodial force generation. Nat. Commun. 8, 14832 10.1038/ncomms14832 [DOI] [PMC free article] [PubMed] [Google Scholar]
- Koestler S. A., Auinger S., Vinzenz M., Rottner K. and Small J. V. (2008). Differentially oriented populations of actin filaments generated in lamellipodia collaborate in pushing and pausing at the cell front. Nat. Cell Biol. 10, 306-313. 10.1038/ncb1692 [DOI] [PubMed] [Google Scholar]
- Krause M. and Gautreau A. (2014). Steering cell migration: lamellipodium dynamics and the regulation of directional persistence. Nat. Rev. Mol. Cell Biol. 15, 577-590. 10.1038/nrm3861 [DOI] [PubMed] [Google Scholar]
- Krause M., Leslie J. D., Stewart M., Lafuente E. M., Valderrama F., Jagannathan R., Strasser G. A., Rubinson D. A., Liu H., Way M. et al. (2004). Lamellipodin, an Ena/VASP ligand, is implicated in the regulation of lamellipodial dynamics. Dev. Cell 7, 571-583. 10.1016/j.devcel.2004.07.024 [DOI] [PubMed] [Google Scholar]
- Lagarrigue F., Vikas Anekal P., Lee H.-S., Bachir A. I., Ablack J. N., Horwitz A. F. and Ginsberg M. H. (2015). A RIAM/lamellipodin-talin-integrin complex forms the tip of sticky fingers that guide cell migration. Nat. Commun. 6, 8492 10.1038/ncomms9492 [DOI] [PMC free article] [PubMed] [Google Scholar]
- Law A.-L., Vehlow A., Kotini M., Dodgson L., Soong D., Theveneau E., Bodo C., Taylor E., Navarro C., Perera U. et al. (2013). Lamellipodin and the Scar/WAVE complex cooperate to promote cell migration in vivo. J. Cell Biol. 203, 673-689. 10.1083/jcb.201304051 [DOI] [PMC free article] [PubMed] [Google Scholar]
- Lebrand C., Dent E. W., Strasser G. A., Lanier L. M., Krause M., Svitkina T. M., Borisy G. G. and Gertler F. B. (2004). Critical role of Ena/VASP proteins for filopodia formation in neurons and in function downstream of netrin-1. Neuron 42, 37-49. 10.1016/S0896-6273(04)00108-4 [DOI] [PubMed] [Google Scholar]
- Lee H.-S., Lim C. J., Puzon-McLaughlin W., Shattil S. J. and Ginsberg M. H. (2009). RIAM activates integrins by linking talin to ras GTPase membrane-targeting sequences. J. Biol. Chem. 284, 5119-5127. 10.1074/jbc.M807117200 [DOI] [PMC free article] [PubMed] [Google Scholar]
- Machacek M. and Danuser G. (2006). Morphodynamic profiling of protrusion phenotypes. Biophys. J. 90, 1439-1452. 10.1529/biophysj.105.070383 [DOI] [PMC free article] [PubMed] [Google Scholar]
- Michael M., Vehlow A., Navarro C. and Krause M. (2010). c-Abl, Lamellipodin, and Ena/VASP proteins cooperate in dorsal ruffling of fibroblasts and axonal morphogenesis. Curr. Biol. 20, 783-791. 10.1016/j.cub.2010.03.048 [DOI] [PMC free article] [PubMed] [Google Scholar]
- Moreau V., Frischknecht F., Reckmann I., Vincentelli R., Rabut G., Stewart D. and Way M. (2000). A complex of N-WASP and WIP integrates signalling cascades that lead to actin polymerization. Nat. Cell Biol. 2, 441-448. 10.1038/35017080 [DOI] [PubMed] [Google Scholar]
- Nobes C. D. and Hall A. (1995). Rho, rac, and cdc42 GTPases regulate the assembly of multimolecular focal complexes associated with actin stress fibers, lamellipodia, and filopodia. Cell 81, 53-62. 10.1016/0092-8674(95)90370-4 [DOI] [PubMed] [Google Scholar]
- Olazabal I. M., Caron E., May R. C., Schilling K., Knecht D. A. and Machesky L. M. (2002). Rho-kinase and myosin-II control phagocytic cup formation during CR, but not FcγR, phagocytosis. Curr. Biol. 12, 1413-1418. 10.1016/S0960-9822(02)01069-2 [DOI] [PubMed] [Google Scholar]
- Omotade O. F., Pollitt S. L. and Zheng J. Q. (2017). Actin-based growth cone motility and guidance. Mol. Cell. Neurosci. 84, 4-10. 10.1016/j.mcn.2017.03.001 [DOI] [PMC free article] [PubMed] [Google Scholar]
- Pula G. and Krause M. (2008). Role of Ena/VASP proteins in homeostasis and disease. Handb. Exp. Pharmacol. 39-65. 10.1007/978-3-540-72843-6_3 [DOI] [PubMed] [Google Scholar]
- Rakeman A. S. and Anderson K. V. (2006). Axis specification and morphogenesis in the mouse embryo require Nap1, a regulator of WAVE-mediated actin branching. Development 133, 3075-3083. 10.1242/dev.02473 [DOI] [PubMed] [Google Scholar]
- Rottner K. and Schaks M. (2019). Assembling actin filaments for protrusion. Curr. Opin. Cell Biol. 56, 53-63. 10.1016/j.ceb.2018.09.004 [DOI] [PubMed] [Google Scholar]
- Rottner K., Behrendt B., Small J. V. and Wehland J. (1999a). VASP dynamics during lamellipodia protrusion. Nat. Cell Biol. 1, 321-322. 10.1038/13040 [DOI] [PubMed] [Google Scholar]
- Rottner K., Hall A. and Small J. V. (1999b). Interplay between Rac and Rho in the control of substrate contact dynamics. Curr. Biol. 9, 640-648. 10.1016/S0960-9822(99)80286-3 [DOI] [PubMed] [Google Scholar]
- Rottner K., Krause M., Gimona M., Small J. V. and Wehland J. (2001). Zyxin is not colocalized with vasodilator-stimulated phosphoprotein (VASP) at lamellipodial tips and exhibits different dynamics to vinculin, paxillin, and VASP in focal adhesions. Mol. Biol. Cell 12, 3103-3113. 10.1091/mbc.12.10.3103 [DOI] [PMC free article] [PubMed] [Google Scholar]
- Rottner K., Faix J., Bogdan S., Linder S. and Kerkhoff E. (2017). Actin assembly mechanisms at a glance. J. Cell Sci. 130, 3427-3435. 10.1242/jcs.206433 [DOI] [PubMed] [Google Scholar]
- Schaks M., Singh S. P., Kage F., Thomason P., Klunemann T., Steffen A., Blankenfeldt W., Stradal T. E., Insall R. H. and Rottner K. (2018). Distinct interaction sites of Rac GTPase with WAVE regulatory complex have non-redundant functions in vivo. Curr. Biol. 28, 3674-3684.e6. 10.1016/j.cub.2018.10.002 [DOI] [PMC free article] [PubMed] [Google Scholar]
- Smith K., Humphreys D., Hume P. J. and Koronakis V. (2010a). Enteropathogenic Escherichia coli recruits the cellular inositol phosphatase SHIP2 to regulate actin-pedestal formation. Cell Host Microbe 7, 13-24. 10.1016/j.chom.2009.12.004 [DOI] [PubMed] [Google Scholar]
- Smith M. B., Li H., Shen T., Huang X., Yusuf E. and Vavylonis D. (2010b). Segmentation and tracking of cytoskeletal filaments using open active contours. Cytoskeleton 67, 693-705. 10.1002/cm.20481 [DOI] [PMC free article] [PubMed] [Google Scholar]
- Steffen A., Rottner K., Ehinger J., Innocenti M., Scita G., Wehland J. and Stradal T. E. B. (2004). Sra-1 and Nap1 link Rac to actin assembly driving lamellipodia formation. EMBO J. 23, 749-759. 10.1038/sj.emboj.7600084 [DOI] [PMC free article] [PubMed] [Google Scholar]
- Steffen A., Ladwein M., Dimchev G. A., Hein A., Schwenkmezger L., Arens S., Ladwein K. I., Holleboom J. M., Schur F., Small J. V. et al. (2013). Rac function is crucial for cell migration but is not required for spreading and focal adhesion formation. J. Cell Sci. 126, 4572-4588. 10.1242/jcs.118232 [DOI] [PMC free article] [PubMed] [Google Scholar]
- Sugihara K., Nakatsuji N., Nakamura K., Nakao K., Hashimoto R., Otani H., Sakagami H., Kondo H., Nozawa S., Aiba A. et al. (1998). Rac1 is required for the formation of three germ layers during gastrulation. Oncogene 17, 3427-3433. 10.1038/sj.onc.1202595 [DOI] [PubMed] [Google Scholar]
- Vehlow A., Soong D., Vizcay-Barrena G., Bodo C., Law A.-L., Perera U. and Krause M. (2013). Endophilin, Lamellipodin, and Mena cooperate to regulate F-actin-dependent EGF-receptor endocytosis. EMBO J. 32, 2722-2734. 10.1038/emboj.2013.212 [DOI] [PMC free article] [PubMed] [Google Scholar]
- Wang J., King J. E., Goldrick M., Lowe M., Gertler F. B. and Roberts I. S. (2015). Lamellipodin is important for cell-to-cell spread and actin-based motility in listeria monocytogenes. Infect. Immun. 83, 3740-3748. 10.1128/IAI.00193-15 [DOI] [PMC free article] [PubMed] [Google Scholar]
- Wang C., Choi H. J., Kim S.-J., Desai A., Lee N., Kim D., Bae Y. and Lee K. (2018). Deconvolution of subcellular protrusion heterogeneity and the underlying actin regulator dynamics from live cell imaging. Nat. Commun. 9, 1688 10.1038/s41467-018-04030-0 [DOI] [PMC free article] [PubMed] [Google Scholar]
- Watanabe N., Bodin L., Pandey M., Krause M., Coughlin S., Boussiotis V. A., Ginsberg M. H. and Shattil S. J. (2008). Mechanisms and consequences of agonist-induced talin recruitment to platelet integrin αIIbβ3. J. Cell Biol. 181, 1211-1222. 10.1083/jcb.200803094 [DOI] [PMC free article] [PubMed] [Google Scholar]
- Welch M. D. and Way M. (2013). Arp2/3-mediated actin-based motility: a tail of pathogen abuse. Cell Host Microbe 14, 242-255. 10.1016/j.chom.2013.08.011 [DOI] [PMC free article] [PubMed] [Google Scholar]
- Yamazaki D., Suetsugu S., Miki H., Kataoka Y., Nishikawa S.-I., Fujiwara T., Yoshida N. and Takenawa T. (2003). WAVE2 is required for directed cell migration and cardiovascular development. Nature 424, 452-456. 10.1038/nature01770 [DOI] [PubMed] [Google Scholar]
- Zimmermann J. and Falcke M. (2014). Formation of transient lamellipodia. PLoS ONE 9, e87638 10.1371/journal.pone.0087638 [DOI] [PMC free article] [PubMed] [Google Scholar]
Associated Data
This section collects any data citations, data availability statements, or supplementary materials included in this article.