

Abstract
To address the most appropriate endogenous biomarker for drug–drug interaction risk assessment, eight healthy subjects received an organic anion transporting polypeptide 1B (OATP1B) inhibitor (rifampicin, 150, 300, and 600 mg), and a probe drug cocktail (atorvastatin, pitavastatin, rosuvastatin, and valsartan). In addition to coproporphyrin I, a widely studied OATP1B biomarker, we identified at least 4 out of 28 compounds (direct bilirubin, glycochenodeoxycholate‐3‐glucuronide, glycochenodeoxycholate‐3‐sulfate, and hexadecanedioate) that presented good sensitivity and dynamic range in terms of the rifampicin dose‐dependent change in area under the plasma concentration‐time curve ratio (AUCR). Their suitability as OATP1B biomarkers was also supported by the good correlation of AUC0‐24h between the endogenous compounds and the probe drugs, and by nonlinear regression analysis (AUCR−1 vs. rifampicin plasma Cmax (maximum total concentration in plasma)) to yield an estimate of the inhibition constant of rifampicin. These endogenous substrates can complement existing OATP1B‐mediated drug–drug interaction risk assessment approaches based on agency guidelines in early clinical trials.
Study Highlights.
WHAT IS THE CURRENT KNOWLEDGE ON THE TOPIC?
☑ Circulating endogenous organic anion transporting polypeptide 1B (OATP1B) substrates can be considered as surrogate probes to support clinical drug–drug interaction (DDI) assessment and may obviate the need for drug probe dosing.
WHAT QUESTION DID THIS STUDY ADDRESS?
☑ The sensitivity of the area under the plasma concentration‐time curve (AUC) of 28 different circulating endogenous compounds in response to different degrees of OATP1B inhibition.
WHAT DOES THIS STUDY ADD TO OUR KNOWLEDGE?
☑ AUC ratio (AUCR) of five endogenous compounds (direct bilirubins, coproporphyrin I, glycochenodeoxycholate‐3‐sulfate, glycochenodeoxycholate‐3‐glucuronide, and hexadecanedioic acid) discriminated the dose‐dependent effects of rifampicin in healthy subjects. These endogenous biomarkers have potential to perform as well as the probe drugs and support the derivation of estimates of apparent inhibition constant for rifampicin in vivo.
HOW MIGHT THIS CHANGE CLINICAL PHARMACOLOGY AND THERAPEUTICS?
☑ The endogenous biomarkers can complement existing OATP1B‐mediated DDI risk assessment approaches based on agency guidelines in early clinical trials to de‐risk OATP1B inhibition. In addition, the bioanalysis of these various endogenous compounds can support robust OATP1B phenotyping of subjects.
For new chemical entities (NCEs), their potential to perpetrate pharmacokinetic drug–drug interactions (DDIs) with other drugs is routinely evaluated in drug development guided by agency‐governed decision trees. Such trees can support decision making and NCE drug‐development strategies (e.g., DDI study prioritization) and facilitate DDI risk assessment. For example, it is now common practice to obtain in vitro inhibition data (inhibition constant (Ki) or half maximal inhibitory concentration) for human hepatic organic anion transporting polypeptide 1B (OATP1B), comprised of two homologs, OATP1B1/SLCO1B1 and OATP1B3/SLCO1B3, estimate maximal unbound portal drug concentration, and apply agency DDI risk cutoffs to determine if a formal clinical drug probe‐based DDI study is warranted.1 Unfortunately, in vitro‐to‐in vivo extrapolations can be problematic and in vitro results can be impacted by experimental conditions and the NCE's physicochemical properties. Additionally, estimates of portal NCE's concentration in preclinical stage can be fraught with uncertainty. It is not surprising, therefore, that agency decision tree‐based DDI risk assessments have been shown to report out numerous false positive and false negative results.1 As a result, investigators have turned their attention to various circulating endogenous compounds as potential OATP1B biomarkers. It is envisioned that such biomarkers could facilitate OATP1B DDI risk assessment early in phase I with the potential to circumvent the need for formal DDI studies involving probe drug administration.2, 3, 4, 5, 6 Furthermore, there is potential to evaluate DDI risk in special subject populations (e.g., diseased, pregnancy, elderly, and pediatric).
Human OATP1B plays pivotal roles in the hepatic uptake of a diverse array of anionic drugs.7, 8, 9 As expected, potent OATP1B inhibitors, such as cyclosporine A and rifampicin, have been shown to increase (2‐fold to 16‐fold) the area under the plasma concentration‐time curve (AUC) of OATP1B substrate drugs (UW Drug Interaction Database Program, https://www.druginteractioninfo.org/). We and other groups have demonstrated significant increases in the plasma concentrations of endogenous substrates such as bilirubins, coproporphyrins, amidated and nonamidated bile acids (including glucuronide and sulfate conjugates), and dicarboxylates following a single dose of cyclosporine A, rifampicin, and selected NCEs with OATP1B inhibition potential.10, 11, 12, 13, 14, 15, 16 Furthermore, the plasma concentrations of some of these endogenous substrates were associated with SLCO1B1 genotype, as those of the statins were.13, 14, 17 These cumulative data indicate that endogenous substrates could be used to support OATP1B subject phenotyping and DDI risk assessment. As a result, various investigators have studied endogenous substrates following a single dose of cyclosporin A (100 mg) or rifampicin (600 mg); comparisons have been made to various statin probe drugs, such as rosuvastatin.10, 11, 14, 18 However, there are only few reports describing the dose‐dependent effects of an OATP1B inhibitor, such as rifampicin. For example, the AUC ratio (rifampicin vs. placebo, AUCR) of total bilirubins was similar at a rifampicin dose of 300 and 600 mg, whereas the AUCR of coproporphyrin I (CP‐I), direct bilirubins (D‐BIL), and glycochenodeoxycholate‐3‐sulfate (GCDCA‐S), as well as atorvastatin, was dose dependent.16 To further assess the performance of 28 different circulating candidate OATP1B biomarkers selected based on published preclinical and clinical data (Table S1 ), we designed a clinical study employing healthy subjects who received three single ascending doses of rifampicin in a crossover fashion. As reference compounds, four OATP1B substrate drugs (atorvastatin, pitavastatin, rosuvastatin, and valsartan) were administered simultaneously; the major clearance pathway of which is hepatic elimination by metabolism (atorvastatin) or biliary excretion (pitavastatin, rosuvastatin, and valsartan).19, 20, 21, 22
To our knowledge, this is the most comprehensive clinical assessment of the dose‐dependent inhibition of OATP1B to date, and we were able to identify three new OATP1B biomarkers (glycodeoxycholate‐3‐sulfate (GDCA‐S), glycodeoxycholate‐3‐glucuronide (GDCA‐G), and glycochenodeoxycholate‐3‐glucuronide, (GCDCA‐G)). Importantly, the performance of CP‐I, a widely studied OATP1B biomarker, was confirmed, and at least four additional biomarkers (D‐BIL, GCDCA‐G, GCDCA‐S, and hexadecanedioic acid (HDA)) were able to readily distinguish OATP1B inhibition by rifampicin at three different dose levels.
Methods
Chemicals
Authentic compounds, including stable isotope‐labeled compounds used in this study, were all commercially available (listed in Supplemental Methods ). Other reagents and organic solvents were of a commercially available analytical grade.
Participants
Eight healthy male Japanese volunteers were enrolled with an age range of 26–36 years, body mass index 19.1–24.8, height 162–185 cm, and weight 53.5–71.7 kg. The volunteer participants did not manifest any abnormality by medical examination or blood or biochemical tests.
Clinical study design
The study protocol was approved by the ethical review boards of P‐One Clinic, Keikokai Medical Corporation and the Graduate School of Pharmaceutical Sciences, the University of Tokyo. The study was registered in the UMIN Clinical Trials Registry at http://www.umin.ac.jp/ctr/index.htm (UMIN000028684). All participants gave their written informed consent to participate in this three‐phase crossover study. This was an open‐label, dual‐sequence, four‐phase crossover study. The schedules of dosing, and blood sampling are both described in the Supplemental Methods .
LC‐MS/MS analysis of drugs
Plasma samples analyzed by liquid chromatography with tandem mass spectrometry (LC‐MS/MS) were prepared by protein precipitation as described previously.17 Valsartan was analyzed on the same chromatographic condition ( Supplemental Methods ) using valsartan‐d9 as internal standard. The multiple reaction monitoring precursor/product ion transitions are summarized in Supplemental Methods . Calibration curve range and lower limit of quantification were summarized in Supplemental Methods .
Quantification of endogenous substrates
Total and D‐BIL were quantified as reported previously by enzymatic methods using Iatro LQ T‐BIL and Iatro LQ D‐BIL (LSI Medience, Tokyo, Japan), respectively, according to the manufacturer's protocols, as describe previously.16
Other compounds, except for GCDCA‐S, GDCA‐S, GCDCA‐G and GDCA‐G, in the plasma samples were analyzed using LC‐MS/MS. Plasma samples were prepared by protein precipitation as described previously.17 Chromatography was performed on a Prominence LC system, or Nexera X2 LC system (Shimadzu, Kyoto, Japan). Liquid chromatographic conditions were summarized in Supplemental Methods . Note that we modified chromatographic conditions for the bile acids16, 17 to separate the stereoisomers. Data were collected on an AB Sciex API5500 (QTRAP) mass spectrometer (Foster City, CA) operated in electrospray ionization mode. The multiple reaction monitoring precursor/product ion transitions are summarized in Supplemental Methods .
LC‐MS/MS analysis of GCDCA‐S, GDCA‐S, GCDCA‐G, and GDCA‐G
Plasma samples were prepared by protein precipitation as follows: In brief, 50 µL of plasma samples, standards, and blanks were precipitated with 400 µL of acetonitrile containing internal standard tolbutamide at 50nM. After centrifugation, supernatant (300 µL) was dried under nitrogen at 38°C. Samples were reconstituted in 100 µL of 1:1 methanol: water and 15–20 µL of this sample was analyzed by LC‐MS/MS. Chromatography was performed on a Waters Acquity UPLC System (Milford, MA). Separation was achieved as described in Supplemental Methods . Data were collected on an AB Sciex TripleTOF 6600 (Framingham, MA) ( Supplemental Methods ). Data acquisition and processing were carried out with Analyst software version 1.6.2 (Applied Biosystems/MDS Sciex, Canada). Additional information describing the quantitation of GCDCA‐G and GDCA‐G in human plasma has been described.23
Pharmacokinetic analysis
Cmax represents the maximum plasma concentrations observed. AUC was calculated from time zero to 24 hour or infinity. When the concentration was below the lower limit of quantification at 24 hours postdosing, it was estimated by extrapolation of the three timepoints assuming first‐order kinetics. The oral clearance (CLtot/F) was calculated as follows:
K i,app and f RIF were obtained by iterative nonlinear least squares method (Prism8, GraphPad Software, CA) using the following equation under constraint of 0 < f RIF ≤ 1, and K i,app > 0.
where f RIF, Cmax, and fin represent the fraction sensitive to inhibition by rifampicin, observed maximum plasma concentrations of rifampicin in each subject, and apparent inhibition constant of rifampicin with regard to the total concentration, respectively.
Statistical analysis
Natural log transformed AUC (drug probe), Cmax (drug probe), and AUC (endogenous compound) were analyzed using a mixed effect model with sequence and treatment as fixed effects and subject within sequence as a random effect. Estimates of the adjusted mean differences (test‐reference), and corresponding 90% confidence intervals, were obtained from the model. The adjusted mean differences and 90% confidence intervals for the differences were exponentiated to provide estimates of the ratio of adjusted geometric means (test/reference) and 90% confidence intervals for the ratios.
Results
Rifampicin plasma concentrations and its impact on probe drugs
The peak plasma concentrations (Cmax, μM) of rifampicin were 4.78 ± 0.29, 12.4 ± 1.4 and 22.8 ± 2.6 (mean ± SEM) when the volunteers received 150, 300, and 600 mg single doses of rifampicin, respectively (Figure 1). Following rifampicin doses of 150, 300, and 600 mg, the period of time that its plasma concentrations exceeded the in vivo K i for OATP1B corrected by unbound fraction (3.29 μM24) was 4, 6, and 12 hours, respectively (Figure 1). At each dose level, the corresponding rifampicin AUC0‐24h (μM × h) values were 19.8 ± 1.2, 55.5 ± 3.4, and 141 ± 9.
Figure 1.
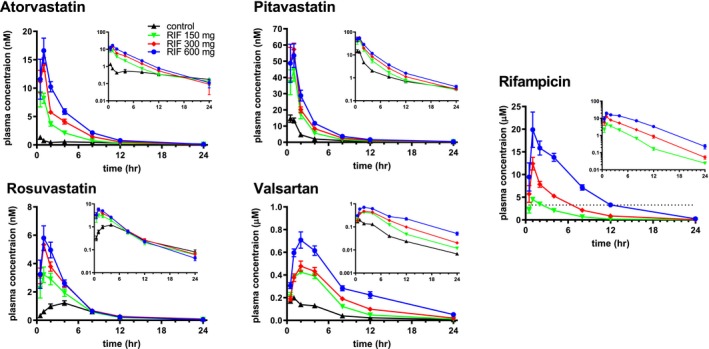
Effect of rifampicin on the plasma concentrations of OATP1B (organic anion transporting polypeptide 1B) probe drugs. Plasma concentrations of the probe drugs and rifampicin were determined at designated times in healthy volunteers treated with or without an oral dose of rifampicin (150, 300, and 600 mg). Each symbol represents the mean and SEM (n = 8). Inset represents semilogarithmic plots. Each symbol and vertical bar represent the mean and SEM (n = 8), respectively. Horizontal dotted line represents the in vivo K i ,app (apparent inhibition constant) (3.3 µM) of rifampicin for OATP1B inhibition.20 RIF, rifampicin.
Administration of rifampicin significantly increased the plasma concentrations of all the OATP1B probe drugs (Figure 1). The effect of rifampicin on the geometric mean ratio of AUC (AUCR; rifampicin / placebo control) was dose dependent for atorvastatin, pitavastatin, and valsartan, whereas rifampicin 600 mg did not further increase the AUC of rosuvastatin (Figure 2). The effect of rifampicin on the ratio of Cmax was dose‐dependent except for pitavastatin (Figure 2). Pharmacokinetic parameters, Cmax, and AUC0‐24h of the probe drugs are summarized in Table S2 .
Figure 2.

AUCR (area under the plasma concentration‐time curve ratio) and Cmax (maximum total concentration in plasma) ratio with 90% confidence interval assuming log normal distribution of the probe drugs. AUC0‐24h was used to calculate AUCR. RIF, rifampicin.
Effect of rifampicin on the plasma concentrations of endogenous compounds
Concentrations of 28 different endogenous compounds were determined in plasma, which included the endogenous OATP1B substrates, and their related compounds such as C4 (intermediate metabolite in bile acid synthesis), sebacicate, and dodecanedioate (other dicarboxylates) (Figure 3). Diurnal variation, and interday variation in the plasma concentrations of endogenous compounds were summarized in Table S3 and Figure S2 , and Table S4 , respectively.
Figure 3.

Effect of rifampicin on the plasma concentration time profiles of various endogenous substrates. Plasma concentrations of the endogenous substrates were determined at designated times in healthy volunteers treated with or without an oral dose of rifampicin (150, 300, and 600 mg). Each symbol and vertical bar represent the mean and SEM (n = 8), respectively. C4, 7‐hydroxy‐4cholesten‐3‐one; CA, cholate; CDCA, chenodeoxycholate; CDCA‐24G, chenodeoxycholate‐24‐glucuronide; CP‐I, coproporphyrin I; D‐Bil, direct bilirubins; DCA, deoxycholate; GCA, glycocholate; GCDCA, glycochenodexoxycholate; GCDCA‐G, glycochenodeoxycholate‐3‐glucuronide; GCDCA‐S, glycochenodeoxycholate‐3‐sulfate; GDCA, glycodeoxycholate; GDCA‐G, glycodeoxycholate‐3‐glucuronide; GDCA‐S, glycodeoxycholate‐3‐sulfate; GLCA, glycolithocholate; GLCA‐S, glycolithocholate‐3‐sulfate; HDA, hexadecanedioic acid; LCA‐S, lithocholate‐3‐sulfate; ODA, octadecanedioate; T‐Bil, total bilirubins; TCA, taurocholate; TCDCA, taurochenodeoxycholate; TDA, tetradecanedioate; TDCA, taurodeoxycholate; TLCA‐S, taurolithocholate‐3‐sulfate; TUDCA, tauroursodeoxycholate.
As part of the analysis, AUC0‐24h values were compared for two consecutive days to assess the impact, if any, that the probe drug cocktail may have on endogenous compound exposure baseline and control values based on exposures in absence and presence of probe drug cocktail, respectively (Figure 4, Table S5 ). Endogenous compound control/baseline AUCR values ranged from 0.85 to 1.39, with an AUCR > 1.25 observed for bile acids, such as glycocholate (GCA), glycochenodexoxycholate (GCDCA), taurochenodeoxycholate (TCDCA), taurodeoxycholate (TDCA), GDCA‐G, and CDCA‐24G.
Figure 4.

AUCR (area under the plasma concentration‐time curve ratio) with 90% confidence interval assuming log normal distribution of various endogenous substrates with increasing dose of rifampicin. AUC0‐24h was used to calculate AUCR. C4, 7‐hydroxy‐4‐cholesten‐3‐one; CA, cholate; CDCA, chenodeoxycholate; CDCA‐24G, chenodeoxycholate‐24‐glucuronide; CP‐I, coproporphyrin I; D‐Bil, direct bilirubins; DCA, deoxycholate; GCA, glycocholate; GCDCA, glycochenodexoxycholate; GCDCA‐G, glycochenodeoxycholate‐3‐glucuronide; GCDCA‐S, glycochenodeoxycholate‐3‐sulfate; GDCA, glycochenodeoxycholate; GDCA‐G, glycodeoxycholate‐3‐glucuronide; GDCA‐S, glycodeoxycholate‐3‐sulfate; GLCA, glycolithocholate; GLCA‐S, glycolithocholate‐3‐sulfate; HDA, hexadecanedioic acid; LCA‐S, lithocholate‐3‐sulfate; RIF, rifampicin; T‐Bil, total bilirubins; TCA, taurocholate; TCDCA, taurochenodeoxycholate; TDA, tetradecanedioate; TDCA, taurodeoxycholate; TLCA‐S, taurolithocholate‐3‐sulfate; TUDCA, tauroursodeoxycholate.
Rifampicin dose dependence and its impact on AUCR differed across the endogenous compounds (Figure 4). Evidently, AUCR of D‐BIL, CP‐I, GCDCA‐S, GCDCA‐G, CDCA‐24G, and HDA showed a clear separation among the four conditions (Figure 4, Table S5). Among the other endogenous compounds, of which the AUCR was greater than 2 at 600 mg rifampicin, GDCA‐S, GDCA‐G, glycolithocholate‐3‐sulfate (GLCA‐S), and taurolithocholate‐3‐sulfate (TLCA‐S) presented a relatively large 90% confidence interval (difference of the upper or lower limit from the mean value > 50%) at 600 mg rifampicin, and the AUCR of TDA showed no further increase beyond the 300 mg dose level (Figure 4, Table S2 ).
Correlations between the AUC0–24h of probe drugs and endogenous substrates
The pairwise Pearson correlation coefficients (r) of the four probe drugs and 28 endogenous compounds were visualized in a heat map (Figure 5). The calculated correlation coefficients, and correlation of the observed natural log transformed AUC0‐24h of the tested compounds are shown in Table S6 and Figure S3 , respectively. The AUC0‐24h of D‐BIL, CP‐I, GCDCA‐S, GCDCA‐G, CDCA‐24G, and HDA showed positive and good correlations with the probe drugs, such as atorvastatin, pitavastatin, and valsartan, (r 2 > 0.4), and with each other (r 2 > 0.4) (Figure 5 , Table S6). Additionally, GDCA‐S, GDCA‐G, LCA‐S, GLCA‐S, and TLCA‐S were well correlated with each other.
Figure 5.

Pearson correlation heatmap of probe drugs and endogenous substrates. The correlation coefficient was calculated based on the natural log transformed AUC0‐24h of 4 probe drugs and 28 biomarkers in 8 subjects with 4 periods (control, 150, 300, and 600 mg). Red indicates high positive correlation (r = 1), and blue indicates high negative correlation (r = −1). A histogram of correlations is added on the right side of heat map. C4, 7‐hydroxy‐4‐cholesten‐3‐one; CA, cholate; CDCA, chenodeoxycholate; CDCA‐24G, chenodeoxycholate‐24‐glucuronide; CP‐I, coproporphyrin I; D‐Bil, direct bilirubins; DCA, deoxycholate; GCA, glycocholate; GCDCA, glycochenodexoxycholate; GCDCA‐G, glycochenodeoxycholate‐3‐glucuronide; GCDCA‐S, glycochenodeoxycholate‐3‐sulfate; GDCA, glycodeoxycholate; GDCA‐G, glycodeoxycholate‐3‐glucuronide; GDCA‐S, glycodeoxycholate‐3‐sulfate; GLCA, glycolithocholate; GLCA‐S, glycolithocholate‐3‐sulfate; HDA, hexadecanedioic acid; LCA‐S, lithocholate‐3‐sulfate; ODA, octadecanedioate; T‐Bil, total bilirubins; TCA, taurocholate; TCDCA, taurochenodeoxycholate; TDA, tetradecanedioate; TDCA, taurodeoxycholate; TLCA‐S, taurolithocholate‐3‐sulfate; TUDCA, tauroursodeoxycholate.
Nonlinear regression analysis of AUCR‐1 and rifampicin Cmax
For some of the endogenous compounds (six most sensitive) and the four probe drugs, the relationship between AUCR‐1 and Cmax was analyzed to obtain estimates of K i,app and fraction sensitive to inhibition by rifampicin (f RIF) (Figure 6). Curve fitting‐based estimates of K i,app and f RIF are shown in Table 1.
Figure 6.

Correlation between AUCR‐1 (reciprocal of AUC ratio) and Cmax (maximum total concentration in plasma) of rifampicin. AUCR‐1 of the OATP1B substrate drugs, and endogenous compounds were plotted against Cmax of rifampicin. AUC0‐24h was used to calculate AUCR. Rigid lines represent the line that was drawn using the fitted parameters (summarized in Table 1). CDCA‐24G, chenodeoxycholate‐24‐glucuronide; CP‐I, coproporphyrin I; D‐Bil, direct bilirubins; GCDCA‐G, glycochenodeoxycholate‐3‐glucuronide; GCDCA‐S, glycochenodeoxycholate‐3‐sulfate; HDA, hexadecanedioic acid.
Table 1.
K i,app with regard to rifampicin Cmax, and f RIF of probe drugs and endogenous compounds
| Compound | K i,app (μM) | f RIF |
|---|---|---|
| Atorvastatin | 1.67 ± 0.36 | 0.918 ± 0.032 |
| Pitavastatin | 1.91 ± 0.59 | 0.810 ± 0.043 |
| Valsartan | 1.63 ± 0.45 | 0.831 ± 0.036 |
| Rosuvastatin | 4.06 ± 2.59 | 0.702 ± 0.122 |
| CP‐I | 7.51 ± 1.56 | 0.943 ± 0.072 |
| D‐BIL | 13.1 ± 5.2 | 0.976 ± 0.180 |
| CDCA‐24G | 5.98 ± 2.78 | 0.801 ± 0.124 |
| GCDCA‐S | 3.76 ± 1.03 | 1 ± 0.07 |
| GCDCA‐G | 3.38 ± 1.10 | 1 ± 0.08 |
| HDA | 4.83 ± 1.92 | 0.776 ± 0.093 |
K i,app (apparent inhibition constant) of rifampicin with regard to Cmax (total concentration in plasma) and f RIF (the fraction sensitive to inhibition by rifampicin) of probe drugs and endogenous compounds were obtained by nonlinear regression analysis, as described in Methods. CDCA‐24G, chenodeoxycholate‐24‐glucuronide; CP‐I, coproporphyrin I; D‐Bil, direct bilirubins; GCDCA‐G, glycochenodeoxycholate‐3‐glucuronide; GCDCA‐S, glycochenodeoxycholate‐3‐sulfate; HDA, hexadecanedioic acid.
Effect of transporter genotype on the plasma concentrations of the probe drugs and endogenous substrates
When segregated in terms of the most frequent single nucleotide polymorphisms of breast cancer resistance protein (BCRP) (ABCG2 421C>A), the plasma concentrations of rosuvastatin, also a BCRP substrate, were relatively high in the volunteers carrying ABCG2 mutant allele(s) (Figure S4 A). Additionally, rosuvastatin exposures were shown to be impacted to a greater extend by rifampicin in ABCG2 wild‐type (homozygotes) subjects vs. those carrying ABCG2 mutant allele(s) (Figure S4 C). In contrast, the ABCG2 genotype was shown not to affect the plasma concentration of the endogenous substrates of interest as well as any of the other probe drugs (Figure S5 ). In our study, SLCO1B1 genotype was found not to be associated with the plasma concentrations of atorvastatin, pitavastatin, valsartan, and six endogenous compounds that showed good sensitivity to rifampicin inhibition, including CP‐I, GCDCA‐S, GCDCA‐G, D‐Bil, CDCA‐24G, and HDA. However, it should be noted that no subject was genotyped homozygous for the SLCO1B1 521T>C allele (Figure S6 ).
Discussion
Comprehensive studies have been conducted to identify OATP1B endogenous biomarkers; however, most have deployed a limited rifampicin dose range, number of probe drugs, or number of endogenous compounds.10, 16 Here, we assessed the impact of OATP1B inhibition on endogenous biomarkers and probe drugs by a broader rifampicin dose range (150, 300, and 600 mg), eliciting weak to strong inhibition of OATP1B. In addition to the previously measured endogenous compounds, we also specifically measured bile acid sulfates, and two novel bile acid glucuronides as OATP1B biomarker candidates (GCDCA‐G and GDCA‐G).
To anchor our efforts to study the dose‐dependent inhibition of OATP1B, and evaluate the performance of the various candidate biomarkers, four OATP1B substrate drugs (atorvastatin, pitavastatin, rosuvastatin, and valsartan) were administered as a cocktail. For example, it was noted that AUCR of rosuvastatin no longer showed any dose response at a rifampicin dose greater than 300 mg and stood out vs. the other three probe drugs (Figure 2). The estimated K i,app of rifampicin ranged from 1.6 μM to 1.9 μM among atorvastatin, pitavastatin, and valsartan, whereas it was somewhat higher for rosuvastatin (4.1 μM) (Table 1). When corrected for protein binding (ca. 0.125), the K i,app values (0.16 μM–0.4 μM) for each drug probe were lower than those determined in vitro (0.4 μM to 1.1 μM26). In addition, the f RIF of rosuvastatin was somewhat lower than the f RIF of the other probes (Table 1), consistent with the significant contribution of urinary excretion (ca. 20%) to the systemic elimination,20 and suggested involvement of other transporters in hepatic uptake.27 Hence, the dynamic range of AUCR at high levels of hepatic OATP1B inhibition depends on the contribution of non‐OATP1B‐mediated clearance mechanisms even if they only make a small contribution (e.g., 10–20%) to overall clearance. This is the first demonstration that valsartan AUC0‐24h discriminated the dose‐dependent effects of rifampicin as atorvastatin and pitavastatin did (Figure 2), although valsartan is not listed as clinical substrate for OATP1B (https://www.fda.gov/drugs/drug-interactions-labeling/drug-development-and-drug-interactions-table-substrates-inhibitors-and-inducers#retable5-1). Valsartan is a substrate of OATP1B1 and OATP1B3 whose contribution estimated, however, varied depending on lots of human hepatocytes.21, 22
At the highest rifampicin dose (600 mg), the AUC0‐24h value for 17 endogenous substrates (out of 28 compounds) increased more than twofold; however, the sensitivity and magnitude of AUCR change differed depending on the specific endogenous compound (Figure 4 and Table S5 ). Particularly, CP‐I, D‐BIL, GCDCA‐S, GCDCA‐G, CDCA‐24G, and HDA showed excellent sensitivity. Importantly, the AUC0‐24h of these endogenous substrates and probe drugs were well correlated (r 2 > 0.4, Figure 5). It was noted that there was a 1.4‐fold difference in the AUC0‐24h of CDCA‐24G between baseline and control phases (Table S5 ), which might be due to probe drug administration or interday variation. In a different clinical study using rifampicin, CDCA‐24G was shown not to be sensitive to OATP1B inhibition.16 Hence, given the lack of reproducibility across the studies, CDCA‐24G may not withstand practical use as an OATP1B biomarker in future studies. As presented in Figure 4, the AUCR values of additional bile acid sulfates (e.g., GDCA‐S, GLCA‐S, and TLCA‐S) were also shown to increase with rifampicin dose. Such a result is consistent with in vivo cynomolgus monkey data following rifampicin and in vitro data identifying bile acid sulfates as OATP1B substrates when compared with non‐sulfated and amidated bile acids that favor sodium‐taurocholate cotransporting polypeptide.15, 28 It should be noted that similar results were obtained when AUC0‐12h were used ( Supplemental Analysis ).
For two conjugated bile acids, GCDCA‐S and GCDCA‐G, the AUCR following 600 mg rifampicin was higher (~15) than AUCR of CP‐I (3.5) and D‐BIL (2.8) as well as atorvastatin (7.3), valsartan (5.5), rosuvastatin (2.5), and pitavastatin (4.0) (Figure 4). Such a high AUCR has also been reported for asunaprevir following a single oral dose of 600 mg of rifampicin29 and is in marked contrast to the low AUCR described for other steroid sulfates such as dehydroepiandrosterone‐3‐sulfate following the same perpetrator.18 As clinical biomarkers, GCDCA‐S and GCDCA‐G have also been shown to respond to a known inhibitor NCE at doses ranging from 100 to 600 mg (AUCR 1.7–2.3); the compound was a weaker OATP1B inhibitor in vitro (vs. rifampicin) and triggered agency cutoffs for OATP1B inhibition.23 Furthermore, the K i,app of rifampicin for GCDCA‐S and GCDCA‐G was close to the K i,app for the probe drugs (Table 1). These data support that GCDCA‐S and GCDCA‐G are suitable as endogenous OATP1B biomarkers in addition to CP‐I, a widely studied OATP1B biomarker. In terms of K i,app, HDA could also serve as an OATP1B biomarker; however, the f RIF was relatively low, similar to rosuvastatin, which could narrow the dynamic range of its AUC for reporting out OATP1B inhibition.
With the advent of LC‐MS/MS, it is now possible to measure multiple endogenous compounds in a single plasma sample; in the present study a total of 28 different candidate OATP1B biomarkers were analyzed, in addition to four probe drugs. Such an approach is useful and provides a wealth of information, especially when individual biomarkers present different profiles (e.g., K i,app, fraction sensitive to inhibition, fraction uptake by OATP1B1 vs. OATP1B3, fraction uptake via OATP1B vs. other transporters, impact of SLCO1B1 genotype, and fraction cleared renally). For instance, one subject in the study presented as a nonresponder in terms of the AUCR of GDCA‐S (Figure S7 ), lowering its performance as an OATP1B biomarker. Of note, other biomarkers (e.g., GCDCA‐S and CP‐I) did respond in the same subject to confirm OATP1B inhibition. Such nonresponsiveness to OATP1B inhibition could occur for other endogenous compounds for any number of unknown reasons in future studies. Therefore, to gain more confidence in the approach, the use of multiple biomarkers in the same study subject is advocated. Recently, Yee et al. have also proposed the use of multiple OATP1B biomarkers.14 This implies that one needs to consider the feasibility of multiplexing the bioanalysis of various endogenous compounds. For example, the concentrations of GDCA‐S and GDCA‐G are not negligibly low compared with GCDCA‐S and GCDCA‐G (Figure 3), and so robust chromatographic separation of these structurally related bile acids is required to increase the suitability of GCDCA‐S and GCDCA‐G as endogenous OATP1B biomarkers.
Taken together, CP‐I, GCDCA‐S, GCDCA‐G, D‐BILs, and HDA are promising OATP1B biomarkers that could be used jointly to study OATP1B inhibition. However, attention should be paid to the substrate‐dependence that may impact the prediction of OATP1B‐mediated DDI with NCEs. Several groups, including ourselves, have proposed a model‐based approach as a way to translate the AUCR values obtained with endogenous compounds to DDI with drugs, such as statins, with correction for the substrate‐dependence in the in vitro K i.24, 30, 31 Therefore, it is envisioned that a cadre of three to four OATP1B biomarkers could be deployed in support of phase I (NCE ascending dose) studies to derive a range of K i,app values, as a signature, and then compare with the in vitro derived K i values. In turn, adjustment for substrate‐dependent differences in the in vitro K i would support derivation of K i,app values for statin drugs as input for physiologically‐based pharmacokinetic (PBPK) modeling.31
As part of the present study, we assessed the association of SLCO1B1 and ABCG2 genotypes with the dose‐dependent inhibition of OATP1B by rifampicin. As expected from previous reports,32, 33 the volunteers carrying ABCG2 mutant alleles showed higher plasma concentrations of rosuvastatin (Figure S6 ) with lower AUCR in the presence of rifampicin as compared with those with wild‐type (ABCG2). Importantly, ABCG2 genotype was not shown to impact the concentrations of any of the endogenous compounds (Figure S7 ). Indeed, the interindividual difference in AUC0‐24h of rosuvastatin could not be explained by differences in CP‐I AUC (Figure S6 D). This implies that endogenous OATP1B biomarkers can discriminate OATP1B inhibition from BCRP inhibition, which may be important when trying to interpret AUCR with rosuvastatin (a dual BCRP‐OATP1B substrate) after dosing of perpetrators potentially inhibiting both transporters (e.g., eltrombopag).34, 35, 36
As described herein, an intensive and comprehensive effort was made to assess the sensitivity and dynamic range of numerous endogenous OATP1B substrates in healthy subjects. An intraindividual comparison of the effect of oral ascending doses of rifampicin on the AUC0‐24h of four probe drugs and endogenous compounds elucidated their own pros and cons, in the absolute values, dynamic range and correlation of AUCR, interindividual difference, and diurnal‐related changes to the baseline, which should be considered when leveraging OATP1B biomarkers to support DDI risk assessment. The data were obtained in the limited number of subjects, hence there might be other factors affecting the baseline and AUCR in the larger population. In the present study, rifampicin was used as a pan‐OATP1B inhibitor.37 It should be noted that drugs that inhibit OATP1B1 and OATP1B3 with different potencies may produce a different AUCR pattern across different endogenous substrates. For instance, JNJ‐A, an NCE that is sixfold more potent as an OATP1B1 inhibitor (vs. OATP1B3), has been shown to elicit a twofold increase in CP‐I plasma concentrations.38 Such a compound could differentially impact other endogenous compounds when compared with rifampicin used in this study. As such, it will be important to develop PBPK models for the additional endogenous compounds of interest in order to complement existing CP‐I PBPK models.31
In conclusion, the present study assessed the performance of 28 different endogenous substrates as candidate OATP1B biomarkers and strongly supports the rationale to leverage CP‐I, D‐BILs, GCDCA‐S, GCDCA‐G, and HDA as quantitative OATP1B biomarkers for DDI risk assessment in healthy volunteers.
Funding
This study was funded and supported by Pfizer Inc.
Conflict of Interest
E.K., B.R., A.K.‐A., R.R., M.V., V.H.L., and A.D.R. are employees of Pfizer Inc., USA, and Chieko Muto is an employee of Pfizer Inc., Japan. All other authors declared no competing interests for this work.
Author Contributions
A.D.R., Y.S., and H.K. wrote the manuscript; M.V., A.D.R., E.K., C.M., K.F., Y.S., and H.K. designed the research; D.M., B.R., A.K.‐A., R.R., Y.K., L.S.W., and J.G.J. performed the research; A.D.R., D.M., Y.S., H.K., V.H.L., and M.V. analyzed the data.
Supporting information
Figure S1.
Figure S2.
Figure S3.
Figure S4.
Figure S5.
Figure S6.
Figure S7.
Figure S8.
Supplemental Analysis.
Table S1.
Table S2.
Table S3.
Table S4.
Table S5.
Table S6.
Supplemental Methods.
References
- 1. Vaidyanathan, J. , Yoshida, K. , Arya, V. & Zhang, L. Comparing various in vitro prediction criteria to assess the potential of a new molecular entity to inhibit organic anion transporting polypeptide 1B1. J. Clin. Pharmacol. 56 (suppl. 7), S59–S72 (2016). [DOI] [PubMed] [Google Scholar]
- 2. Chu, X. , Bleasby, K. , Chan, G.H. , Nunes, I. & Evers, R. The complexities of interpreting reversible elevated serum creatinine levels in drug development: does a correlation with inhibition of renal transporters exist? Drug Metab. Dispos. 44, 1498–1509 (2016). [DOI] [PubMed] [Google Scholar]
- 3. Chu, X. et al Clinical probes and endogenous biomarkers as substrates for transporter drug‐drug interaction evaluation: perspectives from the international transporter consortium. Clin. Pharmacol. Ther. 104, 836–864 (2018). [DOI] [PubMed] [Google Scholar]
- 4. Mariappan, T.T. , Shen, H. & Marathe, P. Endogenous biomarkers to assess drug‐drug interactions by drug transporters and enzymes. Curr. Drug Metab. 18, 757–768 (2017). [DOI] [PubMed] [Google Scholar]
- 5. Müller, F. , Sharma, A. , König, J. & Fromm, M.F. Biomarkers for in vivo assessment of transporter function. Pharmacol. Rev. 70, 246–277 (2018). [DOI] [PubMed] [Google Scholar]
- 6. Rodrigues, A.D. , Taskar, K.S. , Kusuhara, H. & Sugiyama, Y. Endogenous probes for drug transporters: balancing vision with reality. Clin. Pharmacol. Ther. 103, 434–448 (2018). [DOI] [PubMed] [Google Scholar]
- 7. Lee, H.H. & Ho, R.H. Interindividual and interethnic variability in drug disposition: polymorphisms in organic anion transporting polypeptide 1B1 (OATP1B1; SLCO1B1). Br. J. Clin. Pharmacol. 83, 1176–1184 (2017). [DOI] [PMC free article] [PubMed] [Google Scholar]
- 8. Patel, M. , Taskar, K.S. & Zamek‐Gliszczynski, M.J. Importance of hepatic transporters in clinical disposition of drugs and their metabolites. J. Clin. Pharmacol. 56 (suppl. 7), S23–S39 (2016). [DOI] [PubMed] [Google Scholar]
- 9. Maeda, K. Organic anion transporting polypeptide (OATP)1B1 and OATP1B3 as important regulators of the pharmacokinetics of substrate drugs. Biol. Pharm. Bull. 38, 155–168 (2015). [DOI] [PubMed] [Google Scholar]
- 10. Barnett, S. , Ogungbenro, K. , Ménochet, K. , Shen, H. , Humphreys, W.G. & Galetin, A. Comprehensive evaluation of the utility of 20 endogenous molecules as biomarkers of OATP1B inhibition compared with rosuvastatin and coproporphyrin I. J. Pharmacol. Exp. Ther. 368, 125–135 (2019). [DOI] [PubMed] [Google Scholar]
- 11. Lai, Y. et al Coproporphyrins in plasma and urine can be appropriate clinical biomarkers to recapitulate drug‐drug interactions mediated by organic anion transporting polypeptide inhibition. J. Pharmacol. Exp. Ther. 358, 397–404 (2016). [DOI] [PubMed] [Google Scholar]
- 12. Shen, H. et al Comparative evaluation of plasma bile acids, dehydroepiandrosterone sulfate, hexadecanedioate, and tetradecanedioate with coproporphyrins I and III as markers of OATP inhibition in healthy subjects. Drug Metab. Dispos. 45, 908–919 (2017). [DOI] [PubMed] [Google Scholar]
- 13. Yee, S.W. et al Metabolomic and genome‐wide association studies reveal potential endogenous biomarkers for OATP1B1. Clin. Pharmacol. Ther. 100, 524–536 (2016). [DOI] [PMC free article] [PubMed] [Google Scholar]
- 14. Yee, S.W. et al Organic anion transporter polypeptide 1B1 polymorphism modulates the extent of drug–drug interaction and associated biomarker levels in healthy volunteers. Clin. Transl. Sci. 12, 388–399 (2019). [DOI] [PMC free article] [PubMed] [Google Scholar]
- 15. Takehara, I. , Watanabe, N. , Mori, D. , Ando, O. & Kusuhara, H. Effect of rifampicin on the plasma concentrations of bile Acid‐O‐Sulfates in monkeys and human liver‐transplanted chimeric mice with or without bile flow diversion. J. Pharm. Sci. 108, 2756–2764 (2019). [DOI] [PubMed] [Google Scholar]
- 16. Takehara, I. et al Comparative study of the dose‐dependence of OATP1B inhibition by rifampicin using probe drugs and endogenous substrates in healthy volunteers. Pharm. Res. 35, 138 (2018). [DOI] [PubMed] [Google Scholar]
- 17. Mori, D. et al Effect of OATP1B1 genotypes on plasma concentrations of endogenous OATP1B1 substrates and drugs, and their association in healthy volunteers. Drug Metab. Pharmacokinet. 34, 78–86 (2019). [DOI] [PubMed] [Google Scholar]
- 18. Takehara, I. et al Investigation of glycochenodeoxycholate sulfate and chenodeoxycholate glucuronide as surrogate endogenous probes for drug interaction studies of OATP1B1 and OATP1B3 in healthy Japanese volunteers. Pharm. Res. 34, 1601–1614 (2017). [DOI] [PubMed] [Google Scholar]
- 19. Kimoto, E. , Bi, Y.‐A. , Kosa, R.E. , Tremaine, L.M. & Varma, M.V.S. Hepatobiliary clearance prediction: species scaling from monkey, dog, and rat, and in vitro–in vivo extrapolation of sandwich‐cultured human hepatocytes using 17 drugs. J. Pharm. Sci. 106, 2795–2804 (2017). [DOI] [PubMed] [Google Scholar]
- 20. Tomita, Y. , Maeda, K. & Sugiyama, Y. Ethnic variability in the plasma exposures of OATP1B1 substrates such as HMG‐CoA reductase inhibitors: a kinetic consideration of its mechanism. Clin. Pharmacol. Ther. 94, 37–51 (2013). [DOI] [PubMed] [Google Scholar]
- 21. Williamson, B. , Soars, A.C. , Owen, A. , White, P. , Riley, R.J. & Soars, M.G. Dissecting the relative contribution of OATP1B1‐mediated uptake of xenobiotics into human hepatocytes using siRNA. Xenobiotica 43, 920–931 (2013). [DOI] [PubMed] [Google Scholar]
- 22. Yamashiro, W. , Maeda, K. , Hirouchi, M. , Adachi, Y. , Hu, Z. & Sugiyama, Y. Involvement of transporters in the hepatic uptake and biliary excretion of valsartan, a selective antagonist of the angiotensin II AT1‐receptor, in humans. Drug Metab. Dispos. 34, 1247–1254 (2006). [DOI] [PubMed] [Google Scholar]
- 23. Rago, B. , Tierney, B. , Rodrigues, A.D. , L Holliman, C. & Ramanathan, R. A multiplex HRMS assay for quantifying selected human plasma bile acids as candidate OATP biomarkers. Bioanalysis 10, 645–657 (2018). [DOI] [PubMed] [Google Scholar]
- 24. Yoshida, K. , Guo, C. & Sane, R. Quantitative prediction of OATP‐mediated drug‐drug interactions with model‐based analysis of endogenous biomarker kinetics. CPT Pharmacometrics Syst. Pharmacol. 7, 517–524 (2018). [DOI] [PMC free article] [PubMed] [Google Scholar]
- 25. Yoshikado, T. et al Quantitative analyses of hepatic OATP‐mediated interactions between statins and inhibitors using PBPK modeling with a parameter optimization method. Clin. Pharmacol. Ther. 100, 513–523 (2016). [DOI] [PubMed] [Google Scholar]
- 26. Izumi, S. et al Investigation of the impact of substrate selection on in vitro organic anion transporting polypeptide 1B1 inhibition profiles for the prediction of drug‐drug interactions. Drug Metab. Dispos. 43, 235–247 (2015). [DOI] [PubMed] [Google Scholar]
- 27. Bi, Y.‐A. et al Quantitative contribution of six major transporters to the hepatic uptake of drugs: “SLC‐Phenotyping” using primary human hepatocytes. J. Pharmacol. Exp. Ther. 370, 72–83 (2019). [DOI] [PubMed] [Google Scholar]
- 28. Thakare, R. et al Leveraging of rifampicin‐dosed cynomolgus monkeys to identify bile acid 3‐O‐sulfate conjugates as potential novel biomarkers for organic anion‐transporting polypeptides. Drug Metab. Dispos. 45, 721–733 (2017). [DOI] [PubMed] [Google Scholar]
- 29. Eley, T. et al Organic anion transporting polypeptide‐mediated transport of, and inhibition by, asunaprevir, an inhibitor of hepatitis C virus NS3 protease. Clin. Pharmacol. Ther. 97, 159–166 (2015). [DOI] [PubMed] [Google Scholar]
- 30. Barnett, S. et al Gaining mechanistic insight into coproporphyrin I as endogenous biomarker for OATP1B‐mediated drug–drug interactions using population pharmacokinetic modeling and simulation. Clin. Pharmacol. Ther. 104, 564–574 (2018). [DOI] [PMC free article] [PubMed] [Google Scholar]
- 31. Yoshikado, T. et al PBPK modeling of coproporphyrin I as an endogenous biomarker for drug interactions involving inhibition of hepatic OATP1B1 and OATP1B3. CPT Pharmacometrics Syst. Pharmacol. 7, 739–747 (2018). [DOI] [PMC free article] [PubMed] [Google Scholar]
- 32. Kashihara, Y. et al Small‐dosing clinical study: pharmacokinetic, pharmacogenomic (SLCO2B1 and ABCG2), and interaction (Atorvastatin and Grapefruit Juice) profiles of 5 probes for OATP2B1 and BCRP. J. Pharm. Sci. 106, 2688–2694 (2017). [DOI] [PubMed] [Google Scholar]
- 33. Zhang, W. et al Role of BCRP 421C>A polymorphism on rosuvastatin pharmacokinetics in healthy Chinese males. Clin. Chim. Acta 373, 99–103 (2006). [DOI] [PubMed] [Google Scholar]
- 34. Allred, A.J. et al Eltrombopag increases plasma rosuvastatin exposure in healthy volunteers. Br. J. Clin. Pharmacol. 72, 321–329 (2011). [DOI] [PMC free article] [PubMed] [Google Scholar]
- 35. Takeuchi, K. et al Interaction of novel platelet‐increasing agent eltrombopag with rosuvastatin via breast cancer resistance protein in humans. Drug Metab. Dispos. 42, 726–734 (2014). [DOI] [PubMed] [Google Scholar]
- 36. Yoshida, K. , Maeda, K. & Sugiyama, Y. Transporter‐mediated drug‐drug interactions involving OATP substrates: predictions based on in vitro inhibition studies. Clin. Pharmacol. Ther. 91, 1053–1064 (2012). [DOI] [PubMed] [Google Scholar]
- 37. De Bruyn, T. , Fattah, S. , Stieger, B. , Augustijns, P. & Annaert, P. Sodium fluorescein is a probe substrate for hepatic drug transport mediated by OATP1B1 and OATP1B3. J. Pharm. Sci. 100, 5018–5030 (2011). [DOI] [PubMed] [Google Scholar]
- 38. Kunze, A. , Ediage, E.N. , Dillen, L. , Monshouwer, M. & Snoeys, J. Clinical investigation of coproporphyrins as sensitive biomarkers to predict mild to strong OATP1B‐mediated drug–drug interactions. Clin. Pharmacokinet. 57, 1559–1570 (2018). [DOI] [PubMed] [Google Scholar]
Associated Data
This section collects any data citations, data availability statements, or supplementary materials included in this article.
Supplementary Materials
Figure S1.
Figure S2.
Figure S3.
Figure S4.
Figure S5.
Figure S6.
Figure S7.
Figure S8.
Supplemental Analysis.
Table S1.
Table S2.
Table S3.
Table S4.
Table S5.
Table S6.
Supplemental Methods.