

Cytopathology is a highly useful, noninvasive method for diagnosis of malignant vs. benign conditions and identification of infectious agents. However, a number of problems confront the cytopathologist on a daily basis because of limitations of conventional cytologic features. Adjunct techniques can be utilized to give additional information, which allows one to reach a definitive diagnosis. These techniques must be used in parallel with conventional cytologic features and include immunodiagnostics for cellular origin, electron microscopy for presence of subcellular structures, special histochemical stains for demonstration of chemical constituents, flow cytometry and image analysis for a quantitative evaluation of cellular markers, and molecular diagnostics for clonality or chromosomal abnormalities. In this chapter, we discuss adjunct diagnostic techniques and focus on both their applications in cytopathology and histopathology.
IMMUNODIAGNOSIS
The detection of antigens by immunologic and chemical reactions in tissue sections (immunohistochemistry-IHC-), or cytologic preparations (immunocytochemistry-ICC-) has become one of the most commonly used ancillary morphologic techniques in diagnostic pathology (Barr and Wu, 2006). The advantages of IHC and ICC are: 1) They do not require the use of expensive equipment. 2) Both prospective and retrospective studies can be done on a variety of samples. 3) Antigen detection can be correlated with morphologic changes (IHC) and its cellular location (ICC). 4) Stained slides can be stored for many months. 5) Routine processing of samples is usually acceptable for these techniques. Both IHC and ICC are practical in the characterization of poorly differentiated neoplasms, differentiation of primary from metastatic tumors, and determination of sites of origin of metastatic lesions and prognostic assessments (DeLellis and Hoda, 2006). The general consensus is that IHC/ICC methods, if properly applied and interpreted, increase diagnostic accuracy in pathology. Technical aspects of IHC and ICC, interpretation of results, and pitfalls will be reviewed. An algorithmic approach to the diagnosis of tumors, the diagnosis of metastatic disease, and the use of antibodies as prognostic markers will be presented. This review will not include detailed IHC or ICC procedures. For this purpose, the reader is referred to other published material (Polak and Van Noorden, 2003; Ramos-Vara and Saeteele, 2007).
Immunohistochemistry
Antibodies
Immunohistochemistry (IHC) demonstrates antigens in tissue sections by incubating the sections with specific antibodies and demonstrating the immunologic reaction with a histochemical (enzyme-substrate) reaction to produce a colored (visible) reaction (Ramos-Vara, 2005). Polyclonal or monoclonal antibodies can be used. In general, polyclonal antibodies are usually raised in rabbits and have higher affinity but lower specificity than monoclonal antibodies. Cross-reactivity (defined as recognition of unrelated antigens) is more common with polyclonal antibodies. Key in the use of polyclonal antibodies in diagnostic IHC/ICC is their degree of purification (examples of commercially available antibodies include whole serum antibodies, antibodies purified by precipitation of immunoglobulins, and immunoglobulins purified by affinity chromatography). Monoclonal antibodies, produced in mice using the hybridoma technology, recognize a single epitope (a 4-8 amino acid chain in a protein) and therefore are highly specific and have constant characteristics among different batches of antibody. Rabbit monoclonal antibodies are increasingly being used in human diagnostic IHC, but despite their reported advantages over mouse monoclonal antibodies (e.g., higher affinity, no need for antigen retrieval, use on mouse tissues), some of them neither react on animal tissues nor perform better than mouse monoclonal antibodies (Reid et al., 2007; Vilches-Moure and Ramos-Vara, 2005). Selection of a particular antibody will be determined by published information or the experience of other laboratories. There are no guarantees that an antibody that recognizes an antigen in one species will do so in another species; only testing will determine if this is the case. Needless to say, the large number of species from which samples can be obtained is one of the biggest challenges that a veterinary pathologist must face in immunodiagnostics.
Fixation
The universal fixative for histopathology and diagnostic IHC is buffered formalin. Attempts to replace formalin fixative in diagnostic IHC have failed, although for specific situations the use of nonformaldehyde fixatives, particularly glyoxal-based, has been reported (Yaziji and Barry, 2006). Fixation is necessary for preservation of cellular components, to prevent autolysis and displacement of cell constituents, to stabilize cellular materials (antigens), and to facilitate conventional staining and immunostaining (Ramos-Vara, 2005). The use of formalin is not without problems. First, the quality of formalin solutions varies widely in regard to concentration of formaldehyde, pH, and presence of preservatives. Second, formalin fixation, by producing methylene bridges between amino groups and other functional groups, alters the tertiary and quaternary structure of proteins and forms cross-links between soluble tissues and proteins. These chemical reactions may modify the targeted epitope. Amino acids that are especially sensitive to formalin fixation include lysine, glycine, tyrosine, arginine, histidine, and serine. Despite the fact that formalin fixation may impair immunohistochemical detection, good fixation is paramount to detect antigens with IHC. Underfixation is as bad as or worse than overfixation, and is a fairly common problem due to reduced turnaround times in diagnostic laboratories. With the advent of heat-induced epitope retrieval (HIER), overfixation or variable fixation time among samples is less critical in the detection antigens targeted in human diagnostic IHC (Webster et al., 2009). The same will probably be true with common antigens demonstrated in animal samples. Autolysis is a common problem in diagnostic pathology. Studies addressing the effects of autolysis in IHC have shown that most antigens are still detectable despite decomposition; however, caution in the interpretation of autolyzed material is necessary due to the loss of detection of some antigens (Maleszewski et al., 2007). Necrotic tissue tends to produce more background than normal tissue; however, IHC of necrotic tissue can provide valuable information when no other tissue is available, particularly for cytokeratins and CD45. Decalcification of formalin-fixed tissues generally does not reduce the immunoreactivity of most antigens, particularly when using weak acids; some loss of reactivity is apparent when using strong acids for decalcification, but it does not affect all antigens.
Sample Processing
Processing of samples for diagnostic IHC is the same as for routine histopathology. Antigens have been successfully detected in formalin-fixed, paraffin-embedded (FFPE) tissues stored for several decades (Litlekalsoy et al., 2007). Autolyzed samples or those with biopsy artifacts should be avoided. For IHC and ICC, samples are mounted onto silanized slides, poly-L-lysine-coated slides, or charged slides to allow a strong bond between the slide and the tissue section. Pooling of reagents under the tissue section or tissue loss can occur when using noncharged slides or slides without special coatings. Complete deparaffination is critical to achieve optimal immunostaining. Deparaffination is somewhat cumbersome and there are commercial products to perform deparaffination and antigen retrieval simultaneously although results may not be completely satisfactory. A simple approach to deparaffination and antigen retrieval with heat has recently been published (Boenisch, 2007).
Antigen Retrieval
As previously mentioned, formalin fixation modifies the tertiary structure of proteins, often rendering antigens undetectable by specific antibodies. A factor in the binding of antibodies to antigens is their conformational fit, which may be modified during fixation. Antigen retrieval (AR) is intended to reverse the changes produced during fixation. In addition to conformational changes in the structure of proteins, fixation produces major changes in the electrostatic charge of proteins (antigens), which is critical for the initial attraction between antigens and antibodies. Therefore, recovery of the electrostatic charges lost during formalin fixation has been proposed as another mechanism of antigen retrieval for many (but not all) proteins. In other words, it appears that more than one mechanism may be involved in the lack of recognition of antigens by antibodies after fixation in cross-linking fixatives. The two more common AR procedures include proteolytic enzymes (e.g., pronase, trypsin, proteinase K) and immersion of slides in buffer at high temperature. Each antibody may react differently to antigen retrieval and therefore it is necessary to test several methods when optimizing the IHC procedure although some HIER procedures appear to produce optimal results in a wide variety of antibodies. With the variety of AR methods available, standardization of IHC methods among laboratories and comparison of results is very challenging at best.
Protocols
For technical aspects of IHC and detailed protocols, the reader is referred to a more recent review (Ramos-Vara and Saeteele, 2007). Table 17-1 includes the antibodies used by the Animal Disease Diagnostic Laboratory at Purdue University for infectious and neoplastic diseases of dogs and cats. Immunohistochemical protocols can be divided into three stages: 1) Pretreatment procedures; 2) Incubation of the primary antibody, secondary, and tertiary reagents; 3) Visualization of the immunologic reaction.
TABLE 17-1.
List of Selected Antigen Markers, Sources, Tissue Controls, and Uses for Selected Antibodies Used in Dogs and Cats
| Antigen | Species* | Clone/Catalog # | Vendor | Tissue Control | Use |
|---|---|---|---|---|---|
| Actin muscle | Dog | HHF35 | Dako | Skeletal muscle/heart | Muscle neoplasms |
| Actin sarcomeric | Dog | Alpha-Sr-1 | Dako | Skeletal muscle/heart | Striated muscle tumors |
| Actin smooth muscle | Dog | 1A4 | Dako | Stomach/Intestine | Smooth muscle tumors |
| Adenovirus (blend) | Dog | 20/11 and 2/6 | Chemicon | Infected tissue | Infection |
| Amylin (IAPP) | Cat, Dog | R10/99 | AbD Serotec | Pancreas | Pancreatic islet amyloid |
| Bcl-2 oncoprotein | Cat only | NCL-bcl-2 | Novocastra | Lymphoid tissue | Lymphoid tumors |
| B-lymphocyte antigen (BLA.36) | Cat, Dog | A27-42 | Dako | Lymph node, spleen | B-cell, histiocytic tumors |
| CD1c (ICC) | Dog only | CA13.9H11 | UCD | Lymphoid tissue | Dendritic cell tumors |
| CD3 (ICC) | Dog only | CA17.2A12 | AbD Serotec | Lymph node, spleen | T-cell lymphoma |
| CD3 epsilon (IHC) | Cat, Dog | CD3-12 | AbD Serotec | Lymph node, spleen | T-cell lymphoma |
| CD10 (CALLA antigen) | Dog | 56C6 | Vector | Kidney, | Renal, stromal tumors |
| CD11d (IHC) | Dog only | CA18.3C6 | UCD | Spleen | Lymphoid, histiocytic tumors |
| CD11d (ICC) | Cat, Dog | CA16.3D3 | UCD | Spleen | Lymphoid, histiocytic tumors |
| CD18 | Cat only | FE3.9F2 | UCD | Spleen | Leukocytic tumors |
| CD18 | Dog only | CA16.3C10 | UCD | Spleen, lymph node | Leukocytic tumors |
| CD20 | Cat, Dog | RB-9013 | LabVision | Spleen, lymph node | B-cell tumors |
| CD31 | Dog | JC/70A | Dako | Skin, other | Vascular endothelial and megakaryocytic tumors |
| CD45 | Dog only | CA12.10C12 | UCD | Spleen, lymph node | Leukocytic tumors |
| CD45RA | Dog only | CA21.4B3 | UCD | Lymphoid tissue | Lymphoid tumors |
| CD79a | Cat, Dog | HM57 | Dako | Lymph node, spleen | B-cell lymphoma |
| CD117 (c-Kit protein) | Dog | A4502 | Dako | Mast cell tumor | Mast cell tumor |
| Calcitonin | Cat, Dog | A0576 | Dako | Thyroid | C-cell tumors |
| Calponin | Dog | CALP, h-CP | Dako, Sigma | Small intestine, stomach | Smooth muscle and myoepithelial tumors |
| Calretinin | Cat, Dog | 18-0211 | Zymed | Kidney | Renal tubules, nerve tissue, adrenocortical tumors, mesothelioma |
| Canine distemper virus | Dog | CDV-NP | VMRD | Infected tissue | Infection |
| Carcinoembryonic antigen | Dog | A0115 | Dako | Intestine | Epithelial tumors |
| Caspase-3 | Dog | CASP3ACTabr | Research Diagnostics | Lymph node | Apoptotic cells |
| Chromogranins A + B | Dog | PRO11422 | Research Diagnostics | Pancreas | Neuroendocrine marker |
| Coronavirus | Cat, Dog | FIPV3-70 | CMI | Infected tissue | Infection |
| COX-1 | Dog | 160108 | Cayman Chemical | Normal urinary bladder | Normal urothelium, endothelium |
| COX-2 | Cat, Dog | PG 27 B | Oxford Biomedical | Transitional cell carcinoma | Carcinomas |
| Cytokeratin 5 | Dog | XM26 | Vector | Mammary gland, skin | Myoepithelium, basal cells |
| Cytokeratin 7 | Dog | OV-TL 12/30 | Dako | Skin, urinary bladder | Glandular epithelium |
| Cytokeratins 8/18 | Dog | 5D3 | Novocastra | Liver, stomach | Glandular epithelium |
| Cytokeratins AE1-AE3 | Cat, Dog | AE1 and AE3 | Dako | Skin | General epithelium marker |
| Cytokeratins Pan | Dog | MNF116 | Dako | Glandular/squamous epithelium | General epithelium marker |
| Cytokeratins HMW | Dog | 34βE12 | Dako | Skin | Squamous epithelium, mesothelium, hepatocytes |
| Desmin | Dog | D33 | Dako | Skin, stomach, intestine | Muscle tumors |
| E-Cadherin | Dog | 36 | BD Transduction | Skin | Langerhan's cells, epithelium, histiocytoma, meningiomas |
| Estrogen receptor alpha | Cat, Dog | CC4-5 | Novocastra | Uterus | Estrogen receptor tumors |
| Factor VIII–related antigen | Dog | A0082 | Dako | Skin, other | Vascular endothelial and megakaryocytic tumors |
| Feline calicivirus | Cat | S1-9 | CMI | Infected tissue | Infection |
| Feline herpesvirus 1 | Cat | FHV5 | CMI | Infected tissue | Infection |
| Feline leukemia virus | Cat | C11D8-2C1 | CMI | Infected tissue | Infection |
| Glial fibillary acidic protein | Dog | Z0334 | Dako | Brain | Neural (glial) tumors |
| Glucagon | Cat, Dog | A0565 | Dako | Pancreas | Glucagon-producing tumors |
| Glut 1 | Dog | A3536 | Dako | Peripheral nerve | Peripheral nerves, stromal cells, kidney |
| Hepatocyte marker-1 (Hep Par 1) | Dog | OCH1E5 | Dako | Liver | Hepatocellular tumors |
| Ig kappa chains | Dog | A0191 | Dako | Lymph node | Plasmacytomas |
| Ig lambda chains | Dog | A0193 | Dako | Lymph node | Plasmacytomas |
| Immunoglobulin M | Cat, Dog | CM7 | CMI | Lymph node | Lymphoid tumors |
| Inhibin-alpha | Dog | R1 | Serotec | Testicle, Sertoli cell tumor | Sex cord–stromal and adrenal cortical tumors |
| Insulin | Dog | Z006 | Zymed | Pancreas | Insulin-producing tumors |
| Ki-67 | Dog | 7B11 | Zymed | Lymphoma | Cell proliferation marker |
| Laminin | Cat, Dog | Z0097 | Dako | Skin/Kidney | Perivascular wall tumors and basement membrane |
| Leptospira | Dog | − | NVSL | Infected tissue | Infection |
| Lysozyme | Dog | A0099 | Dako | Liver, spleen | Histiocytes |
| Melan A | Cat, Dog | A103 | Dako | Melanoma | Melanomas, steroidproducing tumors |
| MHC II | Dog | TAL.1B5 | Dako | Histiocytoma, LN | Antigen presenting cells, lymphocytes |
| Microphthalmia transcription factor | Dog | C5 | abcam | Melanoma | Melanomas |
| MUM 1 protein | Dog | MUM1p | Dako | Plasmacytoma | Plasmacytomas, myelomas, some B-cell tumors |
| Myeloid/histiocytic antigen | Dog | MAC 387 | Dako | Spleen, liver | Macrophages, myeloid cells |
| Myoglobin | Dog | A324 | Dako | Skeletal muscle, heart | Skeletal muscle tumors |
| Neospora caninum | Dog | 210-70-NC | VMRD | Infected tissue | Infection |
| Nerve growth factor receptor | Dog | NGFR5 | LabVision | Nerve | Nerves |
| Neurofilament-2 | Dog | SMI-31 | Covance | Brain | Neuron neurofilaments |
| Neuron specific enolase | Dog | BBS/NC/VI-H14 | Dako | Pancreas | Neuroendocrine marker |
| OCT3/4 | Dog | C-10 | Santa Cruz | Mast cell tumor | Germ cell and mast cell tumors |
| p63 | Dog | 4A4 | Santa Cruz | Skin, mammary gland | Myoepithelium, basal cells |
| Papilloma virus | Dog | B0580 | Dako | Infected tissue | Infection |
| Parathyroid hormone | Dog only | M7070 | Dako | Parathyroid | Normal and neoplastic parathyroid |
| Parvovirus | Dog | A3B10 | VMRD | Infected tissue | Infection |
| Progesterone receptor | Dog | SP21 | LabVision | Uterus | Progesterone receptor tumors |
| Proliferating Cell Nuclear Antigen | Dog | PC10 | Dako | Lymphoma, lymph node | Proliferation marker |
| Protein Gene Product 9.5 | Cat, Dog | Z5116 | Dako | Adrenal gland | Neuroendocrine marker |
| S-100 protein | Cat, Dog | Z0311 | Dako | Nerve, brain | Neural marker, neuroendocrine tumors |
| Somatostatin | Dog | A0566 | Dako | Pancreas | Pancreatic islet tumors, some carcinoids |
| Synaptophysin | Dog | SP11 | LabVision | Pancreas | Neuroendocrine marker |
| Thyroglobulin | Cat, Dog | 492020 | ShandonImmunon | Thyroid | Thyroglobulin-producing tumors |
| Thyroid transcription factor-1 | Dog | 8G7/G3/1 | Dako | Lung, thyroid | Lung and thyroid neoplasms |
| Toxoplasma gondii | Cat | MAB802 | Chemicon | Infected tissue | Infection |
| Tryptase | Dog only | AA1 | Dako | Mast cell tumor | Mast cell tumors |
| Uroplakin III | Dog only | AU1 | Res. Diagnostics | Urinary bladder | Urothelial neoplasms |
| Vimentin | Dog | SP20 | LabVision | Skin, stomach | Mesenchymal tumor marker |
CMI, Custom Monoclonals International; HMW, high molecular weight; NVSL, National Veterinary Services Laboratories (Ames, IA); UCD, University of California-Davis (P. Moore)
Known species reactivity is listed; Dog or Cat only – indicates both species were tested but only one is reactive
Pretreatment Procedures
These procedures include blocking of endogenous activities, blocking of nonspecific binding, and antigen retrieval (the lattermost already discussed). Endogenous peroxidase (for immunoperoxidase procedures) is common in numerous tissues although formalin fixation destroys most of it. Endogenous alkaline phosphatase (for alkaline phosphatase detection methods) is blocked in procedures using this enzyme. Mammalian tissues have two alkaline phosphatase isoenzymes; the nonintestinal form is easily blocked with levamisole; the intestinal isoform unfortunately requires acetic acid to be blocked, a chemical that can damage some antigens. Numerous tissues have endogenous avidin-biotin activity that must be blocked before adding biotinylated reagents in avidin-biotin detection systems. Nonspecific binding of immunoglobulins to tissue is blocked by incubating tissue sections with bovine serum albumin or serum from the same species as the secondary reagent before the incubation with the primary antibody. There are commercially available reagents to block endogenous activities and nonspecific immunoglobulin binding.
Immunohistochemical Reaction
The immunohistochemical reaction can be divided into an immunologic (antigen-antibody) reaction followed by its demonstration with a histochemical (colored) reaction. The sensitivity of the immunohistochemical reaction is mostly the result of the detection method used (Ramos-Vara, 2005); progress in this regard has been dramatic in the last decade. Two main enzymes are used in IHC: peroxidase and alkaline phosphatase. Peroxidase is probably the enzyme most commonly used, but in some occasions, particularly with heavily pigmented samples or samples rich in endogenous peroxidase, alkaline phosphatase is an excellent alternative. Current IHC methods can be divided into avidin-biotin or non–avidin-biotin systems. After incubation with the primary antibody, a secondary antibody specific for the primary antibody (secondary reagent) is added. For avidin-biotin systems the secondary reagent is biotinylated. For avidin-biotin methods, a tertiary reagent labeled with avidin molecules and an enzyme (peroxidase or alkaline phosphatase) is needed. The most common non–avidin-biotin method is based on polymer technology. The polymers contain many molecules of secondary antibodies and enzyme. Polymer methods are usually two-step methods, whereas avidin-biotin methods are usually three-step methods. Polymer-based methods have fewer steps, do not have endogenous avidin-biotin background problems, and are usually more sensitive, but are beyond the scope of this review (Vosse et al., 2007). Detection of multiple antigens in the same tissue section is also possible. Issues to keep in mind in double or multiple immunostaining is the compatibility of AR among antigens to be detected, the type of primary antibodies (polyclonal or monoclonal), cellular localization of antigens, and the color of chromogens used.
Visualization of the Immunologic Reaction
The addition of a substrate for the enzyme used plus a chromogen will produce a colored reaction if there is binding of antibodies to tissue antigens. For immunoperoxidase methods, the most common chromogen is diaminobenzidine (DAB), which produces a brown deposit. Another common chromogen is aminoethylcarbazole (AEC). For alkaline phosphatase, Fast Blue and Fast Red are common chromogens. The use of a chromogen needs to be coordinated with the counterstaining and coverslipping methods.
Standardization and Validation of an IHC Test
Like any other ancillary technique, IHC needs to be standardized and validated. Optimization (standardization) of a new antibody/test is the process of serially testing and modifying components of the procedure (e.g., fixation, antigen retrieval, antibody dilution, detection system, incubation time, etc.) with the aim of producing a consistent, high-quality assay. The reader is advised to standardize every antibody used in his/her laboratory despite the existence of published protocols, to ensure optimal results. Standardization includes adequate tissue fixation. Tissues should be fixed in 10% neutral buffered formalin for a minimum of 8 hours. Every new antibody is tested following a standard protocol that includes three pretreatments: no antigen retrieval, AR with a proteolytic enzyme (e.g., proteinase K), and HIER (e.g., citrate buffer, pH 6.0); and four, two-fold dilutions of the primary antibody (Ramos-Vara and Beissenherz, 2000). With this standard protocol, the total of slides initially processed for each antibody is 15, including a negative reagent control for each pretreatment. The positive control section used in standardization (and later in a diagnostic setting) is one in which the antigen in question has been detected with a different method (e.g., virus isolation) and its cellular location is known. A negative control section (containing cells known by independent methods to lack the antigen in question) also should be included. Usually, the same tissue block used for the positive control can be used for the negative control.
Incubation of the primary antibody is done at room temperature; duration varies from 30 minutes to 2 hours. Overnight incubations (usually at 4 °C) may be beneficial, but disrupt the automation of the IHC procedure. Based on the results of this initial procedure, the optimal AR method and dilution of the primary antibody is selected as the slide with the best signal (specific staining)–to–noise (background staining) ratio. If staining is nonspecific or suboptimal, other AR methods and dilutions should be tested. Keep in mind that some antibodies raised against human antigens may not be reactive in animal tissues. For standardization, tissue samples are processed in the same way as the diagnostic samples that eventually will be tested.
Test validation in IHC follows standardization; however, because it is time consuming and expensive, it is seldom done in veterinary medicine. Validation of a test examines technical aspects such as the effects of prolonged fixation, but focuses more on the ability of the antibody to be used as a marker of a specific cell, tumor, or infectious agent. Antibodies used as tumor markers need to be tested against tumors that may be difficult to distinguish from the one in question (tumors with similar phenotype, e.g., round cell tumors) with routine stains and tumors present in the same location/organ (Ramos-Vara et al., 2007). Validation should also include evaluation of staining differences among different tumors, staining differences within tumors—particularly when different phenotypes are present (e.g., spindle and epithelioid melanomas staining differences with Melan-A)—and differences between primary and metastatic tumors. Validation is critical given the relative immunologic promiscuity (recognition of more than one cell type or tumor) of most antibodies. Finally, and due to the proven variation of antibody reactivity among different species, standardization and validation of an immunochemical procedure must be done in each species examined.
Immunocytochemistry
Processing of Cytologic Samples
Immunocytochemistry can be performed on most types of cytologic samples including cytospins, cell smears, cell blocks, and liquid-based monolayer preparations (Fetsch and Abati, 2004). Cytospins and cell smears are used when the sample volume is small. The advantage of cytospins is better preservation of cytomorphology. However, ICC on cytospins, cell smears, and liquid-based monolayer preparations (ThinPrep) tends to produce more background staining (Barr and Wu, 2006). Cell blocks of FFPE thrombin clots are the method of choice when there are abundant cells (e.g., effusions). The advantage of cell blocks is the similarity of processing to surgical pathology specimens (and therefore comparable results), the possibility of preparing multiple sections of the same block (e.g., for testing multiple markers), and ease of storage. Cell blocks may present some disadvantages such as loss of cytomorphology and loss of antigenicity due to formaldehyde fixation (Brown, 2001). Cell blocks are preferred for nuclear antigens (e.g., Ki-67, p53, PCNA), whereas air-dried cytospins are preferred for the detection of surface antigens (e.g., leukocytic antigens). ThinPreps are less suitable than cell blocks for detection of nuclear antigens (Gong et al., 2003).
ICC may be performed on previously stained Romanowsky or Papanicolau slides when that is the only available specimen and produces similar results to that of unstained slides. The ICC staining can be done with or without previous destaining (with acid alcohol) of the routine stain (Abendroth and Dabbs, 1995; Barr and Wu, 2006; Miller and Kubier, 2002). However, there are some technical drawbacks to using previously stained slides: loss of cells from the slide, cell disruption (affecting mostly ICC of membranous and cytoplasmic markers), and signal reduction for some markers (e.g., S100) due to repeated passage of the sample through graded alcohols. In cases in which only a slide is available and the area containing cells is large, multiple markers can be tested simultaneously. Alternatively, the sample can be divided following tissue-transfer techniques (Sherman et al., 1994).
Fixation
Cytology slides are either wet-fixed or air-dried and fixed immediately before performing ICC (Dabbs, 2002). When wet-fixed preparations were compared with air-dried samples, there were no significant changes in terms of cytologic preservation or ICC staining. However, air-dried preparations may lose fewer cells than wet-fixed samples. Air-dried preparations can be stored at 2 to 8 °C for up to 2 weeks before immunostain without loss of antigenicity (Fetsch and Abati, 2004). Samples are put in a plastic microscope slide box, then in a zip-lock plastic bag containing desiccant. Samples should equilibrate to room temperature before the bag is opened to avoid cell rupture. Storage for several weeks can be done at −70°C (Suthipintawong et al., 1996).
One of the main problems in comparing the quality of immunostaining in cytology preparations is the wide range of fixatives and fixation protocols used in different laboratories. This issue is very different from diagnostic IHC, in which a universal fixative, 10% buffered formaldehyde is used in most instances. Here we are giving general rules, but each laboratory should standardize and validate their protocols to obtain consistent results. Fixation is necessary to preserve cell integrity during multistep immunostaining procedures. Fixation should be performed immediately before immunostaining; theoretically, the type of fixative is selected on an antibodyby-antibody basis. In general, for lymphoid and melanoma markers, samples should be fixed for 5 to 10 minutes at room temperature in acetone; for epithelial markers, 5 minutes at room temperature in alcohol (95% ethanol or a 1:1 mixture of methanol and 100% ethanol); for nuclear antigens, 3.7% buffered formalin for 15 minutes (Fetsch and Abati, 2004). Some authors favor formal saline as a universal fixative suitable for most antigens (Leong et al., 1999). S100 protein, gross cystic disease fluid protein-15, and hormone receptors are not well demonstrated in ethanol-fixed samples due to cytoplasmic antigen leakage (Dabbs, 2002).
Method
Immunocytochemical methods parallel those of immunohistochemistry. There are several steps previous to the incubation of the primary antibody (e.g., endogenous peroxidase block, nonspecific binding block, avidin-biotin block, antigen retrieval). After the primary antibody incubation, a secondary, and sometimes a tertiary, reagent is necessary to demonstrate the immune reaction. The peroxidase block is necessary when using immunoperoxidase techniques; the usual method is with 3% H202 in deionized water. The peroxidase blocking step can be omitted in acetone-fixed specimens. Antigen retrieval is necessary in numerous occasions. Unfortunately, there is no rule to determine a priori whether antigen retrieval is needed or which method is optimal. The approach to standardize ICC is similar to that for IHC. A comprehensive list of antibodies used in ICC at the National Cancer Institute including antibody sources, dilution of the primary antibody, and fixation and antigen retrieval methods is available (Fetsch and Abati, 2004).
Interpretation of ICC and IHC
Immunohistochemistry is an ancillary method and therefore needs to be interpreted in conjunction with clinicopathologic data, including cytologic and surgical biopsy findings, if available. In very few cases is IHC considered a standalone technique in human or veterinary pathology. Specific knowledge of the right staining pattern of a given marker is extremely important to determine whether the staining is significant or not. Interpretation of ICC is more challenging than that of IHC because of the difficulty in obtaining positive and negative control samples treated in a similar way to the test sample and the additional difficulty of distinguishing normal from neoplastic cells. As stressed in the upcoming section on immunohistochemical diagnosis of metastatic tumors, there are very few, if any, antibodies that are truly specific for a single cell type. The interpretation of an IHC reaction is based on the expected “antibody personality profile” (see below) and the infidelity of tumor-specific markers (e.g., reactivity in T-cells with B-cell markers) (Yaziji and Barry, 2006). Simultaneous presence of an antigen in more than one cellular compartment is possible in neoplastic cells, but usually results from diffusion of proteins due to cellular damage during processing. Detection of an antigen in an unusual location should be interpreted with caution and indicated in the immunohistochemical report. Generally speaking, antibodies used in IHC can be used in ICC. In addition, some antibodies that are nonreactive in surgical biopsy specimens are suitable for cytologic preparations.
The interpretation of an immunohistochemical reaction requires a definition of positive or negative staining. This is a controversial issue so only guidelines will be given. Some markers are expected to be present in most cells in a tumor (e.g., cytokeratins in a carcinoma), whereas the detection of other markers (e.g., uroplakin III in transitional cell carcinoma) in only a small group of cells is considered a positive result. Perhaps, as recommended recently in human pathology (Goldstein et al., 2007), a statement in the IHC report indicating the intensity of the staining and the percentage of positive tumor cells would be more informative than merely a positive or negative result as provided in a recent veterinary study (Höinghaus et al., 2008). The lack of expression of a particular antigen may be as significant as its presence in prognostication (e.g., absence of expression of progesterone receptor is linked to poor outcome in human breast cancer; lack of bcl-6 expression combined with MUM1 expression in cutaneous large B-cell lymphoma is linked to short survival) (Bardou et al., 2003; Sundram et al., 2005). In human pathology IHC antibodies are classified as Class I devices by the FDA, meaning that antibodies are considered special stains as adjuncts to conventional histopathologic diagnostic examination (Rhodes, 2005). In other words, with some exceptions, IHC is not a standalone technique and results must be interpreted by the pathologist in the context of the disease. Some IHC tests (e.g., assays for ER, PR, HER2/neu) are considered class II devices with potential predictive or prognostic value. Similarly in veterinary medicine, immunohistochemical results are part of the pathology report and need to be interpreted by the pathologist (Ramos-Vara et al., 2008).
Limitations of Immunohistochemistry
Although IHC has largely displaced electron microscopy as the ancillary technique of choice in diagnostic pathology, it has some limitations (Fisher, 2006). One of the main problems is the lack of standardization and quality control among laboratories, particularly in regard to antigen retrieval. This interlaboratory lack of reproducibility is significant when dealing with prognostic markers (Mengel et al., 2002). Interpretation of immunostaining is also subjective (wide range of interobserver interpretations) and a degree of knowledge of IHC and the antibodies used is required to interpret results correctly. What constitutes a positive result (percentage of positive cells needed, intensity of the reaction) is still controversial, but a critical issue for therapeutic decisions in oncology. Some tumors do not express specific markers beyond the generic ones, which makes testing with multiple markers expensive and unrewarding. Neoplastic cells up- and downregulate gene expression, resulting in the lack of expression of expected antigens or the expression of new antigens. All these issues are perhaps more serious in veterinary medicine, where the degree of sophistication and use of IHC techniques is not as advanced as in human pathology, and are exacerbated by interspecies differences in antigen expression and detection.
Troubleshooting
General Lack of Staining
The most common cause of lack of staining in the test and control samples is improper procedure (from fixation to immunocytochemical procedure including antigen retrieval, antibody concentration, and an improper counterstain) (Dabbs, 2002). A systematic approach to the entire IHC procedure is necessary to determine the cause of staining failure.
Weak Staining
In this context, weak staining applies to both the positive (tissue) control and the test sample and is the result of too much buffer left after a rinsing step, excessive antibody dilution, insufficient incubation time, or improper storage of reagents including buffers, antibodies, and substrates (Fetsch and Abati, 2004). If weak staining only affects the test sample it might be the result of loss of epitopes in the tissue or overfixation.
Background Staining and False-Positive Staining
There are multiple causes of background staining. A common one is inadequate blocking of serum proteins. Blocking is usually done with normal serum or protein (Brown, 2001). Bovine serum albumin has been used extensively in the past as a blocking reagent of nonspecific reactions. However, there is recent evidence that adding albumin to antibody and diluent solutions increases the background of immunohistochemical reactions (Mittelbronn et al., 2006). Other causes of false-positive staining are necrotic tissue, crushed cells, improper fixation, incomplete blocking of endogenous peroxidase or endogenous biotin, and high concentration of the primary antibody (Dabbs, 2002). Samples that are too thick tend to trap reagents and produce background staining. Carcinoma cells in fluids often express vimentin and lose their immunoreactivity for cytokeratins; antigens shed into effusion fluid can be absorbed onto the surfaces of other cells present in the same fluid. Some antigens in cytologic samples such as factor VIII-rAg and immunoglobulins tend to diffuse into the surrounding tissue contributing to incorrect interpretation of immunostaining (Barr and Wu, 2006). To avoid overstaining due to the concentration of the primary antibody, retitration of primary antibodies on cytologic preparations is recommended. Other causes of background staining are included elsewhere (Ramos-Vara, 2005). When using detection kits that recognize primary antibodies made in goats, extensive background in both the positive and negative controls is observed if using tissue sections from the same or related species (ruminants) due to the presence of endogenous immunoglobulins recognized by the secondary antibody (anti–goat IgG). A similar problem is observed with rabbit monoclonal antibodies tested on rabbit tissues or mouse monoclonal antibodies tested on mouse tissues. Special detection procedures are commercially available to avoid this background staining. Although not an example of nonspecific background staining, it is very important in immunocytochemistry to distinguish positive staining in normal or reactive cells from that of neoplastic cells. This distinction can be challenging when the number of reactive cells is higher than that of the neoplastic cells (e.g., T-cell–rich B-cell lymphoma). Fig. 17-1 and Fig. 17-2 show examples of background and nonspecific staining.
FIGURE 17-1.
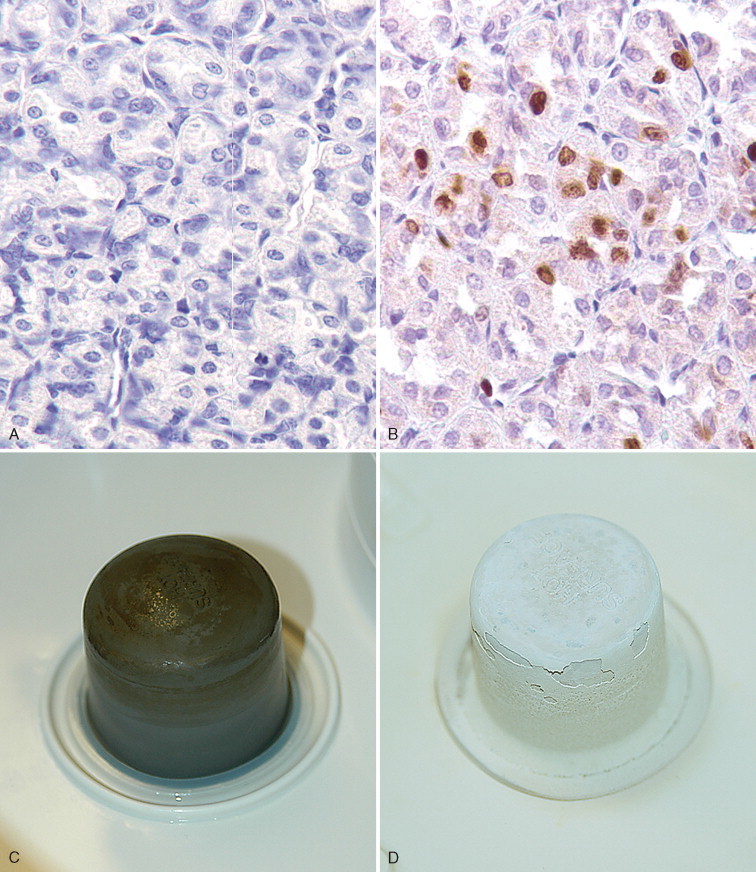
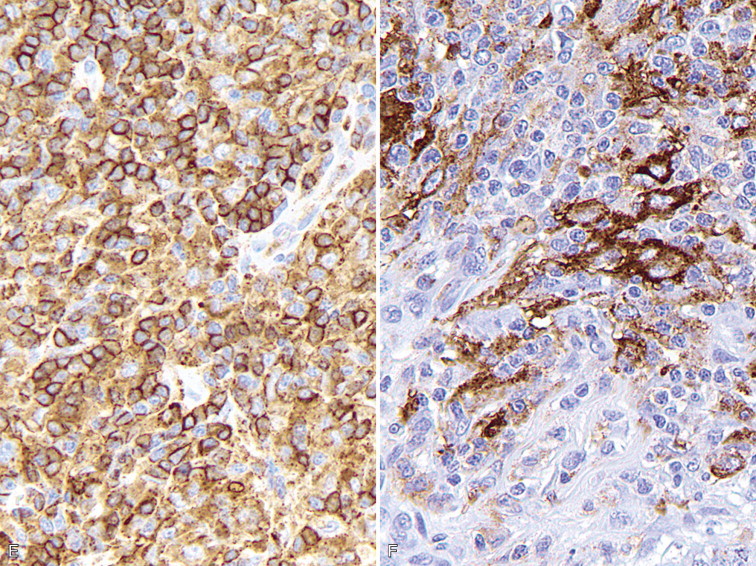
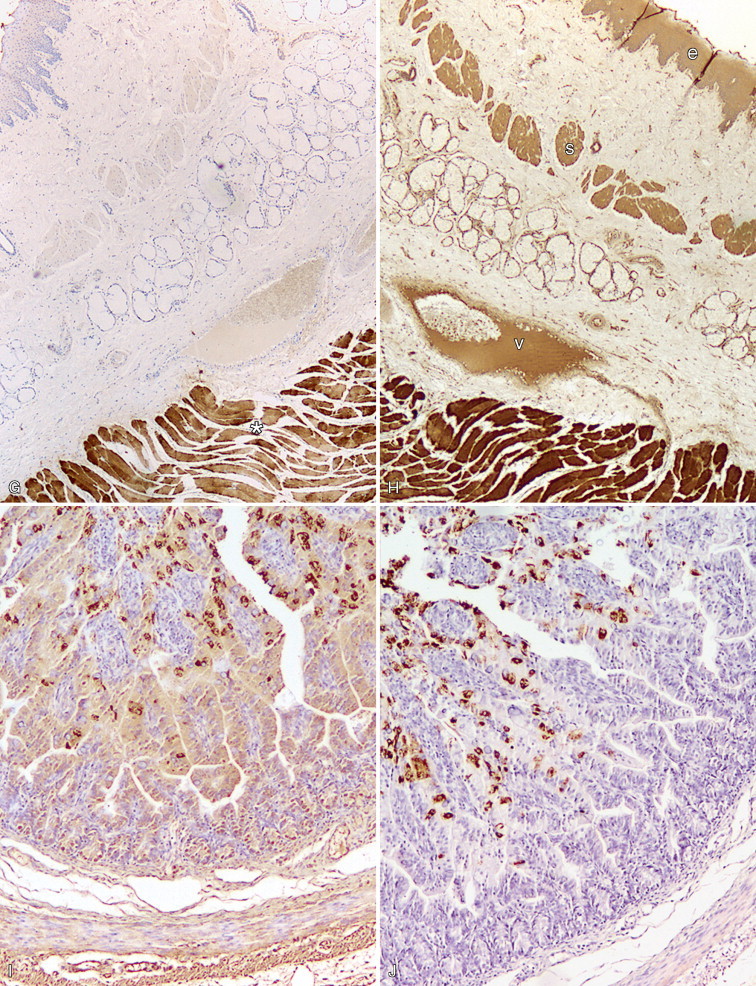

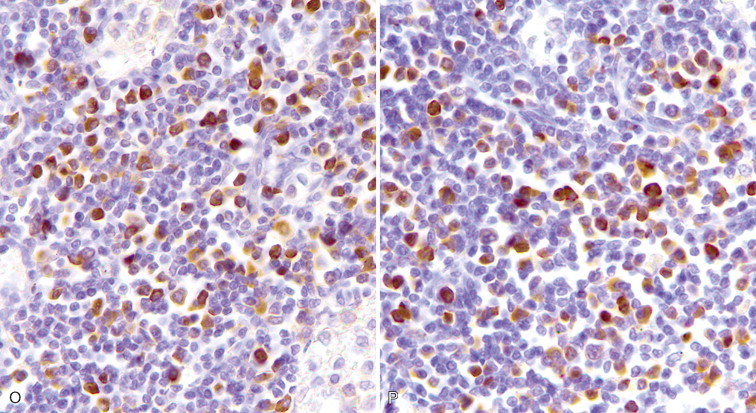
A–P, Troubleshooting in immunohistochemistry. A, Tissue section cut several weeks before immunohistochemical testing shows no staining for Ki67 as a result of tissue section aging. B, Compare the same tissue section when cut fresh and immunohistochemistry is performed that shows anti-Ki67 nuclear staining in several cells. C, A clean heating unit is shown, which helps avoid fluctuations in the incubation temperature. D, Note the buildup of salt deposits when using a steamer. E, Antigen retrieval (HIER with citrate) demonstrates MHC II-positive cells that include lymphocytes and histiocytes in a case of regressing canine cutaneous histiocytoma. F, Note only dendritic (Langerhans) cells are demonstrated when not using antigen retrieval. G, Myoglobin is only detected in striated muscle (asterisk) of esophagus when no antigen retrieval is used. H, Nonspecific staining due to antigen retrieval with proteinase K in blood vessels (v), smooth muscle (s), and mucosal epithelium (e).I, The primary antibody is too concentrated and nonspecifically reacts with many cells. J, Optimal dilution of the primary antibody showing reactivity for anti-Rotavirus A only in infected cells of this section of small intestine. K, Strong staining of hepatocytes with antibody to CD79a, a B-cell marker. L, The majority of epithelial cells in this section of small intestine have strong supranuclear staining with antibody to rotavirus A, which was considered nonspecific. Similar staining (supranuclear) has been observed in different mucosal epithelia with other monoclonal antibodies targeting infectious agents. M, CD79a antibody sometimes produces strong nuclear staining in lymphocytes without demonstrable cytoplasmic staining. This pattern of staining is considered nondiagnostic. N, Autolyzed tissues may show abnormal location of some proteins. Parathyroid gland showing strong nuclear and cytoplasmic staining for CKs. O, Use of negative reagent control section to demonstrate positive nonspecific staining by numerous plasma cells in this section of lymph node with a primary antibody for natural killer cells. P, A similar tissue section with the primary antibody replaced with nonimmune serum. The staining is almost identical. These results are interpreted as binding of the secondary antibody to immunoglobulin-producing cells (plasma cells).
(A-B, Courtesy of Dr. Kim Maratea, Purdue University.)
FIGURE 17-2.
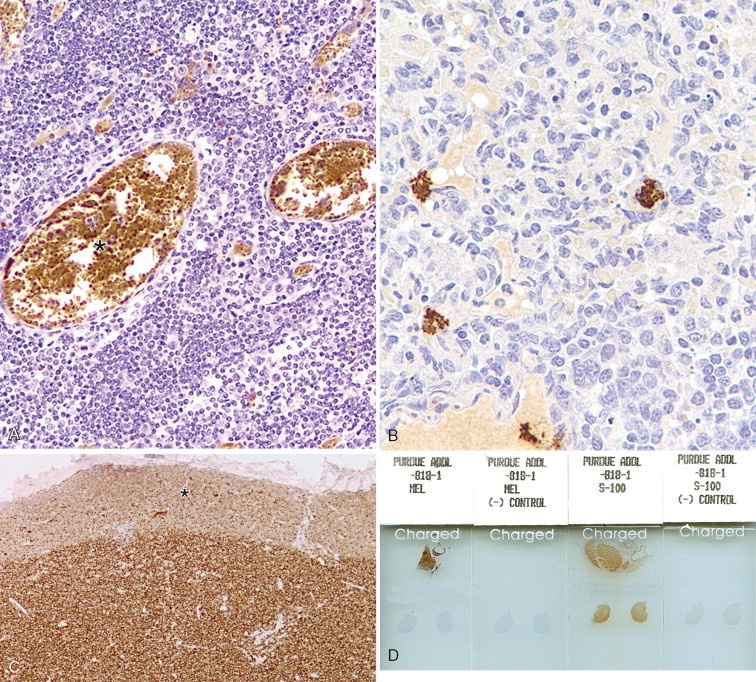
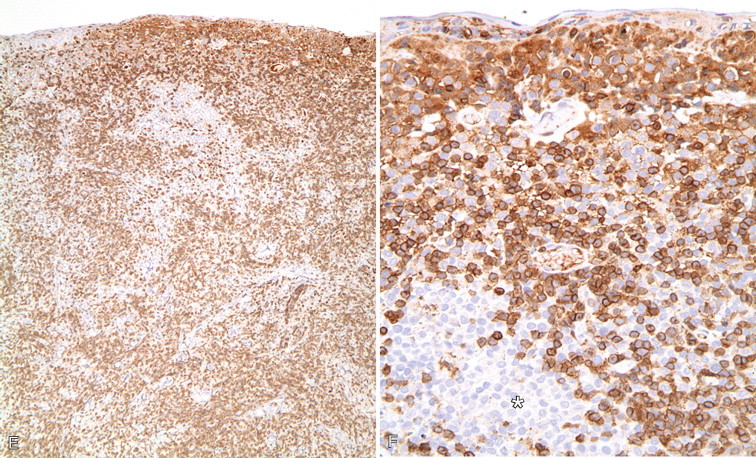
A–F, Troubleshooting in immunohistochemistry. A, This section of lymphoid tissue was not pretreated with hydrogen peroxide to remove endogenous peroxidase activity. Red blood cells (asterisk) contain abundant endogenous peroxidase activity. B, Nonspecific DAB precipitate can mimic true staining. C, The border of the section (asterisk) is less stained than the center due to loss (evaporation) of reagents during prolonged incubation, in this case of lymphoma stained for CD3. D, Four slides show the results for the two markers Melan-A and S100. Each marker has two tissue sections on two slides; one slide incubated with the primary antibody (slides labeled as MEL and S-100) and one slide in which the primary antibody has been replaced with nonimmune serum or immunoglobulins [slides labeled as (-) CONTROL]. It is advisable to add a known positive control to the same slide that contains the test tissue section (in this case, the positive control is the brown-stained tissue in the upper half of the slides). This case was positive for S100 and negative for Melan-A (test tissues are in the lower half of the slides). E, Low magnification of a case of regressing cutaneous histiocytoma demonstrating the more abundant reactive CD3-positive lymphocytes than neoplastic Langerhans cells. F, Higher magnification of E showing Langerhans cells which are unstained with antibody to CD3 (asterisk).
The Use of Controls
The same type of controls described under IHC is used for ICC (tissue and reagent controls). Ideally, the control tissue sample should contain the antigen of interest and be fixed and processed in an identical way to the test sample. The ideal positive control should demonstrate immunoreactivity that is weak in some places and strong in others. A negative reagent control is also necessary for each antibody tested (see Fig. 17-2). For the negative reagent control, either an irrelevant antibody or nonimmune serum from the same species as the primary antibody (and ideally the same Ig isotype for monoclonal antibodies) replaces the primary antibody (Fetsch and Abati, 2004). The slide with the negative reagent control should be processed in an identical manner as the slide with the primary antibody. The negative control slide is used to assess nonspecific staining that is not the result of specific antigen-antibody binding (background staining). If only one slide is available, it may be used divided into test and negative reagent control by circling the areas of interest with a diamond or wax pen or using the cell transfer technique already mentioned (DeLellis and Hoda, 2006). In some instances, a slide negative for one marker can be used to test a second marker.
Panel Markers for Diagnostic Immunohistochemistry of Tumors
The goal of diagnostic IHC is to maximize sensitivity without compromising specificity of results. A typical approach is to cover the main tumor types with antibody panels that include cytokeratins (carcinoma), vimentin (sarcoma), S-100 (melanomas or peripheral nerve sheath tumors), and CD45 (leukocytic neoplasms). To achieve maximum sensitivity, the use of “redundant” antibodies for a given antigen is recommended: in other words, the use of several antibodies that should label the same cell type. Table 17-2 lists cell markers and their use in the immunochemical diagnosis of tumors, with emphasis on organ system. In human pathology, the following expanded panel has been proposed: Pan-cytokeratin (carcinomas), CD45 and CD43 (lymphomas), S-100 and Melan-A or gp 100 (melanomas), vimentin and collagen IV (sarcoma) (Yaziji and Barry, 2006). Some of these markers are not available or not reactive in animal tissues, so alternatives need to be found. Once other clinicopathologic data has been examined judicious use of antibodies is the best approach: it will reduce both the cost of testing and the need to explain unexpected reactions to the client. Once a particular tumor group has been identified (e.g., sarcoma), more specific markers to determine the type of tumor are used. This approach is based on algorithms. Fig. 17-3 shows a basic algorithm to characterize tumors frequently found in domestic species. This algorithmic approach is borrowed from the human experience; unfortunately many markers currently used in human pathology are not reactive in animal tissues or their reactivity is different (in other words, when dealing with IHC, not all animal species and antibodies are created equal). This problem is compounded because the extensive testing (validation) of antibodies used in human diagnostic IHC is almost nonexistent in veterinary medicine. The lack of predictive behavior (percentage of positive cases of a tumor with a particular antibody) is one of the most difficult barriers to overcome in veterinary diagnostic IHC. The use of a particular marker will be also determined by its availability in the laboratory. Many antibodies with diagnostic or prognostic significance in human pathology await validation in similar tumors of animals (Capurro et al., 2003). A similar algorithmic approach can be used in immunocytochemistry.
TABLE 17-2.
Markers Used for the Differential Diagnosis of Major Tumor Categories
| Tumor Tissue | Markers |
|---|---|
| Adrenal |
|
| Endocrine tumors (generic) | Chromogranin A, synaptophysin, PGP 9.5, neuron specific enolase (NSE), S100 |
| Epithelial vs. mesenchymal | Cytokeratins (epithelial), vimentin (mesenchymal), E-cadherin (epithelium), p63 (basal cells, myoepithelium) |
| Leukocytic | CD45 (panleukocytic), CD18 (with emphasis in histiocytic), CD11d (dendritic cells), E-cadherin (Langerhan's cells), lysozyme (histiocytes), myeloid histiocytic marker (histiocytes, myeloid cells) |
| Liver | Hep Par 1 (hepatocytes), cytokeratin 7 (bile duct epithelium) |
| Lymphoid | CD3 (T-cell), CD79a and CD20 (B-cell), CD45 and CD18 (panleukocytic), MUM1 (plasma cells) |
| Mast cell tumors | CD117, tryptase, OCT3/4 |
| Melanocytic tumors | Melan A, S100, NSE |
| Muscle differentiation | Actin muscle (all muscle), smooth muscle actin (smooth muscle), myoglobin (skeletal muscle), actin sarcomeric (striated muscle), desmin (all muscle), calponin (smooth muscle, myofibroblast, myoepithelium) |
| Neurogenic tumors | S100 (neurons, glial cells), neurofilament (neurons), GFAP (glial cells), glut1, nerve growth factor receptor (perineural cells) |
| Pancreas (endocrine) | Insulin, glucagon, somatostatin, synaptophysin, PGP 9.5, chromogranin A |
| Squamous vs. adenocarcinoma | Squamous cell carcinoma (CK5, p63); adenocarcinoma (CK7) |
| Testis and ovary | Sex cord–stromal tumors (inhibin-α, NSE); germ-cell tumors (calretinin, KIT, PGP 9.5) |
| Thyroid | Thyroglobulin (follicular cells), calcitonin (medulla, C-cells), TTF1 (follicles and medulla) |
| Urinary tumors | Uroplakin III, cytokeratin 7, COX-2, COX-1 |
| Vascular tumors (endothelium) | Factor VIII–related antigen, CD31 |
FIGURE 17-3.

Simplified algorithmic approach for canine tumor diagnosis using immunochemistry. Cytokeratins, vimentin, CD45, and S-100 provide the starting point to help distinguish several carcinomas, sarcomas, neural tumors, and hematopoietic neoplasms from each other.
Antibody personality profile (APF) is a new concept introduced by Yaziji and Barry (2006). An APF is defined by 1) location of expected signal (e.g., cytokeratins are exclusively cytoplasmic; S-100 protein and calretinin are cytoplasmic and nuclear; CD45, CD11 are in the cell membrane; laminin, collagen IV are found only in the interstitium); 2) antibody pattern (S-100 produces a homogeneous signal; cytokeratins, a filamentous signal; chromogranin A and Melan-A, a granular signal); 3) antibody-characteristic pattern across tissues and tumors (thyroid transcription factor-1 [TTF-1] stains most neoplastic cells in a pulmonary carcinoma; uroplakin III stains only a small percentage of tumor cells). Knowledge of the profile facilitates accurate interpretation of immunohistochemical results. Keep in mind that the APF may vary among animal species (Ramos-Vara et al., 2000, 2002b).
Immunochemical Diagnosis of Anaplastic or Metastatic Tumors
The number of antibodies available for diagnostic purposes has increased exponentially in the last few years. This gives the diagnostician more opportunities to make a definitive diagnosis. Keep in mind that regardless of the number of markers used to characterize a particular tumor, the gold standard before attempting IHC should be HE. A careful examination of HE-stained slides will reduce the number of markers needed to arrive to a definitive diagnosis. Even after that, it is uncommon to make a definitive diagnosis with only one marker because expression (or lack of thereof) of proteins in tumor cells may differ from that in the normal cell counterpart. Upregulation and downregulation of gene expression and the proteins codified by such genes is common in neoplastic cells. The use of tumor marker panels in the diagnosis of metastatic disease is key to improving our chances of arriving at a definitive diagnosis. Considering the relatively low cost of IHC and the expenses of treating some tumors, clinicians are keen to get a definitive answer from the pathologist. A treatment tailored to a specific tumor will more likely improve the quality of life of the animal.
The proposed series of steps to characterize a metastatic tumor has been modified from Dabbs (2006) and include: 1) Determine the cell line of differentiation using major lineage markers. 2) Determine the cytokeratin type for carcinomas and possible coexpression of vimentin. 3) Determine if there is expression of cellspecific products, cell-specific structures, or transcription factors unique to specific cell types. The main difference with the algorithmic approach for a metastatic tumor is that without knowing the location of the primary tumor, the differential diagnosis includes more tumor types and the tumor marker panel therefore includes more antibodies.
Determine the Cell Line of Differentiation
Markers should include keratins as well as lymphoid, melanoma, and sarcoma markers (Chijiwa et al., 2004; Höinghaus et al., 2008). A basic panel of markers for small animals is: pancytokeratins (clones AE1/AE3 or MNF 116), CD45 (panleukocytic marker), Melan-A or S100 (melanocytic differentiation), and vimentin (mesenchymal differentiation).
Determine the Cytokeratin Type for Carcinomas and Coexpression of Vimentin
Cytokeratins comprise approximately 20 polypeptides with different molecular weight, numbered 1 through 20. They are separated by charge into acidic (type I) and basic (type II) keratins. Cytokeratins are paired together as acidic and basic types. Most low–molecular weight keratins (e.g., CK 7, 8, 18, 20) are present in all epithelia except squamous epithelium, whereas high–molecular weight keratins (e.g., CK 1, 2, 3, 4, 9, 10) are typically present in squamous epithelium. Almost all mesotheliomas and carcinomas, except squamous cell carcinomas, have CK 8 and 18. The coordinate expression of CK 7 and CK 20 is one criterion to classify carcinomas in human pathology. This approach has proven very useful in metastatic carcinomas of undetermined origin. There is only one paper published regarding domestic animals that examines a wide range of carcinomas in dogs and cats for expression of CK 7 and CK 20 (Espinosa de los Monteros et al., 1999). Results for CK 7 were similar to those in humans, but major differences were observed for CK 20 among both animal species. CK 5 is a useful marker of myoepithelial differentiation in glandular tumors as well as for squamous epithelium and mesothelial cells. Although cytokeratins are the typical marker of epithelial differentiation, they can be detected in mesenchymal tumors (melanoma, leiomyosarcoma, gastrointestinal stromal tumors, liposarcoma, meningioma, and angiosarcoma), although usually in only a few cells, as opposed to the diffuse and strong staining of carcinomas and sarcomatoid carcinomas (Dabbs, 2006). Coexpression of intermediate filaments has been reported in certain human fetal and adult tissues.
Some carcinomas frequently express vimentin, particularly endometrial carcinoma, renal cell carcinoma, salivary gland carcinoma, spindle cell carcinoma, and thyroid follicular carcinoma. In a few cases, coexpression of CKs and vimentin is observed in colorectal, mammary, prostatic, and ovarian carcinomas.
Expression of Cell-Specific Products
This group of markers includes proteins or glycoproteins produced by a few cell types. The exact function of some of these proteins is unknown.
Neuroendocrine Markers.
Within the generic neuroendocrine markers, synaptophysin and chromogranin A are the most commonly used and specific for this group of tumors. Antibodies for these markers work well in most animal species. Keep in mind that synaptophysin, in addition to staining the majority of pheochromocytomas of the adrenal gland, may stain a significant number of adrenal cortical tumors as well. Neuron specific enolase (NSE) is another classic generic neuroendocrine marker. Unfortunately, this marker is less specific than its name claims and stains other nonendocrine cell types, making its use in diagnostic IHC questionable. A recently used neuroendocrine marker in veterinary pathology, protein gene product (PGP) 9.5, a ubiquitin hydrolase, labels many neuroendocrine cells but also labels unrelated tumors (RamosVara and Miller, 2007). Antibodies to peptide hormones (e.g., thyroglobulin, calcitonin, glucagon, insulin) usually cross-react among different animal species and demonstrate specific endocrine cell types.
Specific Markers.
Every year, numerous scientific papers report the characterization of “novel” markers (antibodies) that are extremely specific for particular human cells or tumors. Most eventually will be relegated to use in combination with other antibodies (as part of a tumor panel). In this section are presented some markers that are useful in the characterization of specific animal tumors. Thyroid transcription factor-1 (TTF1), a nuclear transcription factor, is frequently expressed in thyroid tumors (more common in follicular, but also present in medullary, tumors) and pulmonary tumors (Ramos-Vara et al., 2002a, 2005). Other tumors, including mesotheliomas, are usually negative. Hep Par 1 (hepatocyte paraffin 1) is consistently detected in hepatocytes and their tumors with no staining of biliary epithelium, which makes it a good choice to distinguish these tumors, particularly when used in conjunction with CK 7 (Ramos-Vara et al., 2001a). However, some intestinal, and probably pancreatic, tumors can be positive (Ramos-Vara and Miller, 2002). Melan-A is one of the best specific and sensitive markers of melanomas in dogs (less sensitive in feline melanomas) and certainly more specific than other classic markers such as S100 and NSE (Ramos-Vara et al., 2000, 2002b). It should be noted that many steroidproducing tumors from the adrenal cortex, testis, and ovary show strong reactivity for Melan-A (Ramos-Vara et al., 2001b). Uroplakin III, a major component of the asymmetric unit of transitional epithelium, is expressed in most canine transitional cell carcinomas and, in conjunction with CK 7, the number of transitional cell carcinomas detected approaches 100% (Ramos-Vara et al., 2003). Uroplakin III has not been detected in nonurothelial normal or neoplastic tissues of dogs which makes this marker the exception to the rule (coexpression of the same marker in different cell types).
A marker widely used in human pathology to discriminate mesothelioma from carcinoma is calretinin. However, attempts to use it in canine mesotheliomas with a variety of antibodies have been unrewarding. There is a report of calretinin staining in equine mesothelioma (Stoica et al., 2004). The differential diagnosis of mesothelioma and pulmonary carcinoma is challenging in human pathology and numerous antibodies have been tested. A recent study indicates that the combination of D2-40 and calretinin (both positive in mesothelioma and negative in lung carcinoma) and CEA and TTF-1 (both negative in mesothelioma and positive in pulmonary carcinoma) antibodies is an economic way to distinguish these two types of tumors (Mimura et al., 2007). Desmin is detected in reactive mesothelial cells but not in mesothelioma or carcinoma in cytologic preparations (Afify et al., 2002). As previously mentioned, TTF-1 is a specific and sensitive marker of canine pulmonary and thyroid carcinomas. The use of CEA on animal tumors is very limited. We are not aware of D2-40 staining of mesotheliomas in animal species. The use of both cytokeratins and vimentin (usually coexpressed in mesotheliomas) is probably the best approach to distinguish mesothelioma from pulmonary carcinoma in animals (Geninet et al., 2003; Morini et al., 2006; Sato et al., 2005; Vural et al., 2007).
A smooth muscle–specific protein, calponin, has been evaluated in canine mammary tumors (Espinosa de los Monteros et al., 2002). In addition, Webster et al. (2007b) studied the expression of the embryonic transcription factor OCT4 in canine neoplasms.
Antibodies as Prognostic Markers in Veterinary Oncology
IHC in oncology is useful as a tool to determine tumor prognosis or disease outcome. This is a topic of intense investigation in human pathology, and not without controversy. Prognostic markers are currently under investigation for some animal tumors. Briefly discussed below are proliferation markers, telomerase activity, KIT stem cell factor, and immunophenotypic changes during cancer progression.
Proliferation/Cell Cycle Markers
This group includes Ki67, PCNA and cyclins, and in general indicates the proportion of proliferating/cycling cells in a given tumor; these markers correlate well with mitotic index. Malignant tumors generally have more proliferating cells than benign tumors, with some exceptions. Lymphomas, mammary tumors, melanocytic tumors, and mast cell tumors are probably the tumors in domestic species in which these markers have been studied most extensively (Ishikawa et al., 2006; Kiupel et al., 1999; Madewell, 2001; Sakai et al., 2002). In mast cell tumors, there is good correlation between decreased survival time and Ki67 index and between the histochemical detection of nuclear organizing regions (AgNORs), which determine the rate of cellular proliferation (generation time) and decreased disease-free interval (Webster et al., 2007a). In a different study (Scase et al., 2006), both AgNORs and Ki67 scores were considered useful prognostic markers for canine mast cell tumors, with Ki67 score used to divide Patnaik grade 2 mast cell tumor into 2 groups showing markedly different actual survival times. PCNA score did not correlate with differences in survival times of several types of tumors (Roels et al., 1999; Scase et al., 2006; Webster et al., 2007a). The prognostic significance of detection of cyclins in animal tumors has not been fully evaluated (Murakami et al., 2001).
Telomerase
Telomeres are portions of repetitive DNA that protect chromosomes from degradation and loss of essential genes (Cadile et al., 2007). With each cell division, telomeres progressively shorten in all somatic cells until cells undergo replicative senescence or apoptosis. Telomerase is a ribonucleoprotein enzyme complex that synthesizes telomere DNA. In normal cells telomerase is detected in male germ cells, activated lymphocytes, lens tissue, and stem cell populations but not in somatic cells. In human cancer, telomerase activity is detected in 85% to 90% of cases and in dogs more than 90% of tumors examined express telomerase activity (Kow et al., 2006). Telomerase expression in dogs is significantly associated with tumor proliferation (Ki67 labeling index) and/or tumor grade (Long et al., 2006). Immunohistochemical detection of telomerase could be useful as a prognostic marker and tool to determine the therapeutic approach to cancer (Argyle and Nasir, 2003).
KIT
The KIT protein, a tyrosine kinase receptor product of the c-kit proto-oncogene, is expressed in numerous tissues and cells including mast cells and mast cell tumors. Immunohistochemical staining patterns of KIT in canine mast cell tumors have been used as a prognostic tool (Kiupel et al., 2004). In a normal mast cell, KIT is localized in the cell membrane; localization within the cytoplasm in mast cell tumors has been linked to increased rate of local recurrence, decreased survival rate, or increased tumor grade (Reguera et al., 2000).
Epithelial-Mesenchymal Transition (EMT)
Observed in some human cancers is the loss or redistribution of epithelial markers and gain of mesenchymal markers. EMT is usually associated with one or more of the following tumor features: increased tumor cell motility, invasive potential, tumor grade or tumor stage (Baumgart et al., 2007). The most common proteins affected in EMT are epithelial markers (E-cadherin, beta-catenin, and plakoglobin) and mesenchymal markers (N-cadherin and vimentin). Although it is likely to occur, there is no published evidence of EMT or its prognostic significance in cancer of domestic animals.
ELECTRON MICROSCOPY
The ultrastructural examination of tissues and cells is one of the most common ancillary methods used in diagnostic cytology and pathology (Dardick et al., 1996). If the markers of immunohistochemistry are structural or secretory proteins specific for a cell or tissue, then the markers of electron microscopy (EM) are subcellular structures such as organelles or matrix constituents. Electron microscopy has contributed in great measure to an understanding of the structural features of normal and pathologic tissues. Although the use of EM has declined in the last decade and been partially replaced by other techniques (e.g., immunohistochemistry), EM is still a very valuable tool to reach a definitive diagnosis in some difficult cases, particularly in peripheral nerve sheath tumors, some synovial sarcomas, pleomorphic sarcomas, and mesotheliomas (Dardick and Herrera, 1998; Mackay, 2007). EM and IHC should be used in a complementary fashion based on the type of diagnostic problem (Fisher, 2006). As an ancillary technique, EM raises the level of confidence in diagnoses based on light microscopy. Of the three main types of ancillary techniques currently used in veterinary pathology (EM, IHC, PCR), EM is the most mature technique, meaning that it has gone through the usual stages of development, evaluation and, stabilization as opposed to the other two techniques that are still in development or evaluation stages. As the saying goes, embrace the new techniques if they are worthy and keep the proven old ones.
Pros and Cons of Electron Microscopy
Advantages of EM
-
•
It is the only method to examine the fine detail of tissues and cells (organelles, inclusions, pigments, extracellular matrix).
-
•
There is a wealth of information on ultrastructural pathology in the literature of the last 40-plus years.
-
•
Although not optimal, formalin-fixed (and even paraffin-embedded) tissues can be used.
-
•
It can identify infectious agents not previously reported (and therefore without specific antibodies or genetic probes).
-
•
Many microorganisms are more resistant to autolysis than eukaryotic cells (and therefore warrant ultrastructural examination in suboptimally preserved tissues) (FIGURE 17-4, FIGURE 17-5, FIGURE 17-6, FIGURE 17-7 ).
-
•
For some tumors, it is the most reliable method for diagnosis (Fig. 17-8 ).
-
•
For certain lesions (e.g., glomerular disease) EM is still the gold standard method (Fig. 17-9 ).
-
•
Immunologic assays can be performed on EM samples.
-
•
EM complements immunohistochemistry.
-
•
Cellular structures are nearly identical among animal species at the ultrastructural level (in IHC, in contrast, it is not unusual to be unable to demonstrate a particular antigen in a new species due to lack of interspecies cross-reactivity).
FIGURE 17-4.
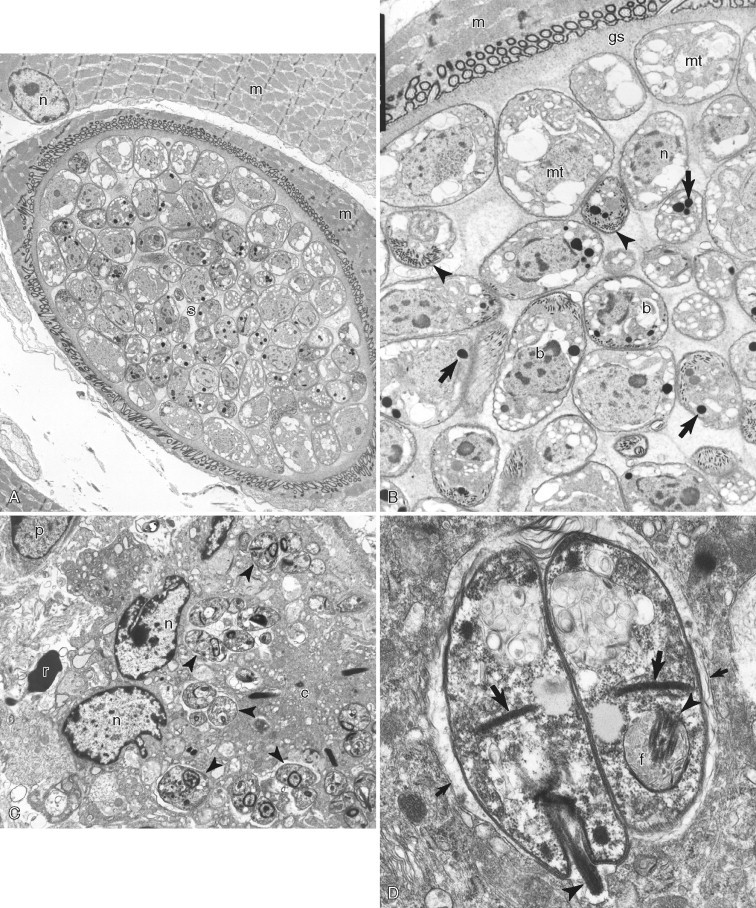
A–D, Ultrastructure of microorganisms. A, Skeletal muscle in a mink with Sarcocystis cyst (s) within a skeletal muscle cell (m) with its nucleus (n). B, Higher magnification of the Sarcocystis cyst reveals metrocytes (mt), bradyzoites (b), and ground substance (gs) surrounded by the cyst wall (cw in white lettering). Typical structures of coccidian parasites are micronemes (arrowheads) and rhoptries (arrows). Skeletal muscle (m) contains the cyst. Note the nucleus (n) of a bradyzoite. C, The dermis of a horse with Leishmania amastigotes (arrowheads) within a multinucleate giant cell. Note the nucleus (n) and cytoplasm (c) of multinucleate giant cell. A red blood cell (r) and plasma cell nucleus (p) are partially visible. D, Higher magnification of two Leishmania amastigotes showing the kinetoplast (thick arrows), flagellum (arrowhead), and flagellar pocket (f) within the parasitophorous vacuole (thin arrows).
FIGURE 17-5.
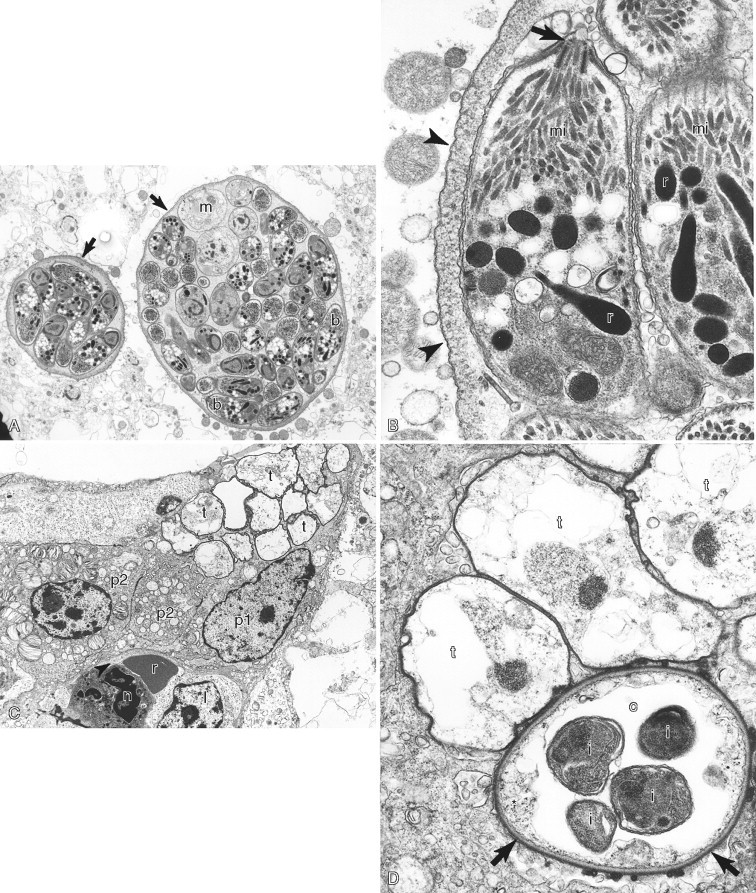
A–D, Ultrastructure of microorganisms. A, Brain in a cat showing two Toxoplasma gondii cysts (arrows) that contain numerous bradyzoites (b in white lettering) and fewer immature merozoites (m). B,Toxoplasma bradyzoites with conoid (arrow), micronemes (mi), and rhoptries (r) surrounded by a cyst wall (arrowheads). C, Lung of a pig with numerous Pneumocystis carinii trophozoites (t) on the alveolar surface. Note the type one (p1) and type 2 (p2) pneumocytes, red blood cell (r), neutrophil (n), and lymphocyte (l). D, Three trophozoites (t) and one cyst (c) form. Note the cyst has a thick cell wall (arrows), a rudimentary cytoplasm (asterisk), and four intracystic bodies (i).
FIGURE 17-6.
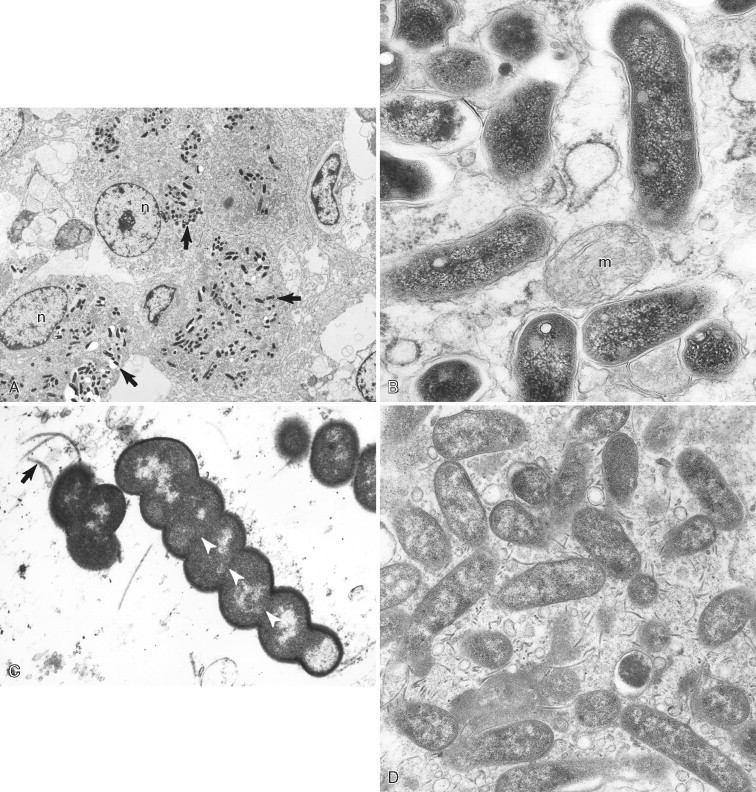
A–D, Ultrastructure of bacteria. A, Goat intestine with Mycobacterium avium subsp. paratuberculosis (arrows) within epithelioid macrophages. Note the nucleus (n) of the macrophages. B, Higher magnification of mycobacterial organisms indicating a mitochondrion (m). C, Pig stomach with Helicobacter sp. Note flagella (arrow) and periplasmic filaments (arrowheads in white). D, Dog stomach with Campylobacter-like organisms. Numerous flagella are observed in this field.
FIGURE 17-7.

A–D, Ultrastructure of viral infections. A, Cat intestine with a crypt lined by epithelial cells (e). Two epithelial cells, one free (asterisk in white) in the crypt lumen (L), have pyknotic nuclei and intranuclear feline panleukopenia viral inclusions (I in white lettering). B, Higher magnification of feline panleukopenia viral particles forming distinct arrays (arrows). C, Mink bronchiole with numerous ciliated cells that contain intracytoplasmic distemper viral inclusions (I in white lettering). Note the nucleus (n) of a ciliated epithelial cell with many cilia (arrows), mucus cell (asterisk), basement membrane with collagen bundles (arrowheads), and smooth muscle cell (s). D, Higher magnification of bronchiole demonstrating distemper viral inclusions (I in white lettering). Note the intercellular junctions (arrows) between two infected epithelial cells and the nuclei of the two epithelial cells (e).
FIGURE 17-8.
A–D, Ultrastructure of mesenchymal neoplasia. A, Perivascular wall tumor from the skin of a dog demonstrating a capillary vessel lumen (l) that is lined by endothelial cells (e), a pericyte (arrow), and collagen fibers (c). Neoplastic pericytes (asterisks in white) form multiple layers around the vessel. B, Leiomyosarcoma in the intestine of a dog with spindloid neoplastic cells (s) that have characteristic subplasmalemmal and cytoplasmic densities (arrows) of smooth muscle cells. Note the extracellular matrix (m). C, Low magnification and (D) higher magnification. of a canine case of hemangiosarcoma in the skin. The neoplastic capillary vessel lumens (l) are lined by atypical endothelial cells (e) that have a large nucleus with abundant euchromatin and a prominent nucleolus. Also present are red blood cells (r), extracellular matrix (m), and pericytes (arrows).
FIGURE 17-9.
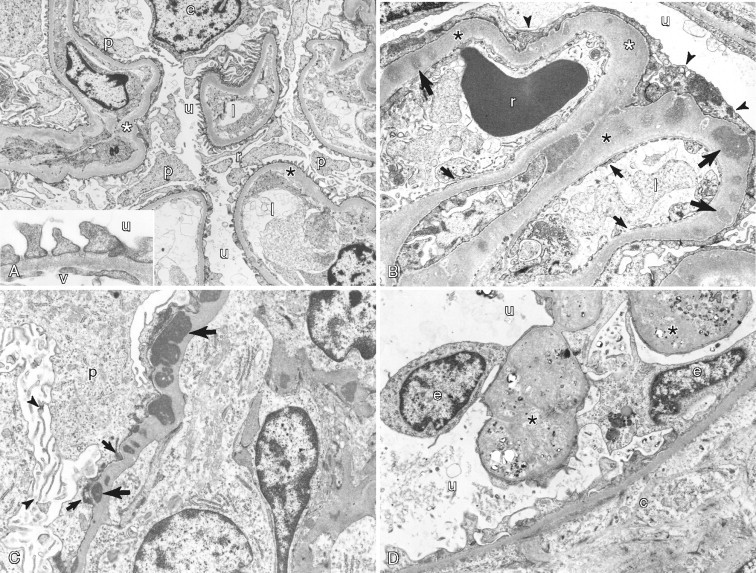
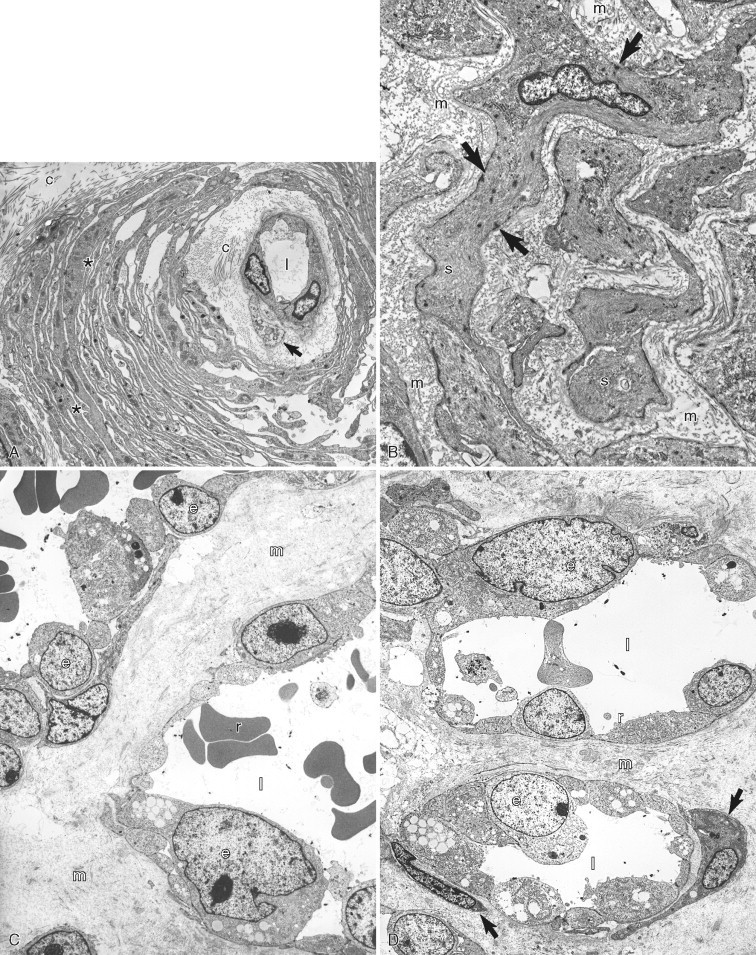
A–D, Ultrastructure of normal kidney and glomerular disease. A, Normal structure of the equine glomerulus showing the urinary space (u) with basement membrane (asterisks) lined by podocyte processes (p). Note that foot processes of podocytes are distributed evenly over the surface of the basement membrane. Lumen of capillary (l) is shown. Inset: Higher magnification of the filtration unit of the glomerulus showing the urinary side (u) versus the vascular side (v). B, Membranous glomerulonephritis in a cat reveals irregular thickening of the basement membrane (asterisks) of the glomerulus. The basement membrane has multiple immune-complex electron-dense deposits (long arrows). Note the fused foot processes of podocytes (arrowheads). Lumen of capillary vessel (l) is surrounded by a fenestrated lining (short arrows). Also shown is a red blood cell (r) and the urinary space (u). C, Membranous glomerulonephritis in a dog demonstrates irregular thickening of basement membrane that contains multiple immune-complex electron-dense deposits (long arrows), some in a subepithelial location (short arrows). Note microvilli (arrowheads) on the surface of a podocyte (p). D, Canine glomerulocystic kidney disease has parietal epithelium (e) that is hypertrophic and distorted, containing abundant, mildly electron-dense material (asterisks). The associated Bowman's capsule (c) is expanded by extracellular matrix and surrounds the urinary space (u).
Disadvantages of EM
-
•
Sample preparation is rather tedious.
-
•
Optimal preparation is only achieved with special fixation.
-
•
Pathologic changes are sometimes difficult to distinguish from autolysis or processing artifacts.
-
•
Sampling may not be representative due to small sample size (an important limiting factor for heterogeneous lesions); pitfalls include the presence of necrotic, normal, or stromal tissue.
-
•
Overall, it is more expensive than immunohistochemistry.
-
•
It requires expensive equipment and highly skilled technicians.
-
•
Examination of samples is very tedious.
-
•
Pathologists with extensive experience and interest in ultrastructural pathology are an endangered species.
Basics of Electron Microscopy
Fundamentals
The principle on which the transmission electron microscope operates is similar to that of the light microscope—i.e., lenses are used to magnify images. The main difference used to produce images is in the type of radiation, which for EM is electrons, and the means to focus, which for EM is electromagnetic lenses. The resolving power of an electron microscope is around 0.2 nm or less, much higher than that obtained with a photonic microscope (200 nm) or with a fluorescence microscope (100 nm). Processing a sample for EM is basically similar to that for light microscopy, paraffin-embedded samples, but the reagents used are different.
Fixation
The speed of fixation is critical in EM to avoid changes due to autolysis. As previously mentioned, the fixative of choice for light microscopy is formaldehyde. For routine electron microscopy glutaraldehyde is the gold standard, with secondary fixation in osmium tetroxide. These two fixatives are complementary: glutaraldehyde stabilizes proteins and osmium tetroxide stabilizes lipids. Glutaraldehyde has a slower diffusion rate than formaldehyde and very small samples (around 1 mm3) are required for optimal fixation. Formaldehyde is not an optimal fixative but in diagnostic pathology is the most commonly used primary fixative for EM, particularly when ultrastructural studies are not considered initially in the diagnostic workup. Due to the impurities of commercially available formaldehyde solutions (e.g., formic acid, methanol), ultrastructural preservation is compromised. Tissues fixed in paraformaldehyde (an aldehyde from which formaldehyde is produced) are more amenable to immunoelectron microscopy than those fixed in glutaraldehyde.
Processing of Fixed Samples
Fixed samples are dehydrated and embedded in a liquid resin that polymerizes to produce a hard block that is cut using special glass or diamond knives in an ultramicrotome. Epoxy resins are the standard embedding material, but for special procedures (e.g., immunoelectron microscopy) acrylic resins such as Lowicryl and LR White resins are preferred (Bancroft and Gamble, 2007). For cell suspensions (fine-needle aspirates, cytology samples), samples are pre-embedded in a protein medium (e.g., agar, bovine serum albumin). Semi-thin sections (0.5 to 1.0 μm) are first cut to localize the most appropriate portion of the sample to section at an approximate thickness of 60 to 90 nm (silver to straw-colored ultra-thin sections). Routine sections are usually stained with uranyl acetate and lead citrate (osmium fixative will also stain membranes and lipid vacuoles). FFPE tissues can be used when no other sample is available. Keep in mind that the degree of preservation of organelles and membranes in FFPE samples may be severely compromised.
Approach to Diagnostic Ultrastructural Pathology
Sample selection and interpretation of electron micrographs is heavily biased by the clinical history and light microscopy findings. After examination of FFPE tissues under the light microscope, differential diagnoses are made and additional ancillary techniques (e.g., EM, IHC) are requested for further characterization of that lesion. After examining a lesion by light microscopy, the pathologist will determine which features to seek at the ultrastructural level. During the ultrastructural examination, a good observer may find additional, unexpected features that prompt reconsideration of the original diagnosis. Formalin fixation or delayed fixation will probably create artifacts that may render the sample unsuitable for thorough ultrastructural evaluation but still adequate to detect specific features (e.g., viral particles, parasites, inclusions, crystals). Buffered formaldehyde (approximately pH 7.4) will reduce the loss of cellular components and tissue shrinkage.
A sequential (orderly) approach to the ultrastructural study of tumors involves: topographic cellular relationships → external lamina → cell contours → intercellular junctions → cytoplasmic granules → cytoplasmic filaments; cytoplasmic vacuoles and vesicles → type and distribution of organelles → nuclear and nucleolar morphology → stroma.
In case of a conflict of interpretation between light microscopy and electron microscopy, re-evaluation of findings is mandatory. As a rule, if discrepancies still persist, light microscopy findings should prevail due to the far greater amount of tissue examined. However, the current specialization of pathology makes the use of multiple ancillary techniques (EM, IHC, PCR) common in difficult cases and careful evaluation of all results needs to be made before establishing a final diagnosis. Malignancy cannot be determined on ultrastructural grounds. Establishment of a malignant phenotype is in the realm of light microscopy and tumor biologic behavior, supported in very specific cases by immunohistochemical and molecular tests. Tables 17-3 and 17-4 are intended to give the reader a general approach to the ultrastructural characterization of common tumors.
TABLE 17-3.
Organelle Approach to Tumor Diagnosis
| Organelle | Features | Tumor |
|---|---|---|
| Basal lamina | 50- to 100-nm–thick, moderately dense layer following the contours of the cell membrane |
|
| Extracellular matrix |
|
|
| Fibronexus | Cell-to-matrix structure composed of fibronectin filaments in the extracellular space and subplasmalemmal plaques with intracellular smooth muscle myofilaments. Difficult to observe in formalin-fixed tissues. |
|
| Filaments, intermediate |
|
|
| Filament, smooth muscle | 5- to 7-nm (actin) and 15-nm (myosin) thick with dense bodies and attachment plaques. | Leiomyosarcoma, hemangiopericytoma, myoepithelium, myofibroblast. |
| Filaments, striated muscle | Variable degree of differentiation (organization) of sarcomeric myofilaments (actin, myosin). | Rhabdomyosarcoma, rhabdomyoma. |
| Glycogen | Small, pale to dense particles (30 nm) or rosettes (100-200 nm). Empty areas of cytoplasm due to extraction during processing. | Muscle and liver tumors. Variable amount in many carcinomas and sarcomas. |
| Golgi apparatus | Packaging and biochemically altering proteins produced in RER. Stacks of membranes. | No specific tumor types. |
| Intercellular junctions |
|
Many epithelial and mesenchymal tumors. |
| Lipid | Not membrane-bound with amorphous to lamellar, variably dense matrix. Membrane-bound if in lysosomes. | Abundant in steroidogenic tumors, adipose tumors, sebaceous carcinoma, renal cell carcinoma. |
| Melanosomes | Rod-shaped or elliptical, 200-600 nm, single membrane granules. | Melanoma, melanocytic schwannoma. |
| Melanosome, compound | Aggregates of melanomes within secondary lysosomes. Variable stages of digestion. | Keratinocytes, macrophages, fibroblasts. |
| Microtubules | Long, cytoplasmic, 25-nm diameter tubules. | Abundant in neuronal and neuroendocrine tumors. |
| Mitochondria | Rounded, ovoid, rod-shaped, elongated, branched, annular (1000-nm width). Two limiting membranes and intermediate clear space. Cristae represent infoldings of inner membrane. Tubular or tubulovesicular cristae in cells with lipid and SER indicate steroidogenic phenotype (liver, adrenal cortex, Leydig, and ovarian cells). | Abundant in oncocytomas, hepatocellular tumors, renal cell carcinoma, steroid and muscle tumors. |
| Mucin granules | Single limiting membrane granules with flocculent, filamentous, reticulate, or homogeneous matrix with no halo. | Mucinous carcinomas. |
| Neuroendocrine granules |
|
|
| Nucleus |
|
|
| Primary lysosomes | Small (100-300 nm), rounded, or oval, single-membrane–bound granules. Dense, homogeneous, granular matrix. Crystalline core in eosinophil granules. | Myeloid sarcomas, histiocytic sarcomas, follicular thyroid carcinoma. Endocrine and steroidogenic tumors, granular cell tumors. |
| RER | Common; active protein synthesis (immunoglobulins, matrix, neuroendocrine, lysosomes). | Fibrosarcoma, plasmacytoma, osteosarcoma. |
| SER | Common in cells rich in lipid, glycogen, or steroid metabolism. | Sex cord–stromal tumors, hepatocellular tumors. |
| Secondary lysosomes | Variably sized, single-membrane–bound organelles with remnants of digested material. | Granular cell tumor. Myeloid leukemias, histiocytic sarcoma, prostatic and neuroendocrine tumors. |
| Serous/zymogen granules | Large (up to 1000 nm), single membrane–bound with a dense to pale matrix and no halo. | Serous carcinomas (e.g., salivary, pancreatic) |
| Synaptic vesicles | 40- to 80-nm, membrane-bound structures with clear interior | Differentiated neuronal tumors |
RER, Rough endoplasmic reticulum.
SER, Smooth endoplasmic reticulum.
TABLE 17-4.
Common Ultrastructural Features of Tumors
| Tumor Type | Cellular Features | Extracellular Matrix |
|---|---|---|
| Adenocarcinoma | Microvilli. Lumens. Junctional complexes. Secretory granules. Golgi apparatus. Endoplasmic reticulum. Cilia (+/−). | Basal lamina |
| Carcinoid/islet cell tumors | Insular arrangement of cells. Intercellular junctions (e.g., desmosomes). Numerous dense-core granules (variable size and morphology depending of tumor type). Variable intermediate filaments. |
|
| C-cell carcinoma of thyroid | Dense-core granules. Variable number of organelles (Golgi apparatus, RER, mitochondria). |
|
| Chondrosarcoma | Scalloped or villous-like cell surface. Abundant and dilated RER. Large Golgi apparatus. Abundant glycogen. Variable intermediate filaments. | Variable. Collagen, glycoprotein, glycosaminoglycans |
| Fibrosarcoma | Abundant rough endoplasmic reticulum. Cytoplasmic filaments. Golgi apparatus. Filopodia (+/−). | No basal lamina. Abundant collagen. |
| Gastrointestinal stromal tumor | Lack of distinct nuclear/cytoplasmic features or morphology similar to smooth, fibroblastic or nerve cells. | Basal lamina (+/−). Collagen. |
| Glomus tumor | Epithelioid cells. Many mitochondria. Thin filaments. Dense bodies. Pinocytotic vesicles. | Basal lamina. Collagen. |
| Granular cell tumor | Tightly apposed cells. Numerous cytoplasmic, membrane-bound, variable electron-dense granules (secondary lysosomes). | Basal lamina around groups of cells. |
| Hemangiopericytoma | Palisading arrangement around capillaries. Focal attachments and intercellular junctions. Pinocytotic vesicles. Intermediate filaments. Variable number of mitochondria, RER. | Abundant basal lamina and matrix. |
| Hemangiosarcoma | Prominent junctional complexes. Villous-like projections on the luminal aspect. Pinocytotic vesicles. Intermediate cytoplasmic filaments. Free ribosomes. Some mitochondria and RER. | Basal lamina. |
| Histiocytic sarcoma | Variably sized and shaped nuclei. Numerous cytoplasmic organelles (lysosomes, mitochondria, Golgi apparatus, lipid droplets [+/−]). Phagocytosed red blood cells or leukocytes (+/−). | No basal lamina. |
| Langerhans histiocytosis | Large, irregularly shaped nucleus. Numerous organelles (mitochondria, free ribosomes, rough endoplasmic reticulum, primary lysosomes). Filopodia. Absence of secondary lysosomes. | No basal lamina. |
| Leiomyosarcoma | Thin (6-nm) filaments and dense bodies among filaments within cytoplasm and subjacent to plasmalemma. Pinocytotic vesicles. Little RER. Round-ended nuclei. Contraction indentations of nuclei. | Basal lamina. |
| Leydig cell tumor | Lipid droplets. Abundant SER. Mitochondria with tubular cristae. Microvilli on cell surface. Canalicular-like spaces between cells. | Partial basal lamina. |
| Liposarcoma | Lipid droplets. Pinocytotic vesicles. Glycogen (+/−). Intermediate filaments. Mitochondria (+/−), Golgi apparatus (+/−), SER and RER (+/−). | Basal lamina. |
| Lymphoma | Many free ribosomes or polyribosomes. No intercellular junctions. Smooth, indented or convoluted nuclear membrane | No basal lamina. |
| Mast cell tumor | Round, indented nucleus. Numerous membrane-bound cytoplasmic granules of variable density. Filopodia | No basal lamina. Collagen. |
| Meningioma | Long, interdigitating cellular processes. Numerous intermediate filaments. Numerous intercellular junctions (e.g. desmosomes). Variable number of organelles. Glycogen (+/−). | Basal lamina (−/+). |
| Mesothelioma | Numerous long microvilli. Intercellular junctions. Filaments. Tonofibrils. Glycogen. Intracytoplasmic lumens. Lack of mucinous granules and glycocalix | Basal lamina. |
| Myofibroblastic sarcoma | Spindle shape. Prominent RER. Some thin (6-nm) and peripherally located filaments with focal densities. Fibronexus junction (+/−). | No basal lamina. Abundant matrix with collagen, proteoglycans, and glycosaminoglycans. Fibronectin. |
| Osteosarcoma | Scalloped or villus-like cell surface. Abundant and dilated RER. Large Golgi apparatus. Abundant glycogen. | Hydroxyapatite deposits on collagen fibers (osteoid) (+/−). |
| Paraganglioma | Clusters of cells. Round, dense-core granules. Prominent Golgi apparatus. Interweaving cytoplasmic processes. Paranuclear filaments (+/−). Sustentacular (Schwann-like) cells with filaments at the periphery of cell clusters. | Basal lamina surrounding cell clusters. |
| Parathyroid carcinoma | Islands of cells. Intercellular junctions. Interdigitation of lateral membranes. Dense-core secretory granules. Variable glycogen and cell organelles (RER, SLE, mitochondria, Golgi). Occasional clusters of oncocytic cells. | Basal lamina surrounding cell clusters. |
| Perineuroma | Whorls of slender cells with bipolar cytoplasmic processes. Pinocytotic vesicles. Scant organelles. | Discontinuous basal lamina. Collagen. |
| Pheochromocytoma | Clusters of polygonal cells. Large, pleomorphic, dense-core granules (sometimes clear or partially filled). Prominent Golgi apparatus. No significant number of sustentacular cells. |
|
| Plasmacytoma | Abundant rough endoplasmic reticulum. Membrane-bound dense bodies (+/−). Intercellular junctions (+/−). Eccentric nucleus. Paranuclear area with Golgi apparatus, centriole, mitochondria. | No basal lamina. Amyloid (+/−). |
| Rhabdomyosarcoma | Thick (15-nm) myosin filaments. Z-band formations. Sarcomeres. Thin (6-nm) filaments. Glycogen. Mitochondria (+/−). | Incomplete basal lamina. Collagen. |
| Schwannoma | Long intertwining processes. Variable number of mitochondria, RER, lysosomes. Intermediate filaments. | Basal lamina. Collagen in matrix. |
| Seminoma | Close, appositioned, round to polygonal cells. Intercellular junctions. Large, euchromatic nucleus. Prominent nucleoli. Abundant glycogen. Variable number of organelles; mainly free ribosomes. | Basal lamina (+/−). |
| Sertoli cell tumor | Polygonal cells. Intercellular junctions. Indented nuclei. Junctional complexes. Interdigitating lateral cell membranes. Abundant SER. Lipid droplets. Mitochondria with tubular cristae. Secondary lysosomes. | Basal lamina. Collagenous matrix. |
| Squamous cell carcinoma | Desmosomes. Keratohyalin granules. Tonofibrils. | Basal lamina. |
(+/−) = Feature not present in all tumors or cells.
(−/+) = Feature rarely observed.
There are excellent atlases on ultrastructural pathology (Dickersin, 2000; Dvorak and Monahan-Earley, 1992; Erlandson, 1994; Eyden, 1996; Ghadially, 1998).
SPECIAL HISTOCHEMICAL STAINS
The term “special stains” groups most of the histochemical stains used in histopathology and arbitrarily separates them from the standard hematoxylin-eosin. Special stains have been and still are important techniques in the characterization of numerous lesions and tissues. Before the advent of immunohistochemistry and molecular techniques, special stains were the main tool to characterize lesions beyond an HE. The majority of laboratories are capable of doing special stains with the same equipment available for routine histopathology.
Advantages of Special Stains
-
•
They are easy and usually quick to produce.
-
•
Most have standard and very reproducible protocols.
-
•
Currently, numerous special stains can be purchased as kits and used in automatic stainers.
-
•
They have been extensively validated and numerous variations to original protocols have been produced to improve their quality.
-
•
They are fairly inexpensive.
-
•
They detect substances to which there are no commercial antibodies to be detected by IHC.
Disadvantages of Special Stains
-
•
Some stains are somewhat unpredictable.
-
•
Due to the nature of the histochemical reaction, large chemical groups rather than a small number of amino acids encompassing an epitope of an antigen (immunohistochemistry) or short sequences of nucleic acids (molecular techniques) are detected; in other words, they are less specific than IHC or molecular techniques.
Staining Principles
Numerous factors contribute to dye-tissue affinities including: 1) Solvent-solvent interactions (e.g., hydrophobic bonding between enzymes and their substrates); 2) Stain-stain interactions (e.g., metachromatic staining with basic dyes, silver impregnation); 3) Reagent-tissue interactions of Coulombic attractions (e.g., acid and basic dyes); Van der Waal's forces (e.g., detection of large molecules such as elastic fibers); hydrogen bonding (e.g., staining of polysaccharides by carminic acid from nonaqueous solutions); or covalent bonding (e.g., nuclear detection by the Feulgen reaction, PAS stain) (Bancroft and Gamble, 2007).
Special stains are used mainly to demonstrate specific chemical groups characteristic of a substance (e.g., glycogen, myelin) (Fig. 17-10 and Table 17-5 ) and to demonstrate the general morphology of microorganisms (e.g., fungi, bacteria) (Fig. 17-11 and Table 17-6 ). There are excellent books regarding special stains and other aspects of histotechnology (Bancroft and Gamble, 2007; Carson, 1997; Prophet, 1992).
FIGURE 17-10.

A–D, Detection of granules and pigments by special histochemical stains. A, Giemsa stain. Mast cell tumor. Skin. Dog. Cells are filled with numerous dense metachromatic granules (purple) characteristic of mast cells. B, Hall's stain. Liver. Dog. The green pigment present within bile canaliculi (thin arrows) and Kupffer cells (arrowheads) is bile. Hemosiderin (thick arrow) is not stained but apparent due to its refractile nature. Hepatocytes (h) are noted. C, Rubeanic acid stain. Liver. Dog. This stain reveals copper granules (arrowheads) within hepatocytes (h). Kupffer cells with hemosiderin granules (arrows) are shown. D, Perl's stain for iron. Liver. Dog. Iron pigment appears blue within hepatocytes. The portal area (p) is shown.
TABLE 17-5.
Special Histochemical Stains for Intracellular and Extracellular Substances
| Stain | Substance or Structure | Color |
|---|---|---|
| Acid phosphatase | Prostate | Black |
| Alcian Blue | Sialomucins, hyaluronic acid, sulfated mucosubstances | Blue |
| Alizarin red S | Calcium | Orange-red |
| Best's Carmine | Glycogen | Deep red |
| Bielschowsky's silver stain | Axons | Black |
| Congo red | Amyloid | Orange-red* |
| Cresyl Violet | Nissl substance | Violet |
| Dunn-Thompson | Hemoglobin | Emerald green |
| Feulgen | DNA | Red-purple |
| Fontana-Masson | Melanin | Black |
| Gordon and Sweets Reticulin Fiber | Reticulin fibers | Black |
| Grimelius | Argyrophilic granules | Black |
| Hall's | Bile/biliverdin | Green |
| Jone's Methenamine | Basement membranes | Black |
| Kinyoun's (modified Ziehl-Neelsen) | Lipofuscin | Red |
| Luxol Fast Blue | Myelin | Blue |
| Mallory's PTAH | Muscle, fibrin, glial processes | Dark blue |
| Masson's Trichrome | Muscle, collagen |
|
| Mayer's Mucicarmine | Mucin, hyaluronic acid, chondroitin sulfate | Rose to red |
| Methyl Green Pyronin | Nucleic acids |
|
| Oil Red O | Fat | Orange–bright red |
| Periodic acid-Schiff (PAS) | Glycogen, mucin | Red |
| Prussian Blue | Iron | Blue |
| Rubeanic Acid | Copper | Green |
| Schmorl's Reaction | Melanin, lipofuscin | Dark blue |
| Sudan Black B | Fat | Black |
| Tolouidine Blue | Mast cells | Purple |
| Verhoeff | Elastic fibers | Black |
| Von Kossa | Calcium | Black |
Apple green birefringency with polarized light
FIGURE 17-11.
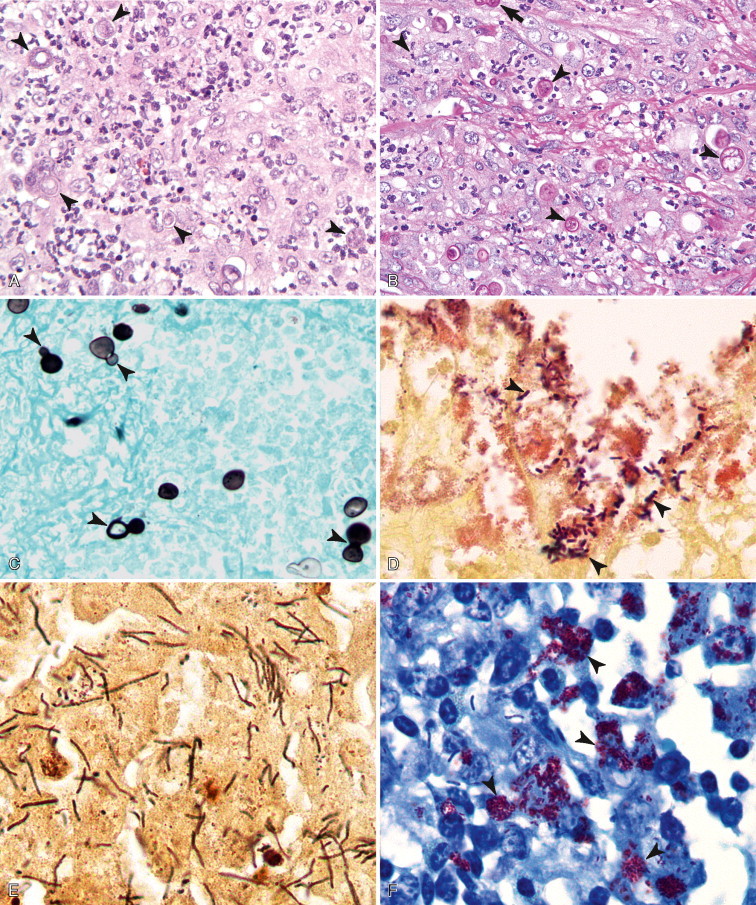
A–F, Detection of microorganisms by special histochemical stains. Pyogranulomatous dermatitis. Skin. Dog. Blastomycosis. Same case A-C. A, With routine hematoxylin-eosin stain, cellular detail of the inflammatory reaction is excellent, but detection of yeasts (arrowheads) is difficult. B, PAS stain improves the detection of yeasts due to staining cell walls magenta (arrowheads). Note the broad-based budding formation (arrow). C, Grocott methenamine silver stain demonstrates excellent yeast morphology but detail of the inflammatory process is poor. Numerous broad-based budding yeasts are observed (arrowheads). D, Canine intestine with Gram stain depicts many gram-positive bacterial rods (arrowheads). E, Warthin-Starry stain. Liver. Horse.Clostridium piliformis. This staining method is excellent to detect microorganisms due to the high contrast with the background. F, Ziehl-Neelsen stain. Skin. Dog, mycobacterial dermatitis. Acid-fast organisms (arrowheads) are strongly stained bright red. Note the presence of unstained bacilli (arrows in white).
TABLE 17-6.
Special Histochemical Stains for Microorganisms
| Stain | Microorganism |
|---|---|
| Giemsa | Metachromatic granules. Good stain for protozoa and some bacteria. |
| Gram | Standard staining for bacteria. |
| Grocott methenamine silver | Fungi, Pneumocystis |
| Jimenez | Chlamydiae |
| Macchiavello | Chlamydiae |
| Mucicarmine | Capsule of Cryptococcus |
| Periodic acid-Schiff | Fungi |
| Steiner and Steiner silver | Numerous bacteria including Helicobacter (good contrast between the black staining of the bacteria and the background) |
| Toluidine blue | Metachromatic granules. |
| Wade-Fite | Acid-fast bacteria including mycobacteria, Nocardia |
| Warthin-Starry | Similar uses to Steiner stain. |
| Ziehl-Neelsen | Acid fast bacteria. Nocardia is difficult to detect. |
FLOW CYTOMETRY
While cytomorphology alone is often sufficient for cell identification, there are many instances where more objective or detailed identification is needed to provide diagnostic or prognostic information. Flow cytometry is a valuable and readily available tool that allows the analysis of individual cells as they pass in front of a laser as a single cell suspension. The light absorbance and scatter properties of the cells can provide information about cell size and internal complexity/granularity respectively, and the use of specific antibodies allows the quantification of both intracellular and surface-expressed components. The most widely used clinical application involves incubating cells with fluorescently labeled antibodies directed at surface antigens to allow the determination of both the frequency of cells that express the given molecule as well as the relative expression levels on individual cells. Because antibodies can be labeled with a variety of fluorochromes that have different excitation and emission wavelengths, the expression of several surface molecules can be detected simultaneously. The major advantage of flow cytometry is that it allows the rapid and objective identification of large numbers of cells. Clinically, flow cytometry is generally used for the analysis of hematopoietic cells, in order to characterize lymphoma and leukemia, and to quantify cells in cases of suspected immunologic disorders.
Methodology
Sample Collection
To analyze a sample with flow cytometry the cells must be in suspension and free of any clumping or debris. Anticoagulated whole blood or cavity effusions can generally be submitted directly to a flow cytometry facility for analysis. Aspirates from solid tissue can be resuspended in media with serum. In university or laboratory settings, tissue culture media such as RPMI or DMEM, buffered with HEPES and supplemented with 5% to 10% fetal bovine serum is ideal. However in the clinic setting, 0.9% saline can be used, and 10% serum from the patient can be added. Serum from another patient of the same species may also be used. Because a minimum of 10,000 cells are needed for each antibody combination, several tissue aspirates are needed for a complete analysis. If samples are to be shipped, they must be shipped overnight with a cold pack.
Laboratory Preparation of Sample
The preparation of cells for flow cytometry varies widely between laboratories (Lana et al., 2006a; Ruslander et al., 1997; Vernau and Moore, 1999; Villiers et al., 2006; Wilkerson et al., 2005), and at present there is no consensus about the best method. Most commonly, the first step in cell preparation is to remove the red blood cells by lysis in a hypotonic solution. An alternative method is to prepare the cells by differential density centrifugation through a solution such as Histopaque. Neutrophils, red blood cells, and platelets will pass through the solution, whereas mononuclear cells will remain on top of the Histopaque layer. While this technique concentrates the mononuclear cells considerably, it is possible that cells of interest may pass through the density gradient and be lost from the analysis.
For analysis of antigens expressed on the cells' surface, such as CD4 and CD8, cells are incubated with antibodies to cell surface markers. Primary antibodies are either unlabeled or have been directly conjugated to a fluorescent molecule called a fluorochrome. The directly conjugated antibodies can be visualized immediately after staining and they greatly facilitate the use of multiple markers simultaneously. Cells stained with unlabeled antibodies must be subjected to a second staining reaction using a labeled antibody that will recognize the immunoglobulin portion of the primary antibody. In general, only a single unconjugated antibody can be used in a staining reaction, preventing the simultaneous quantification of multiple markers on individual cells. It is important to include control reactions for each sample. Controls consist of the same cells left unstained and cells stained with an antibody of the same isotype that should not specifically bind to any antigens on the cells of interest. The unstained cells allow the operator to correct for autofluorescence, and the fluorescent intensity of the irrelevant antibody reaction can be used to determine the level of background staining.
Laboratories use a variety of different antibodies in different combinations for immunophenotyping. Table 17-7 lists a suggested panel for dogs and cats, although most laboratories (including our own) use a more extensive array of antibodies. The largest supplier of directly conjugated antibodies for use in routine veterinary flow cytometry is Abd Serotec (www.ab-direct.com), and the clones listed in Table 17-7 are all available through this company. Other suppliers, such as R&D Systems (www.rndsystems.com), B-D Biosciences (www.bdbiosciences.com), and Southern Biotech (www.southernbiotech.com, cats only) have fewer antibodies.
TABLE 17-7.
Antibody Panels for Characterization of Canine and Feline Leukocytes by Flow Cytometry
| Cell Type | Antigen | Clone(s) | Species Antibody Produced Against |
|---|---|---|---|
| Dog Panel | |||
| Dendritic cells/monocytes | CD1c | CA13.9H11 | Dog |
| T cells | CD3 | CA17.2A12 | Dog |
| T cell subset/neutrophils | CD4 | YKIX302.9/CA13.1E4 | Dog |
| T cells | CD5 | YKIX322.3 | Dog |
| T cell subset | CD8α | YCATE55.9/CA9.JD3 | Dog |
| Macrophages, some T-cells | CD11d | CA16.3D3 | Dog |
| Monocytes/Neutrophils* | CD14 | TUK4/UCHM1 | Human |
| B cells | CD21 | CA2.1D6/LB21 | Dog/human |
| Precursors | CD34 | 1H6 | Dog |
| B cells | CD79a | HM57 | Human |
| All leukocytes | CD45 | YKIX716.13/CA12.10C12 | Dog |
| Cat Panel | |||
| T cells | CD3ɛ | CD3-12 | Human |
| T cell subset | CD4 | vpg39 | Cat |
| T cells | CD5 | FE1.1B11 | Cat |
| T cell subset | CD8α/β | vpg9 | Cat |
| Monocytes | CD14 | TUK4* | Cat |
| B cells | CD21 | CA2.1D6/LB21 | Dog/human |
| B cells | CD79a | HM57 | Human |
TUK4 does not appear to stain neutrophils, but UCHM1 does.
The cells are washed after the final staining reaction, and then can either be fixed in paraformaldehyde for later analysis or analyzed immediately without fixation. If cells are analyzed immediately, they can be additionally stained with propidium iodide, which will label cells with a disrupted cell membrane and can therefore be used to exclude dead cells from the analysis. This technique is extremely useful because dead cells tend to nonspecifically bind antibodies.
In addition to surface molecules, several useful antigens are located within the cell cytoplasm. For example, most human T-cell acute lymphoblastic leukemia (ALL) lack surface expression of CD3, but have cytoplasmic expression of CD3 (Szczepanski et al., 2006). The CD3 reagent commonly used for IHC in dogs can also be used for flow cytometry (Wilkerson et al., 2005) and could be included in a panel used to phenotype acute leukemia. The monocyte/granulocyte lineage markers myeloperoxidase (MPO) and MAC387 are also cytoplasmic and can be useful for analyzing acute myeloid origin leukemia (Villiers et al., 2006). In order to expose these cytoplasmic molecules, cell membranes must be permeabilized using commercially available permeabilization reagents before staining.
Data Analysis
The most important aspect of flow cytometry is data analysis, which begins with the examination of the light scatter properties of the cells. As cells pass in front of the laser, they scatter the light, and detectors record the amount of forward-scattered and side-scattered light. The total amount of forward-scattered light detected depends on cell surface area or size, whereas the amount of side-scattered light indicates cellular complexity or granularity. Figure 17-12 demonstrates a typical scatter plot from canine peripheral blood, where each dot represents an individual cell placed relative to the amount of forward and side scatter recorded as it passes in front of the laser. Typical scatter properties allow the identification of lymphocyte, monocyte, and neutrophil populations.
FIGURE 17-12.
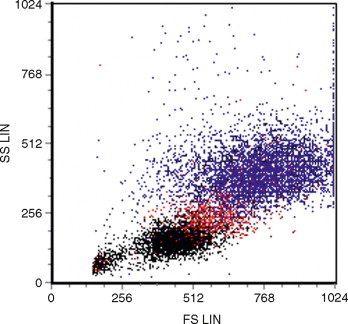
Light scatter properties of canine peripheral blood by flow cytometry. Forward (x axis) and side scatter (y axis) of peripheral blood showing individual neutrophils (blue), monocytes (red) and lymphocytes (black).
Although there is no consensus on analysis methods in veterinary medicine, in general the first step of an analysis is to “gate” different populations of cells based on their scatter properties. As shown in Figure 17-12, lymphocytes have lower forward and side scatter, whereas neutrophils have higher forward and side scatter, with monocytes falling in between.
The next step is to determine the percentage of cells within each population that expresses the markers of interest by looking at the fluorescence profile of each population. The fluorochromes used to label antibodies are excited by the laser and emit a particular peak emission wavelength, which can be detected by the flow cytometer. Different fluorochromes have distinct peak emission wavelengths so antibodies conjugated to two different fluorochromes can be used simultaneously in one staining reaction. The amount of fluorescent signal detected is proportional to the number of fluorochrome molecules on the cell. The data can then be displayed as a single parameter in the form of a histogram, or two parameters can be displayed simultaneously as a dot plot (Fig. 17-13 ). Two-parameter dot plots allow individual events/cells to be displayed so that the relative fluorescence for two individual markers can be displayed.
FIGURE 17-13.

A–C, Gating cell populations by flow cytometry. A, Forward and side scatter histogram used to gate different leukocyte populations. B, Expression of CD5 (x axis, FITC fluorochrome) and CD21 (y axis, PE fluorochrome) on the lymphocyte population showing that 60% of the cells express CD5, and 20% of the cells express CD21. The quadrants were drawn so that in the isotype control, 95% of the cells were in the lower left quadrant (not shown). C, Expression of CD5 and CD21 on the neutrophil population, demonstrating that these cells do not express either marker.
Electronic gating of different populations allows the user to determine the percentage of cells in each population that are positive for a given molecule (see Fig. 17-13). The percentage of positive cells is usually determined by first analyzing the isotype control and setting gates based on this control. The percentage of positive cells is determined by the number of cells that fall above the gate set by the negative control (see Fig. 17-13). While the isotype control is used as a guideline, it is generally accepted that there is some flexibility in the placement of gates to include logical populations of cells.
Reporting Flow Cytometry Data
All laboratories report flow cytometry data differently. In peripheral blood analysis, the most useful information is the absolute number of a lymphocyte subset in peripheral blood per microliter. When only percentages are reported, it may be difficult to distinguish loss of one population from expansion of another population. Although normal values have been published (Byrne et al., 2000), preparation methods differ so widely between laboratories that each lab should generate their own normal values.
For other samples, percentages of lymphocyte subsets are reported usually after gating on the relevant population by size. For example, in lymph node aspirates from dogs with lymphoma, the neoplastic lymphocytes are usually large. Therefore, the percentage of each lymphocyte subset will be determined after gating on the large cells. In addition to the percentage of cells expressing different markers, cells with an abnormal phenotype, such as loss of an antigen or aberrant expression of an antigen, should also be described or quantified.
Uses for Flow Cytometry
Reactive vs. Neoplastic Lymphocytosis
Routine immunophenotyping of circulating lymphocytes is becoming more prevalent in veterinary medicine as more cross-reactive and species-specific antibodies become available. A number of studies have described the immunophenotypic markers of canine lymphoma and leukemia (Appelbaum et al., 1984; Day, 1995; Caniatti et al., 1996; Ruslander et al., 1997; Grindem et al., 1998; McDonough and Moore, 2000; Modiano et al., 1998; Ponce et al., 2003). Distinguishing a reactive from a neoplastic process is often the first task faced by the clinician. Finding of a phenotypically homogeneous population of lymphocytes suggests a neoplastic, rather than a reactive, process. For example, canine chronic lymphocytic leukemia (CLL) most commonly involves an expansion of CD8+ T cells, and less frequently B cells (Vernau and Moore, 1999; Workman and Vernau, 2003). CD8 T cells usually comprise 25% to 35% of canine peripheral blood, and B cells usually comprise 5% to 20% (Byrne et al., 2000; Greeley et al., 2001). Leukemia would be the primary differential diagnosis in a dog with persistent lymphocytosis when a majority of peripheral blood lymphocytes are CD8+ T or B cells, although no criteria have been established in veterinary medicine for making this distinction. A rare exception to such an interpretation in dogs would be lymphocytosis in Ehrlichia canis infection, which can be associated with the selective expansion of CD8+ T cells (Heeb et al., 2003; McDonough and Moore, 2000; Weiser et al., 1991). To our knowledge, there are no such examples in cats. Studies of the predictive value of an expanded lymphocyte population and the absolute lymphocyte counts that can be used to define leukemia would be important and clinically useful, but at present no such reports are available in the veterinary literature.
Aberrant expression of surface molecules can provide a definitive diagnosis of leukemia or lymphoma (Rezuke et al., 1997) as reactive lymphocytes will generally retain expression of their normal constellation of antigens. Human T-cell leukemias are characterized by their tendency to lose expression of normal T-cell antigens, or to express aberrant combinations of antigens (Jennings and Foon, 1997). For example in one study of 87 human malignant T-cell disorders, complete loss of any T-cell antigen (CD2, CD5, CD7) or the panleukocyte antigen CD45 was diagnostic for malignancy (Gorczyca et al., 2002). In order to detect aberrant antigen expression it is useful to examine a large panel of antigens using multicolor fluorescence protocols. In our experience, loss of the panleukocyte marker CD45 is the most common form of aberrant antigen expression in T-cell leukemia while smaller numbers of cases have been documented that have lost expression of CD4 and CD8 (Vernau and Moore, 1999). Despite the utility in helping to diagnose T-cell leukemia, decreased expression of CD45 does not appear to be associated with prognosis (Williams et al., 2008).
Prognostic Significance of Immunophenotype
Lymphoma.
Studies of canine multicentric lymphoma have consistently demonstrated that immunophenotype (B versus T) provides prognostically useful information in conjunction with clinical stage (Ruslander et al., 1997; Teske et al., 1994). T-cell lymphomas typically have a worse prognosis than B-cell lymphomas. It is important to note, however, that there are histologic subtypes of T cell lymphoma (Ponce et al., 2004) that have a good prognosis, and histologic subtypes of B-cell lymphoma that have a poor prognosis (Raskin and Fox, 2003). In human medicine, surface markers have been identified to help distinguish between some histologic subtypes of lymphoma via flow cytometry but, because we have not yet reached that point in veterinary medicine, immunophenotype should ideally be combined with histologic subtyping.
Peripheral Lymphocytosis.
Willliams et al. (2008) have examined the immunophenotype of canine lymphoproliferative disorders involving peripheral lymphocytosis (without distinguishing lymphoma from leukemia) and its prognostic significance. Analyzing peripheral blood samples, immunophenotype, plus one additional clinical or cellular feature allowed dogs with circulating neoplastic lymphocytes to be placed in good and poor prognostic categories. In B-cell disorders, the size of the circulating lymphocytes was prognostic (larger B cells were associated with shorter survival), and in CD8 T-cell disorders, the lymphocyte count was prognostic (cases with >30,000 lymphocytes/μl had shorter survival times) (Williams et al., 2008).
Classification of Acute Leukemia
Acute leukemia, diagnosed by cellular morphology, has long been known to have a poor prognosis. The use of anti–canine CD34, a marker generally found on precursor lymphocytes, is useful in objectively identifying cases of acute leukemia. CD34 is most likely expressed on both ALL and AML (Villiers et al., 2006; Workman and Vernau, 2003), but there are presently no published studies examining the distribution of CD34 on different leukemic subtypes. In addition, because the traditional classification scheme for acute leukemia has relied on cellular morphology alone, the correlation between blast morphology and CD34 expression has not been established. Despite this fact, recent work has documented a significantly shortened survival time in dogs with increased numbers of circulating CD34+ cells (Williams et al., 2008).
Often when blasts are identified in the peripheral blood or bone marrow it is difficult to assign a cell lineage, and flow cytometry can be extremely useful in these cases although again, few reports have been published correlating morphologic characteristics with immunophenotype. Cytoplasmic staining of acute leukemias may be more useful than surface staining, because human T-cell ALL express CD3 only in their cytoplasm (Szczepanski et al., 2006), and the B cell marker CD79a is located in the cytoplasm. Leukemias staining with either of these markers can generally be classified as lymphoid. Cells staining with surface markers such as CD14 or CD11b are classified as myeloid. Intracellular staining with an antibody to myeloperoxidase or using the antibody MAC387 may provide further confirmation of the myeloid origin of these cells. There is an excellent study correlating AML subclassification (AML-M1, M4 and M5) with immunophenotype using a variety of markers (Villiers et al., 2006), but similar studies are not available for ALL.
Diagnosis of Mediastinal Masses
A particularly useful application of flow cytometry involves distinguishing lymphoma from thymoma in cases of lymphocyte-rich mediastinal masses (Lana et al., 2006a). Thymic lymphocytes coexpress the markers CD4 and CD8 whereas all other T cells express either CD4 or CD8. A proportion of the lymphocytes associated with the neoplastic epithelial tissue in a thymoma will coexpress CD4 and CD8 so that this phenotype, together with the small size of the cells, is diagnostic for thymoma (Fig. 17-14 ). Lymphomas involving the mediastinum are generally T cell, but express only one or neither of the subset markers CD4 or CD8. Since making the distinction between lymphoma and thymoma determines whether a patient will have chemotherapy or surgery, this is a particularly important use for this assay.
FIGURE 17-14.
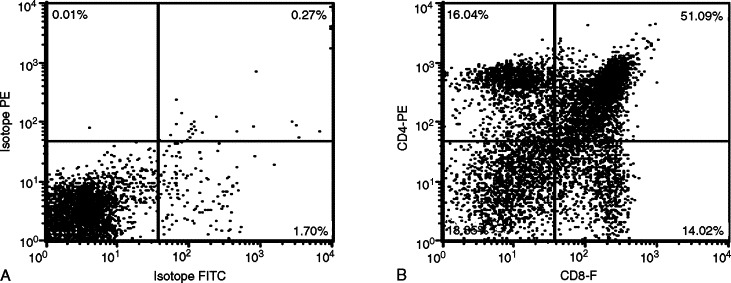
A&B, Detection of thymoma by flow cytometry. Both panels show fluorescence of the small lymphocyte population, gated based on forward and side scatter (not shown). A, Isotype control showing placement of quadrants. B, CD4 and CD8 fluorescence, showing that 51% of the cells coexpress CD4 and CD8 (upper right quadrant). Note the presence of cells that express only CD4 or CD8. These cells represent the stage of thymic differentiation following the double positive (CD4+CD8+) stage, when one or the other of the two markers have been downregulated.
IMAGE ANALYSIS
Complementary to flow cytometry is image analysis. Image analysis is the measuring and counting of microscopic images in order to obtain information of diagnostic importance. Although image analysis has existed for some time, the advent of computer-assisted analysis has led to a more rapid, sensitive, and quantitative method of evaluation (Meijer et al., 1997). Typically, a television camera receives images from a light microscope. These signals are converted into digits by an interfaced computer, creating digitized cell images that can be displayed on a monitor.
Image analysis can be divided into three different areas: for example, cellular morphometry, counting cellular components, and cytometry. Morphometry is the quantitative description of geometric features of cellular structures of any dimension. The counting of cellular components or object counting is usually applied to the assessment of cell kinetics by evaluating proliferative markers in tumors. This allows for the quantitation of the proliferative fraction or number of mitoses in a cell population, which has been shown to be useful for evaluation of the biologic behavior of tumors. Proliferation markers include bromodeoxyuridine (BrdU), proliferating cell nuclear antigen (PCNA), Ki67, and AgNOR method.
DNA cytometry is the measurement of DNA content in tumor cells and is used as a marker of malignancy in oncology. Image cytometry is used to measure the amount of ICC or IHC stained proteins in cells.
Laser scanning cytometry is a newer technology that scans cells on a slide, which are evaluated by flow cytometry type analysis (Darzynkiewicz et al., 1999). Laser cytometry permits the observer to view cells and correlate flow cytometry data directly with cells measured and classify those cells by standard morphologic criteria.
PCR FOR ANTIGEN RECEPTOR REARRANGEMENTS (PARR)
In human medicine, determination of clonality by detecting clonally rearranged antigen receptor genes is often the test of choice if routine cytology, histology and immunophenotyping are not able to provide a definitive diagnosis of lymphoid malignancy (Swerdlow, 2003). Clonality testing is based on the observation that lymphocytes mount a diverse response to antigens, whether they are derived from the environment (such as allergens), from pathogens, or from self (autoantigens). By contrast, malignant lymphocytes are homogeneous, arising from a single transformed cell. Normal lymphocyte differentiation depends on the process of antigen receptor rearrangement; therefore, all mature lymphocytes have antigen receptor genes that have undergone V-J or V-D-J rearrangement. Immunoglobulin genes are rearranged in B lymphocytes, and T-cell receptor genes α/β and/or γ/δ in T lymphocytes (Jung and Alt, 2004). During this process (Fig. 17-15 ) nucleotides are trimmed or added between genes as they recombine, resulting in significant length and sequence heterogeneity, particularly within the complementarity determining region 3 (CDR3). Further diversity within B-cell immunoglobulin genes is created by somatic hypermutation during antigen-driven B cell activation. The end result of this differentiation is a diverse population of lymphocytes with virtually limitless antigen specificity and a large variety of CDR3 sequences and lengths. Lymphocytes derived from the same clone will have CDR3 regions of the same length and sequence. The term PARR is used to distinguish it from other types of PCR assays and from other methods of determining clonality. Additional means of determining clonality in human medicine would include the amplification of BCL1-IGH and BCL2-IGH genes, because the chromosomal translocation that brings the BCL and IGH loci together is relatively common in human B cell lymphomas (van Dongen et al., 2003).
FIGURE 17-15.
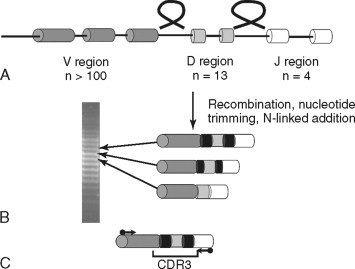
A–C, Immunoglobulin gene recombination. A, One V region gene (of more than 100 in the human genome) recombines with a randomly selected D region gene and a J region gene, looping out the intervening DNA. B, During this process, nucleotides are added (black bars) between genes, which generate length and sequence diversity in the complementarity determining region 3 (CDR3). Differentially sized DNA can be separated on a polyacrylamide gel and will appear as a ladder representing different populations of B cells (shown at left). C, Primers with homology to the conserved framework regions of V and J regions (arrows) will amplify PCR products of different sizes when the DNA is derived from different lymphocytes. Primers are located outside the hypervariable CDR3.
Methodology
Sample Collection
The principle behind this assay has been described more detail (Avery, 2004; Workman and Vernau, 2003). The steps to carry out a clonality assay begin with DNA extraction from tissue. Virtually any type of tissue can be used as a source of DNA, including blood, cavity fluids, aspirates, CSF, stained or unstained cytology preps, and tissue in paraffin blocks. The latter is the least desirable because formalin fixation degrades DNA and can result in both more false negatives and false positives.
DNA Amplification
Primers that hybridized to the conserved portions of V and J region genes of immunoglobulin and T-cell receptor genes are then used to amplify DNA in a PCR reaction. Although T-cell receptors can either be α/β or γ/δ, primers recognizing TCRγ are used. Since there are fewer TCRγ genes, fewer primers are needed to detect the majority of malignancies, and TCRγ is rearranged before TCRβ, so will be clonal even if the malignancy ultimately expresses TCRα/β. In human medicine, primers recognizing TCRγ, TCRβ, TCRδ, as well V-J, D-J and BCL-IgH rearrangements, are used to detect clonality (van Dongen et al., 2003).
Data Analysis
Analysis of these PCR products can be carried out using a variety of methods designed to evaluate the size of the products, and in some cases the sequence heterogeneity. Polyacrylamide gel electrophoresis separates the PCR products by size. The presence of a dominant, single-sized product indicates the presence of a group of lymphocytes that share an identically sized CDR3 region (e.g., clonally expanded). The presence of a variably sized products suggests a polyclonal population of lymphocytes. For gel electrophoresis to be used, the gels must have the ability to resolve products that are three base pairs different in size (thus agarose gels cannot be used). Alternative methods include heteroduplex analysis (Moore et al., 2005), which resolves products by both size and sequence heterogeneity (and thus may provide more resolving power), capillary gel electrophoresis, which separates products by size but is less time consuming, and melt curve analysis (Xu et al., 2002), which uses Syber Green technology and also relies on both size and sequence heterogeneity.
Data Interpretation
Figure 17-16 shows PCR products separated by size using polyacrylamide gel electrophoresis (Burnett et al, 2003). Each case has a positive control (lane 1) to confirm the presence of DNA. The positive control DNA is amplified with any primers that will give a single product, thereby confirming the relative quantity and quality of the extracted DNA. Two sets of primers are used to amplify immunoglobulin genes in separate reactions (lanes 2 and 3), and two sets of primers are used to amplify TCRγ (lane 4) in the same reaction (there are technical reasons for this arrangement).
FIGURE 17-16.

A–C, PARR assay analyzed by polyacrylamide gel electrophoresis. Each panel represents four reactions from a different dog. Lane 1: Positive control indicating the presence of DNA. Primers are specific for Cmu, but could be for any gene. Lanes 2 and 3: Two different sets of primers for immunoglobulin genes. Lane 4: Primers for T-cell receptor genes. A, Dog with B-cell lymphoma with a single band in lane 2 of greater strength than the positive control. Note the other lanes show no products of a smear. B, Dog with T-cell lymphoma with a single band in lane 4. C, Dog with T-cell lymphoma and several discrete clonal PCR products.
Amplification can result in no product (for example lane 3 in panel A), a smear (lane 4 in panel A), a single-sized PCR product (lane 2 panel A), or multiple discrete products (lane 4 panel C). A smear or no product is interpreted as a negative result (no evidence of clonality), while one or more prominent, discrete products is considered a positive result (indicating the presence of a clonally expanded population[s]). In Figure 17-16, the dog in panel A had a clonal B cell population and the dogs in panels B and C had clonal T cell populations.
The most common positive result is one or two PCR products. Two PCR products is most likely the result of rearrangements of both chromosomes in the tumor. However it is not unusual to see multiple rearrangements (Kisseberth et al., 2007). The reason for more than two discrete PCR products is not clear. It may also be possible that a derivative of the original neoplastic clone underwent additional recombination events. These questions may be resolved by sequencing individual PCR products, but this has not yet been done.
It is important that as laboratories develop this assay, they provide sensitivity and specificity numbers for their assay—published results from one laboratory do not translate to another because of the wide variation in the way the assay is carried out. In the authors' laboratory, the sensitivity of the assay on canine cases of histologically or cytologically confirmed lymphomas or leukemias is 80%. The reasons for false negative results may be: 1) it is not possible to generate primers that detect all V or J region genes, and the malignancy uses a gene to which the primers do not hybridize; 2) the malignancy has lost the chromosome carrying the antigen receptor genes; 3) somatic hypermutation in cases of B-cell lymphoma or leukemia has altered the sequence to which the primers hybridize; 4) the malignancy is NK in origin and therefore does not contain a rearranged antigen receptor gene.
The presence of a clonal population is 94% specific for malignancy. The 6% of cases in which there is a clonal population of B or T cells, but no lymphoproliferative disease, have included single cases of Lyme disease, Rocky Mountain Spotted Fever, Bartonella infection, and several cases of Ehrlichia canis infection. There are likely additional reasons for detecting a clonal lymphocyte population in non-neoplastic conditions, which need to be determined.
Applications
Diagnosis of Lymphoma and Leukemia
Clonality testing is now available for dogs and cats on a routine basis. The first large-scale study of this technique was reported by Burnett et al. (2003) following earlier studies that demonstrated the presence of clonally rearranged T-cell receptor genes in canine malignancy (Dreitz et al., 1999; Fivenson et al., 1994; Vernau and Moore, 1999).
The most common application of this technique is in cases where cytology or histology is ambiguous. Because the assay can detect between 1:100 and 1:1000 neoplastic cells within a population of normal cells (Burnett et al., 2003), it can be useful in early cases of lymphoma or leukemia. Stained or unstained cytology slides or cells freshly aspirated into EDTA tubes are the best samples for this purpose. Interpretation of the results will vary depending on the sensitivity and specificity of the assay in each laboratory offering the test.
Staging Lymphoma and Monitoring Disease
Since the PARR assay is more sensitive than visual examination of cells, it can detect neoplastic cells in the peripheral blood when they are not detected by cytology (Keller et al., 2004). Approximately 75% of stage III lymphomas, which have no visually detectable circulating neoplastic cells, will have a PARR+ result in the peripheral blood (Lana et al., 2006b). The presence of these cells does not appear to correlate with a worse outcome; however, clinical staging remains the most useful predictor of prognosis. It may be possible to use PARR to monitor the progression of disease following chemotherapy and to predict relapse before it is clinically evident, but this application has not yet been explored.
Clonal Relationships between Tumors
The sequence of the CDR3 region that is amplified during the PCR process is unique to each lymphocyte clone. Therefore this sequence can be used to establish the relationship between neoplastic cells that arise in different places in the body, arise at different times, or have a dramatically different morphologic appearance. For example, the relationship between Helicobacter pylori infection and human gastric lymphoma was established by showing that the B-cell lymphoma in a patient with a history of Helicobacter infection had the same CDR3 sequence as clones found in reactive gastritis biopsy specimens obtained several years earlier (Zucca et al., 1998).
The unique CDR3 sequence can be used to determine if two tumors with morphologically different phenotypes are related. Brauninger et al. (1999) described two human patients with two distinct forms of lymphoma occurring simultaneously. Both patients had classic Hodgkin's lymphoma while one also had a follicular lymphoma and the other had a T cell–rich B-cell lymphoma. The CDR3 sequence of the immunoglobulin gene in the Reed-Sternberg cells of the Hodgkin's lymphoma was identical to the CDR3 sequence of the other form of B-cell lymphoma in both patients. This finding indicates that a single clone can evolve into dramatically different morphologic phenotypes. Burnett et al. (2004) carried out a similar study in a dog treated for classical non-Hodgkin's B-cell lymphoma which then developed multiple myeloma. By sequencing the CDR3 regions of both tumors, it was shown that the B cells from the lymphoma and the plasma cells from the multiple myeloma had the same clonal origin
Clonality Assays in Cats
The sequences of TCRγ and immunoglobulin genes from cats have been published and used for clonality assays in cases of visceral B-cell lymphoma and intestinal T-cell lymphoma (Moore et al., 2005; Werner et al., 2005). In a study using these primers in cases of feline intestinal lymphoma, the sensitivity of the T cell primers was 89%, and the sensitivity of the B cell primers was 68%. In our laboratory, when applied to all forms of feline lymphoma and leukemia, these primers currently can detect approximately 60% of all confirmed feline lymphomas and leukemias. Additional primers are being developed in an attempt to increase sensitivity. This assay will be particularly useful for distinguishing inflammatory bowel disease from lymphoma in cats, a distinction that is often difficult to make histologically.
DETECTION OF CHROMOSOMAL ABNORMALITIES
Lymphoma and leukemia are frequently associated with translocations because the process of recombining antigen receptor genes leaves lymphocytes susceptible to mistakes in recombination. Most translocations found in human leukemia and lymphoma involve the immunoglobulin heavy chain gene locus. For example, the t(11;14) translocation juxtaposes the locus encoding cyclin D1 on chromosome 11 to an immunoglobulin-enhancer sequence on chromosome 14. This translocation, which results in the overexpression of cyclin D1, is found in virtually all cases of mantle cell lymphoma (Campo, 2003). Detection of the translocation by PCR or the overexpressed protein by immunohistochemistry can be used to confirm the diagnosis of mantle cell lymphoma in histologically ambiguous cases. Recently, a consortium of European researchers found that the combined use of clonality determination through antigen receptor rearrangements together with detection of this and other translocations by PCR resulted in detection of a clonal population in 95% of cases of confirmed lymphoid malignancies (van Krieken et al., 2003).
Chromosomal aberrations have been detected in dogs by conventional karyotyping (Hahn et al., 1994) and by comparative genome hybridization (Thomas et al., 2003). Aberrations include the gain or loss of portions of chromosomes, as well as balanced translocations between different chromosomes. The assays used to detect these chromosomal changes are not yet amenable to routine diagnostic testing, and may not be sufficiently sensitive for detecting early malignancy or a small number of malignant cells within a population of reactive cells. Despite this fact, studies of this sort will almost certainly lead to the discovery of targeted PCR and immunohistochemistry or flow cytometry–based assays that can be used for detecting malignant lymphocytes in ambiguous cases.
CHOOSING ANCILLARY TESTS FOR SUSPECTED LYMPHOID NEOPLASIA
The primary utility of the PARR assay is to help establish the presence of lymphoma or leukemia in cases where more routine diagnostic tests are ambiguous. Some examples of situations where PARR is useful include: lymph node aspirates where lymphoma is suggested but cannot be concluded (e.g., a predominance of small to intermediate-sized lymphocytes or the mild expansion of intermediate-sized to large lymphocytes), lymphocyte-rich, nonchylous effusions, or increased plasma cell numbers in the marrow. Flow cytometry is the first test of choice for animals with peripheral lymphocytosis. In cases of cytologically or histologically confirmed lymphoma, flow cytometry, immunohistochemistry, or immunocytochemistry are the best methods for immunophenotyping. Table 17-8 lists common diagnostic dilemmas involving lymphoproliferative disorders, and the type of test that is most useful in each. Note that while this list applies to both dogs and cats, both flow cytometry and PARR are less rewarding in cats. There are fewer antibodies for flow cytometry in this species, resulting in less complete characterization of lymphoproliferative diseases, and the PARR assay is currently less sensitive in cats.
TABLE 17-8.
Ancillary Diagnostic Testing in Lymphoma and Leukemia
| Presenting Complaint | Best Site to Test | Best Test(s) to Use |
|---|---|---|
| Lymphoma, confirmed, need phenotype | Lymph node | Flow cytometry, IHC, ICC |
| Lymphoma, suspect, equivocal cytology/histology | Lymph node or involved organ | PARR |
| Lymphocytosis or leukemia | Peripheral blood | Flow cytometry, ICC |
| Rare suspicious cells in the peripheral blood, no lymphocytosis | Peripheral blood | PARR |
| Splenomegaly, equivocal cytology/histology | Spleen | PARR |
| Mass or aspirate with cells of unclear origin | Mass | IHC, ICC, Flow cytometry if cellular; PARR if not |
| Lymphocyte rich effusion | Effusion fluid | Flow cytometry, IHC, ICC |
IHC, Immunohistochemistry; ICC, immunocytochemistry; PARR, PCR for antigen receptor rearrangements.
REFERENCES
- Abendroth CS, Dabbs DJ. Immunocytochemical staining of unstained versus previously stained cytologic preparations. Acta Cytol. 1995;39:379–386. [PubMed] [Google Scholar]
- Appelbaum FR, Sale GE, Storb R. Phenotyping of canine lymphoma with monoclonal antibodies directed at cell surface antigens: Classification, morphology, clinical presentation and response to chemotherapy. Hematol Oncol. 1984;2:151–168. doi: 10.1002/hon.2900020205. [DOI] [PubMed] [Google Scholar]
- Afifiy AM, Al-Khafaji BM, Paulino AFG. Diagnostic use of muscle markers in the cytologic evaluation of serous fluids. Appl Immunohistochem Mol Morphol. 2002;10:178–182. doi: 10.1097/00129039-200206000-00014. [DOI] [PubMed] [Google Scholar]
- Argyle DJ, Nasir L. Telomerase: a potential diagnostic and therapeutic tool in canine oncology. Vet Pathol. 2003;40:1–7. doi: 10.1354/vp.40-1-1. [DOI] [PubMed] [Google Scholar]
- Avery PR, Avery AC. Molecular methods to distinguish reactive and neoplastic lymphocyte expansions and their importance in transitional neoplastic states. Vet Clin Pathol. 2004;33:196–207. doi: 10.1111/j.1939-165x.2004.tb00374.x. [DOI] [PubMed] [Google Scholar]
- Bancroft JD, Gamble M, editors. Theory and practice of histological techniques. ed 6. Churchill Livingstone; Edinburgh: 2007. [Google Scholar]
- Bardou VJ, Arpino G, Elledge RM. Progesterone receptor status significantly improves outcome prediction over estrogen receptor status alone for adjuvant endocrine therapy in two large breast cancer databases. J Clin Oncol. 2003;21:1973–1979. doi: 10.1200/JCO.2003.09.099. [DOI] [PubMed] [Google Scholar]
- Barr NJ, Wu NCY. Cytopathology/FNA. In: Taylor CR, Cote RJ, editors. Immunomicroscopy: a diagnostic tool for the surgical pathologist. ed 3. Saunders; Philadelphia: 2006. pp. 397–416. [Google Scholar]
- Baumgart E, Cohen MS, Neto BS. Identification and prognostic significance of an epithelial-mesenchymal transition expression profile in human bladder tumors. Clin Cancer Res. 2007;13:1685–1694. doi: 10.1158/1078-0432.CCR-06-2330. [DOI] [PubMed] [Google Scholar]
- Boenisch T. Pretreatment for immunohistochemical staining simplified. Appl Immunohistochem Mol Morphol. 2007;15:208–212. doi: 10.1097/01.pai.0000209862.28205.e6. [DOI] [PubMed] [Google Scholar]
- Bräuninger A, Hansmann M-L, Strickler JG. Identification of common germinal-center B-cell precursors in two patients with both Hodgkin's disease and non-Hodgkin's lymphoma. N Engl J Med. 1999;340:1239–1247. doi: 10.1056/NEJM199904223401604. [DOI] [PubMed] [Google Scholar]
- Brown RW. Immunocytochemistry. In: Ramzy I, editor. Clinical cytopathology and aspiration biopsy: fundamental principles and practice. McGraw-Hill; New York: 2001. pp. 535–548. [Google Scholar]
- Burnett RC, Blake MK, Thompson LJ. Evolution of a B-Cell lymphoma to multiple myeloma after chemotherapy. J Vet Intern Med. 2004;18:768–771. doi: 10.1892/0891-6640(2004)18<768:eoablt>2.0.co;2. [DOI] [PubMed] [Google Scholar]
- Burnett RC, Vernau W, Modiano JF. Diagnosis of canine lymphoid neoplasia using clonal rearrangements of antigen receptor genes. Vet Pathol. 2003;40:32–41. doi: 10.1354/vp.40-1-32. [DOI] [PubMed] [Google Scholar]
- Byrne KM, Kim HW, Chew BP. A standardized gating technique for the generation of flow cytometry data for normal canine and normal feline blood lymphocytes. Vet Immunol Immunopath. 2000;73:167–182. doi: 10.1016/s0165-2427(99)00163-4. [DOI] [PubMed] [Google Scholar]
- Cadile CD, Kitchell BE, Newman RG. Telomere length in normal and neoplastic canine tissues. Am J Vet Res. 2007;68:1386–1391. doi: 10.2460/ajvr.68.12.1386. [DOI] [PubMed] [Google Scholar]
- Campo E. Genetic and molecular genetic studies in the diagnosis of B-cell lymphomas I: mantle cell lymphoma, follicular lymphoma, and Burkitt's lymphoma. Hum Pathol. 2003;34:330–335. doi: 10.1053/hupa.2003.97. [DOI] [PubMed] [Google Scholar]
- Caniatti M, Roccabianca P, Scanziani E. Canine lymphoma: immunocytochemical analysis of fine-needle aspiration biopsy. Vet Pathol. 1996;33:204–212. doi: 10.1177/030098589603300210. [DOI] [PubMed] [Google Scholar]
- Capurro M, Wanless IR, Sherman M. Glypican-3: a novel serum and histochemical marker for hepatocellular carcinoma. Gastroenterology. 2003;125:89–97. doi: 10.1016/s0016-5085(03)00689-9. [DOI] [PubMed] [Google Scholar]
- Carson FL. Histotechnology: a self-instructional text. ed 2. American Society for Clinical Pathology; 1997. [Google Scholar]
- Chijiwa K, Uchida K, Tateyama S. Immunohistochemical evaluation of canine peripheral nerve sheath tumors and other soft tissue sarcomas. Vet Pathol. 2004;41:307–318. doi: 10.1354/vp.41-4-307. [DOI] [PubMed] [Google Scholar]
- Dabbs DJ. Immunocytology. In: Dabbs DJ, editor. Diagnostic immunohistochemistry. Churchill Livingstone; New York: 2002. pp. 625–639. [Google Scholar]
- Dabbs DJ. Immunohistology of metastatic carcinoma of unknown primary. In: Dabbs DJ, editor. Diagnostic immunohistochemistry. ed 2. Churchill Livingstone; New York: 2006. [Google Scholar]
- Dardick I, Herrera GA. Diagnostic electron microscopy of neoplasms. Hum Pathol. 1998;29:1335–1338. doi: 10.1016/s0046-8177(98)90000-4. [DOI] [PubMed] [Google Scholar]
- Dardick I, Eyden B, Federman M, editors. Handbook of diagnostic electron microscopy for pathologists-in-training. Igaku-Shoin; New York: 1996. [Google Scholar]
- Darzynkiewica Z, Bedner E, Li X. Laser-scanning cytometry: a new instrumentation with many applications. Exp Cell Res. 1999;249:1–12. doi: 10.1006/excr.1999.4477. [DOI] [PubMed] [Google Scholar]
- Day MJ. Immunophenotypic characterization of cutaneous lymphoid neoplasia in the dog and cat. J Comp Pathol. 1995;112:79–96. doi: 10.1016/s0021-9975(05)80091-x. [DOI] [PubMed] [Google Scholar]
- DeLellis RA, Hoda RS. Immunohistochemistry and molecular biology in cytological diagnosis. In: Koss LG, Melamed MR, editors. Koss' diagnostic cytology and its histopathologic basis. Lippincott Williams & Wilkins; Philadelphia: 2006. pp. 1635–1680. [Google Scholar]
- Dickersin GR, editor. Diagnostic electron microscopy: a text/atlas. ed 2. Springer; New York: 2000. [Google Scholar]
- Dreitz MJ, Ogilvie G, Sim GK. Rearranged T lymphocyte antigen receptor genes as markers of malignant T cells. Vet Immunol Immunopath. 1999;69:113–119. doi: 10.1016/s0165-2427(99)00047-1. [DOI] [PubMed] [Google Scholar]
- Dvorak AM, Monahan-Earley RA, editors. Diagnostic ultrastructural pathology I. CRC Press; Boca Raton: 1992. [Google Scholar]
- Erlandson RA, editor. Diagnostic transmission electron microscopy of tumors. Raven Press; New York: 1994. [Google Scholar]
- Espinosa de los Monteros A, Fernández A, Millán MY. Coordinate expression of cytokeratins 7 and 20 in feline and canine carcinomas. Vet Pathol. 1999;36:179–190. doi: 10.1354/vp.36-3-179. [DOI] [PubMed] [Google Scholar]
- Espinosa de los Monteros A, Millán MY, Ordás J. Immunolocalization of the smooth muscle-specific protein calponin in complex and mixed tumors of the mammary gland of the dog: assessment of the morphogenetic role of the myoepithelium. Vet Pathol. 2002;39:247–256. doi: 10.1354/vp.39-2-247. [DOI] [PubMed] [Google Scholar]
- Eyden B, editor. Organelles in tumor diagnosis: an ultrastructural atlas. Igaku-Shoin; New York: 1996. [Google Scholar]
- Fetsch PA, Abati A. Ancillary techniques in cytopathology. In: Atkinson BF, editor. Atlas of diagnostic cytopathology. ed 2. Saunders; Philadelphia: 2004. pp. 747–775. [Google Scholar]
- Fisher C. The comparative roles of electron microscopy and immunohistochemistry in the diagnosis of soft tissue tumors. Histopathology. 2006;48:32–41. doi: 10.1111/j.1365-2559.2005.02287.x. [DOI] [PubMed] [Google Scholar]
- Fivenson DP, Saed GM, Beck ER. T-cell receptor gene rearrangement in canine mycosis fungoides: further support for a canine model of cutaneous T cell lymphoma. J Invest Derm. 1994;102:227–230. doi: 10.1111/1523-1747.ep12371767. [DOI] [PubMed] [Google Scholar]
- Geninet C, Bernex F, Rakotovao F. Sclerosing peritoneal mesothelioma in a dog: a case report. J Vet Med A. 2003;50:402–405. doi: 10.1046/j.0931-184x.2003.00566.x. [DOI] [PubMed] [Google Scholar]
- Ghadially FN, editor. Diagnostic ultrastructural pathology: a self-evaluation and self-teaching manual. ed 2. Butterworth-Heinemann; Boston: 1998. [Google Scholar]
- Goldstein NS, Hewitt SM, Taylor CR. Recommendations for improved standardization of immunohistochemistry. Appl Immunohistochem Mol Morphol. 2007;15:124–133. doi: 10.1097/PAI.0b013e31804c7283. [DOI] [PubMed] [Google Scholar]
- Gong Y, Sun X, Michael CW. Immunocytochemistry of serous effusion specimens: a comparison of ThinPrep vs. cell block. Diagn Cytopathol. 2003;28:1–5. doi: 10.1002/dc.10219. [DOI] [PubMed] [Google Scholar]
- Gorczyca W, Weisberger J, Liu Z. An approach to diagnosis of T-cell lymphoproliferative disorders by flow cytometry. Cytometry. 2002;50:177–190. doi: 10.1002/cyto.10003. [DOI] [PubMed] [Google Scholar]
- Greeley EH, Ballam JM, Harrison JM. The influence of age and gender on the immune system: a longitudinal study in Labrador Retriever dogs. Vet Immunol Immunopath. 2001;82:57–71. doi: 10.1016/s0165-2427(01)00336-1. [DOI] [PubMed] [Google Scholar]
- Grindem CB, Page RL, Ammerman BE. Immunophenotypic comparison of blood and lymph node from dogs with lymphoma. Vet Clin Pathol. 1998;27:16–20. doi: 10.1111/j.1939-165x.1998.tb01075.x. [DOI] [PubMed] [Google Scholar]
- Hahn KA, Richardson RC, Hahn EA. Diagnostic and prognostic importance of chromosomal aberrations identified in 61 dogs with lymphosarcoma. Vet Pathol. 1994;31:528–540. doi: 10.1177/030098589403100504. [DOI] [PubMed] [Google Scholar]
- Heeb HL, Wilkerson MJ, Chun R. Large granular lymphocytosis, lymphocyte subset inversion, thrombocytopenia, dysproteinemia, and positive Ehrlichia serology in a dog. J Am Anim Hosp Assoc. 2003;39:379–384. doi: 10.5326/0390379. [DOI] [PubMed] [Google Scholar]
- Höinghaus R, Hewicker-Trautwei M, Mischke R. Immunocytochemical differentiation of canine mesenchymal tumors in cytologic imprint preparations. Vet Clin Pathol. 2008;37:104–111. doi: 10.1111/j.1939-165X.2008.00017.x. [DOI] [PubMed] [Google Scholar]
- Ishikawa K, Sakai H, Hosoi M. Evaluation of cell proliferation in canine tumors by the bromodeoxyuridine labeling method, immunostaining of Ki-67 antigen and proliferating cell nuclear antigen. J Toxicol Pathol. 2006;19:123–127. [Google Scholar]
- Jennings CD, Foon KA. Recent advances in flow cytometry: application to the diagnosis of hematologic malignancy. Blood. 1997;90:2863–2892. [PubMed] [Google Scholar]
- Jung D, Alt FW. Unraveling V(D)J recombination; insights into gene regulation. Cell. 2004;116:299–311. doi: 10.1016/s0092-8674(04)00039-x. [DOI] [PubMed] [Google Scholar]
- Keller RL, Avery AC, Burnett RC. Detection of neoplastic lymphocytes in peripheral blood of dogs with lymphoma by polymerase chain reaction for antigen receptor gene rearrangement. Vet Clin Pathol. 2004;33:145–149. doi: 10.1111/j.1939-165x.2004.tb00364.x. [DOI] [PubMed] [Google Scholar]
- Kisseberth WC, Nadella WV, Breen M. A novel canine lymphoma cell line: a translational and comparative model for lymphoma research. Leuk Res. 2007;31:1709–1720. doi: 10.1016/j.leukres.2007.04.003. [DOI] [PubMed] [Google Scholar]
- Kiupel M, Teske E, Bostock D. Prognostic factors for treated canine malignant lymphoma. Vet Pathol. 1999;36:292–300. doi: 10.1354/vp.36-4-292. [DOI] [PubMed] [Google Scholar]
- Kiupel M, Webster JD, Kaneene JB. The use of KIT and tryptase expression patterns as prognostic tools for canine cutaneous mast cell tumors. Vet Pathol. 2004;41:371–377. doi: 10.1354/vp.41-4-371. [DOI] [PubMed] [Google Scholar]
- Kow K, Bailey SM, Williams ES. Telomerase activity in canine osteosarcoma. Vet Comp Oncol. 2006;4:184–187. doi: 10.1111/j.1476-5829.2006.00106.x. [DOI] [PubMed] [Google Scholar]
- Lana S, Plaza S, Hampe K. Diagnosis of mediastinal masses in dogs by flow cytometry. J Vet Intern Med. 2006;20:1161–1165. doi: 10.1892/0891-6640(2006)20[1161:dommid]2.0.co;2. [DOI] [PubMed] [Google Scholar]
- Lana SE, Jackson TL, Burnett RC. Utility of polymerase chain reaction for analysis of antigen receptor rearrangement in staging and predicting prognosis in dogs with lymphoma. J Vet Intern Med. 2006;20:329–334. doi: 10.1892/0891-6640(2006)20[329:uopcrf]2.0.co;2. [DOI] [PubMed] [Google Scholar]
- Leong ASY, Suthipintawong C, Vinyuvat S. Immunostaining of cytologic preparations: a review of technical problems. Appl Immunohistochem Mol Morphol. 1999;7:214–220. [Google Scholar]
- Litlekalsoy J, Vatne V, Hostmark JG. Immunohistochemical markers in urinary bladder carcinomas from paraffin-embedded archival tissue after storage for 5-70 years. BJU Int. 2007;99:1013–1019. doi: 10.1111/j.1464-410X.2006.06699.x. [DOI] [PubMed] [Google Scholar]
- Long S, Argyle DJ, Nixon C. Telomerase reverse transcriptase (TERT) expression and proliferation in canine brain tumors. Neuropathol Appl Neurobiol. 2006;32:662–673. doi: 10.1111/j.1365-2990.2006.00776.x. [DOI] [PubMed] [Google Scholar]
- Mackay B. Electron microscopy in tumor diagnosis. In: Fletcher CDM, editor. Diagnostic histopathology of tumors. ed 3. Churchill Livingstone; New York: 2007. pp. 1831–1859. [Google Scholar]
- Madewell BR. Cellular proliferation in tumors: a review of methods, interpretation, and clinical applications. J Vet Intern Med. 2001;15:334–340. [PubMed] [Google Scholar]
- Maleszewski J, Lu J, Fox-Talbot K. Robust immunohistochemical staining of several classes of proteins in tissues subjected to autolysis. J Histochem Cytochem. 2007;55:597–606. doi: 10.1369/jhc.6A7152.2007. [DOI] [PubMed] [Google Scholar]
- McDonough SP, Moore PF. Clinical, hematologic, and immunophenotypic characterization of canine large granular lymphocytosis. Vet Pathol. 2000;37:637–646. doi: 10.1354/vp.37-6-637. [DOI] [PubMed] [Google Scholar]
- Meijer GA, Belien JAM, van Diest PJ. Image analysis in clinical pathology. J Clin Pathol. 1997;50:365–370. doi: 10.1136/jcp.50.5.365. [DOI] [PMC free article] [PubMed] [Google Scholar]
- Mengel M, Wasielewski R, Wiese B. Inter-laboratory and inter-observer reproducibility of immunohistochemical assessment of the Ki-67 labelling index in a large multi-centre trial. J Pathol. 2002;198:292–299. doi: 10.1002/path.1218. [DOI] [PubMed] [Google Scholar]
- Miller RT, Kubier P. Immunohistochemistry on cytologic specimens and previously stained slides (when no paraffin block is available) J Histotechnol. 2002;25:251–257. [Google Scholar]
- Mimura T, Ito A, Sakuma T. Novel marker D2-40, combined with calretinin, CEA, and TTF-1: an optimal set of immunodiagnostic markers for pleural mesothelioma. Cancer. 2007;109:933–938. doi: 10.1002/cncr.22477. [DOI] [PubMed] [Google Scholar]
- Mittelbronn M, Dietz K, Simon P. Albumin in immunohistochemistry: foe and friend. Appl Immunohistochem Mol Morphol. 2006;14:441–444. doi: 10.1097/01.pai.0000203040.79156.70. [DOI] [PubMed] [Google Scholar]
- Modiano JF, Smith R, Wojcieszyn J. The use of cytochemistry, immunophenotyping, flow cytometry, and in vitro differentiation to determine the ontogeny of a canine monoblastic leukemia. Vet Clin Pathol. 1998;27:40–49. doi: 10.1111/j.1939-165x.1998.tb01014.x. [DOI] [PubMed] [Google Scholar]
- Moore PF, Woo JC, Vernau W. Characterization of feline T cell receptor gamma (TCRG) variable region genes for the molecular diagnosis of feline intestinal T cell lymphoma. Vet Immunol Immunopath. 2005;106:167–178. doi: 10.1016/j.vetimm.2005.02.014. [DOI] [PubMed] [Google Scholar]
- Morini M, Bettini G, Morandi F. Deciduoid peritoneal mesothelioma in a dog. Vet Pathol. 2006;43:198–201. doi: 10.1354/vp.43-2-198. [DOI] [PubMed] [Google Scholar]
- Murakami Y, Tateyawa S, Uchida K. Immunohistochemical analysis of cyclins in canine normal testes and testicular tumors. J Vet Med Sci. 2001;63:909–912. doi: 10.1292/jvms.63.909. [DOI] [PubMed] [Google Scholar]
- Polak JM, Van Noorden S. Introduction to immunocytochemistry. ed 3. Garland Science/BIOS Scientific Publishers; Oxford: 2003. [Google Scholar]
- Ponce F, Magnol JP, Marchal T. High-grade canine T cell lymphoma/leukemia with plasmacytoid morphology: a clinical pathological study of nine cases. J Vet Diagn Invest. 2003;15:330–337. doi: 10.1177/104063870301500405. [DOI] [PubMed] [Google Scholar]
- Ponce F, Magnol JP, Ledieu D. Prognostic significance of morphological subtypes in canine malignant lymphomas during chemotherapy. Vet J. 2004;167:158–166. doi: 10.1016/j.tvjl.2003.10.009. [DOI] [PubMed] [Google Scholar]
- Prophet EB, editor. AFIP laboratory methods in histotechnology. American Registry of Pathology; Washington DC: 1992. [Google Scholar]
- Ramos-Vara JA. Technical aspects of immunohistochemistry. Vet Pathol. 2005;42:405–426. doi: 10.1354/vp.42-4-405. [DOI] [PubMed] [Google Scholar]
- Ramos-Vara JA, Beissenherz ME. Optimization of immunohistochemical methods using two different antigen retrieval methods on formalin-fixed, paraffin-embedded tissues: experience with 63 markers. J Vet Diagn Invest. 2000;12:307–311. doi: 10.1177/104063870001200402. [DOI] [PubMed] [Google Scholar]
- Ramos-Vara JA, Miller MA. Immunohistochemical characterization of canine intestinal epithelial and mesenchymal tumors with a monoclonal antibody to hepatocyte paraffin 1 (Hep Par 1) Histochem J. 2002;34:397–401. doi: 10.1023/a:1023683404230. [DOI] [PubMed] [Google Scholar]
- Ramos-Vara JA, Miller MA. Immunohistochemical detection of protein gene product 9.5 (PGP 9.5) in canine epitheliotropic T-cell lymphoma (mycosis fungoides) Vet Pathol. 2007;44:74–79. doi: 10.1354/vp.44-1-74. [DOI] [PubMed] [Google Scholar]
- Ramos-Vara JA, Saeteele J. Immunohistochemistry. In: Howard GC, Kaser MR, editors. Making and using antibodies: a practical handbook. CRC Press; Boca Raton: 2007. pp. 273–314. [Google Scholar]
- Ramos-Vara JA, Beissenherz ME, Miller MA. Retrospective study of 338 canine oral melanomas with clinical, histologic, and immunohistochemical review of 129 cases. Vet Pathol. 2000;37:597–608. doi: 10.1354/vp.37-6-597. [DOI] [PubMed] [Google Scholar]
- Ramos-Vara JA, Miller MA, Johnson GC. Immunohistochemical characterization of canine hyperplastic hepatic lesions and hepatocellular and biliary neoplasms with monoclonal antibody hepatocyte paraffin 1 and a monoclonal antibody to cytokeratin 7. Vet Pathol. 2001;38:636–643. doi: 10.1354/vp.38-6-636. [DOI] [PubMed] [Google Scholar]
- Ramos-Vara JA, Beissenherz ME, Miller MA. Immunoreactivity of A103, an antibody to Melan-A, in canine steroid-producing tissues and their tumors. J Vet Diagn Invest. 2001;13:328–332. doi: 10.1177/104063870101300408. [DOI] [PubMed] [Google Scholar]
- Ramos-Vara JA, Miller MA, Johnson GC. Immunohistochemical detection of thyroid transcription factor-1, thyroglobulin, and calcitonin in canine normal, hyperplastic, and neoplastic thyroid gland. Vet Pathol. 2002;39:480–487. doi: 10.1354/vp.39-4-480. [DOI] [PubMed] [Google Scholar]
- Ramos-Vara JA, Miller MA, Johnson GC. Melan A and S100 protein immunohistochemistry in feline melanomas: 48 cases. Vet Pathol. 2002;39:127–132. doi: 10.1354/vp.39-1-127. [DOI] [PubMed] [Google Scholar]
- Ramos-Vara JA, Miller MA, Boucher M. Immunohistochemical detection of uroplakin III, cytokeratin 7, and cytokeratin 20 in canine urothelial tumors. Vet Pathol. 2003;40:55–62. doi: 10.1354/vp.40-1-55. [DOI] [PubMed] [Google Scholar]
- Ramos-Vara JA, Miller MA, Johnson GC. Usefulness of thyroid transcription factor-1 immunohistochemical staining in the differential diagnosis of primary pulmonary tumors of dogs. Vet Pathol. 2005;42:315–320. doi: 10.1354/vp.42-3-315. [DOI] [PubMed] [Google Scholar]
- Ramos-Vara JA, Miller MA, Valli VEO. Immunohistochemical detection of multiple myeloma 1/interferon regulatory factor 4 (MUM1/IRF-4) in canine plasmacytoma: comparison with CD79a and CD20. Vet Pathol. 2007;44:875–884. doi: 10.1354/vp.44-6-875. [DOI] [PubMed] [Google Scholar]
- Ramos-Vara JA, Kiupel M, Baszler T. Suggested guidelines for immunohistochemical techniques in veterinary diagnostic laboratories. J Vet Diagn Invest. 2008;20:393–413. doi: 10.1177/104063870802000401. [DOI] [PubMed] [Google Scholar]
- Raskin RE, Fox LE. Clinical relevance of the World Health Organization classification of lymphoid neoplasms in dogs (Abst) Vet Pathol. 2003;40:593. [Google Scholar]
- Reguera MJ, Rabanal RM, Puigdemont A. Canine mast cell tumors express stem cell factor receptor. Am J Dermatopathol. 2000;22:49–54. doi: 10.1097/00000372-200002000-00010. [DOI] [PubMed] [Google Scholar]
- Reid V, Doherty J, McIntosh G. The first quantitative comparison of immunohistochemical rabbit and mouse monoclonal antibody affinities using Biacore analysis. J Histotechnol. 2007;30:177–182. [Google Scholar]
- Rezuke WN, Abernathy EC, Tsongalis GJ. Molecular diagnosis of B- and T-cell lymphomas: fundamental principles and clinical applications. Clin Chem. 1997;43:1814–1823. [PubMed] [Google Scholar]
- Rhodes A. Quality assurance of immunocytochemistry and molecular morphology. In: Hacker GW, Tubbs RR, editors. Molecular morphology in human tissues: techniques and applications. CRC Press; Boca Raton: 2005. pp. 275–293. [Google Scholar]
- Roels S, Tilmant K, Ducatelle R. PCNA and Ki67 proliferation markers as criteria for prediction of clinical behavior of melanocytic tumors in cats and dogs. J Comp Pathol. 1999;121:13–24. doi: 10.1053/jcpa.1998.0291. [DOI] [PubMed] [Google Scholar]
- Ruslander DA, Gebhard DH, Tompkins MB. Immunophenotypic characterization of canine lymphoproliferative disorders. In vivo. 1997;11:169–172. [PubMed] [Google Scholar]
- Sakai H, Noda A, Shirai N. Proliferative activity of canine mast cell tumors evaluated by bromodeoxyuridine incorporation and Ki-67 expression. J Comp Pathol. 2002;127:233–238. doi: 10.1053/jcpa.2002.0586. [DOI] [PubMed] [Google Scholar]
- Sato T, Miyoshi T, Shibuya H. Peritoneal biphasic mesothelioma in a dog. J Vet Med A. 2005;52:22–25. doi: 10.1111/j.1439-0442.2004.00680.x. [DOI] [PubMed] [Google Scholar]
- Scase TJ, Edwards D, Miller J. Canine mast cell tumors: correlation of apoptosis and proliferation markers with prognosis. J Vet Intern Med. 2006;20:151–158. doi: 10.1892/0891-6640(2006)20[151:cmctco]2.0.co;2. [DOI] [PubMed] [Google Scholar]
- Sherman ME, Jimenez-Joseph D, Gangi MD. Immunostaining of small cytologic specimens: facilitation with cell transfer. Acta Cytol. 1994;38:18–22. [PubMed] [Google Scholar]
- Stoica G, Cohen N, Mendes O. Use of immunohistochemical marker calretinin in the diagnosis of a diffuse malignant metastatic mesothelioma in an equine. J Vet Diagn Invest. 2004;16:240–243. doi: 10.1177/104063870401600313. [DOI] [PubMed] [Google Scholar]
- Sundram U, Kim Y, Mraz-Gernhard S. Expression of the bcl-6 and MUM1/IRF4 proteins correlate with overall and disease-specific survival in patients with primary cutaneous large B-cell lymphoma: a tissue microarray study. J Clin Pathol. 2005;32:227–234. doi: 10.1111/j.0303-6987.2005.00298.x. [DOI] [PubMed] [Google Scholar]
- Suthipintawong C, Leong ASY, Vinyuvat S. Immunostaining of cell preparations: a comparative evaluation of common fixatives and protocols. Diagn Cytopathol. 1996;15:167–174. doi: 10.1002/(SICI)1097-0339(199608)15:2<167::AID-DC17>3.0.CO;2-F. [DOI] [PubMed] [Google Scholar]
- Swerdlow SH. Genetic and molecular genetic studies in the diagnosis of atypical lymphoid hyperplasias versus lymphoma. Hum Pathol. 2003;34:346–351. doi: 10.1053/hupa.2003.95. [DOI] [PubMed] [Google Scholar]
- Szczepanski T, van der Velden VH, Van Dongen JJ. Flow-cytometric immunophenotyping of normal and malignant lymphocytes. Clin Chem Lab Med. 2006;44:775–796. doi: 10.1515/CCLM.2006.146. [DOI] [PubMed] [Google Scholar]
- Teske E, van Heerde P, Rutteman GR. Prognostic factors for treatment of malignant lymphoma in dogs. J Am Vet Med Assoc. 1994;205:1722–1728. [PubMed] [Google Scholar]
- Thomas R, Smith KC, Ostrander EA. Chromosome aberrations in canine multicentric lymphomas detected with comparative genomic hybridisation and a panel of single locus probes. Br J Cancer. 2003;89:1530–1537. doi: 10.1038/sj.bjc.6601275. [DOI] [PMC free article] [PubMed] [Google Scholar]
- van Dongen JJ, Langerak AW, Bruggemann M. Design and standardization of PCR primers and protocols for detection of clonal immunoglobulin and T-cell receptor gene recombinations in suspect lymphoproliferations: report of the BIOMED-2 Concerted Action BMH4-CT98-3936. Leukemia. 2003;17:2257–2317. doi: 10.1038/sj.leu.2403202. [DOI] [PubMed] [Google Scholar]
- van Krieken JH, Langerak AW, San Miguel JF. Clonality analysis for antigen receptor genes: preliminary results from the Biomed-2 concerted action PL 96-3936. Hum Pathol. 2003;34:359–361. doi: 10.1053/hupa.2003.99. [DOI] [PubMed] [Google Scholar]
- Vernau W, Moore PF. An immunophenotypic study of canine leukemias and preliminary assessment of clonality by polymerase chain reaction. Vet Immunol Immunopath. 1999;69:145–164. doi: 10.1016/s0165-2427(99)00051-3. [DOI] [PubMed] [Google Scholar]
- Vilches-Moure JG, Ramos-Vara JA. Comparison of rabbit monoclonal and mouse monoclonal antibodies in immunohistochemistry in canine tissues. J Vet Diagn Invest. 2005;17:346–350. doi: 10.1177/104063870501700407. [DOI] [PubMed] [Google Scholar]
- Villiers E, Baines S, Law AM. Identification of acute myeloid leukemia in dogs using flow cytometry with myeloperoxidase, MAC387, and a canine neutrophil-specific antibody. Vet Clin Pathol. 2006;35:55–71. doi: 10.1111/j.1939-165x.2006.tb00089.x. [DOI] [PubMed] [Google Scholar]
- Vosse BAH, Seelentag W, Bachmann A. Background staining of visualization systems in immunohistochemistry. Comparison of the avidin-biotin complex system and the EnVision+ system. Appl Immunohistochem Mol Morphol. 2007;15:103–107. doi: 10.1097/01.pai.0000213102.33816.13. [DOI] [PubMed] [Google Scholar]
- Vural SA, Ozyldilz Z, Ozsoy SY. Pleural mesothelioma in a nine-month-old dog. Irish Vet J. 2007;60:30–33. doi: 10.1186/2046-0481-60-1-30. [DOI] [PMC free article] [PubMed] [Google Scholar]
- Webster JD, Yuzbasiyan-Gurkan V, Miller RA. Cellular proliferation in canine cutaneous mast cell tumors: associations with c-KIT and its role in prognostication. Vet Pathol. 2007;44:298–308. doi: 10.1354/vp.44-3-298. [DOI] [PubMed] [Google Scholar]
- Webster JD, Yuzbasiyan-Gurkan V, Trosko JE. Expression of the embryonic transcription factor OCT4 in canine neoplasms: a potential marker for stem cell subpopulations in neoplasia. Vet Pathol. 2007;44:893–900. doi: 10.1354/vp.44-6-893. [DOI] [PubMed] [Google Scholar]
- Webster JD, Miller MA, DuSold D. Effects of prolonged formalin-fixation on diagnostic immunohistochemistry in domestic animals, J Histochem Cytochem. Available at http://www.jhc.org/cgi/content/abstract/jhc.2009.953877v1 Accessed April 30, 2009. [DOI] [PMC free article] [PubMed]
- Weiser MG, Thrall MA, Fulton R. Granular lymphocytosis and hyperproteinemia in dogs with chronic ehrlichiosis. J Am Anim Hosp Assoc. 1991;27:84–88. [Google Scholar]
- Werner JA, Woo JC, Vernau W. Characterization of feline immunoglobulin heavy chain variable region genes for the molecular diagnosis of B-cell neoplasia. Vet Pathol. 2005;42:596–607. doi: 10.1354/vp.42-5-596. [DOI] [PubMed] [Google Scholar]
- Wilkerson MJ, Dolce K, Koopman T. Lineage differentiation of canine lymphoma/leukemias and aberrant expression of CD molecules. Vet Immunol Immunopath. 2005;106:179–196. doi: 10.1016/j.vetimm.2005.02.020. [DOI] [PubMed] [Google Scholar]
- Williams MJ, Avery AC, Lana SE. Canine lymphoproliferative disease characterized by lymphocytosis: immunophenotypic markers of prognosis. J Vet Intern Med. 2008;22:596–601. doi: 10.1111/j.1939-1676.2008.0041.x. [DOI] [PubMed] [Google Scholar]
- Workman HC, Vernau W. Chronic lymphocytic leukemia in dogs and cats: the veterinary perspective. Vet Clin North Am Small Anim Pract. 2003;33:1379–1399. doi: 10.1016/s0195-5616(03)00120-7. [DOI] [PubMed] [Google Scholar]
- Xu D, Du J, Schultz C. Rapid and accurate detection of monoclonal immunoglobulin heavy chain gene rearrangement by DNA melting curve analysis in the LightCycler system. J Mol Diag. 2002;4:216–222. doi: 10.1016/S1525-1578(10)60706-4. [DOI] [PMC free article] [PubMed] [Google Scholar]
- Yaziji H, Barry T. Diagnostic immunohistochemistry: what can go wrong? Adv Anat Pathol. 2006;13:238–246. doi: 10.1097/01.pap.0000213041.39070.2f. [DOI] [PubMed] [Google Scholar]
- Zucca E, Bertoni F, Roggero E. Molecular analysis of the progression from Helicobacter pylori-associated chronic gastritis to mucosa-associated lymphoid-tissue lymphoma of the stomach. N Eng J Med. 1998;338:804–810. doi: 10.1056/NEJM199803193381205. [DOI] [PubMed] [Google Scholar]