

Abstract

Cytopathology is a highly useful, noninvasive method for diagnosis of malignant vs. benign conditions and identification of infectious agents. However, a number of problems confront the cytopathologist on a daily basis because of limitations of conventional cytologic features. Adjunct techniques can be used to give additional information, which allows one to reach a definitive diagnosis. These techniques must be used in parallel with conventional cytologic features; they include immunodiagnostics for cellular origin, electron microscopy (EM) for presence of subcellular structures, special histochemical stains for demonstration of chemical constituents, flow cytometry and image analysis for quantitative evaluation of cellular markers, and molecular diagnostics for clonality or chromosomal abnormalities. In this chapter we discuss adjunct diagnostic techniques and focus on their applications in both cytopathology and histopathology.
Immunodiagnosis
The detection of antigens by immunologic and chemical reactions in tissue sections (immunohistochemistry, IHC), or cytologic preparations (immunocytochemistry, ICC) has become one of the most commonly used ancillary morphologic techniques in diagnostic pathology (Barr and Wu, 2006). The advantages of IHC and ICC are as follows: 1) They do not require the use of expensive equipment. 2) Both prospective and retrospective studies can be done on a variety of samples. 3) Antigen detection can be correlated with morphologic changes (IHC) and its cellular location (ICC). 4) Stained slides can be stored for many months. 5) Routine processing of samples is usually acceptable for these techniques. Both IHC and ICC are practical in the characterization of poorly differentiated neoplasms, differentiation of primary from metastatic tumors, and determination of sites of origin of metastatic lesions and prognostic assessments (DeLellis and Hoda, 2006). The general consensus is that IHC/ICC methods, if properly applied and interpreted, increase diagnostic accuracy in pathology. Technical aspects of IHC and ICC, interpretation of results, and pitfalls will be reviewed. An algorithmic approach to the diagnosis of tumors, the diagnosis of metastatic disease, and the use of antibodies as prognostic markers will be presented. This review will not include detailed IHC or ICC procedures. For this purpose, the reader is referred to other published material (Polak and Van Noorden, 2003, Ramos-Vara and Miller, 2014). Refer to the Appendix for further information regarding leukocyte ICC protocols.
Immunohistochemistry
Antibodies
IHC demonstrates antigens in tissue sections by incubating the sections with specific antibodies and demonstrating the immunologic reaction with a histochemical (enzyme-substrate) reaction to produce a colored (visible) reaction (Ramos-Vara and Miller, 2014). Polyclonal or monoclonal antibodies can be used. In general, polyclonal antibodies are usually raised in rabbits and have higher affinity but lower specificity than monoclonal antibodies. Cross-reactivity (defined as recognition of unrelated antigens) is more common with polyclonal antibodies. Key in the use of polyclonal antibodies in diagnostic IHC/ICC is their degree of purification (examples of commercially available antibodies include whole serum antibodies, antibodies purified by precipitation of immunoglobulins, and immunoglobulins purified by affinity chromatography). Monoclonal antibodies, produced in mice using the hybridoma technology, recognize a single epitope (a four- to eight-amino acid chain in a protein) and therefore are highly specific and have constant characteristics among different batches of antibody. Rabbit monoclonal antibodies are increasingly being used in human diagnostic IHC, but despite their reported advantages over mouse monoclonal antibodies (e.g., higher affinity, no need for antigen retrieval [AR], use on mouse tissues), some of them neither react on animal tissues nor perform better than mouse monoclonal antibodies (Reid et al., 2007, Vilches-Moure and Ramos-Vara, 2005). Selection of a particular antibody will be determined by published information or the experience of other laboratories. There are no guarantees that an antibody that recognizes an antigen in one species will do so in another species; only testing will determine if this is the case. Needless to say, the large number of species from which samples can be obtained is one of the biggest challenges that a veterinary pathologist must face in immunodiagnostics.
Fixation
The universal fixative for histopathology and diagnostic IHC is buffered formalin. Attempts to replace formalin fixative in diagnostic IHC have failed, although for specific situations the use of nonformaldehyde fixatives, particularly glyoxal-based, has been reported (Yaziji and Barry, 2006). Fixation is necessary to preserve cellular components, to prevent autolysis and displacement of cell constituents, to stabilize cellular materials (antigens), and to facilitate conventional staining and immunostaining (Ramos-Vara, 2005). The use of formalin is not without problems. First, the quality of formalin solutions varies widely in regard to concentration of formaldehyde, pH, and presence of preservatives. Second, formalin fixation, by producing methylene bridges between amino groups and other functional groups, alters the tertiary and quaternary structure of proteins and forms cross-links between soluble tissues and proteins (Ramos-Vara and Miller, 2014). These chemical reactions may modify the targeted epitope. Amino acids that are especially sensitive to formalin fixation include lysine, glycine, tyrosine, arginine, histidine, and serine. Despite the fact that formalin fixation may impair immunohistochemical detection, good fixation is paramount to detect antigens with IHC. It is currently accepted that underfixation is as bad as or worse than overfixation and is a fairly common problem due to reduced turnaround times in diagnostic laboratories (Ramos-Vara and Miller, 2014). With the advent of heat-induced epitope retrieval (HIER), overfixation or variable fixation time among samples is less critical in the detection of antigens targeted in diagnostic IHC (Webster et al., 2009, Webster et al., 2010). Autolysis is a common problem in diagnostic pathology. Studies addressing the effects of autolysis in IHC have shown that most antigens are still detectable despite decomposition; however, caution in the interpretation of autolyzed material is necessary due to the loss of detection of some antigens (Maleszewski et al., 2007). Necrotic tissue tends to produce more background than normal tissue; however, IHC of necrotic tissue can provide valuable information when no other tissue is available, particularly for cytokeratins and CD45. Decalcification of formalin-fixed tissues generally does not reduce the immunoreactivity of most antigens; loss of reactivity may occur when using strong acids for decalcification, but it does not affect all antigens. For a detailed review of fixation in IHC, refer to Ramos-Vara and Miller (2014).
Sample Processing
Processing of samples for diagnostic IHC is the same as for routine histopathology. Antigens have been successfully detected in formalin-fixed, paraffin-embedded (FFPE) tissues stored for several decades (Litlekalsoy et al., 2007). Autolyzed samples or those with biopsy artifacts should be avoided. For IHC and ICC, samples are mounted onto silanized slides, poly-L-lysine-coated slides, or charged slides to allow a strong bond between the slide and the tissue section. Pooling of reagents under the tissue section or tissue loss can occur when using noncharged slides or slides without special coatings. Complete deparaffination is critical to achieve optimal immunostaining. Deparaffination is somewhat cumbersome, and there are commercial products to perform deparaffination and AR simultaneously, although results may not be completely satisfactory (Ramos-Vara and Miller, 2014). A simple approach to deparaffination and AR with heat has recently been published (Boenisch, 2007).
Antigen Retrieval
Fixation and tissue processing modify the three-dimensional structure of proteins (antigens), which can render them undetectable by specific antibodies. This fact is better understood if we remember that, in general, an immunologic reaction between antigen and antibody depends on the conformation of the former (Hayat, 2002). One challenge of IHC is to develop AR methods that reverse the changes produced by fixation. AR is particularly necessary when tissues are fixed in cross-linking fixatives. Approximately 85% of antigens fixed in formalin require some type of AR to optimize the immunoreaction (Ramos-Vara and Beissenherz, 2000). The need for AR and choice of AR method depends not only on the antigen examined but also on the antibody used (Varma et al., 1999). Polyclonal antibodies are more likely to detect antigens than monoclonal antibodies (MAbs) in the absence of AR (Ramos-Vara and Beissenherz, 2000). Although AR allows detection of multiple antigens, background staining or antigen detection in unusual locations due to harsh AR methods is not uncommon, and can preclude diagnostic interpretation. In addition to conformational changes in the structure of proteins, fixation produces major changes in the electrostatic charge of proteins (antigens), which is critical for the initial attraction between antigens and antibodies. Therefore, recovery of the electrostatic charges lost during formalin fixation has been proposed as another mechanism of AR for many (but not all) proteins. In other words, it appears that more than one mechanism may be involved in the lack of recognition of antigens by antibodies after fixation in cross-linking fixatives. The two more common AR procedures include proteolytic enzymes (e.g., pronase, trypsin, proteinase K) and immersion of slides in buffer at high temperature. Each antibody may react differently to AR; therefore, it is necessary to test several methods when optimizing the IHC procedure. In general, HIER procedures appear to produce optimal results in a wide variety of antibodies. With the variety of AR methods available, standardization of IHC methods among laboratories and comparison of results is very challenging at best (Ramos-Vara and Miller, 2014).
Protocols
For technical aspects of IHC and detailed protocols, the reader is referred to more recent reviews (Ramos-Vara, 2013, Ramos-Vara and Miller, 2014). Table 17-1 includes the antibodies used by the Animal Disease Diagnostic Laboratory at Purdue University for infectious and neoplastic diseases of dogs and cats as well as others validated elsewhere. Immunohistochemical protocols can be divided into three stages: 1) pretreatment procedures; 2) incubation of the primary antibody, secondary, and tertiary reagents; and 3) visualization of the immunologic reaction.
Table 17-1.
List of Selected Antigen Markers, Sources, Tissue Controls, and Uses for Selected Antibodies Used in Dogs and Cats
| Antigen | Species∗ | Clone /Catalog # |
Vendor | Tissue Control/ Localization In ( ) | Use |
|---|---|---|---|---|---|
| Actin muscle | Dog | HHF35 | Dako | Skeletal muscle/heart (cyto) | Muscle neoplasms |
| Actin sarcomeric | Dog | Alpha-Sr-1 | Dako | Skeletal muscle/heart (cyto) | Striated muscle tumors |
| Actin smooth muscle | Dog | 1A4 | Dako | Stomach/intestine (cyto) | Smooth muscle tumors |
| Adenovirus (blend) | Dog | 20/11 and 2/6 | Chemicon | Infected tissue | Infection |
| Amylin (IAPP) | Cat, Dog | R10/99 | AbD Serotec | Pancreas (extracellular) | Pancreatic islet amyloid |
| Aspergillus | Cat, Dog | Mab-WF-AF-1 | Dako | Infected tissue | Infected tissue |
| Bcl-2 oncoprotein | Cat only | NCL-bcl-2 | Novocastra | Lymphoid tissue | Lymphoid tumors |
| B-lymphocyte antigen (BLA.36) | Cat, Dog | A27-42 | Dako | Lymph node, spleen (memb) | B-cell, histiocytic tumors |
| CD1a (IHC) | Cat, Dog | O10 | Dako | Thymus (memb) | Cortical thymocytes, Langerhans cells, T-cell lymphoblastic |
| CD1a (ICC) | Cat only | FE1.5F4 | UCD | Hematolymphatic (memb) | Dendritic cells, feline progressive histiocytosis |
| CD1a (ICC) | Dog only | CA13.9H11 | UCD | Hematolymphatic (memb) | Dendritic cell tumors, reactive/systemic histiocytosis |
| CD1c (ICC) | Cat | FE5.5C1 | UCD | Hematolymphatic (memb) | Dendritic cells, feline progressive histiocytosis |
| CD3 (ICC) | Dog only | CA17.2A12 | AbD Serotec | Lymph node, spleen (memb) | T-cell lymphoma |
| CD3 epsilon (ICC, IHC) | Cat, Dog | CD3-12 | AbD Serotec | Lymph node, spleen (cyto, memb) | T-cell lymphoma |
| CD4 (ICC) | Cat | FE1.7B12 | UCD | Hematopoietic (memb) | T-cell neoplasia |
| CD4 (ICC) | Dog | CA13.1E4, YKIX302.9 | UCD, AbD Serotec | Hematopoietic (memb) | T-cell neoplasia, reactive/systemic histiocytosis |
| CD5 (ICC) | Dog | YKIX322.3 | AbD Serotec | Spleen (memb) | T-cell lymphocytes |
| Cat | FE1.1B11 | ||||
| CD8α (ICC) | Dog | YCATE55.9 | AbD Serotec | Spleen (memb) | T-cell lymphocytes |
| CA9.JD3 | UCD | ||||
| CD8β (ICC) | Dog | CA15.4G2 | UCD | Spleen (memb) | T-cell lymphocytes |
| CD8 (ICC) | Cat | FE1.10E9 | UCD | Spleen (memb) | T-cell lymphocytes |
| CD10 (CALLA antigen) | Dog | 56C6 | Vector | Kidney (memb) | Renal, stromal tumors |
| CD11b (ICC) | Cat, Dog | CA16.3E10 | UCD | Spleen (memb) | Granulocytes, monocytes, macrophages |
| CD11c (ICC) | Dog | CA11.6A1 | UCD | Spleen (memb) | Granulocytes, monocytes, dendritic cells |
| CD11d (IHC) | Dog only | CA18.3C6 | UCD | Spleen (memb) | Lymphoid, histiocytic tumors |
| CD11d (ICC) | Cat, Dog | CA11.8H2 | UCD | Spleen, BM (memb) | Lymphoid, histiocytic tumors |
| CD14 (ICC, IHC) | Cat, Dog | TÜK4 | Dako | Hematopoietic (memb) | Monocytes, macrophages |
| CD18 | Cat only | FE3.9F2 | UCD | Spleen (memb) | Leukocytic tumors |
| CD18 | Dog only | CA16.3C10 | UCD | Spleen, lymph node (memb) | Leukocytic tumors |
| CD20 | Cat, Dog | /RB-9013 | LabVision | Spleen, lymph node (memb) | B-cell tumors |
| /PA5-16701 | Thermo Scientific | ||||
| CD21 (ICC) | Cat, Dog | CA2.1D6 | UCD, AbD Serotec | Lymph node (memb) | B-cell tumors |
| CD31 | Cat, Dog | JC70A | Dako | Skin, other (memb) | Vascular endothelial and megakaryocytic tumors |
| CD34 | Cat, Dog | /sc-7045 | Santa Cruz | Hematopoietic (memb) | Hematopoietic stem cells, vascular neoplasms |
| Dog | 1H6 | AbD Serotec | |||
| CD41/61 (ICC) | Cat, Dog | CO.35E4 | AbD Serotec | Bone marrow (memb) | Megakaryocytes, platelets |
| CD45 | Dog only | CA12.10C12 | UCD | Spleen, lymph node (memb) | Leukocytic tumors |
| YKIX716.13 | AbD Serotec | ||||
| CD45RA | Dog only | CA21.4B3 | UCD | Lymphoid tissue (memb) | Lymphoid tumors |
| CD68 | Cat, Dog | KP1 | Dako | Hematolymphatic (cyto) | Macrophages, myeloid leukemia |
| CD71 [transferrin receptor] (ICC) | Cat | Ber-T9 | Dako | Bone marrow (memb) | Reticulocytes |
| CD79a | Cat, Dog | HM57 | AbD Serotec | Lymph node, spleen (memb) | B-cell lymphoma |
| CD90 [Thy-1] | Dog | CA1.4G8 | UCD | Spleen (memb) | Interstitial dendritic cells, reactive/systemic histiocytosis |
| Dog | DH2A | WSU | |||
| CD117 (c-Kit protein) | Dog, Cat | /A4502 | Dako | Mast cell tumor (memb, cyto) | Mast cell tumor, GIST, melanoma |
| CD163 (macrophage scavenger receptor) | Dog, Cat | AM-3K | TransGenic | Spleen (memb) | Histiocytic (phagocytic) sarcoma |
| CD204 (macrophage scavenger receptor) | Dog | SRA-E5 /sc-166184 |
Santa Cruz, TransGenic | Spleen (memb, cyto) | Histiocytic (phagocytic) sarcoma |
| Calcitonin | Cat, Dog | /A0576 | Dako | Thyroid (cyto) | C-cell (medullary) tumors |
| Calponin | Cat, Dog | CALP, h-CP | Dako, Sigma | Small intestine, stomach (cyto) | Smooth muscle, myofibroblastic and myoepithelial tumors |
| Calprotectin (myeloid/histiocytic antigen) | Cat, Dog | MAC 387 | Dako, AbB Serotec | Spleen, liver (cyto) | Macrophages, myeloid cells |
| Calretinin | Cat, Dog | /18-0211 | Zymed | Kidney (cyto/nuclear) | Renal tubules, nerve tissue, adrenocortical tumors, mesothelioma |
| Canine distemper virus | Dog | CDV-NP | VMRD | Infected tissue | Infection |
| Carcinoembryonic antigen | Dog | /A0115 | Dako | Intestine (cyto) | Epithelial tumors |
| Chromogranin A | Cat, Dog | LK2H10 | Thermo Scientific | Pancreas (cyto) | Neuroendocrine marker |
| Claudin 1 | Cat, dog | /Ab15098 | Abcam | Epidermis (memb) | Epithelial neoplasms, meningioma |
| CNPase [myelin enzyme] | Dog | SMI-91 | BioLegend | Nerve (cyto) | Peripheral nerve tumors (Schwann cells), oligodendrogliomas |
| Coronavirus | Cat, Dog | FIPV3-70 | CMI | Infected tissue | Infection |
| COX-1 | Cat, Dog | /160108 | Cayman Chemical | Normal urinary bladder (cyto, nuclear) | Normal urothelium, endothelium |
| COX-2 | Cat, Dog | /160116 | Cayman Chemical | Urothelial carcinoma (cyto) | Carcinomas |
| Cytokeratin 5 | Dog | XM26 | Vector | Mammary gland, skin (cyto) | Myoepithelium, epithelial basal cells, mesothelium |
| Cytokeratin 7 | Cat, Dog | OV-TL 12/30 | Dako | Skin, urinary bladder (cyto) | Glandular epithelium neoplasms |
| Cytokeratins 8/18 | Dog | 5D3 | Novocastra | Liver, stomach (cyto) | Glandular epithelium neoplasms |
| Cytokeratins AE1-AE3 | Cat, Dog | AE1 and AE3 | Dako | Skin (cyto) | General epithelial cell marker |
| Cytokeratins Pan | Dog | MNF116 | Dako | Glandular/squamous epithelium (cyto) | General epithelial cell marker |
| Cytokeratins HMW | Dog | 34βE12 | Dako | Skin (cyto) | Squamous epithelium, mesothelium |
| Desmin | Dog | D33 | Dako | Skin, stomach, intestine (cyto) | Muscle tumors |
| E-Cadherin | Dog | 36 | BD Transduction | Skin (memb) | Langerhans cells, epithelial neoplasms, canine histiocytoma, meningioma |
| Cat | 4A2C7 | Zymed | |||
| Estrogen receptor alpha | Cat, Dog | CC4-5 | Novocastra | Uterus (nuclear) | Estrogen receptor expressing tumors |
| Factor VIII–related antigen (vWF) | Cat, Dog | /A0082 | Dako | Skin, other (cyto) | Vascular endothelial and megakaryocytic tumors |
| Feline calicivirus | Cat | S1-9 | CMI | Infected tissue | Infection |
| Feline herpesvirus 1 | Cat | FHV5 | CMI | Infected tissue | Infection |
| Feline leukemia virus | Cat | C11D8-2C1 | CMI | Infected tissue | Infection |
| Francisella tularensis | Cat, Dog | 240939 | Becton Dickinson | Infected tissue | Infected tissue |
| Gastrin | Cat, Dog | /A0568 | Dako | Stomach (cyto) | Gastrin-producing tumors |
| GATA-4 | Dog | /sc-1237 | Santa Cruz | Testis (nuclear) | Sex cord-stromal tumors |
| Glial fibillary acidic protein | Dog | /Z0334 | Dako | Brain (cyto) | Neural (glial) tumors |
| Glucagon | Cat, Dog | /A0565 | Dako | Pancreas (cyto) | Glucagon-producing tumors |
| Glut 1 | Dog | /A3536 | Dako | Peripheral nerve (cyto) | Peripheral nerves, stromal cells, kidney |
| Glycophorin A [CD235a] (ICC) | Cat | JC159 | Dako | Bone marrow (memb) | Erythroid leukemia |
| Hepatocyte marker-1 (Hep Par 1) | Cat, Dog | OCH1E5 | Dako | Liver (cyto) | Hepatocellular tumors |
| Ig kappa chains | Dog | /A0191 | Dako | Lymph node (cyto, memb) | Plasmacytomas, B-cell lymphoma |
| Ig lambda chains | Dog | /A0193 | Dako | Lymph node (cyto, memb) | Plasmacytomas, B-cell lymphoma |
| Immunoglobulin M | Cat, Dog | CM7 | CMI | Lymph node | Lymphoid tumors |
| Inhibin-alpha | Dog | R1 | AbD Serotec | Testicle, Sertoli cell tumor (cyto) | Sex cord-stromal and adrenal cortical tumors |
| Insulin | Dog | Z006 | Zymed | Pancreas (cyto) | Insulin-producing tumors |
| Ki-67 | Dog | 7B11 | Zymed | Lymphoma (nuclear) | Cell proliferation marker |
| Cat, Dog | MIB-1 | Dako | |||
| Laminin | Cat, Dog | /Z0097 | Dako | Skin/kidney (extracellular) | Perivascular wall tumors and basement membrane |
| Leptospira | Dog | – | NVSL | Infected tissue | Infection |
| Lysozyme | Dog | /A0099 | Dako | Liver, spleen (cyto) | Histiocytes (macrophages) |
| LYVE-1 | Cat, Dog | /Ab33682 | Abcam | Small intestine (cyto) | Lymphatic endothelial tumors |
| Melan-A | Cat, Dog | A103 | Dako | Melanoma (cyto) | Melanocytic neoplasms, steroid-producing tumors |
| Melanocytic antigen | Dog | PNL2/sc-59306 | Santa Cruz | Melanoma (cyto) | Melanocytic neoplasms |
| MHC II | Cat | 42.3 | UCD | Hematopoietic (memb) | Macrophage, dendritic lineage |
| MHC II | Dog | TAL.1B5 | Dako | Histiocytoma, LN (memb) | Antigen-presenting cells, lymphocytes |
| Microphthalmia transcription factor | Dog | C5 | Abcam | Melanoma (nuclear) | Melanocytic neoplasms |
| Myeloperoxidase (ICC) | Dog | 2C7 | AbD Serotec | Bone marrow (cyto) | Granulocytic leukemia |
| MUM 1 protein | Cat, Dog | MUM1p | Dako | Plasma cells (nuclear, ± cyto) | Plasmacytomas, myelomas, some B-cell tumors |
| MyoD1 | Dog | 5.8A | Dako | Rhabdomyosarcoma (nuclear) | Rhabdomyosarcoma |
| Myoglobin | Dog | /PA1-26083 | Thermo Scientific | Skeletal muscle, heart (cyto) | Skeletal muscle tumors |
| Myosin smooth muscle | Cat, Dog | SMMS-1 | Dako | Intestine (cyto) | Smooth muscle tumors |
| Neospora caninum | Dog | 210-70-NC | VMRD | Infected tissue | Infection |
| Nerve growth factor receptor | Cat, Dog | NGFR5 | Santa Cruz, Life Technologies | Nerve (memb) | Nerves |
| Neurofilament-2 | Dog | SMI-31 | BioLegend | Brain (cyto) | Neoplastic cells of neural origin |
| Neuron-specific enolase | Dog | BBS/NC/VI-H14 | Dako | Pancreas (cyto) | Neuroendocrine marker |
| OCT-3/4 | Dog | C-10/sc-279 | Santa Cruz | Mast cell tumor (nuclear) | Germ cells, stem cells |
| Olig-2 | Dog | /AB9610 | EMD Millipore | Cerebrum (nucleus, cyto) | Oligodendrogliomas |
| p63 | Dog | 4A4 | EMD Millipore | Skin, mammary gland (nuclear) | Myoepithelium, epithelial basal cells, urothelial tumors |
| Papilloma virus | Dog | BPV-1/18+CAM | Abcam | Infected tissue | Infection |
| Parathyroid hormone | Cat, Dog | A1/70/ab14493 | Abcam | Parathyroid (cyto) | Parathyroid neoplasms |
| Parvovirus | Dog | A3B10 | VMRD | Infected tissue | Infection |
| Pax5 | Cat, Dog | 24/Pax5 | BD Biosciences, Life Technologies | Lymph node (nuclear) | B-cell lymphoma |
| Progesterone receptor | Dog | SP2 | Thermo Scientific | Uterus (nuclear) | Progesterone receptor expressing tumors |
| Proliferating cell nuclear antigen (PCNA) | Cat, Dog | PC10 | Dako, AbD Serotec | Lymphoma, lymph node (nuclear) | Proliferation marker |
| Prostatic specific antigen | Dog | /A0562 | Dako | Prostate (cyto) | Prostatic carcinoma |
| Protein gene product 9.5 | Cat, Dog | /Z5116 | Dako | Adrenal gland (cyto) | Neuroendocrine marker |
| Prox-1 | Cat, Dog | /11-002 | AngioBio | Lymph node (nuclear) | Lymphatic endothelium neoplasms |
| S-100 protein | Cat, Dog | /Z0311 | Dako | Nerve, brain (cyto/nuclear) | Neural marker, neuroendocrine tumors |
| Somatostatin | Dog | /A0566 | Dako | Pancreas (cyto) | Pancreatic islet tumors, some carcinoids |
| Synaptophysin | Dog | SP11 | Thermo Scientific | Pancreas (cyto) | Neuroendocrine marker |
| Thyroglobulin | Cat, Dog | 12G9/ab1983 | Abcam | Thyroid (cyto) | Thyroglobulin-producing tumors |
| Thyroid transcription factor-1 | Dog | 8G7G3/1 | Dako | Lung, thyroid (nuclear) | Lung and thyroid neoplasms |
| Toxoplasma gondii | Cat | MAB802 | Chemicon | Infected tissue | Infection |
| Tryptase | Cat, Dog | AA1 | AbD Serotec | Mast cell tumor (cyto) | Mast cell tumors |
| Tyrosinase | Cat, Dog | SPM360 | Abcam | Melanoma (cyto) | Melanocytic tumors |
| Uroplakin III | Dog only | AU1 | Fitzgerald | Urinary bladder (cyto, memb) | Urothelial neoplasms |
| Vimentin | Cat, Dog | SP20, V9 |
Spring Science, Thermo Scientific |
Skin, stomach (cyto) | Mesenchymal tumor marker |
CMI, Custom Monoclonals International; HMW, high molecular weight; CNPase, 2’,3’-cyclic nucleotide-3’phosphodiesterase; GIST, gastrointestinal stromal tumor; UCD, University of California-Davis (P. Moore); NVSL, National Veterinary Services Laboratories (Ames, IA); WSU, Washington State University (Monoclonal Antibody Laboratory); ICC, immunocytochemistry (many useful for flow cytometry); Memb, surface membrane reactivity; Cyto, cytoplasmic reactivity.
Known species reactivity is listed; Dog or Cat only, indicates both species were tested but only one is reactive.
Pretreatment Procedures
These procedures include blocking of endogenous activities, blocking of nonspecific binding, and AR (the lattermost already discussed). Endogenous peroxidase (for immunoperoxidase procedures) is common in numerous tissues although formalin fixation destroys most of it. Endogenous alkaline phosphatase (for alkaline phosphatase detection methods) is blocked in procedures using this enzyme. Mammalian tissues have two alkaline phosphatase isoenzymes: The nonintestinal form is easily blocked with levamisole, and the intestinal isoform unfortunately requires acetic acid, a chemical that can damage some antigens, to be blocked. Numerous tissues have endogenous avidin-biotin activity that must be blocked before adding biotinylated reagents in avidin-biotin detection systems. Nonspecific binding of immunoglobulins to tissue is blocked by incubating tissue sections with bovine serum albumin or serum from the same species as the secondary reagent before the incubation with the primary antibody. There are commercially available reagents to block endogenous activities and nonspecific immunoglobulin binding.
Immunohistochemical Reaction
The immunohistochemical reaction can be divided into an immunologic (antigen-antibody) reaction followed by its demonstration with a histochemical (colored) reaction. The sensitivity of the immunohistochemical reaction is mostly the result of the detection method used (Ramos-Vara, 2005); progress in this regard has been dramatic in the last two decades. The two main enzymes used in IHC are peroxidase and alkaline phosphatase. Peroxidase is probably the most commonly used, but in some occasions, particularly with heavily pigmented samples or samples rich in endogenous peroxidase, alkaline phosphatase is an excellent alternative. Current IHC methods can be divided into avidin-biotin or non–avidin-biotin systems. After incubation with the primary antibody, a secondary antibody specific for the primary antibody (secondary reagent) is added. For avidin-biotin systems, the secondary reagent is biotinylated. For avidin-biotin methods, a tertiary reagent labeled with avidin molecules and an enzyme (peroxidase or alkaline phosphatase) is needed (Ramos-Vara and Miller, 2014). The most common non–avidin-biotin method is based on polymer technology. The polymers contain many molecules of secondary antibodies and enzyme. Polymer methods are usually two-step methods; however, supersensitive polymer methods consist of three steps, which are similar to avidin-biotin methods. Polymer-based methods have fewer steps, do not have endogenous avidin-biotin background problems, and are usually more sensitive (Vosse et al., 2007). Detection of multiple antigens in the same tissue section is also possible. Issues to keep in mind in double or multiple immunostaining is the compatibility of AR among antigens to be detected, the type of primary antibodies (polyclonal or monoclonal), cellular localization of antigens, and the color of chromogens used (Ramos-Vara and Miller, 2014).
Visualization of the Immunologic Reaction
The addition of a substrate for the enzyme used plus a chromogen will produce a colored reaction if there is binding of antibodies to tissue antigens. For immunoperoxidase methods, the most common chromogen is 3,3′-diaminobenzidine tetrahydrochloride hydrate (DAB), which produces a brown deposit. Another common chromogen is 3-amino-9-ethyl carbazole (AEC). For alkaline phosphatase, Fast Blue and Fast Red are common chromogens. The use of a chromogen needs to be coordinated with the counterstaining and coverslipping methods.
Standardization and Validation of an Immunohistochemistry Test
Like any other ancillary technique, IHC needs to be standardized and validated. Optimization (standardization) of a new antibody/test is the process of serially testing and modifying components of the procedure (e.g., fixation, AR, antibody dilution, detection system, incubation time, etc.) with the aim of producing a consistent, high-quality assay. The reader is advised to standardize every antibody used in his/her laboratory despite the existence of published protocols, to ensure optimal results. Standardization includes adequate tissue fixation. Tissues not thicker than 4 mm should be fixed in 10% neutral buffered formalin for a minimum of 8 hours. Every new antibody is tested following a standard protocol that includes three pretreatments—no AR, AR with a proteolytic enzyme (e.g., proteinase K), and HIER (e.g., citrate buffer, pH 6.0)—and four two-fold dilutions of the primary antibody (Ramos-Vara and Beissenherz, 2000). With this standard protocol, the total number of slides initially processed for each antibody is 15, including a negative reagent control for each pretreatment. The positive control section used in standardization (and later in a diagnostic setting) is one in which the antigen in question has been detected with a different method (e.g., virus isolation) and its cellular location is known. A negative control section (containing cells known by independent methods to lack the antigen in question) also should be included. Usually, the same tissue block used for the positive control can be used for the negative control.
Incubation of the primary antibody is done at room temperature; duration varies from 30 minutes to 2 hours. Overnight incubations (usually at 4°C) may be beneficial but disrupt the automation of the IHC procedure. Based on the results of this initial procedure, the optimal AR method and dilution of the primary antibody is selected as the slide with the best signal (specific staining)-to-noise (background staining) ratio. If staining is nonspecific or suboptimal, other AR methods and dilutions should be tested. Keep in mind that some antibodies raised against human antigens may not be reactive in animal tissues. For standardization, tissue samples are processed in the same way as the diagnostic samples that eventually will be tested.
Test validation in IHC follows standardization; however, because it is time consuming and expensive, it is seldom done in veterinary medicine. Validation of a test examines technical aspects such as the effects of prolonged fixation but focuses more on the ability of the antibody to be used as a marker of a specific cell, tumor, or infectious agent. Antibodies used as tumor markers need to be tested against tumors that may be difficult to distinguish from the one in question (tumors with similar phenotype, e.g., round cell tumors) with routine stains and tumors present in the same location/organ (Ramos-Vara et al., 2007). Validation should also include evaluation of staining differences among different tumors, staining differences within tumors—particularly when different phenotypes are present (e.g., spindle and epithelioid melanomas staining differences with Melan-A)—and differences between primary and metastatic tumors. Validation is critical given the relative immunologic promiscuity (recognition of more than one cell type or tumor) of most antibodies. Finally, and due to the proven variation of antibody reactivity among different species, standardization and validation of an immunochemical procedure must be done in each species examined. Due to the large resources needed to perform in-house validation studies in veterinary medicine, it is acceptable to use the information provided by other researchers or reported in the literature to validate a test.
Immunocytochemistry
Processing of Cytologic Samples
ICC can be performed on most types of cytologic samples, including cytospins, cell smears, cell blocks, cell cultures, and liquid-based monolayer preparations (Bratthauer, 2010, Chivukula and Dabbs, 2010; Dupré and Courtadi-Saidi, 2012; Fetsch and Abati, 2004, Skoog and Tani, 2011, Stone and Gan, 2014, Zhang et al., 1998). Cytospins and cell smears are used when the sample volume is small. The advantage of cytospins is better preservation of cytomorphology. Cell smears give reproducible results with nuclear markers but may be less suitable for cytoplasmic and membrane markers due to the high background produced by cell damage during slide preparation (Skoog and Tani, 2011). Cytospin preparations can be less susceptible to cell damage than smears. The use of pretreated slides to promote cell adhesion reduces loss of cells over the course of the ICC procedure (Dupré and Courtade-Saidi, 2012). Cell blocks are one of the best choices for ICC, particularly when cells are numerous (Miller, 2011, Ramos-Vara, 2013). Cell blocks are processed similarly to surgical pathology specimens, so IHC methods can be used without adaptive modifications (Dupré and Courtade-Saidi, 2012). See the Appendix for a brief description of the overall protocol. In addition, multiple sections can be produced from a single block, so multiple markers can be evaluated in the same cell population (Dupré and Courtade-Saidi, 2012, Varsegi and Shidham, 2009). However, cell blocks can alter cytologic detail and cause variation in cellularity depending on the lesion evaluated by fine-needle aspirate (FNA), the cellularity of FNA needle rinses, the sampling effectiveness during dedicated FNA passes for the cell block, and postprocedural handling of the needle rinse specimen (Brown, 2001, Roh et al., 2012). Importantly, because cell blocks are fixed in formaldehyde-containing solutions, sections from cell blocks may need to undergo AR procedures (Brown, 2001, Shi et al., 2011). Cell blocks are preferred for nuclear antigens (e.g., Ki-67, p53, proliferating nuclear cell antigen [PCNA]), whereas air-dried cytospins are preferred for the detection of surface antigens (e.g., leukocytic antigens). Liquid-based cytology using ThinPrep preparations enhances retrieval of cells from small samples with preservation of cellular detail and, theoretically, a reduction of background due to less blood, mucin, and proteinaceous material in the sample (Dupré and Courtade-Saidi, 2012). Micro-metastasis from carcinomas to the bone marrow in dogs and cats has been demonstrated recently using a cell block method of aspirate material stained with antibodies to CKAE1/AE3 and CK7 (Taylor et al., 2013). ThinPreps are less suitable than cell blocks for detection of nuclear antigens (Gong et al., 2003). A more detailed discussion of the pros and cons of different cytologic preparation methods can be found in Fowler and Lachar (2008).
Under certain circumstances, ICC may be performed on previously stained Romanowsky or Papanicolaou slides when that is the only available specimen; it produces similar results to that of unstained slides. The ICC staining can be done with or without previous destaining (with acid alcohol) of the routine stain (Abendroth and Dabbs, 1995, Barr and Wu, 2006, Miller and Kubier, 2002). However, there are some technical drawbacks to using previously stained slides: loss of cells from the slide, cell disruption (affecting mostly ICC of membranous and cytoplasmic markers), and signal reduction for some markers (e.g., S100) due to repeated passage of the sample through graded alcohols. In cases in which only a slide is available and the area containing cells is large, multiple markers can be tested simultaneously. Alternatively, the sample can be divided following tissue-transfer techniques (Stone and Gan, 2014, Dupré and Courtade-Saidi, 2012). Cell transfer techniques allow the evaluation of multiple markers when few slides are available for ICC (Stone and Gan, 2014). If cell transfer from previously stained cytologic smears is anticipated, nonadhesive treated slides should be used (Miller, 2011).
Storage of air-dried preparations for up to 2 weeks at 2°C to 8°C before ICC does not appear to reduce their antigenicity (Fetsch and Abati, 2004). Samples are put in a plastic microscope slide box, and then in a zip-lock plastic bag containing desiccant. Samples should equilibrate to room temperature before the bag is opened to avoid cell rupture. If longer storage is needed, slides should be kept at −70°C (Skoog and Tani, 2011, Suthipintawong et al., 1996). Some laboratories fix the cytologic samples with methanol and, if not used immediately, cover them with 3% polyethylene glycol for storage or transportation (Kirbis et al., 2011).
Fixation and Antigen Retrieval
A main difference between IHC and ICC is the type of fixation. Contrary to the situation in histopathology and IHC in which 10% formalin is the universal fixative, there is no standard fixative for cytologic specimens. In general, the type of fixation will be determined by the cytologic procedure and the antigens to be tested (Skoog and Tani, 2011). Cytology slides are either wet-fixed or air-dried and fixed immediately before performing ICC (Dabbs, 2002, Valli et al., 2009). When wet-fixed preparations were compared with air-dried samples, there were no significant changes in terms of cytologic preservation or ICC staining. However, air-dried preparations may lose fewer cells than wet-fixed samples; some have reported inconsistent ICC results with air-dried samples (Dupré and Courtade-Saidi, 2012).
For nuclear antigens, fixation of air-dried specimens in buffered 4% to 10% formalin alone or followed by methanol-acetone produces excellent results (Skoog and Tani, 2011, Suthipintawong et al., 1997). However, other authors have reported that air-drying of smears prior to fixation makes estrogen or progesterone receptor detection more difficult (Miller, 2011). For membrane and cytoplasmic antigens, the type of fixation is not as critical because for nuclear antigens, a variety of fixatives, including formalin followed by ethanol, a 1:1 mixture of methanol-absolute ethanol, or fixation in −20°C acetone produce good results (Skoog and Tani, 2011). Extra caution is needed when using acetone as fixative for ICC to detect small peptides. Acetone solubilizes cell membranes, leading to diffusion of small peptides out of cells and false-negative results (Van der Loos, 2007). Antigens such as S100 protein, Hep Par 1, and gross cystic fluid protein-15 are leached by alcohol fixatives, producing false-negative results (Chivukula and Dabbs, 2010). One laboratory proposes these guidelines: 1) Samples should be fixed immediately prior to the ICC procedure; 2) for lymphoid and melanoma markers, samples should be fixed for 5 to 10 minutes at room temperature in acetone; for epithelial markers, 5 minutes at room temperature in 95% ethanol or 1:1 mixture of methanol and 100% ethanol; for nuclear antigens, 3.7% buffered formalin for 15 minutes (Fetsch and Abati, 2004). Some authors use formal saline as a “universal” fixative (Leong et al., 1999). Others advocate air-drying slides if a lymphoma is suspected and immediately fixing smears in 95% ethanol (without air-drying) in all other cases (Miller, 2011). A recent comparison of FFPE cell blocks with alcohol-fixed centrifuged preparations (AFCPs) did not find significant differences (Ikeda et al., 2011). S100 protein, gross cystic disease fluid protein-15, and hormone receptors are not well demonstrated in ethanol-fixed samples due to cytoplasmic antigen leakage (Dabbs, 2002).
AR is necessary in many instances even if formalin fixation is not used. Unfortunately, the wide range of fixation procedures makes standardization of AR procedures among laboratories very difficult; each laboratory must optimize the procedure for each antigen (Kirbis et al., 2011, Shtilbans et al., 2005). AFCPs without AR performed similarly to cell blocks with AR in many cases; however, for some tests, particularly those detecting nuclear antigens, AR improved the reactivity of AFCPs (Ikeda et al., 2011). HIER using citrate buffer pH 6.0 is necessary for most nuclear antigens on ethanol-fixed cytologic smears; for some cytoplasmic membrane and cytoplasmic antigens, it enhances the immunoreaction (Denda et al., 2012). Few cytoplasmic membrane antigens require HIER with higher pH buffers (Denda et al., 2012). Some laboratories perform HIER irrespective of the fixation type (Zhang et al., 2012). Enzymatic AR is much less commonly used than HIER in ICC (Zhang et al., 2012). The mechanism of action of HIER might depend on the fixative. When the amount of cytologic specimen is limited, the same slide can be tested for a second marker if the first test is negative (Dabbs and Wang, 1998). When performing HIER or protease AR on smears, use adhesive slides; otherwise, cytologic material is likely to detach from the slides (Miller, 2011).
Method
Immunocytochemical methods parallel those of IHC. There are several steps previous to the incubation of the primary antibody (e.g., endogenous peroxidase block, nonspecific binding block, avidin-biotin block, AR). After the primary antibody incubation, a secondary, and sometimes a tertiary, reagent is necessary to demonstrate the immune reaction. The peroxidase block is necessary when using immunoperoxidase techniques; the usual method is with 3% H2O2 in deionized water. In blood-rich smears, the use of alkaline phosphatase procedures rather than immunoperoxidase will avoid the background produced by endogenous peroxidase without the need for strong (with sometimes deleterious effects on antigenicity) quenching reagents (Dupré and Courtade-Saidi, 2012). AR may be necessary on some occasions. Unfortunately, there is no rule to determine a priori whether AR is needed or which method is optimal. The approach to standardize ICC is similar to that for IHC. A comprehensive list of antibodies used in ICC at the National Cancer Institute, including antibody sources, dilution of the primary antibody, and fixation and AR methods, is available (Fetsch and Abati, 2004).
Interpretation of Immunohistochemistry and Immunohistochemistry
IHC is an ancillary method and therefore needs to be interpreted in conjunction with clinicopathologic data, including cytologic and surgical biopsy findings, if available. Specific knowledge of the right staining pattern of a given marker is extremely important to determine whether the staining is significant or not. As stressed in a later section on immunohistochemical diagnosis of metastatic tumors, there are very few, if any, antibodies that are truly specific for a single cell type. The interpretation of an IHC/ICC reaction is based on the expected “antibody personality profile” (see below) and the infidelity of tumor-specific markers (e.g., reactivity in T-cells with B-cell markers) (Yaziji and Barry, 2006). Simultaneous presence of an antigen in more than one cellular compartment is possible in neoplastic cells but usually results from diffusion of proteins due to cellular damage during processing. Detection of an antigen in an unusual location should be interpreted with caution and indicated in the immunohistochemical report. Generally speaking, antibodies used in IHC can be used in ICC, but not all antibodies used in ICC can be used in IHC. In addition, some antibodies that are nonreactive in surgical biopsy specimens may be suitable for cytologic preparations.
The interpretation of an immunohistochemical/immunocytochemical reaction requires a definition of positive or negative staining. This is a controversial issue so only guidelines will be given. Some markers are expected to be present in most cells in a tumor (e.g., cytokeratins in a carcinoma), whereas the detection of other markers (e.g., uroplakin III in transitional cell carcinoma) in only a small group of cells is considered a positive result. Perhaps, as recommended in human pathology (Goldstein et al., 2007), a statement in the report indicating the intensity of the staining and the percentage of positive tumor cells would be more informative than merely a positive or negative result (Höinghaus et al., 2008). The lack of expression of a particular antigen may be as significant as its presence in prognostication (e.g., absence of expression of progesterone receptor is linked to poor outcome in human breast cancer; lack of bcl-6 expression combined with MUM1 expression in cutaneous large B-cell lymphoma is linked to short survival) (Bardou et al., 2003, Sundram et al., 2005). In human pathology, IHC antibodies are classified as class I devices by the Food and Drug Administration (FDA), meaning that antibodies are considered special stains as adjuncts to conventional histopathologic diagnostic examination (Rhodes, 2005). In other words, with some exceptions, IHC is not a standalone technique and results must be interpreted by the pathologist in the context of the disease. Some IHC tests (e.g., assays for ER, PR, HER2/neu) are considered class II devices with potential predictive or prognostic value. Similarly in veterinary medicine, immunohistochemical results are part of the pathology report and need to be interpreted by the pathologist (Ramos-Vara et al., 2008).
Interpretation of ICC is more challenging than that of IHC because of the difficulty in obtaining positive and negative control samples treated in a similar way to the test sample and the additional difficulty of distinguishing normal from neoplastic cells. With the general lack of clear guidelines in this regard, each laboratory should document and state in the ICC report what is interpreted as a positive result. As for IHC, interpretation of ICC tests should be done in conjunction with a standard cytologic stain (e.g., Wright-Giemsa, Papanicolaou) and in concert with the clinicopathologic correlations (Chivukula and Dabbs, 2010).
Limitations of Immunohistochemistry
Although IHC has largely displaced EM as the ancillary technique of choice in diagnostic pathology, it has some limitations (Fisher, 2006). One of the main problems is the lack of standardization and quality control among laboratories, particularly in regard to AR. This interlaboratory lack of reproducibility is significant when dealing with prognostic markers (Mengel et al., 2002). Interpretation of immunostaining is also subjective (wide range of interobserver interpretations), and a degree of knowledge of IHC and the antibodies used is required to interpret the results correctly. What constitutes a positive result (percentage of positive cells needed, intensity of the reaction) is still controversial, but it is a critical issue for therapeutic decisions in oncology. Some tumors do not express specific markers beyond the generic ones, which makes testing with multiple markers expensive and unrewarding. Neoplastic cells upregulate and downregulate gene expression, resulting in the lack of expression of expected antigens or the expression of new antigens. All these issues are perhaps more serious in veterinary medicine, where the degree of sophistication and use of IHC techniques is not as advanced as in human pathology, and are exacerbated by interspecies differences in antigen expression and detection.
Troubleshooting
General Lack of Staining
The most common cause of lack of staining in the test and control samples is improper procedure (including fixation, AR, antibody concentration, and improper counterstain) (Dabbs, 2002). A systematic approach to the entire procedure is necessary to determine the cause of staining failure.
Weak Staining
In this context, weak staining applies to both the positive (tissue) control and the test sample and may be the result of too much buffer left after a rinsing step, excessive antibody dilution, inadequate AR, insufficient incubation time, or improper storage of reagents such as buffers, antibodies, and substrates (Fetsch and Abati, 2004). If weak staining only affects the test sample, it might be the result of loss of epitopes in the tissue or overfixation.
Background Staining, False-Positive Staining, and False-Negative Staining
There are multiple causes of background staining. A common one is inadequate blocking of serum proteins. Blocking is usually done with normal serum or protein (Brown, 2001). Bovine serum albumin has been used extensively in the past as a blocking reagent of nonspecific reactions. However, adding albumin to antibody and diluent solutions increases the background of immunohistochemical reactions (Mittelbronn et al., 2006). Other causes of false-positive staining are necrotic tissue, crushed cells, improper fixation, incomplete blocking of endogenous peroxidase or endogenous biotin, spurious staining of cells that have phagocytized other cells, and high concentration of the primary antibody (Dabbs, 2002, Miller, 2011, Skoog and Tani, 2011). Samples that are too thick tend to trap reagents and produce background staining. Carcinoma cells in fluids often express vimentin and lose their immunoreactivity for cytokeratins; antigens shed into effusion fluid can be absorbed onto the surfaces of other cells present in the same fluid. Some antigens in cytologic samples such as factor VIII-rAg and immunoglobulins tend to diffuse into the surrounding tissue, contributing to incorrect interpretation of immunostaining (Barr and Wu, 2006). To avoid overstaining due to the concentration of the primary antibody, retitration of primary antibodies on cytologic preparations is recommended. Other causes of background staining are included elsewhere (Ramos-Vara, 2005). When using detection kits that recognize primary antibodies made in goats, extensive background in both positive and negative controls is observed if using tissue sections from the same or related species (ruminants) due to the presence of endogenous immunoglobulins recognized by the secondary antibody (anti–goat IgG). A similar problem is observed with rabbit monoclonal antibodies tested on rabbit tissues or mouse monoclonal antibodies tested on mouse tissues. Special detection procedures are commercially available to avoid this background staining. Although not an example of nonspecific background staining, it is very important in ICC to distinguish positive staining in normal or reactive cells from that in neoplastic cells (Chivukula and Dabbs, 2010). This distinction can be challenging when the number of reactive cells is higher than that of the neoplastic cells (e.g., T-cell–rich B-cell lymphoma). Figure 17-1, Figure 17-2 show examples of background and nonspecific staining.
Figure 17-1.
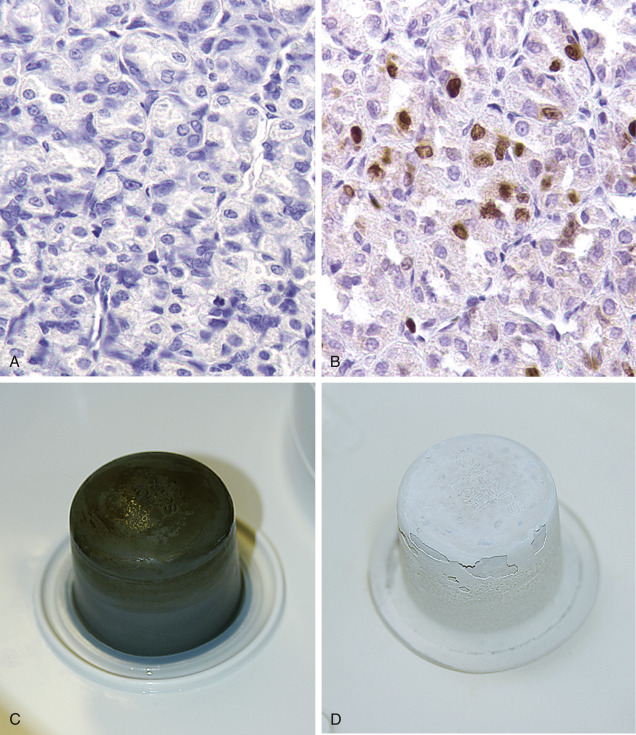

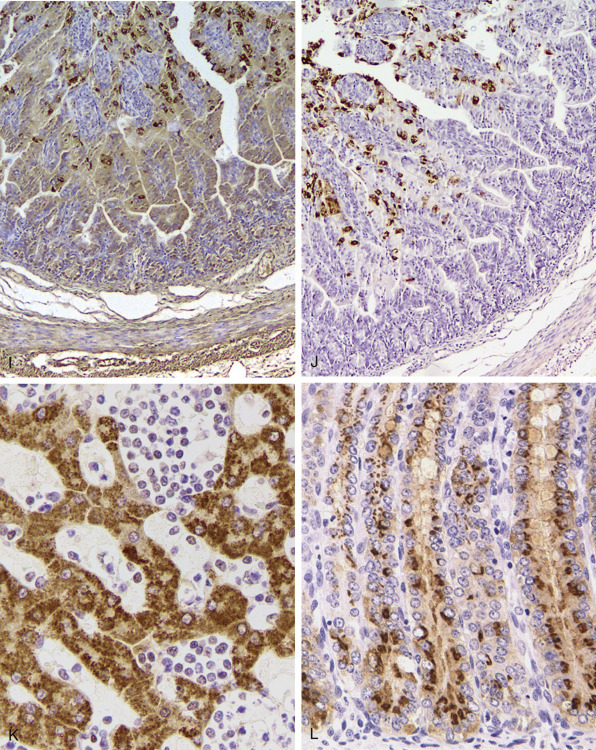
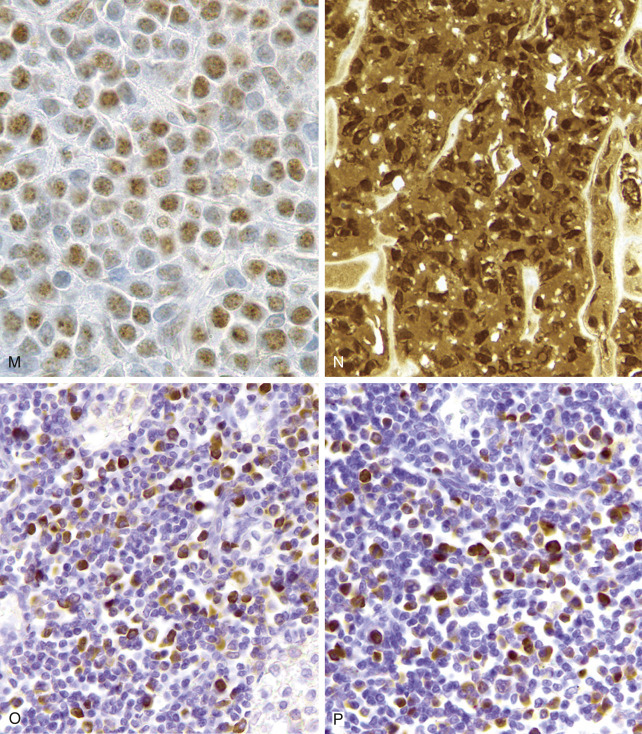
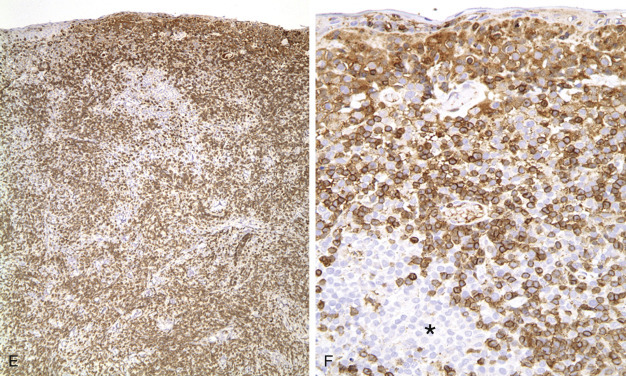
A–P, Troubleshooting in immunohistochemistry.
A, Tissue section cut several weeks before immunohistochemical testing shows no staining for Ki67 as a result of tissue section aging. B, Compare the same tissue section when cut fresh and immunohistochemistry is performed, which shows anti-Ki67 nuclear staining in several cells. C, A clean heating unit is shown, which helps avoid fluctuations in the incubation temperature. D, Note the buildup of salt deposits when using a steamer. E, Antigen retrieval (HIER with citrate) demonstrates MHC II–positive cells that include lymphocytes and histiocytes in a case of regressing canine cutaneous histiocytoma. F, Note only dendritic (Langerhans) cells are demonstrated when not using antigen retrieval. G, Myoglobin is only detected in striated muscle (asterisk) of esophagus when no antigen retrieval is used. H, Nonspecific staining due to antigen retrieval with proteinase K in blood vessels (v), smooth muscle (s), and mucosal epithelium (e).I, The primary antibody is too concentrated and nonspecifically reacts with many cells. J, Optimal dilution of the primary antibody shows reactivity for anti–rotavirus A only in infected cells of this section of small intestine. K, Strong staining of hepatocytes with antibody to CD79a, a B-cell marker. L, The majority of epithelial cells in this section of small intestine have strong supranuclear staining with anti–rotavirus A, which was considered nonspecific. Similar staining (supranuclear) has been observed in different mucosal epithelia with other monoclonal antibodies targeting infectious agents.M, CD79a antibody sometimes produces strong nuclear staining in lymphocytes without demonstrable cytoplasmic staining. This pattern of staining is considered nondiagnostic. N, Autolyzed tissues may show abnormal location of some proteins. Parathyroid gland shows strong nuclear and cytoplasmic staining for CKs. O, Use of negative reagent control section helps to demonstrate positive nonspecific staining by numerous plasma cells in this section of lymph node with a primary antibody for natural killer cells. P, A similar tissue section with the primary antibody replaced with nonimmune serum. The staining is almost identical. These results are interpreted as binding of the secondary antibody to immunoglobulin-producing cells (plasma cells).
(A-B, Courtesy of Kim Maratea, Purdue University.)
Figure 17-2.

A–F, Troubleshooting in immunohistochemistry.
A, This section of lymphoid tissue was not pretreated with hydrogen peroxide to remove endogenous peroxidase activity. Red blood cells (asterisk) contain abundant endogenous peroxidase activity. B, Nonspecific DAB precipitate can mimic true staining. C, The border of the section (asterisk) is less stained than the center due to loss (evaporation) of reagents during prolonged incubation in this case of lymphoma stained for CD3. D, Four slides show the results for the two markers Melan-A and S100. Each marker has two tissue sections on two slides, one slide incubated with the primary antibody (slides labeled as MEL and S-100) and one slide in which the primary antibody has been replaced with nonimmune serum or immunoglobulins [slides labeled as (-) CONTROL]. It is advisable to add a known positive control to the same slide that contains the test tissue section (in this case the positive control is the brown-stained tissue in the upper half of the slides). This case was positive for S100 and negative for Melan-A (test tissues are in the lower half of the slides). E, Low magnification of a case of regressing cutaneous histiocytoma demonstrates the more abundant reactive CD3-positive lymphocytes than neoplastic Langerhans cells. F, Higher magnification of E showing Langerhans cells that are unstained with antibody to CD3 (asterisk).
Other causes of false-negative staining are improper fixation, inadequate antibody titration, insufficient AR, or cell damage during slide preparation (Chivukula and Dabbs, 2010, Skoog and Tani, 2011).
Use of Controls
The use of positive/negative controls is well established and standardized in human and veterinary IHC procedures (Ramos-Vara, 2005, Ramos-Vara et al., 2008). Positive and negative controls for ICC must be performed with each test sample (Chivukula and Dabbs, 2010, Yaziji and Barry, 2006). Although the ideal tissue (cell) control is a comparably fixed cytology sample (Chivukula and Dabbs, 2010), in a recent review of the ICC literature, only 13% of publications listed positive and negative controls processed identically as the samples; 54% did not mention the use of controls or processed controls separately (Colasacco et al., 2010). The College of American Pathologists recognizes the impracticality of maintaining separate positive control samples for every possible combination of fixation, processing, and specimen type (see comment for questions ANP 22550 in the Anatomic Pathology checklist at http://www.cap.org/apps/cap.portal). Cytologic control preparations fixed in acetone will lose antigenicity after several months even if wrapped in aluminum foil and refrigerated; control samples fixed in formalin retain their antigenicity indefinitely (Valli et al., 2009). The production of cytologic controls from organs (e.g., lymph node, liver) is described elsewhere (Valli et al., 2009). The ideal positive cell control should demonstrate immunoreactivity that is weak in some places and strong in others. A negative reagent control is also necessary for each antibody tested (Fig. 17-2). For the negative reagent control, either an irrelevant antibody or nonimmune serum from the same species as the primary antibody (and ideally the same Ig isotype for monoclonal antibodies) replaces the primary antibody (Fetsch and Abati, 2004). The slide with the negative reagent control should be processed in an identical manner as the slide with the primary antibody. The negative control slide is used to assess nonspecific staining that is not the result of specific antigen-antibody binding (background staining). If only one slide is available, it may be used divided into test and negative reagent control using a commercial hydrophobic barrier pen or by using cell transfer technique (DeLellis and Hoda, 2006, Stone and Gan, 2014). In some instances, a slide negative for one marker can be used to test a second marker. See the Appendix for further information regarding these techniques.
Panel Markers for Diagnostic Immunohistochemistry of Tumors
The goal of diagnostic IHC is to maximize sensitivity without compromising specificity of results. A typical approach is to cover the main tumor types with antibody panels that include cytokeratins (carcinoma), vimentin (sarcoma), S-100 (melanomas or peripheral nerve sheath tumors), and CD18 (leukocytic neoplasms). To achieve maximum sensitivity, the use of “redundant” antibodies for a given antigen is recommended—in other words, the use of several antibodies that should label the same cell type. Table 17-2 lists cell markers and their use in the immunochemical diagnosis of tumors, with emphasis on organ systems. In human pathology, the following expanded panel has been proposed: pancytokeratin (carcinomas), CD45 and CD43 (lymphomas), S-100 and Melan-A or gp 100 (melanomas), and vimentin and collagen IV (sarcoma) (Yaziji and Barry, 2006). Some of these markers are not available or not reactive in animal tissues, so alternatives need to be found. Once other clinicopathologic data have been examined, judicious use of antibodies is the best approach: It will reduce both the cost of testing and the need to explain unexpected reactions to the client. Once a particular tumor group has been identified (e.g., sarcoma), more specific markers to determine the type of tumor are used. This approach is based on algorithms. Fig. 17-3 shows a basic algorithm to characterize tumors frequently found in domestic species. This algorithmic approach is borrowed from the human experience; unfortunately, many markers currently used in human pathology are not reactive in animal tissues or their reactivity is different (in other words, when dealing with IHC, not all animal species and antibodies are created equal). The lack of predictive behavior (percentage of positive cases of a tumor with a particular antibody) is one of the most difficult barriers to overcome in veterinary diagnostic IHC. The use of a particular marker will be also determined by its availability in the laboratory. Many antibodies with diagnostic or prognostic significance in human pathology await validation in similar tumors of animals (Capurro et al., 2003). A similar algorithmic approach can be used in ICC.
Table 17-2.
Markers Used for the Differential Diagnosis of Major Tumor Categories
| Tumor Tissue | Markers |
|---|---|
| Adrenal | Cortex: Melan-A, inhibin-alpha, calretinin Medulla: PGP 9.5, chromogranins, synaptophysin |
| Endocrine tumors (generic) | Chromogranin A, synaptophysin, PGP 9.5, neuron-specific enolase (NSE), S100 |
| Epithelial vs. mesenchymal | Cytokeratins (epithelial), vimentin (mesenchymal), E-cadherin (epithelium), claudin-1 (epithelial), p63 (basal cells, myoepithelium) |
| Leukocytic | CD45 (panleukocytic), CD18 (with emphasis in histiocytic), CD11d (dendritic cells), CD90, E-cadherin (Langerhans cells), lysozyme (histiocytes), calprotectin, CD163, CD204 (histiocytes, myeloid cells) |
| Liver | Hep Par 1 (hepatocytes), cytokeratin 7 (bile duct epithelium) |
| Lymphoid | CD3 (T-cell), CD79a and CD20 (B-cell), CD45 and CD18 (panleukocytic), MUM1 (plasma cells), Pax5 (B-cell) |
| Mast cell tumors | CD117, tryptase, OCT3/4 |
| Melanocytic tumors | Melan-A, melanocytic marker PNL2, NSE, S100 |
| Muscle differentiation | Actin muscle (all muscle), actin sarcomeric (striated muscle), calponin (smooth muscle, myofibroblast, myoepithelium), desmin (all muscle), smooth muscle actin (smooth muscle), myoglobin (skeletal muscle) |
| Neurogenic tumors | S100 (neurons, glial cells), neurofilament (neurons); GFAP, Olig-2, CNPase (glial cells); glut1, nerve growth factor receptor (perineural cells) |
| Pancreas (endocrine) | Chromogranin A, glucagon, gastrin, insulin, somatostatin, synaptophysin, PGP 9.5 |
| Squamous vs. adenocarcinoma | Squamous cell carcinoma (CK5, p63); adenocarcinoma (CK7, CK8/18) |
| Testis and ovary | Sex cord-stromal tumors (inhibin-α, NSE); germ-cell tumors (calretinin, KIT, Oct3/4, PGP 9.5) |
| Thyroid | Thyroglobulin (follicular cells), calcitonin (medulla, C-cells), TTF1 (follicles and medulla) |
| Urinary tumors | Uroplakin III, cytokeratin 7, COX-2, COX-1, p63 |
| Vascular tumors (endothelium) | Factor VIII–related antigen, CD31, CD34 (blood and lymphatic endothelium); LYVE-1 and Prox-1 (lymphatic endothelium) |
Figure 17-3.
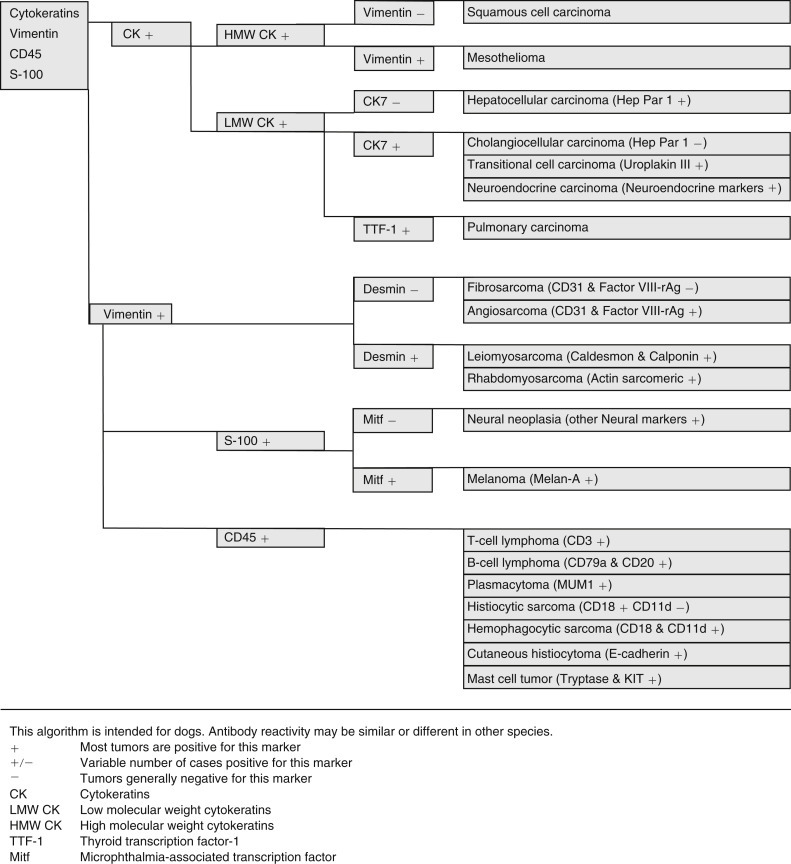
Simplified algorithmic approach for canine tumor diagnosis using immunochemistry.
Cytokeratins, vimentin, CD45, and S-100 provide the starting point to help distinguish several carcinomas, sarcomas, neural tumors, and hematopoietic neoplasms from each other.
Antibody personality profile (APF) is a relatively new concept introduced by Yaziji and Barry (2006). An APF is defined by 1) location of expected signal (e.g., cytokeratins are exclusively cytoplasmic; S-100 protein and calretinin are cytoplasmic and nuclear; CD45 and CD11 are in the cell membrane; laminin and collagen IV are found only in the interstitium); 2) antibody pattern (S-100 produces a homogeneous signal; cytokeratins, a filamentous signal; chromogranin A and Melan-A, a granular signal); 3) antibody-characteristic pattern across tissues and tumors (thyroid transcription factor-1 [TTF-1] stains most neoplastic cells in a pulmonary carcinoma; uroplakin III stains only a small percentage of tumor cells). Knowledge of the profile facilitates accurate interpretation of immunohistochemical results. Keep in mind that APF may vary among animal species (Ramos-Vara et al., 2000, Ramos-Vara et al., 2002b).
Immunochemical Diagnosis of Anaplastic or Metastatic Tumors
The number of antibodies available for diagnostic purposes has increased exponentially in the last few years. This gives the diagnostician more opportunities to make a definitive diagnosis—or get more confused. Keep in mind that regardless of the number of markers used to characterize a particular tumor, the gold standard before attempting IHC should be HE. A careful examination of HE-stained slides will reduce the number of markers needed to arrive to a definitive diagnosis. Even after that, it is uncommon to make a definitive diagnosis with only one marker because expression (or lack of thereof) of proteins in tumor cells may differ from that in the normal cell counterpart. Upregulation and downregulation of gene expression and the proteins codified by such genes is common in neoplastic cells. The use of tumor marker panels in the diagnosis of metastatic disease is key to improving the chances of arriving at a definitive diagnosis. Considering the relatively low cost of IHC and the expenses of treating some tumors, clinicians are keen to get a definitive answer from the pathologist. A treatment tailored to a specific tumor will more likely improve the quality of life of the animal.
The proposed series of steps to characterize a metastatic tumor has been modified from Bhargava and Dabbs (2010) and include the following:
-
1)
Determine the cell line of differentiation using major lineage markers.
-
2)
Determine the cytokeratin type for carcinomas and possible co-expression of vimentin.
-
3)
Determine if there is expression of cell-specific products, cell-specific structures, or transcription factors unique to specific cell types.
The main difference with the algorithmic approach for a metastatic tumor is that without knowing the location of the primary tumor, the differential diagnosis includes more tumor types and the tumor marker panel therefore includes more antibodies.
Determine the Cell Line of Differentiation
Markers should include keratins as well as lymphoid, melanoma, and sarcoma markers (Chijiwa et al., 2004, Höinghaus et al., 2008). A basic panel of markers for small animals is pancytokeratins (clones AE1/AE3 or MNF 116), CD45 or CD18 (panleukocytic markers), Melan-A or S100 (melanocytic differentiation), and vimentin (mesenchymal differentiation).
Determine the Cytokeratin Type for Carcinomas and Co-expression of Vimentin
Cytokeratins comprise approximately 20 polypeptides with different molecular weights, numbered 1 through 20. They are separated by charge into acidic (type I) and basic (type II) keratins. Cytokeratins are paired together as acidic and basic types. Most low–molecular weight keratins (e.g., CK7, 8, 18, 20) are present in all epithelia except squamous epithelium, whereas high–molecular weight keratins (e.g., CK1, 2, 3, 4, 9, 10) are typically present in squamous epithelium. Almost all mesotheliomas and carcinomas, except squamous cell carcinomas, have CK8 and CK18. The coordinate expression of CK7 and CK20 is one criterion to classify carcinomas in human pathology. This approach has proven very useful in metastatic carcinomas of undetermined origin. There is only one paper published regarding domestic animals that examines a wide range of carcinomas in dogs and cats for expression of CK7 and CK20 (Espinosa de los Monteros et al., 1999). Results for CK7 were similar to those in humans, but major differences were observed for CK20 among both animal species. CK5 is a useful marker of myoepithelial differentiation in glandular tumors as well as for squamous epithelium and mesothelial cells. Although cytokeratins are the typical marker of epithelial differentiation, they can be detected in mesenchymal tumors (melanoma, leiomyosarcoma, gastrointestinal stromal tumors, liposarcoma, meningioma, and angiosarcoma) although usually in only a few cells as opposed to the diffuse and strong staining of carcinomas and sarcomatoid carcinomas (Dabbs, 2006). Co-expression of intermediate filaments has been reported in certain human fetal and adult tissues.
Some carcinomas frequently express vimentin, particularly endometrial carcinoma, renal cell carcinoma, salivary gland carcinoma, spindle cell carcinoma, and thyroid follicular carcinoma. In a few cases, co-expression of CK and vimentin is observed in colorectal, mammary, prostatic, and ovarian carcinomas. A recent veterinary example is that involving transitional cell carcinoma, which metastasized to joints and was detected in synovial fluid (Colledge al., 2013).
Expression of Cell-Specific Products
This group of markers includes proteins or glycoproteins produced by a few cell types. The exact function of some of these proteins is unknown.
Neuroendocrine Markers
Within the generic neuroendocrine markers, synaptophysin and chromogranin A are the most commonly used and specific for this group of tumors. Antibodies for these markers work well in most animal species. Keep in mind that synaptophysin, in addition to staining the majority of pheochromocytomas of the adrenal gland, may stain a significant number of adrenal cortical tumors as well. Neuron-specific enolase (NSE) is another classic generic neuroendocrine marker. Unfortunately, this marker is less specific than its name claims and stains other nonendocrine cell types, making its use in diagnostic IHC questionable. A recently introduced neuroendocrine marker in veterinary pathology, protein gene product (PGP) 9.5, a ubiquitin hydrolase, labels many neuroendocrine cells but also labels unrelated tumors (Ramos-Vara and Miller, 2007). Antibodies to peptide hormones (e.g., thyroglobulin, calcitonin, glucagon, insulin) usually cross-react among different animal species and demonstrate specific endocrine cell types.
Specific Markers
Every year, numerous scientific papers report the characterization of “novel” markers (antibodies) that are extremely specific for particular human cells or tumors. Most eventually will be relegated to use in combination with other antibodies (as part of a tumor panel). In this section are presented some markers that are useful in the characterization of specific animal tumors. Thyroid transcription factor-1 (TTF1), a nuclear transcription factor, is frequently expressed in thyroid tumors (more common in follicular but also present in medullary tumors) and pulmonary tumors (Ramos-Vara et al., 2002a, Ramos-Vara et al., 2005). Other tumors, including mesotheliomas, are usually negative. Hepatocyte paraffin 1 (Hep Par 1) is consistently detected in hepatocytes and their tumors, with no staining of biliary epithelium, which makes it a good choice to distinguish these tumors, particularly when used in conjunction with CK7 (Ramos-Vara et al., 2001a). However, some intestinal, and probably pancreatic, tumors can be positive (Ramos-Vara and Miller, 2002). Melan-A is one of the best specific and sensitive markers of melanomas in dogs (less sensitive in feline melanomas) and certainly more specific than other classic markers such as S100 and NSE (Ramos-Vara et al., 2000, Ramos-Vara et al., 2002b). It should be noted that many steroid-producing tumors from the adrenal cortex, testis, and ovary show strong reactivity for Melan-A (Ramos-Vara et al., 2001b). Uroplakin III, a major component of the asymmetric unit of transitional epithelium, is expressed in most canine transitional cell carcinomas and, in conjunction with CK7, the number of transitional cell carcinomas detected approaches 100% (Ramos-Vara et al., 2003). Uroplakin III has not been detected in nonurothelial normal or neoplastic tissues of dogs except in some prostatic carcinomas (Lai et al., 2008), which makes this marker extremely specific.
A marker widely used in human pathology to discriminate mesothelioma from carcinoma is calretinin. However, attempts to use it in canine mesotheliomas with a variety of antibodies have been equivocal. There is a report of calretinin staining in equine mesothelioma (Stoica et al., 2004). The differential diagnosis of mesothelioma and pulmonary carcinoma is challenging in human pathology; numerous antibodies have been tested. The combination of D2-40 and calretinin (both positive in mesothelioma and negative in lung carcinoma) and CEA and TTF-1 (both negative in mesothelioma and positive in pulmonary carcinoma) antibodies is an economic way to distinguish these two tumors (Mimura et al., 2007). Desmin is detected in reactive mesothelial cells but not in mesothelioma or carcinoma in cytologic preparations (Afify et al., 2002). As previously mentioned, TTF-1 is a specific and sensitive marker of canine pulmonary and thyroid carcinomas. The use of CEA on animal tumors is very limited. We are not aware of D2-40 staining of mesotheliomas in animal species. The use of both cytokeratins and vimentin (usually co-expressed in mesotheliomas) is probably the best approach to distinguish mesothelioma from pulmonary carcinoma in animals (Geninet et al., 2003, Morini et al., 2006, Sato et al., 2005, Vural et al., 2007).
Calponin A, smooth muscle–specific protein, has been evaluated in canine mammary tumors (Espinosa de los Monteros et al., 2002). In addition, Webster et al (2007b) studied the expression of the embryonic transcription factor OCT4 in canine neoplasms.
Antibodies as Prognostic Markers in Veterinary Oncology
IHC in oncology is useful as a tool to determine tumor prognosis or disease outcome. This is a topic of intense investigation in human pathology and not without controversy. Prognostic markers are currently under investigation for some animal tumors. Briefly discussed below are proliferation markers, telomerase activity, KIT stem cell factor, and immunophenotypic changes during cancer progression.
Proliferation/Cell Cycle Markers
This group includes Ki67, PCNA, and cyclins, and in general indicates the proportion of proliferating/cycling cells in a given tumor; these markers correlate well with mitotic index. Malignant tumors generally have more proliferating cells than benign tumors, with some exceptions. Lymphomas, mammary tumors, melanocytic tumors, and mast cell tumors are probably the tumors in domestic species in which these markers have been studied most extensively (Ishikawa et al., 2006, Kiupel et al., 1999, Madewell, 2001, Sakai et al., 2002). In mast cell tumors, there is good correlation between decreased survival time and Ki67 index and between the histochemical detection of nuclear organizing regions (AgNORs), which determine the rate of cellular proliferation (generation time), and decreased disease-free interval (Webster et al., 2007a). Both AgNORs and Ki67 scores were considered useful prognostic markers for canine mast cell tumors, with Ki67 score used to divide Patnaik grade 2 mast cell tumor into two groups showing markedly different actual survival times study (Scase et al., 2006). PCNA score did not correlate with differences in survival times of several types of tumors (Roels et al., 1999, Scase et al., 2006, Webster et al., 2007a). The prognostic significance of detection of cyclins in animal tumors has not been fully evaluated (Murakami et al., 2001).
Telomerase
Telomeres are portions of repetitive DNA that protect chromosomes from degradation and loss of essential genes (Cadile et al., 2007, Pang and Argyle, 2010). With each cell division, telomeres progressively shorten in all somatic cells until cells undergo replicative senescence or apoptosis. Telomerase is a ribonucleoprotein enzyme complex that synthesizes telomere DNA. In normal cells, telomerase is detected in male germ cells, activated lymphocytes, lens tissue, and stem cell populations but not in somatic cells. In human cancer, telomerase activity is detected in 85% to 90% of cases, and in dogs more than 90% of tumors examined have telomerase activity (Kow et al., 2006). Telomerase expression in dogs is significantly associated with tumor proliferation (Ki67 labeling index) and/or tumor grade (Long et al., 2006). Immunohistochemical detection of telomerase could be useful as a prognostic marker and tool to determine the therapeutic approach to cancer (Argyle and Nasir, 2003).
KIT
The KIT protein, a tyrosine kinase receptor product of the c-kit proto-oncogene, is expressed in numerous tissues and cells, including mast cells and mast cell tumors. Immunohistochemical staining patterns of KIT in canine mast cell tumors have been used as a prognostic tool (Kiupel et al., 2004). In a normal mast cell, KIT is localized in the cell membrane; localization within the cytoplasm in mast cell tumors has been linked to increased rate of local recurrence, decreased survival rate, and increased tumor grade (Reguera et al., 2000).
Epithelial-Mesenchymal Transition
Epithelial-mesenchymal transition (EMT) has been observed in some human cancers. It is a complex cellular process characterized by morphologic changes of epithelial cells, which transition from a polyhedral morphology to a more elongated, mesenchymal, phenotype (Pang and Argyle, 2010). This phenotypical transformation is the result of loss or redistribution of epithelial markers (e.g., E-cadherin, β-catenin) and gain or upregulation of mesenchymal markers (e.g., fibronectin, α-smooth muscle actin, vimentin, N-cadherin), leading to loss of cell-cell adhesion, actin cytoskeleton reorganization and the acquisition of motility, invasiveness, and increased resistance to apoptosis (Baumgart et al., 2007, Pang and Argyle, 2010). EMT is also associated in some instances with tumor grade or stage (Baumgart et al., 2007). One case of transitional cell carcinoma displayed morphologic change as well as concurrent cytokeratin and vimentin immunoreactivity in which dissemination was widespread (Colledge et al., 2013).
Electron Microscopy
Ultrastructural examination of tissues and cells is one of the most common ancillary methods used in diagnostic cytology and pathology (Dardick et al., 1996). If the markers of IHC are structural or secretory proteins specific for a cell or tissue, then the markers of EM are subcellular structures such as organelles or matrix constituents. EM has contributed in great measure to an understanding of the structural features of normal and pathologic tissues. Although its use has declined in the last decade and partially replaced by other techniques (e.g., IHC), EM is still a very valuable tool to reach a definitive diagnosis in some difficult cases, particularly in peripheral nerve sheath tumors, some synovial sarcomas, pleomorphic sarcomas, and mesotheliomas (Dardick and Herrera, 1998, Mackay, 2007). New ultrastructural methods applied to biologic specimens have recently expanded the use of EM in pathology (Cheville and Staskos, 2014). EM and IHC should be used in a complementary fashion based on the type of diagnostic problem (Fisher, 2006). As an ancillary technique, EM raises the level of confidence in diagnoses based on light microscopy. Of the three main types of ancillary techniques currently used in veterinary pathology (EM, IHC, PCR), EM is the most mature technique—meaning that it has gone through the usual stages of development, evaluation, and stabilization as opposed to the other two techniques that are still in development or evaluation stages. As the saying goes, embrace the new techniques if they are worthy and keep the proven old ones.
Pros and Cons of Electron Microscopy
Advantages
-
•
It is the only method to examine the fine detail of tissues and cells (organelles, inclusions, pigments, extracellular matrix).
-
•
There is a wealth of information on ultrastructural pathology in the literature of the last 40-plus years.
-
•
Although not optimal, formalin-fixed (and even paraffin-embedded) tissues can be used.
-
•
It can identify infectious agents not previously reported (and therefore without specific antibodies or genetic probes).
-
•
Many microorganisms are more resistant to autolysis than eukaryotic cells (and therefore warrant ultrastructural examination in suboptimally preserved tissues) (Figure 17-4, Figure 17-5, Figure 17-6, Figure 17-7 ).
-
•
For some tumors, it is the most reliable method for diagnosis (Fig. 17-8 ).
-
•
For certain lesions (e.g., glomerular disease), it is still the gold standard method (Fig. 17-9 ).
-
•
Immunologic assays can be performed on EM samples.
-
•
EM complements IHC.
-
•
Cellular structures are nearly identical among animal species at the ultrastructural level (in IHC, in contrast, it is common to be unable to demonstrate a particular antigen in a new species due to lack of interspecies cross-reactivity).
Figure 17-4.
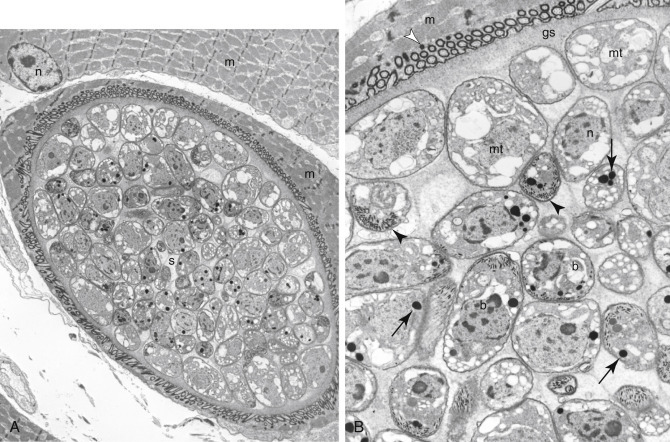
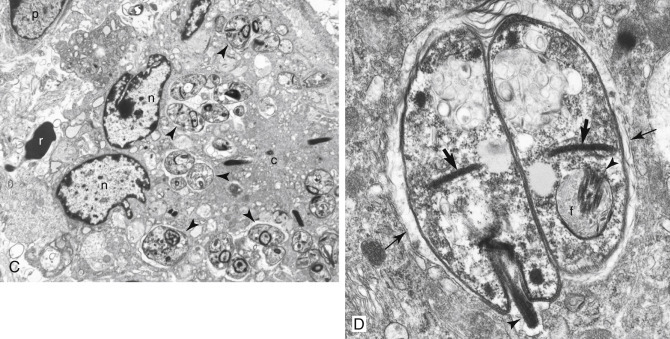
A–D, Ultrastructure of microorganisms.
A, Mink with a Sarcocystis cyst (s) within a skeletal muscle cell (m) along with its nucleus (n). B, Higher magnification of the Sarcocystis cyst reveals metrocytes (mt), bradyzoites (b), and ground substance (gs) surrounded by the cyst wall (white arrowhead). Typical structures of coccidian parasites are micronemes (arrowheads) and rhoptries (arrows). Skeletal muscle (m) contains the cyst. Note the nucleus (n) of a bradyzoite. C, The dermis of a horse with Leishmania amastigotes (arrowheads) within a multinucleate giant cell. Note the nucleus (n) and cytoplasm (c) of multinucleate giant cell. A red blood cell (r) and plasma cell nucleus (p) are partially visible. D, Higher magnification of two Leishmania amastigotes showing the kinetoplast (thick arrows), flagellum (arrowhead), and flagellar pocket (f) within the parasitophorous vacuole (thin arrows).
Figure 17-5.
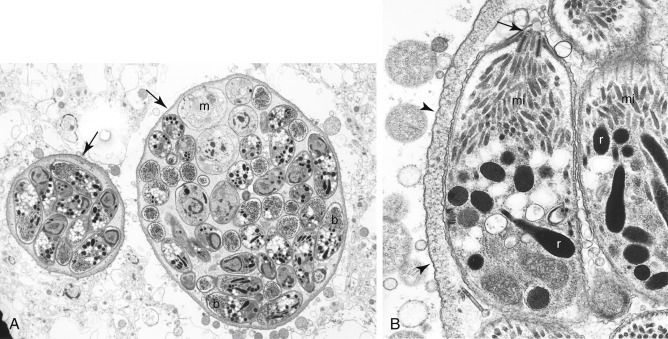
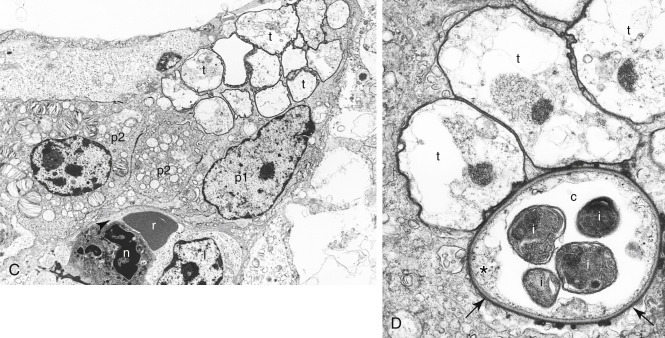
A–D, Ultrastructure of microorganisms.
A, Brain in a cat has two Toxoplasma gondii cysts (arrows) that contain numerous bradyzoites (b) and fewer immature merozoites (m). B,Toxoplasma bradyzoites with conoid (arrow), micronemes (mi), and rhoptries (r) surrounded by a cyst wall (arrowheads). C, Lung of a pig with numerous Pneumocystis carinii trophozoites (t) on the alveolar surface. Note the type 1 (p1) and type 2 (p2) pneumocytes, red blood cell (r), neutrophil (n), and lymphocyte (l). D, Three trophozoites (t) and one cyst (c) form. Note the cyst has a thick cell wall (arrows), a rudimentary cytoplasm (asterisk), and four intracystic bodies (i).
Figure 17-6.
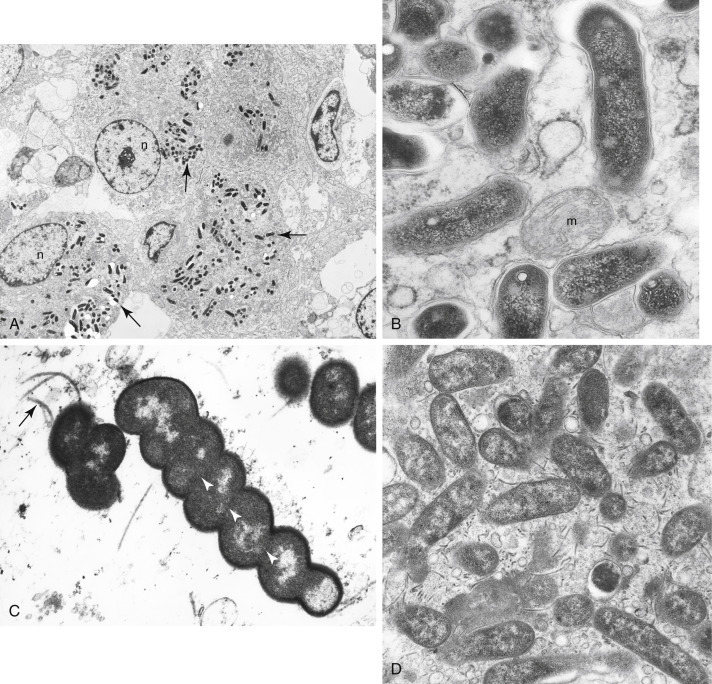
A–D, Ultrastructure of bacteria.
A, Goat intestine with Mycobacterium avium subsp. paratuberculosis (arrows) within epithelioid macrophages. Note the nucleus (n) of the macrophages. B, Higher magnification of mycobacterial organisms, indicating a mitochondrion (m). C, Pig stomach with Helicobacter sp. Note flagella (arrow) and periplasmic filaments (arrowheads in white). D, Dog stomach with Campylobacter-like organisms. Numerous flagella are observed in this field.
Figure 17-7.
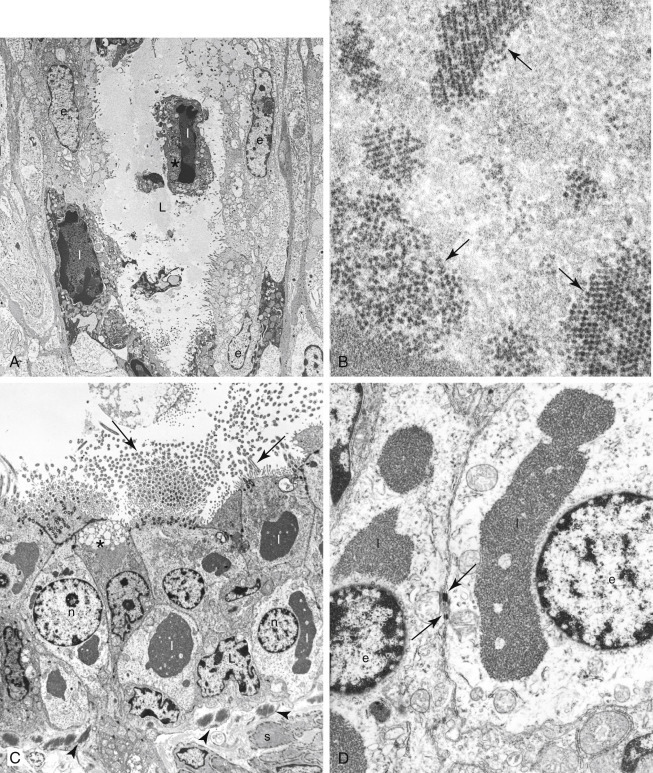
A–D, Ultrastructure of viral infections.
A, Cat intestine with a crypt lined by epithelial cells (e). Two epithelial cells, one free (asterisk) in the crypt lumen (L), have pyknotic nuclei and intranuclear feline panleukopenia viral inclusions (I). B, Higher magnification of feline panleukopenia viral particles forming distinct arrays (arrows). C, Mink bronchiole with numerous ciliated cells that contain intracytoplasmic distemper viral inclusions (I). Note the nucleus (n) of the epithelial cells, many cilia (arrows), mucus cell (asterisk), basement membrane with collagen bundles (arrowheads), and a smooth muscle cell (s). D, Higher magnification of bronchiole demonstrating distemper viral inclusions (I). Note the intercellular junctions (arrows) between two infected epithelial cells and the nuclei of the two epithelial cells (e).
Figure 17-8.

A–D, Ultrastructure of mesenchymal neoplasia.
A, Perivascular wall tumor from the skin of a dog demonstrating a capillary vessel lumen (l) that is lined by endothelial cells, a pericyte (arrow), and collagen fibers (c). Neoplastic pericytes (asterisks) form multiple layers around the vessel. B, Leiomyosarcoma in the intestine of a dog with spindloid neoplastic cells (s) that have characteristic subplasmalemmal and cytoplasmic densities (arrows) of smooth muscle cells. Note the extracellular matrix (m). C, Low magnification and (D) higher magnification of a canine case of hemangiosarcoma in the skin. The neoplastic capillary vessel lumens (l) are lined by atypical endothelial cells (e) that have a large nucleus with abundant euchromatin and a prominent nucleolus. Also present are red blood cells (r), extracellular matrix (m), and pericytes (arrows).
Figure 17-9.

A–D, Ultrastructure of normal kidney and glomerular disease.
A, Normal structure of the equine glomerulus showing the urinary space (u) with basement membrane (asterisks) lined by podocyte processes (p). Note that foot processes of podocytes are distributed evenly over the surface of the basement membrane. Lumen of capillary (l) is shown. Inset: Higher magnification of the filtration unit of the glomerulus showing the urinary side (u) versus the vascular side (v). B, Membranous glomerulonephritis in a cat reveals irregular thickening of the basement membrane (asterisks) of the glomerulus. The basement membrane has multiple immune-complex electron-dense deposits (large arrows). Note the fused foot processes of podocytes (arrowheads). Lumen of capillary vessel (l) is surrounded by a fenestrated lining (small arrows). Also shown is a red blood cell (r) and the urinary space (u). C, Membranous glomerulonephritis in a dog demonstrates irregular thickening of the basement membrane that contains multiple immune-complex electron-dense deposits (long arrows), some in a subepithelial location (short arrows). Note microvilli (arrowheads) on the surface of a podocyte (p). D, Canine glomerulocystic kidney disease has parietal epithelium (e) that is hypertrophic and distorted, containing abundant, mildly electron-dense material (asterisks). The associated Bowman capsule (c) is expanded by extracellular matrix and surrounds the urinary space (u).
Disadvantages
-
•
Sample preparation is rather tedious.
-
•
Optimal preparation is only achieved with special fixation.
-
•
Pathologic changes are sometimes difficult to distinguish from autolysis or processing artifacts.
-
•
Sampling may not be representative due to small sample size (an important limiting factor for heterogeneous lesions); pitfalls include the presence of necrotic, normal, or stromal tissue.
-
•
Overall, it is more expensive than IHC.
-
•
It requires expensive equipment and highly skilled technicians.
-
•
Examination of samples is very tedious.
-
•
Pathologists with extensive experience and interest in ultrastructural pathology are an endangered species.
Basics of Electron Microscopy
Fundamentals
The principle on which the transmission electron microscope operates is similar to that of the light microscope (i.e., lenses are used to magnify images). The main difference used to produce images is in the type of radiation, which for EM is electrons, and the means to focus, which for EM is electromagnetic lenses. The resolving power of an electron microscope is around 0.2 nm or less, much higher than that obtained with a photonic microscope (200 nm) or with a fluorescence microscope (100 nm) (Woods and Stirling, 2013). Processing a sample for EM is basically similar to that for light microscopy, paraffin-embedded samples, but the reagents used are different.
Fixation
The speed of fixation is critical in EM to avoid changes due to autolysis. As previously mentioned, the fixative of choice for light microscopy is formaldehyde. For routine EM, glutaraldehyde is the gold standard, with secondary fixation in osmium tetroxide. These two fixatives are complementary: Glutaraldehyde stabilizes proteins and osmium tetroxide stabilizes lipids. Glutaraldehyde has a slower diffusion rate than formaldehyde, and very small samples (around 1 mm3) are required for optimal fixation. Formaldehyde is not an optimal fixative, but in diagnostic pathology, it is the most commonly used primary fixative for EM, particularly when ultrastructural studies are not considered initially in the diagnostic workup. Due to the impurities of commercially available formaldehyde solutions (e.g., formic acid, methanol), ultrastructural preservation is compromised. Tissues fixed in paraformaldehyde (an aldehyde from which formaldehyde is produced) are more amenable to immunoelectron microscopy than those fixed in glutaraldehyde.
Processing of Fixed Samples
Fixed samples are dehydrated and embedded in a liquid resin that polymerizes to produce a hard block that is cut using special glass or diamond knives in an ultramicrotome. Epoxy resins are the standard embedding material, but for special procedures (e.g., immunoelectron microscopy), acrylic resins, such as Lowicryl and LR White resins, are preferred (Woods and Stirling, 2013). For cell suspensions (FNA, cytology samples), samples are preembedded in a protein medium (e.g., agar, bovine serum albumin). Pelleted cytologic specimens can be prepared by low-speed centrifugation of the cell suspension followed by removal of the supernatant and replacement with the fixative. Semi-thin sections (0.5 to 1.0 μm) are first cut to localize the most appropriate portion of the sample to section at an approximate thickness of 60 to 90 nm (silver to straw-colored ultrathin sections). Routine sections are usually stained with uranyl acetate and lead citrate (osmium fixative will also stain membranes and lipid vacuoles). FFPE tissues can be used when no other sample is available. Keep in mind that the degree of preservation of organelles and membranes in FFPE samples may be severely compromised.
Approach to Diagnostic Ultrastructural Pathology
Sample selection and interpretation of electron micrographs is heavily biased by the clinical history and light microscopy findings. After examination of FFPE tissues under light microscope, differential diagnoses are made and additional ancillary techniques (e.g., EM, IHC) are requested for further characterization of that lesion. After examining a lesion by light microscopy, the pathologist will determine which features to seek at the ultrastructural level. During the ultrastructural examination, a good observer may find additional, unexpected features that prompt reconsideration of the original diagnosis. Formalin fixation or delayed fixation will probably create artifacts that may render the sample unsuitable for thorough ultrastructural evaluation but still be adequate to detect specific features (e.g., viral particles, parasites, inclusions, crystals). Buffered formaldehyde (approximately pH 7.4) will reduce the loss of cellular components and tissue shrinkage.
In case of a conflict of interpretation between light microscopy and EM, reevaluation of findings is mandatory. As a rule, if discrepancies still persist, light microscopy findings should prevail due to the far greater amount of tissue examined. However, the current specialization of pathology makes the use of multiple ancillary techniques (EM, IHC, PCR) common in difficult cases and careful evaluation of all results needs to be made before establishing a final diagnosis. Malignancy cannot be determined on ultrastructural grounds. Establishment of a malignant phenotype is in the realm of light microscopy and tumor biologic behavior, supported in very specific cases by immunohistochemical and molecular tests. Table 17-3, Table 17-4 are intended to give the reader a general approach to the ultrastructural characterization of common tumors.
Table 17-3.
Organelle Approach to Tumor Diagnosis
| Organelle | Features | Tumor |
|---|---|---|
| Basal lamina | 50- to 100-nm–thick, moderately dense layer following the contours of the cell membrane. | Epithelium, mesothelium, meningothelium, granulosa cell, Sertoli cell, muscle, nerve sheath, adipose, and endothelial tumors. (Not present in: hematopoietic cells, fibroblasts, neurons, chondrocytes, osteoblasts, myofibroblasts) |
| Extracellular matrix |
Collagen: Cross-striated periodicity of 50 nm, 50- to 100-nm thick. Elastin: Amorphous, moderately dense component and 10- to 12-nm tubular filaments in different arrangements. Proteoglycans: Poorly stained, amorphous with occasional granular to filamentous structures. |
Numerous epithelial and mesenchymal tumors. Chondrosarcoma. Variable in mesenchymal tumors. |
| Fibronexus | Cell-to-matrix structure composed of fibronectin filaments in the extracellular space and subplasmalemmal plaques with intracellular smooth muscle myofilaments. Difficult to observe in formalin-fixed tissues. | Myofibroblastic tumors. (Not present in smooth muscle tumors and fibrosarcomas) |
| Filaments, intermediate | About 10 nm thick. Located in cytoplasmic matrix. Noncytokeratin: vimentin, desmin, neurofilaments, glial filaments. Impossible to distinguish them by EM. Variable amounts; between organelles, forming bands of spheroidal masses. Cytokeratins: tonofibril (bundles of cytokeratin filaments). Loosely organized (nonsquamous epithelium, e.g., mesothelium) or high electron density (squamous and basal cell epithelium). |
Carcinomas, neuroendocrine tumors, melanomas, sarcomas. Squamous, basal cell, mesothelioma, endocrine, ameloblastoma, synovial, and epithelioid sarcomas. Myoepithelium (along with myofilaments). |
| Filament, smooth muscle | 5- to 7-nm (actin) and 15-nm (myosin) thick with dense bodies and attachment plaques. | Leiomyosarcoma, hemangiopericytoma, myoepithelium, myofibroblast. |
| Filaments, striated muscle | Variable degree of differentiation (organization) of sarcomeric myofilaments (actin, myosin). | Rhabdomyosarcoma, rhabdomyoma. |
| Glycogen | Small, pale to dense particles (30 nm) or rosettes (100-200 nm). Empty areas of cytoplasm due to extraction during processing. | Muscle and liver tumors. Variable amount in many carcinomas and sarcomas. |
| Golgi apparatus | Packaging and biochemically altering proteins produced in RER. Stacks of membranes. | No specific tumor types. |
| Intercellular junctions |
Desmosomes: uniform width of 20-30 nm with intermediate linear density, subcytoplasmic membrane plaques and tonofilaments. Gap junctions: Closely apposed membranes (2-nm space) without associated filaments or dense material. |
Many epithelial and mesenchymal tumors. |
| Lipid | Not membrane-bound with amorphous to lamellar, variably dense matrix. Membrane-bound if in lysosomes. | Abundant in steroidogenic tumors, adipose tumors, sebaceous carcinoma, renal cell carcinoma. |
| Melanosomes | Rod-shaped or elliptical, 200-600 nm, single membrane granules. | Melanoma, melanocytic schwannoma. |
| Melanosome, compound | Aggregates of melanomes within secondary lysosomes. Variable stages of digestion. | Keratinocytes, macrophages, fibroblasts. |
| Microtubules | Long, cytoplasmic, 25-nm diameter tubules. | Abundant in neuronal and neuroendocrine tumors. |
| Mitochondria | Rounded, ovoid, rod-shaped, elongated, branched, annular (1000-nm width). Two limiting membranes and intermediate clear space. Cristae represent infoldings of inner membrane. Tubular or tubulovesicular cristae in cells with lipid and SER indicate steroidogenic phenotype (liver, adrenal cortex, Leydig, and ovarian cells). | Abundant in oncocytomas, hepatocellular tumors, renal cell carcinoma, steroid and muscle tumors. |
| Mucin granules | Single limiting membrane granules with flocculent, filamentous, reticulate, or homogeneous matrix with no halo. | Mucinous carcinomas. |
| Neuroendocrine granules | Location: below plasma membrane, within basal cytoplasm and cell processes. | Neuroendocrine, paraneuronal, neuronal tumors |
| Size: Typical 200-400 nm, with range from 60 to 1000 nm. | ||
| Center: very dense matrix (core) separated from the membrane by clear halo. | ||
| Small granules (80-150 nm). | Retinoblastoma, neuroblastoma, Merkel cell tumor | |
| Large granules (1000 nm). | Pituitary gland tumors | |
| Norepinephrine granules: eccentric cores. | Pheochromocytomas, paragangliomas | |
| Biphasic (rounded and rod-shaped profile) granules. | Abdominal and urogenital neuroendocrine tumors | |
| Crystal-like granules and sometimes multiple cores. | Insulinoma | |
| Nucleus | Nuclear irregularities are common in neoplastic cells. Artifact of sectioning with contained portions of cytoplasm (pseudoinclusions or nuclear pockets). | Multiple tumor types. Nonspecific feature Osteoclast-like giant cell tumors |
| Multilobation: multiple nuclear profiles connected by thin bridges. Multinuclearity: nuclear profiles not joined. |
Myeloid leukemia, large B-cell lymphoma | |
| Primary lysosomes | Small (100-300 nm), rounded, or oval, single-membrane–bound granules. Dense, homogeneous, granular matrix. Crystalline core in eosinophil granules. | Myeloid sarcomas, histiocytic sarcomas, follicular thyroid carcinoma. Endocrine and steroidogenic tumors, granular cell tumors |
| RER | Common; active protein synthesis (immunoglobulins, matrix, neuroendocrine, lysosomes). | Fibrosarcoma, plasmacytoma, osteosarcoma |
| SER | Common in cells rich in lipid, glycogen, or steroid metabolism. | Sex cord-stromal tumors, hepatocellular tumors |
| Secondary lysosomes | Variably sized, single-membrane–bound organelles with remnants of digested material. | Granular cell tumor. Myeloid leukemias, histiocytic sarcoma, prostatic and neuroendocrine tumors |
| Serous/zymogen granules | Large (up to 1000 nm), single membrane–bound with a dense to pale matrix and no halo. | Serous carcinomas (e.g., salivary, pancreatic) |
| Synaptic vesicles | 40- to 80-nm, membrane-bound structures with clear interior. | Differentiated neuronal tumors |
RER, rough endoplasmic reticulum; SER, smooth endoplasmic reticulum.
Table 17-4.
Common Ultrastructural Features of Tumors
| Tumor Type | Cellular Features | Extracellular Matrix |
|---|---|---|
| Adenocarcinoma | Microvilli. Lumens. Junctional complexes. Secretory granules. Golgi apparatus. Endoplasmic reticulum. Cilia (+/-). | Basal lamina |
| Carcinoid/islet cell tumors | Insular arrangement of cells. Intercellular junctions (e.g., desmosomes). Numerous dense-core granules (variable size and morphology depending of tumor type). Variable intermediate filaments. | Basal lamina surrounding cell clusters Collagen |
| C-cell carcinoma of thyroid | Dense-core granules. Variable number of organelles (Golgi apparatus, RER, mitochondria). | Basal lamina surrounding cell clusters Collagen |
| Chondrosarcoma | Scalloped or villous-like cell surface. Abundant and dilated RER. Large Golgi apparatus. Abundant glycogen. Variable intermediate filaments. | Variable. Collagen, glycoprotein, glycosaminoglycans |
| Fibrosarcoma | Abundant rough endoplasmic reticulum. Cytoplasmic filaments. Golgi apparatus. Filopodia (+/-). | No basal lamina. Abundant collagen |
| Gastrointestinal stromal tumor | Lack of distinct nuclear/cytoplasmic features or morphology similar to smooth, fibroblastic or nerve cells. | Basal lamina (+/-). Collagen |
| Glomus tumor | Epithelioid cells. Many mitochondria. Thin filaments. Dense bodies. Pinocytotic vesicles. | Basal lamina. Collagen |
| Granular cell tumor | Tightly apposed cells. Numerous cytoplasmic, membrane-bound, variable electron-dense granules (secondary lysosomes). | Basal lamina around groups of cells |
| Hemangiopericytoma | Palisading arrangement around capillaries. Focal attachments and intercellular junctions. Pinocytotic vesicles. Intermediate filaments. Variable number of mitochondria, RER. | Abundant basal lamina and matrix |
| Hemangiosarcoma | Prominent junctional complexes. Villous-like projections on the luminal aspect. Pinocytotic vesicles. Intermediate cytoplasmic filaments. Free ribosomes. Some mitochondria and RER. | Basal lamina |
| Histiocytic sarcoma | Variably sized and shaped nuclei. Numerous cytoplasmic organelles (lysosomes, mitochondria, Golgi apparatus, lipid droplets [+/-]). Phagocytosed red blood cells or leukocytes (+/-). | No basal lamina |
| Langerhans histiocytosis | Large, irregularly shaped nucleus. Numerous organelles (mitochondria, free ribosomes, rough endoplasmic reticulum, primary lysosomes). Filopodia. Absence of secondary lysosomes. | No basal lamina |
| Leiomyosarcoma | Thin (6-nm) filaments and dense bodies among filaments within cytoplasm and subjacent to plasmalemma. Pinocytotic vesicles. Little RER. Round-ended nuclei. Contraction indentations of nuclei. | Basal lamina |
| Leydig cell tumor | Lipid droplets. Abundant SER. Mitochondria with tubular cristae. Microvilli on cell surface. Canalicular-like spaces between cells. | Partial basal lamina |
| Liposarcoma | Lipid droplets. Pinocytotic vesicles. Glycogen (+/-). Intermediate filaments. Mitochondria (+/-), Golgi apparatus (+/-), SER and RER (+/-). | Basal lamina |
| Lymphoma | Many free ribosomes or polyribosomes. No intercellular junctions. Smooth, indented, or convoluted nuclear membrane. | No basal lamina |
| Mast cell tumor | Round, indented nucleus. Numerous membrane-bound cytoplasmic granules of variable density. Filopodia. | No basal lamina. Collagen |
| Meningioma | Long, interdigitating cellular processes. Numerous intermediate filaments. Numerous intercellular junctions (e.g., desmosomes). Variable number of organelles. Glycogen (+/-). | Basal lamina (- /+) |
| Mesothelioma | Numerous long microvilli. Intercellular junctions. Filaments. Tonofibrils. Glycogen. Intracytoplasmic lumens. Lack of mucinous granules and glycocalyx. | Basal lamina |
| Myofibroblastic sarcoma | Spindle shape. Prominent RER. Some thin (6-nm) and peripherally located filaments with focal densities. Fibronexus junction (+/-). | No basal lamina. Abundant matrix with collagen, proteoglycans, and glycosaminoglycans. Fibronectin |
| Osteosarcoma | Scalloped or villous-like cell surface. Abundant and dilated RER. Large Golgi apparatus. Abundant glycogen. | Hydroxyapatite deposits on collagen fibers (osteoid) (+/-) |
| Paraganglioma | Clusters of cells. Round, dense-core granules. Prominent Golgi apparatus. Interweaving cytoplasmic processes. Paranuclear filaments (+/-). Sustentacular (Schwann-like) cells with filaments at the periphery of cell clusters. | Basal lamina surrounding cell clusters |
| Parathyroid carcinoma | Islands of cells. Intercellular junctions. Interdigitation of lateral membranes. Dense-core secretory granules. Variable glycogen and cell organelles (RER, SLE, mitochondria, Golgi). Occasional clusters of oncocytic cells. | Basal lamina surrounding cell clusters |
| Perineuroma | Whorls of slender cells with bipolar cytoplasmic processes. Pinocytotic vesicles. Scant organelles. | Discontinuous basal lamina. Collagen |
| Pheochromocytoma | Clusters of polygonal cells. Large, pleomorphic, dense-core granules (sometimes clear or partially filled). Prominent Golgi apparatus. No significant number of sustentacular cells. | Basal lamina surrounding cell clusters Many small blood vessels |
| Plasmacytoma | Abundant rough endoplasmic reticulum. Membrane-bound dense bodies (+/-). Intercellular junctions (+/-). Eccentric nucleus. Paranuclear area with Golgi apparatus, centriole, mitochondria. | No basal lamina. Amyloid (+/-) |
| Rhabdomyosarcoma | Thick (15-nm) myosin filaments. Z-band formations. Sarcomeres. Thin (6-nm) filaments. Glycogen. Mitochondria (+/-). | Incomplete basal lamina. Collagen |
| Schwannoma | Long intertwining processes. Variable number of mitochondria, RER, lysosomes. Intermediate filaments. | Basal lamina. Collagen in matrix |
| Seminoma | Close, appositioned, round to polygonal cells. Intercellular junctions. Large, euchromatic nucleus. Prominent nucleoli. Abundant glycogen. Variable number of organelles; mainly free ribosomes. | Basal lamina (+/-) |
| Sertoli cell tumor | Polygonal cells. Intercellular junctions. Indented nuclei. Junctional complexes. Interdigitating lateral cell membranes. Abundant SER. Lipid droplets. Mitochondria with tubular cristae. Secondary lysosomes. | Basal lamina. Collagenous matrix |
| Squamous cell carcinoma | Desmosomes. Keratohyalin granules. Tonofibrils. | Basal lamina |
(+/-) = Feature not present in all tumors or cells; (-/+) = Feature rarely observed.
There are excellent atlases on ultrastructural pathology (Dickersin, 2000, Dvorak and Monahan-Earley, 1992, Erlandson, 1994, Eyden, 1996, Ghadially, 1998).
KEY POINT A sequential (orderly) approach to the ultrastructural study of tumors involves the following: topographic cellular relationships, external lamina, cell contours, intercellular junctions; cytoplasmic granules, filaments, vacuoles, and vesicles; type and distribution of organelles; nuclear and nucleolar morphology; and stroma.
Special Histochemical Stains
The term “special stains” groups most of the histochemical stains used in histopathology and arbitrarily separates them from the standard hematoxylin-eosin. Special stains have been and still are important techniques in the characterization of numerous lesions and tissues. Before the advent of IHC and molecular techniques, special stains were the main tool to characterize lesions beyond HE stain. The majority of laboratories are capable of doing special stains with the same equipment available for routine histopathology.
Advantages of Special Stains
-
•
They are easy and usually quick to produce.
-
•
Most have standard and very reproducible protocols.
-
•
Currently, numerous special stains can be purchased as kits and used in automatic stainers.
-
•
They have been extensively validated, and numerous variations to original protocols have been produced to improve their quality.
-
•
They are fairly inexpensive.
-
•
They detect substances to which there are no commercial antibodies to be detected by IHC.
Disadvantages of Special Stains
-
•
Some stains are somewhat unpredictable.
-
•
Due to the nature of the histochemical reaction, large chemical groups rather than a small number of amino acids encompassing an epitope of an antigen (IHC) or short sequences of nucleic acids (molecular techniques) are detected; in other words, they are less specific than IHC or molecular techniques.
Staining Principles
Numerous factors contribute to dye-tissue affinities: 1) solvent-solvent interactions (e.g., hydrophobic bonding between enzymes and their substrates); 2) stain-stain interactions (e.g., metachromatic staining with basic dyes, silver impregnation); and 3) reagent-tissue interactions of Coulombic attractions (e.g., acid and basic dyes), Van der Waals forces (e.g., detection of large molecules such as elastic fibers), hydrogen bonding (e.g., staining of polysaccharides by carminic acid from nonaqueous solutions), or covalent bonding (e.g., nuclear detection by the Feulgen reaction, PAS stain) (Horobin, 2013).
Special stains are used mainly to demonstrate specific chemical groups characteristic of a substance (e.g., glycogen, myelin) (Fig.17-10 and Table 17-5 ) and to demonstrate the general morphology of microorganisms (e.g., fungi, bacteria) (McGavin, 2014) (Fig. 17-11 and Table 17-6 ). There are excellent books regarding special stains and other aspects of histotechnology (Carson, 1997, Prophet, 1992, Suvarna et al., 2013).
Figure 17-10.

A–D, Detection of granules and pigments by special histochemical stains.
A, Giemsa stain. Mast cell tumor. Skin. Dog. Cells are filled with numerous dense metachromatic granules (purple) characteristic of mast cells. B, Hall stain. Liver. Dog. The green pigment present within bile canaliculi (short arrows) and Kupffer cells (arrowheads) is bile. Hemosiderin (long arrow) is not stained but apparent due to its refractile nature. Hepatocytes (h) are noted. C, Rubeanic acid stain. Liver. Dog. This stain reveals copper granules (arrowheads) within hepatocytes (h). Kupffer cells with hemosiderin granules (arrows) are shown. D, Perl stain for iron. Liver. Dog. Iron pigment appears blue within hepatocytes. The portal area (p) is shown.
Table 17-5.
Special Histochemical Stains for Intracellular and Extracellular Substances
| Stain | Substance or Structure | Color |
|---|---|---|
| Acid phosphatase | Prostate | Black |
| Alcian blue | Sialomucins, hyaluronic acid, sulfated mucosubstances | Blue |
| Alizarin red S | Calcium | Orange-red |
| Best carmine | Glycogen | Deep red |
| Bielschowsky silver stain | Axons | Black |
| Congo red | Amyloid | Orange-red∗ |
| Cresyl violet | Nissl substance | Violet |
| Dunn-Thompson | Hemoglobin | Emerald green |
| Feulgen | DNA | Red-purple |
| Fontana-Masson | Melanin | Black |
| Gordon and Sweets reticulin fiber | Reticulin fibers | Black |
| Grimelius | Argyrophilic granules | Black |
| Hall | Bile/biliverdin | Green |
| Jone methenamine | Basement membranes | Black |
| Kinyoun (modified Ziehl-Neelsen) | Lipofuscin | Red |
| Luxol fast blue | Myelin | Blue |
| Mallory PTAH | Muscle, fibrin, glial processes | Dark blue |
| Masson trichrome | Muscle, collagen | Muscle: Red Collagen: Blue |
| Mayer mucicarmine | Mucin, hyaluronic acid, chondroitin sulfate | Rose to red |
| Methyl green pyronin | Nucleic acids | DNA: Green-blue RNA: Red |
| Oil red O | Fat | Orange–bright red |
| Periodic acid-Schiff (PAS) | Glycogen, mucin | Red |
| Prussian blue | Iron | Blue |
| Rhodanine | Copper | Red |
| Rubeanic acid | Copper | Green-black |
| Schmorl reaction | Melanin, lipofuscin | Dark blue |
| Sudan black B | Fat | Black |
| Toluidine blue | Mast cells | Purple |
| Verhoeff | Elastic fibers | Black |
| Von Kossa | Calcium | Black |
Apple-green birefringence with polarized light.
Figure 17-11.
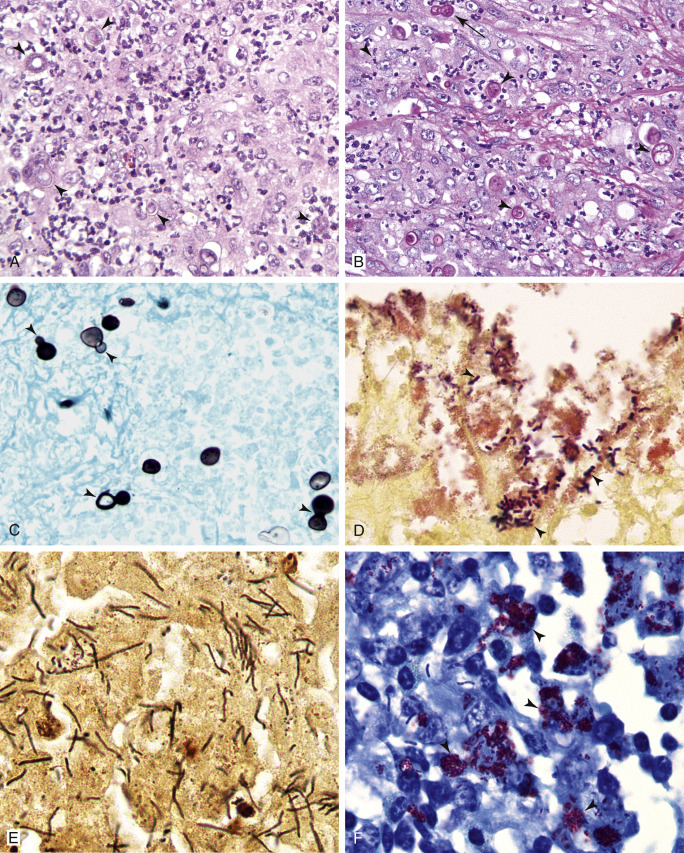
A–F, Detection of microorganisms by special histochemical stains. Pyogranulomatous dermatitis. Skin. Dog. Blastomycosis.
Same case A-C. A, With routine hematoxylin-eosin stain, cellular detail of the inflammatory reaction is excellent but detection of yeasts (arrowheads) is difficult. B, PAS stain improves the detection of yeasts due to staining cell walls magenta (arrowheads). Note the broad-based budding formation (arrow). C, Grocott methenamine silver stain demonstrates excellent yeast morphology, but detail of the inflammatory process is poor. Numerous broad-based budding yeasts are observed (arrowheads). D, Canine intestine with Gram stain depicts many gram-positive bacterial rods (arrowheads). E, Warthin-Starry stain. Liver. Horse. Clostridium piliformis. This staining method is excellent to detect microorganisms due to the high contrast with the background. F, Ziehl-Neelsen stain. Skin. Dog. Mycobacterial dermatitis. Acid-fast organisms (arrowheads) are strongly stained bright red. Note the presence of unstained bacilli.
Table 17-6.
Special Histochemical Stains for Microorganisms
| Stain | Microorganism |
|---|---|
| Giemsa | Metachromatic granules; good stain for protozoa and some bacteria |
| Gram | Standard staining for bacteria |
| Grocott methenamine silver | Fungi, oomycetes, Pneumocystis |
| Jimenez | Chlamydiae |
| Macchiavello | Chlamydiae |
| Mucicarmine | Capsule of Cryptococcus |
| Periodic acid-Schiff | Fungi |
| Steiner and Steiner silver | Numerous bacteria, including Helicobacter (good contrast between the black staining of the bacteria and the background) |
| Toluidine blue | Metachromatic granules |
| Wade-Fite | Acid-fast bacteria, including mycobacteria, Nocardia |
| Warthin-Starry | Similar uses to Steiner stain |
| Ziehl-Neelsen | Acid-fast bacteria; Nocardia is difficult to detect |
Flow Cytometry
While cytomorphology alone is often sufficient for cell identification, in many instances more objective or detailed identification is needed to provide diagnostic or prognostic information. Flow cytometry is a valuable and readily available tool that allows the analysis of individual cells as they pass in front of a laser as a single cell suspension. The light absorbance and scatter properties of the cells can provide information about cell size and internal complexity/granularity, respectively, and the use of specific antibodies allows the quantification of both intracellular and surface-expressed components. The most widely used clinical application involves incubating cells with fluorescently labeled antibodies directed at surface antigens to determine the frequency of cells that express the given molecule as well as the relative expression levels on individual cells. Since antibodies can be labeled with a variety of fluorochromes that have different excitation and emission wavelengths, the expression of several surface molecules can be detected simultaneously. The major advantage of flow cytometry is that it allows the rapid and objective identification of large numbers of cells. Clinically, it is most commonly used for the analysis of hematopoietic cells in order to characterize lymphoma and various forms of leukemia and quantify cells in cases of suspected immunologic disorders.
The information provided in this chapter focuses on methods of cell preparation, antibodies, and data analysis for veterinary species. “Practical Flow Cytometry” by Howard Shapiro is an extremely thorough text to which all readers should turn for detailed information about virtually any aspect of flow cytometry—methodology, instrumentation, and data analysis. This book has been made available at no charge by Beckman Coulter and can be accessed through their website www.beckmancoulter.com.
Methodology
Sample Collection
To analyze a sample with flow cytometry, the cells must be in suspension and free of any clumping or debris. Anticoagulated whole blood or cavity effusions can generally be submitted directly to a flow cytometry facility for analysis. Aspirates from solid tissue can be resuspended in media with serum. In university or laboratory settings, tissue culture media such as RPMI or DMEM, buffered with HEPES and supplemented with 5% to 10% fetal bovine serum is ideal. However, in the clinic setting, 0.9% saline can be used and 10% serum from the patient, or another animal of the same species, can be added. Because a minimum of 10,000 cells are needed for each antibody combination, several tissue aspirates are needed for a complete analysis. One way to ensure a good yield of cells is to squirt the aspirate into the saline/serum suspension and rinse the hub of the needle in the suspension. The suspension fluid should appear slightly cloudy for best cell yield rather than clear. If samples are to be shipped, they must be shipped overnight with a cold pack. Cian et al. (2014) determined some benefit in using Cyto-Chex BCT tubes (Streck, Omaha, Nebraska, United States) for cell stabilization of whole blood for immunophenotyping when shipping specimens to remote laboratories. However, CD45 and CD3 expression in normal dog blood was significantly decreased after 3 days.
Laboratory Preparation of Sample
The preparation of cells for flow cytometry varies widely between laboratories (Gelain et al., 2008, Lana et al., 2006a, Vernau and Moore, 1999, Villiers et al., 2006), and there is no consensus about the best method. Most commonly, the first step in cell preparation is to remove the red blood cells by lysis in a hypotonic solution. An alternative method is to prepare the cells by differential density centrifugation through a solution such as Histopaque. Neutrophils, red blood cells, and platelets will pass through the solution, whereas mononuclear cells will remain on top of the Histopaque layer. While this technique concentrates the mononuclear cells considerably, it is possible that cells of interest may pass through the density gradient and be lost from the analysis. Therefore, this method is not recommended for diagnostic assays.
For analysis of antigens expressed on the cell surface, such as CD4 and CD8, cells are incubated with antibodies to cell surface markers in a buffer such as phosphate-buffered saline with added protein (bovine serum albumin or fetal bovine serum). Primary antibodies are either unlabeled or have been directly conjugated to fluorescent molecules. Directly conjugated antibodies can be visualized immediately after staining, and they greatly facilitate the use of multiple markers simultaneously. Cells stained with unlabeled antibodies must be subjected to a second staining reaction using fluorescent-labeled antibody that recognizes immunoglobulin of the species of the primary antibody (e.g., goat anti-mouse IgG). In general, only a single unconjugated antibody can be used in a staining reaction, preventing the simultaneous quantification of multiple markers on individual cells. It is important to include control reactions for each sample. Controls consist of cells left unstained and cells stained with an antibody of the same isotype that should not specifically bind to any antigens on the cells of interest. The unstained cells enable the operator to correct for autofluorescence, and the fluorescent intensity of the irrelevant antibody reaction can be used to determine the level of background staining.
Laboratories use a variety of different antibodies in different combinations for immunophenotyping. Table 17-7 lists a suggested minimal panel for analysis of suspected lymphoma and various leukemias in dogs and cats, but most laboratories use additional antibodies, chosen based on the experience and training of the personnel (Burkhard and Bienzle, 2013). The largest supplier of directly conjugated antibodies for use in routine veterinary flow cytometry is AbD Serotec (www.ab-direct.com), and the majority of clones listed in Table 17-7 are available through this company. Other suppliers, such as R&D Systems (www.rndsystems.com), B-D Biosciences (www.bdbiosciences.com), and Southern Biotech (www.southernbiotech.com, cats only) have fewer antibodies. See Table 17-1 for suppliers of specific antibodies used in IHC and ICC.
Table 17-7.
Antibody Panels for Characterization of Canine and Feline Leukocytes by Flow Cytometry†
| Cell Type | Antigen | Clone(S) | Species Antibody Produced Against |
|---|---|---|---|
| Dogs | |||
| T-cells | CD3 | CA17.2A12 | Dog |
| T-cell subset/neutrophils | CD4 | YKIX302.9/CA13.1E4 | Dog |
| T-cells | CD5 | YKIX322.3 | Dog |
| T-cell subset | CD8α | YCATE55.9/CA9.JD3 | Dog |
| Monocytes/neutrophils | CD14 | TUK4/UCHM1 | Human |
| B-cells | CD21 | CA2.1D6/LB21 | Dog/human |
| Precursors | CD34 | 1H6 | Dog |
| All leukocytes | CD45 | YKIX716.13/CA12.10C12 | Dog |
| Cats | |||
| T-cell subset | CD4 | Vpg39 | Cat |
| T-cells | CD5 | FE1.1B11 | Cat |
| T-cell subset | CD8α/β | Vpg9 | Cat |
| Monocytes | CD14 | TUK4∗ | Cat |
| B-cells | CD21 | CA2.1D6/LB21 | Dog/human |
TUK4 does not appear to stain neutrophils but UCHM1 does.
Panels used at Colorado State University (Avery Lab).
The cells are washed after the final staining reaction and then can either be fixed in paraformaldehyde for later analysis or analyzed immediately without fixation. If cells are analyzed immediately, they can be additionally stained with a number of different dyes that will determine the viability of the cells. This technique is extremely useful because dead cells tend to bind antibodies nonspecifically. In addition, cell death changes the size and scatter properties of cells and there are at least two studies demonstrating that size is prognostic in cases of B-cell leukemia (Williams et al., 2008) and B-cell lymphoma (Rao et al., 2011).
In addition to surface molecules, several useful antigens are located within the cytoplasm. For example, most human T-cell acute lymphoblastic leukemias (ALL) lack surface expression of CD3 but have cytoplasmic expression of CD3 (Szczepanski et al., 2006). The CD3 reagent commonly used for IHC in dogs can also be used for flow cytometry (Wilkerson et al., 2005) and could be included in a panel used to phenotype acute leukemia. The monocyte/granulocyte lineage markers myeloperoxidase (MPO) and MAC387 (calprotectin) are also cytoplasmic and can be useful for analyzing acute myeloid leukemia (AML) (Villiers et al., 2006). Similarly, Pax5 and CD79a, B-cell lineage antigens, can be used to establish a B-cell origin neoplasm when B-cell antigens are not expressed on the cell surface. In order to expose these cytoplasmic and nuclear molecules, cell membranes must be permeabilized before staining. There are several commercial kits for accomplishing this (such as Fix & Perm from Life Technologies).
Flow Cytometers
The two largest and longest operating manufacturers of flow cytometers are Beckman Coulter and BD Biosciences. Each of these companies manufactures flow cytometers that range from small instruments designed for use in individual laboratories with minimal automation to large automated analyzers. More recently, additional manufacturers have entered the market (Guava, Partec).
Flow cytometers are highly complex instruments which record information about each individual cell in your cell suspension. To accomplish this, cells are focused in a fluid stream that passes in front of one or more lasers. The way that the cell scatters light is recorded by detectors, as is the level of fluorescence exhibited by each cell, which in turns reflects the level of antigen expression for the antigen detected by the fluorescent-labeled antibody. Readers are strongly encouraged to refer to “Practical Flow Cytometry” by Howard Shapiro to gain a better understanding of the instrumentation (see www.beckmancoulter.com)
Data Analysis
The most important aspect of flow cytometry is data analysis, which begins with the examination of the light scatter properties of the cells. As cells pass in front of the laser, they scatter the light, and detectors record the amount of forward- and side-scattered light. The total amount of forward-scattered light detected depends on cell surface area or size, whereas the amount of side-scattered light indicates cellular complexity or granularity. Fig. 17-12 demonstrates a typical scatter plot from canine peripheral blood, where each dot represents an individual cell placed relative to the amount of forward and side scatter recorded as it passes in front of the laser. Light scatter properties allow the identification of lymphocyte, monocyte, and neutrophil populations.
Figure 17-12.
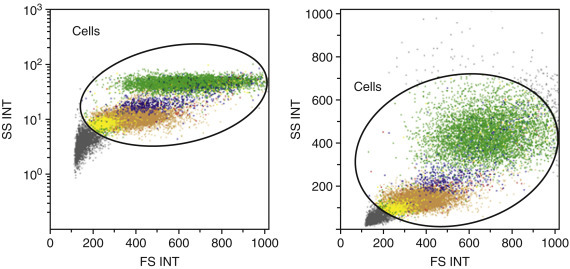
Light scatter properties of canine peripheral blood by flow cytometry.
Forward (x axis) and side scatter (y axis) of peripheral blood showing individual neutrophils (green), monocytes (blue), and lymphocytes (yellow and beige). These two plots represent the same sample graphed using the log value of the side scatter (left panel) and the linear value (right panel). Either method can be used. Forward scatter is roughly equivalent to size or surface area, whereas side scatter indicates cytoplasmic complexity.
Although there is no consensus on analysis methods in veterinary medicine, in general the first step of an analysis is to “gate” different populations of cells based on their scatter properties. As shown in Fig. 17-12, lymphocytes have lower forward and side scatter, whereas neutrophils have higher forward and side scatter, with monocytes falling in between.
The next step is to determine the percentage of cells within each population that expresses the markers of interest by looking at the fluorescence profile of each population. The fluorochromes used to label antibodies are excited by the laser and emit light over a narrow range of wavelengths, which can be detected by the flow cytometer. Different fluorochromes have distinct peak emission wavelengths, so antibodies conjugated to several different fluorochromes can be used simultaneously in one staining reaction. The amount of fluorescent signal detected is proportional to the number of fluorochrome molecules on the cell. The data can then be displayed as a single parameter in the form of a histogram or two parameters displayed simultaneously as a dot plot (Fig. 17-13 ). Two-parameter dot plots allow individual events/cells to be displayed so that the relative fluorescence for two individual markers can be examined simultaneously.
Figure 17-13.
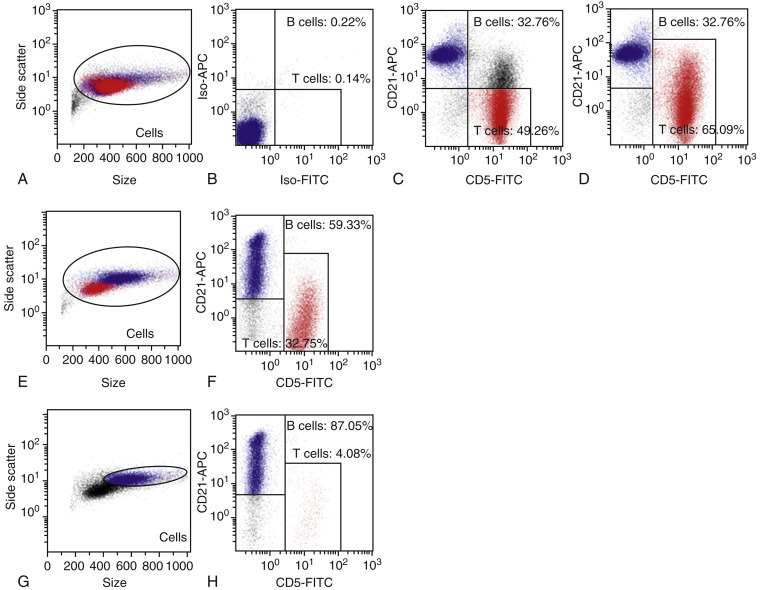
Examining cell surface proteins by flow cytometry.
A, Forward and side scatter histogram of cells from a reactive lymph node. B, The two axes in this panel show the staining with isotype control antibodies – antibodies that should not bind specifically to canine lymphocytes but are conjugated with the fluorochromes used for specific staining. “APC” is the dye allophycocyanin, and “FITC” is fluorescein isothiocyanate. Two rectangular gates are drawn so that less than 1% of the cells fall within either gate (four quadrants could also be used instead of rectangular gates). C, Specific staining for CD5 (T-cell antigen) and CD21 (B-cell antigen) is shown in this panel with the gates drawn as guided by the isotype controls. It is clear, however, that a population of the CD5+ cells is co-expressing CD21, so the gate is adjusted (D) to reflect the true T-cell population. The percent age of T-cells in this sample was further verified as being 65% using an anti-CD3 antibody. E-G, Gating a population of interest. E, Forward and side scatter properties of a lymph node from a dog with B-cell lymphoma. Unlike the reactive node, two discrete cell populations are evident. F, B- and T-cell populations are identified and electronically colored so that the cells expressing CD21 are blue and those expressing CD5 are red. Using this back-gating technique, the large cells appear to be almost exclusively B-cells. This is confirmed when only the large cells are examined (G). Within the large cell population, almost 90% of the cells are B-cells (H), a finding that can be considered diagnostic for B-cell lymphoma.
Electronic gating of different populations allows the user to determine the percentage of cells in each population that are positive for a given molecule (Fig. 17-13). The percentage of positive cells is usually determined by first analyzing the isotype control and setting gates based on this control. The percentage of positive cells is determined by the number of cells that fall above the gate set by the negative control (Fig. 17-13). While the isotype control is used as a guideline, it is generally accepted that there is some flexibility in the placement of gates to include logical populations of cells. For example, in Fig. 17-13, there are two discrete populations of cells corresponding to B- and T-cells, but it is clear that there is a population of T-cells that co-expresses the B-cell antigen CD21. Therefore, the gates were redrawn to reflect this observation, resulting in a more accurate T-cell count.
Electronic gating can also allow the user to focus on a particular population of interest. Fig. 17-13 shows a lymph node from a dog with B-cell lymphoma. When the whole node is analyzed, it appears that 59% of the cells are B-cells. More importantly, however, it is clear that the B-cells fall almost exclusively into a discrete population of large cells. When these cells are specifically examined, almost 90% are B-cells. Such a homogeneous expansion of large cells can be considered diagnostic for B-cell lymphoma. It should be noted that while the diagnosis in this case is unambiguous, consistent guidelines have not yet been established in the literature making a definitive diagnosis of neoplasia. Thus, this technique retains some subjectivity in data interpretation.
Reporting Flow Cytometry Data
All laboratories report flow cytometry data differently. In peripheral blood analysis, the most useful information is the absolute number of a lymphocyte subset in peripheral blood per microliter. When only percentages are reported, it may be difficult to distinguish loss of one population from expansion of another population. Although normal values have been published (Byrne et al., 2000), preparation methods differ so widely between laboratories that each lab should generate their own normal values.
For other samples, percentages of lymphocyte subsets are reported usually after gating on the relevant population by size. For example, in lymph node aspirates from dogs with lymphoma, the neoplastic lymphocytes are usually large (Fig. 17-13). Therefore, the percentage of each lymphocyte subset will be determined after gating on the large cells. In addition to the percentage of cells expressing different markers, cells with an abnormal phenotype, such as loss of an antigen or aberrant expression of an antigen, should also be described or quantified. Thus, flow cytometry reports from most laboratories contain a mixture of objective data (the total number or percentage of cells expressing various antigens) and subjective assessment of that data. Because flow cytometry analysis and reporting has not yet been standardized, it is important that sequential analysis of samples from a single patient be performed by the same laboratory.
Uses for Flow Cytometry
Reactive vs. Neoplastic Lymphocytosis
A lymphoproliferative disorder can often be diagnosed based on the cytologic appearance of the cells, if those cells exhibit clear criteria of malignancy. Furthermore, in cases where the lymphocytes exhibit a mature phenotype but the lymphocyte count is greater than 30,000 cells/μL, the diagnosis of a lymphoproliferative disorder can be made with certainty, because survival is significantly different from cases with lower counts (Williams et al., 2008).
When a dog has lymphocytosis of less than 30,000 cells/μL composed of small mature lymphocytes and no other clinical signs that would point to a diagnosis, flow cytometry can be used to distinguish chronic lymphocytic leukemia from nonneoplastic causes of lymphocytosis. As a rule of thumb, expansion of a single lymphocyte subtype (CD4 T-cells, CD8 T-cells, or B-cells) would be considered most consistent with neoplasia (except for Ehrlichia canis infection as noted below). However, veterinary pathologists and clinical pathologists have not yet come to agreement about the criteria for making this diagnosis. For example, canine peripheral blood typically has 300 B-cells/μL. Would a B-cell count of 3000 cells/μL in the context of a total lymphocyte count of 6000 cells/μL be considered diagnostic for B-cell lymphoma/leukemia? Most likely the answer is yes, but definitive studies confirming this assumption with clinical follow-up and PARR assays are lacking.
In addition to homogeneous expansion of a single lymphocyte subset, the presence of cells with aberrant antigen expression (i.e., loss of expression of antigens that should be found on normal lymphocytes, or expression of antigens not found on normal lymphocytes) can be considered diagnostic for malignancy (Gelain et al., 2008). For example, Martini et al (2013) and Seelig et al (2014) reported that the loss of CD45 expression is a consistent feature of small clear cell, or T zone, lymphoma. Even in the absence of a significantly expanded uniform population of lymphocytes, the presence of a small number of aberrant cells can point to neoplasia. Similarly, normal peripheral blood contains virtually no cells expressing the stem cell antigen CD34. The finding of even a minor population of CD34+ cells in peripheral blood points to a diagnosis of acute leukemia.
Other, less common differentials for small, mature lymphocytosis in dogs include Addison disease, thymoma, and Ehrlichia canis infection. Addison disease usually involves expansions of B-cells, CD4 T-cells, and CD8 T-cells (unpublished observations). When cases of thymoma involve lymphocytosis, the lymphocytosis is usually characterized by expansion of CD4 T-cells, CD8 T-cells, and sometimes T-cells that express neither cell surface protein (Batlivala et al., 2010). Ehrlichia canis, on the other hand, almost exclusively causes the expansion of CD8 T-cells that are described as having granules in their cytoplasm (Heeb et al., 2003, McDonough and Moore, 2000, Weiser et al., 1991). These CD8 T-cells do not exhibit aberrant antigen expression, an observation that can help distinguish them from neoplastic T-cells, which can exhibit loss or gain of a variety of T-cell-associated antigens.
Prognostic Significance of Immunophenotype
Lymphoma
Studies of canine multicentric lymphoma have consistently demonstrated that immunophenotype (B versus T) provides prognostically useful information in conjunction with clinical stage (Ruslander et al., 1997, Teske et al., 1994). T-cell lymphomas typically have a worse prognosis than B-cell lymphomas especially in extranodal sites such as skin or liver. It is important to note, however, that there are histologic subtypes of T-cell lymphoma that have a good prognosis, and histologic subtypes of B-cell lymphoma that have a poor prognosis (Ponce et al., 2004, Valli et al., 2006). In human medicine, surface markers have been identified to help distinguish between some histologic subtypes of lymphoma via flow cytometry. Avery et al (2014) have shown that CD4+, CD45+ T-cell lymphomas that express low levels of class II MHC demonstrated a uniformly poor prognosis. A different T-cell disorder, T zone lymphoma, can also be definitively diagnosed by flow cytometry (Seelig et al., 2014). T zone lymphoma, unlike lymphoblastic T-cell lymphoma, is an indolent disorder, with very long median survival (Flood-Knapik et al., 2013). Thus, simply distinguishing B-from T-cell lymphoma gives only an incomplete prognostic picture. Other testing, such as flow cytometry or histopathology assessed by an experienced hematopathologist, is important for providing accurate prognostic information.
Peripheral Lymphocytosis
The question of how to classify leukemia remains unresolved in veterinary medicine. In people, a disease characterized by circulating small mature B lymphocytes is called chronic lymphocytic leukemia/small cell lymphoma (CLL/SCL) – it is not relevant clinically or prognostically to distinguish leukemia from lymphoma. One group of pathologists adopted this convention for lymphoproliferative disease of mature B-cells in their study (Vezzali et al., 2010). Forty percent of dogs with small B-cell expansion also have lymphadenopathy (Williams et al., 2008). As a group, these cases have a median survival of greater than 1000 days and behave like CLL, but it is not clear if all these cases can be classified as CLL/SCL because the lymph nodes are often not biopsied.
Canine T-cell CLL involves the expansion of mature T-cells, which are more common than B-cell CLL in dogs (Workman and Vernau, 2003). A subset of these cases has a consistent, unique phenotype in that they have lost expression of the pan-leukocyte antigen CD45 as noted above. The subset phenotype varies, and can be CD4, CD8, or a T-cell that expresses neither, but regardless of the T-cell subset, this disease is characterized by an indolent clinical course (Seelig et al., 2014). If lymphadenopathy is present in these patients, the histologic diagnosis in these cases is T zone lymphoma, a disease with a median survival of 33 months (Flood-Knapik et al., 2013).
Lymphocytosis composed of small mature T-cells is not confined to the T zone phenotype. CD8 T-cell lymphocytosis is common, and when the presenting lymphocyte count is less than 30,000 cells/μL, the disease behaves like a chronic lymphocytic leukemia (Williams et al., 2008). Lymphocytosis involving CD4 T-cells is uncommon, but these diseases can also, in some cases, exhibit an indolent course.
Very little is known about leukemia in cats, but one study demonstrated that the most common form of feline chronic lymphocytic leukemia is CD4+, and has a median survival of 15 months (Campbell et al., 2012). A more aggressive form of leukemia is associated with intestinal lymphoma. This disease is most commonly CD8+ and the cells are described as LGLs (large granular lymphocytes). Maximum survival in these cases was 84 days (Roccabianca et al., 2006).
Classification of Acute Leukemia
Acute leukemia, diagnosed by cellular morphology, has long been known to have a poor prognosis. The use of anti–canine CD34, a marker generally found on precursor lymphocytes, is useful in objectively identifying cases of acute leukemia. CD34 is most likely expressed on both ALL and AML (Workman and Vernau, 2003, Villiers et al., 2006), but there are presently no published studies examining the distribution of CD34 on different leukemic subtypes. In addition, because the traditional classification scheme for acute leukemia has relied on cellular morphology alone, the correlation between blast morphology and CD34 expression has not been established. Despite this fact, recent work has documented a significantly shortened survival time in dogs with increased numbers of circulating CD34+ cells (Williams et al., 2008).
Often when blasts are identified in the peripheral blood or bone marrow it is difficult to assign a cell lineage, and flow cytometry can be extremely useful in these cases although again, few reports have been published correlating morphologic characteristics with immunophenotype. Cytoplasmic staining of acute leukemias may be more useful than surface staining because human T-cell ALL express CD3 only in their cytoplasm (Szczepanski et al., 2006). Acute B-cell leukemias may also express only cytoplasmic antigens associated with their lineage, such as CD79a. Leukemias expressing either of these antigens can be classified as lymphoid. Cells expressing surface antigens such as CD14 or CD11b are classified as myeloid. Intracellular staining with an antibody to myeloperoxidase or using the antibody MAC387 may provide further confirmation of the myeloid origin of these cells. There is an excellent study correlating AML subclassification (AML-M1, M4, and M5) with immunophenotype using a variety of markers (Villiers et al., 2006), but similar studies are not available for ALL.
Diagnosis of Mediastinal Masses
A particularly useful application of flow cytometry involves distinguishing lymphoma from thymoma in cases of lymphocyte-rich mediastinal masses (Lana et al., 2006a). The neoplastic cell type in thymoma is the thymic epithelial cell, which directs differentiation of normal T-cells. During differentiation in the thymus, T-cells pass through a stage in which they co-express CD4 and CD8. The thymus is the only place such cells will be found, so their presence in a mediastinal mass of an adult dog can be considered diagnostic for thymoma (Fig. 17-14 ). After the CD4+CD8+ stage of development, but before exiting the thymus, T-cells downregulate one of the proteins. Thus, the number of circulating T-cells can be increased in cases of thymoma, but none of the cells in the blood will co-express CD4 and CD8. By contrast, lymphomas involving the mediastinum are generally T-cell but express only one or neither of the subset markers CD4 or CD8. The cells in mediastinal lymphoma are invariably large, whereas the lymphocytes in thymoma are small. Therefore, flow cytometry can usually distinguish between these two entities. Because making this distinction determines whether a patient will have chemotherapy or surgery, this is a particularly important use for this assay.
Figure 17-14.
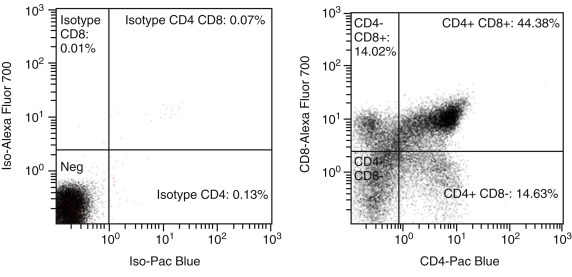
Detection of thymoma by flow cytometry.
Both panels show fluorescence of the small lymphocyte population, gated based on forward and side scatter (not shown). Left, Isotype control showing placement of quadrants. Right, CD4 and CD8 fluorescence, showing that 51% of the cells co-express CD4 and CD8 (upper right quadrant). Note the presence of cells that express only CD4 or CD8. These cells represent the stage of thymic differentiation following the double positive (CD4+CD8+) stage, when one or the other of the two markers has been downregulated. These single positive cells exit the thymus into the blood. Double positive T-cells do not exit the thymus, and are therefore never found in circulation in cases of thymoma.
PCR for Antigen Receptor Rearrangements
In human medicine, determination of clonality by detecting clonally rearranged antigen receptor genes is often the test of choice if routine cytology, histology, and immunophenotyping are not able to provide a definitive diagnosis of lymphoid malignancy (Swerdlow, 2003). Clonality testing is based on the observation that lymphocytes mount a diverse response to antigens, whether they are derived from the environment (such as allergens), from pathogens, or from self (autoantigens). By contrast, malignant lymphocytes are homogeneous, arising from a single transformed cell. Normal lymphocyte differentiation depends on the process of antigen receptor rearrangement; therefore, all mature lymphocytes have antigen receptor genes that have undergone VJ or VDJ rearrangement. Immunoglobulin genes are rearranged in B lymphocytes, and T-cell receptor genes α/β and/or γ/δ in T lymphocytes (Jung and Alt, 2004). During this process (Fig. 17-15 ), nucleotides are trimmed or added between genes as they recombine, resulting in significant length and sequence heterogeneity, particularly within the complementarity determining region 3 (CDR3). Further diversity within B-cell immunoglobulin genes is created by somatic hypermutation during antigen-driven B-cell activation. The end result of this differentiation is a diverse population of lymphocytes with virtually limitless antigen specificity and a large variety of CDR3 sequences and lengths. Lymphocytes derived from the same clone will have CDR3 regions of the same length and sequence. The term PARR is used to distinguish it from other types of PCR assays and from other methods of determining clonality. (It should be noted that this abbreviation was coined by Burnett et al. [2003] and is not used when referring to the same assay performed by human diagnostic laboratories.). Additional means of determining clonality in human medicine would include the amplification of BCL1-IGH and BCL2-IGH genes because the chromosomal translocation that brings the BCL and IGH loci together is relatively common in human B-cell lymphomas (van Dongen et al., 2003).
Figure 17-15.
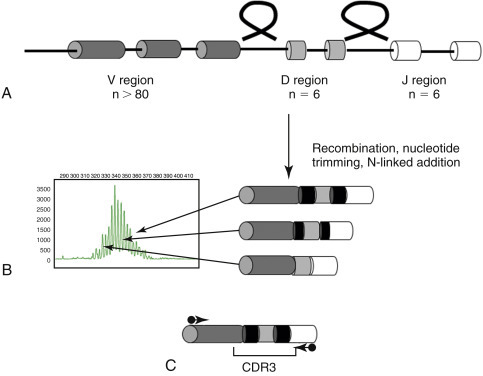
Immunoglobulin gene rearrangement.
A, One V region gene (of approximately 80 in the canine genome) recombines with a randomly selected D region gene (6 in the canine genome) and a J region gene (6 in the canine genome), looping out the intervening DNA. B, During this process, nucleotides are added (black bars) between genes, which generate length and sequence diversity in the complementarity determining region 3 (CDR3). Differentially sized DNA can be separated by capillary electrophoresis and will appear as a ladder representing different populations of B-cells (shown at left). C, Primers with homology to the conserved framework regions of V and J regions (arrows) will amplify PCR products of different sizes when DNA is derived from different lymphocytes. Primers are located outside the hypervariable CDR3 region in order to detect as many different V and J genes as possible.
Methodology
Sample Collection
The principle behind this assay has been described in detail (Avery and Avery, 2004, Workman and Vernau, 2003). The steps to carry out a clonality assay begin with DNA extraction from tissue. Virtually any type of tissue can be used as a source of DNA, including blood, cavity fluids, aspirates, CSF, stained or unstained cytology preps, and tissue in paraffin blocks. The latter is the least desirable because formalin fixation degrades DNA and can result in both more false negatives and false positives. Archival samples, including old cytology slides, can be used as a source of material for retrospective analysis.
DNA Amplification
Primers that hybridize to the conserved portions of V and J region genes of immunoglobulin and T-cell receptor genes are then used to amplify DNA in a PCR reaction. Although T-cell receptors can either be α/β or γ/δ, primers recognizing TCRγ are typically used. Since there are fewer TCRγ genes, fewer primers are needed to detect the majority of malignancies, and TCRγ is rearranged before TCRβ, so will be clonal even if the malignancy ultimately expresses TCRα/β. In human medicine, primers recognizing TCRγ, TCRβ, and TCRδ, as well as VJ, DJ, and BCL-IgH rearrangements, are used to detect clonality (van Dongen et al., 2003).
Amplification of a positive control gene is an important part of the clonality assay. Almost any gene can be used. The goal of amplification is to verify that there is sufficient DNA of adequate quality to be able to interpret the results. In the absence of a positive control, a negative result may not reflect the lack of clonally expanded lymphocytes; it may rather indicate that a sample has no good amplifiable DNA.
Data Analysis
Analysis of these PCR products can be carried out using a variety of methods designed to evaluate the size of the products and in some cases the sequence heterogeneity. Although the original description of clonality assays in both human and veterinary medicine involved the use of polyacrylamide gels to separate PCR products by size, these methods have largely been replaced by capillary gel electrophoresis, which can give better resolution to the size of the products and provide more consistent results. Agarose gel electrophoresis is never appropriate for the analysis of PARR assays because even high resolution agarose gels have insufficient resolution.
The presence of one or more single-sized PCR products indicates a clonal population of lymphocytes. Although it might be hypothesized that at most two PCR products would be seen in a malignancy (one rearrangement on each chromosome), in practice, particularly for T-cell receptor rearrangements, more than two rearrangements can be seen (Kisseberth et al., 2007). A comprehensive study of the maximum number of clonally rearranged antigen receptors that can be found in a single malignancy has not been carried out, so the cutoff between a “clonal” population and an “oligoclonal” population is not yet clear. A recommendation by Keller and Moore (2012) suggests multiple single-sized PCR products appearing oligoclonal should be termed clonal. The presence of variably sized products suggests a polyclonal population of lymphocytes. Fig. 17-16 shows examples of the PARR assay carried out on a reactive lymph node, a case of B-cell lymphoma, and a case of T-cell leukemia.
Figure 17-16.
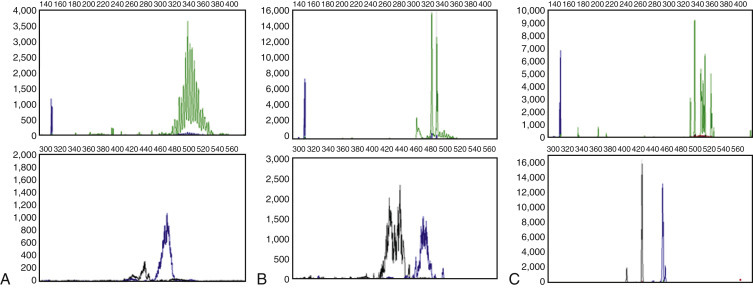
Results of the PARR assay.
For all three cases, the top panel shows amplification of immunoglobulin genes (green) and a positive control gene (blue). The bottom panel shows amplification of T-cell receptor genes using two different primer pairs (blue and black), which results in slightly different sized products. The size of the product (number of bases) is depicted on the x axis, and the fluorescence intensity of the product is depicted on the y axis. A, Lymph node from a dog with reactive lymphoid hyperplasia secondary to dermatitis. B, Lymph node from a dog with B-cell lymphoma. C, Peripheral blood from a dog with T-cell leukemia. Note that although there are multiple immunoglobulin gene products, the number of products is lower than in A. This result reflects the fact that the peripheral blood of this patient contained very few B-cells.
There are no guidelines in veterinary medicine for how positive and negative results are reported. A convention used in the laboratory at Colorado State University is to call a result positive (clonal) if the clonal peak is three times the height of the baseline, in accordance with recently published human studies (Miyata-Takata et al., 2014). Regardless of the method chosen, the laboratory running the test should be able to report sensitivity and specificity of their assay using the method of result calling they have chosen. The laboratory should be able to carry out the assay in such a way that their results are objective and can stand alone. Specificity can be a difficult value to establish: The presence of a clonally rearranged antigen receptor gene in the absence of histologically or cytologically confirmed lymphoproliferative disease is not necessarily a false-positive result. Because of the assay’s sensitivity, clonality testing can detect neoplasia before it is evident by other means. Some presentations of lymphoma, such as T zone lymphoma, are often diagnosed as lymphoid hyperplasia in the early stages. Thus, the only way to properly evaluate the specificity of the clonality assay is to assess the results in patients with good clinical follow-up for 6 months to 1 year to determine if a positive result indicates early-stage disease.
In the authors’ laboratory, the sensitivity of the assay on canine cases of histologically or cytologically confirmed lymphomas or leukemias is 80%. The following may be the reasons for a negative PARR result in a case of histologically or cytologically confirmed lymphoma: 1) The malignancy uses a V or J gene to which the primers do not hybridize; 2) the malignancy has lost the chromosome carrying the antigen receptor genes; 3) somatic hypermutation in cases of B-cell lymphoma or leukemia has altered the sequence to which the primers hybridize; 4) the malignancy is NK in origin and therefore does not contain a rearranged antigen receptor gene; 5) the malignancy is from an early precursor cell that has not yet rearranged the antigen receptor genes; 6) the diagnosis of lymphoma was incorrect and the tumor is a different lineage (for example myeloid).
In some cases, clonal populations are detected in patients without lymphoproliferative disease. Such a “false-positive” rate will differ between laboratories, and may have a variety of causes, most of which are not clear. The exception is that in rare cases, Ehrlichia canis infection appears to induce clonal T-cell expansion (Burnett et al., 2003, Vernau and Moore, 1999).
Uses
Diagnosis of Lymphoma and Leukemia
Clonality testing is now routinely available for dogs and cats. The first large-scale study of this technique was reported by Burnett et al (2003) following earlier studies that demonstrated the presence of clonally rearranged T-cell receptor genes in canine malignancy (Dreitz et al., 1999, Fivenson et al., 1994, Vernau and Moore, 1999).
The most common application of this technique is in cases where cytology or histology is ambiguous. The assay can detect a malignant clone in a nonlymphoid organ that comprises as little as 0.1% of the tissue, but in lymphoid tissues, it requires a minimum of 10% of DNA to detect a single clone (Burnett et al., 2003). Thus, it can be useful in early cases of lymphoma or leukemia but will depend on the tissue being used. Stained or unstained cytology slides or cells freshly aspirated into ethylenediaminetetraacetic acid (EDTA) tubes are the best samples for this purpose. Interpretation of the results will vary depending on the sensitivity and specificity of the assay in each laboratory offering the test.
The nature of the rearrangement can help in establishing phenotype with a few exceptions. The initial description of the PARR assay (Burnett et al., 2003) demonstrated excellent correlation between the lineage of the malignancy (B-cell vs T-cell) and the rearrangement detected. Immunoglobulin gene rearrangements were found in 24/25 B-cell malignancies, and no T-cell receptor rearrangements found. Of the 18 T-cell malignancies studied, 14 harbored only a T-cell receptor rearrangement and one had both immunoglobulin and T-cell receptor rearrangements. Subsequent work in the authors’ laboratory has demonstrated similar lineage fidelity, although reports from other laboratories (Valli et al., 2006) suggest a higher frequency of cross-lineage rearrangements (e.g., 21% of cases of marginal zone lymphoma with immunoglobulin rearrangements were reported to have T-cell receptor rearrangements). One explanation for these differences is the use of FFPE tissue for the latter studies. Because formalin fragments DNA, samples can appear clonal when they are not due to PCR amplification of the few intact cells in the sample. Cloning studies or side-by-side analysis on non–formalin-fixed tissue could help clarify the true rate of cross-lineage rearrangements.
Staging Lymphoma and Monitoring Disease
Since the PARR assay is more sensitive than visual examination of cells, it can detect neoplastic cells in the peripheral blood when they are not detected by cytology (Keller et al., 2004). Approximately 75% of stage III lymphomas, which have no visually detectable circulating neoplastic cells, will have a PARR+ result in the peripheral blood (Lana et al., 2006b). The presence of these cells does not appear to correlate with a worse outcome; therefore, clinical staging remains the most useful predictor of prognosis.
Clonal Relationships between Tumors and Detection of Minimal Residual Disease
The sequence of the CDR3 region that is amplified during the PCR process is unique to each lymphocyte clone. Therefore, this sequence can be used to establish the relationship between neoplastic cells that arise in different places in the body, at different times, or have a dramatically different morphologic appearance. For example, the relationship between Helicobacter pylori infection and human gastric lymphoma was established by showing that the B-cell lymphoma in a patient with a history of Helicobacter infection had the same CDR3 sequence as clones found in reactive gastritis biopsy specimens obtained several years earlier (Zucca et al., 1998).
The unique CDR3 sequence can be used to determine if two tumors with morphologically different phenotypes are related. Bräuninger et al (1999) described two human patients with two distinct forms of lymphoma occurring simultaneously. Both patients had classic Hodgkin’s lymphoma, while one also had a follicular lymphoma and the other had a T-cell–rich B-cell lymphoma. The CDR3 sequence of the immunoglobulin gene in the Reed-Sternberg cells of the Hodgkin’s lymphoma was identical to the CDR3 sequence of the other form of B-cell lymphoma in both patients. This finding indicates that a single clone can evolve into dramatically different morphologic phenotypes. Burnett et al (2004) carried out a similar study in a dog treated for classical non-Hodgkin’s B-cell lymphoma and then developed multiple myeloma. By sequencing the CDR3 regions of both tumors, it was shown that the B-cells from the lymphoma and plasma cells from the multiple myeloma had the same clonal origin.
Because CDR3 uniquely identifies an individual B-cell, a primer which binds to this region can be used to selectively amplify DNA from a single tumor, as distinct from amplifying DNA from all B-cells in a sample. Detection of neoplastic cells is considerably more sensitive using this method, and such an assay has been used to detect minimal residual disease (MRD) in the blood of human patients treated for a variety of lymphoid malignancies. The technique has also been reported in canine patients (Yamazaki et al., 2008), where investigators could demonstrate the reappearance of clonal B-cells in the blood of dogs treated for B-cell lymphoma before clinical relapse. MRD detection is complex and requires both sequencing the immunoglobulin gene involved in the malignancy and creating tumor-specific standard curves to be used in the quantification. Therefore, it is unlikely to be applied to routine monitoring in its current form but may be useful in a research setting. MRD detection will almost certainly be replaced within the next few years by next-generation sequencing. In the latter method, all the immunoglobulin or T-cell receptor genes within a particular sample are sequenced and enumerated. This method will allow investigators to directly count the number of tumor cells in a sample.
Clonality Assays in Cats
The sequences of TCRγ and immunoglobulin genes from cats have been published and used for clonality assays in cases of visceral B-cell lymphoma and intestinal T-cell lymphoma (Mochizuki et al., 2012, Moore et al., 2005, Werner et al., 2005). Moore et al (2012) found that 79% of cases of intestinal T-cell lymphoma 50% of B-cell lymphomas could be identified using clonality assays. Other groups have identified slightly higher sensitivity for detection of feline B-cell malignancy by PARR (Mochizuki et al., 2011).
Perhaps the most important use of the clonality assay in cats will be to distinguish neoplastic from nonneoplastic lymphocytic infiltrates in cases where clinicians are trying to distinguish intestinal lymphoma from severe inflammatory bowel disease (IBD). The available data clearly show that full thickness intestinal biopsy is by far the most useful diagnostic procedure for making this distinction. Only full-thickness biopsies allow the pathologist to assess the extent to which neoplastic cells have infiltrated (mucosal vs. transmural) and the size of the neoplastic cells. Both of these features, together with immunophenotype, are prognostic in feline intestinal lymphoma (Moore et al., 2012). However, the clonality assay may be useful in cases that are histologically ambiguous. Studies establishing the utility of PARR for distinguishing lymphoma from severe IBD are lacking; in the absence of a definitive histologic diagnosis, such a study would have to use clinical outcome as a “gold standard” for the diagnosis of lymphoma versus IBD, and analysis of this type has not yet been carried out.
Detection of Mutations, Translocations, and Copy Number Variations
Chromosomal Abnormalities
Lymphoma and leukemia are frequently associated with translocations because the process of recombining antigen receptor genes leaves lymphocytes susceptible to mistakes in recombination. Most translocations found in human leukemia and lymphoma involve the immunoglobulin heavy chain gene locus. For example, t(11;14) juxtaposes the locus encoding cyclin D1 on chromosome 11 to an immunoglobulin-enhancer sequence on chromosome 14. This translocation, which results in the overexpression of cyclin D1, is found in virtually all cases of mantle cell lymphoma (Campo, 2003). Detection of the translocation by PCR or the overexpressed protein by IHC can be used to confirm the diagnosis of mantle cell lymphoma in histologically ambiguous cases. A consortium of European researchers found that the combined use of clonality determination through antigen receptor rearrangements together with detection of this and other translocations by PCR resulted in detection of a clonal population in 95% of human cases of confirmed lymphoid malignancies (van Krieken et al., 2003).
Two translocations that might be targets of future diagnostic testing for canine lymphoma are the IgH-myc translocation in B-cell lymphoma and the bcr-abl translocation in chronic myelogenous leukemia (Breen and Modiano, 2008). IgH-myc is commonly found in aggressive human B-cell lymphomas. The bcr-abl translocation is found in approximately 95% of human CML. Routine detection of this translocation in dogs by any number of methods would be a useful way of distinguishing CML from inflammatory conditions. It is very likely that testing for these and other rearrangements will be available in veterinary medicine in the near future.
Chromosomal aberrations in the form of increased or decreased chromosome copy number have been described in multiple different histologic subtypes of lymphoma (Thomas et al., 2011). These investigators used array comparative genomic hybridization (arrayCGH), a technique that allows the detection of copy number changes (deletions or duplications) on whole chromosomes or portions of chromosomes throughout the entire canine genome. While this technique is not currently available as a clinical tool, studies of this sort will almost certainly lead to the discovery of targeted PCR and IHC or flow cytometry–based assays that can be used for detecting malignant lymphocytes in ambiguous cases and subclassifying malignancy into discrete prognostic and therapeutic groups.
Detection of mutations in oncogenes is a mainstay in the characterization of human malignancies for diagnosis, prognosis, and choice of therapy. For example, mutations in the FLT3 gene (FMS-like tyrosine kinase 3) result in constitutive activation of this tyrosine kinase receptor. The presence of such mutations is prognostic in human AML (Kayser and Levis, 2014) and can help guide therapy with the appropriate tyrosine kinase inhibitors. Similar FLT3 mutations have been described in canine acute lymphoblastic leukemia (Suter et al., 2011). While detection of these mutations is not a standard diagnostic test, the methodology is straightforward and could be readily adopted for routine use once there are data to show that the presence of the mutation has prognostic or therapeutic significance.
A similar type of mutation is now commonly detected in canine mast cell tumors. The c-kit gene, which encodes the receptor for stem cell factor, is a receptor tyrosine kinase. When a portion of the gene that is adjacent to the cell membrane is duplicated (called an internal tandem duplication), the result is constitutive activation of the receptor. Mast cell tumors harboring this mutation (approximately 15% to 30% of all tumors) exhibit better responses to the tyrosine kinase inhibitor toceranib (London et al., 2009) and have a poorer overall prognosis. After the initial description of this mutation, a comprehensive analysis of mast cell tumors found that while the most common mutation is seen in exon 11, an internal tandem duplication in exon 8 and point mutations in exons 9 and 17 can also be found (Letard et al., 2008). To date, however, only mutations in exon 11 have been directly associated with responses to tyrosine kinase inhibitors.
C-kit mutations are diagnosed by a PCR assay that amplifies the region of the gene where the mutation is commonly found (Fig. 17-17 ). The internal tandem duplication in exon 11 creates a larger PCR product of variable size (most commonly between three and 45 additional bases, [Letard et al., 2008]). The internal tandem duplication in exon 8 is always the same, an addition of 12 bases. Thus, detection of both of these mutations is straightforward. An internal control for this assay is the presence of the wild type PCR product—almost all samples will contain non-tumor–derived DNA, which would contain wild-type c-kit. In addition, presumably the mast cells themselves have one wild type c-kit gene. The assay can be performed on tissue biopsies or aspirate biopsies, and mast cells must comprise at least 10% of the total cell numbers. Oncologists use the presence of this mutation to help choose chemotherapy; the presence of a c-kit mutation would lead to the choice of a tyrosine kinase inhibitor such as toceranib. C-kit mutation status has also been used to show that when patients develop mast cell tumor recurrence, or multiple mast cells at different sites, those mast cells are derived from the same clone because they harbor the same type of mutation (Marconato et al., 2014, Zavodovskaya et al., 2004).
Figure 17-17.
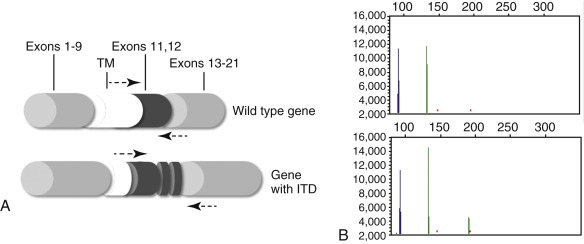
Assessment of c-kit mutation status in canine mast cell tumors.
A, Diagram of the c-kit gene demonstrating where the most common mutation is found (internal tandem duplication of exon 11). TM = transmembrane region. The portion of the protein encoded by exons 1-9 is found on the cell surface, and the portion encoded by exons 11-21 is found in the cytoplasm. The second most common site of internal tandem duplication is exon 8 (not shown). B, Amplification of exons 8 and 11 by PCR. In this example, both exons are amplified in the same PCR reaction, with primers conjugated to different fluorochromes. The top graph shows amplification of wild type exon 8 (blue) and exon 11 (green). The bottom graph shows wild type exons 8 and 11, as well as an internal tandem duplication of exon 11 (approximately 190 bases).
References
- Abendroth C.S., Dabbs D.J. Immunocytochemical staining of unstained versus previously stained cytologic preparations. Acta Cytol. 1995;39:379–386. [PubMed] [Google Scholar]
- Afify A.M., Al-Khafaji B.M., Paulino A.F.G. Diagnostic use of muscle markers in the cytologic evaluation of serous fluids. Appl Immunohistochem Mol Morphol. 2002;10:178–182. doi: 10.1097/00129039-200206000-00014. [DOI] [PubMed] [Google Scholar]
- Argyle D.J., Nasir L. Telomerase: a potential diagnostic and therapeutic tool in canine oncology. Vet Pathol. 2003;40:1–7. doi: 10.1354/vp.40-1-1. [DOI] [PubMed] [Google Scholar]
- Avery P.R., Avery A.C. Molecular methods to distinguish reactive and neoplastic lymphocyte expansions and their importance in transitional neoplastic states. Vet Clin Pathol. 2004;33:196–207. doi: 10.1111/j.1939-165x.2004.tb00374.x. [DOI] [PubMed] [Google Scholar]
- Avery P.R., Burton J., Bromberek J.L. Flow cytometric characterization and clinical outcome of CD4+ T-cell lymphoma in dogs: 67 cases. J Vet Intern Med. 2014;28:538–546. doi: 10.1111/jvim.12304. [DOI] [PMC free article] [PubMed] [Google Scholar]
- Bardou V.J., Arpino G., Elledge R.M. Progesterone receptor status significantly improves outcome prediction over estrogen receptor status alone for adjuvant endocrine therapy in two large breast cancer databases. J Clin Oncol. 2003;21:1973–1979. doi: 10.1200/JCO.2003.09.099. [DOI] [PubMed] [Google Scholar]
- Barr N.J., Wu N.C.Y. Cytopathology/FNA. In: Taylor C.R., Cote R.J., editors. Immunomicroscopy: a diagnostic tool for the surgical pathologist. ed 3. Saunders; Philadelphia: 2006. pp. 397–416. [Google Scholar]
- Batlivala T.P., Bacon N.J., Avery A.C. Paraneoplastic T cell lymphocytosis associated with a thymoma in a dog. J Small Anim Pract. 2010;51:491–494. doi: 10.1111/j.1748-5827.2010.00962.x. [DOI] [PubMed] [Google Scholar]
- Baumgart E., Cohen M.S., Neto B.S. Identification and prognostic significance of an epithelial-mesenchymal transition expression profile in human bladder tumors. Clin Cancer Res. 2007;13:1685–1694. doi: 10.1158/1078-0432.CCR-06-2330. [DOI] [PubMed] [Google Scholar]
- Bhargava R., Dabbs D.J. Immunohistology of metastatic carcinomas of unknown primary. In: Dabbs D.J., editor. Diagnostic immunohistochemistry. Theranostic and genomic applications. ed 3. Saunders; Philadelphia: 2010. pp. 206–255. [Google Scholar]
- Boenisch T. Pretreatment for immunohistochemical staining simplified. Appl Immunohistochem Mol Morphol. 2007;15:208–212. doi: 10.1097/01.pai.0000209862.28205.e6. [DOI] [PubMed] [Google Scholar]
- Bratthauer G.L. Processing of tissue culture cells. In: Oliver C., Jamur M.C., editors. Immunocytochemical methods and protocols. Humana Press; New York: 2010. pp. 85–92. [Google Scholar]
- Bräuninger A., Hansmann M.L., Strickler J.G. Identification of common germinal-center B-cell precursors in two patients with both Hodgkin’s disease and non-Hodgkin’s lymphoma. N Engl J Med. 1999;340:1239–1247. doi: 10.1056/NEJM199904223401604. [DOI] [PubMed] [Google Scholar]
- Breen M., Modiano J.F. Evolutionarily conserved cytogenetic changes in hematological malignancies of dogs and humans–man and his best friend share more than companionship. Chromosome Res. 2008;16:145–154. doi: 10.1007/s10577-007-1212-4. [DOI] [PubMed] [Google Scholar]
- Brown R.W. Immunocytochemistry. In: Ramzy I., editor. Clinical cytopathology and aspiration biopsy: fundamental principles and practice. McGraw-Hill; New York: 2001. pp. 535–548. [Google Scholar]
- Burkhard M.J., Bienzle D. Making sense of lymphoma diagnostics in small animal patients. Vet Clin Small Anim. 2013;43:1331–1347. doi: 10.1016/j.cvsm.2013.07.004. [DOI] [PubMed] [Google Scholar]
- Burnett R.C., Blake M.K., Thompson L.J. Evolution of a B-cell lymphoma to multiple myeloma after chemotherapy. J Vet Intern Med. 2004;18:768–771. doi: 10.1892/0891-6640(2004)18<768:eoablt>2.0.co;2. [DOI] [PubMed] [Google Scholar]
- Burnett R.C., Vernau W., Modiano J.F. Diagnosis of canine lymphoid neoplasia using clonal rearrangements of antigen receptor genes. Vet Pathol. 2003;40:32–41. doi: 10.1354/vp.40-1-32. [DOI] [PubMed] [Google Scholar]
- Byrne K.M., Kim H.W., Chew B.P. A standardized gating technique for the generation of flow cytometry data for normal canine and normal feline blood lymphocytes. Vet Immunol Immunopathol. 2000;73:167–182. doi: 10.1016/s0165-2427(99)00163-4. [DOI] [PubMed] [Google Scholar]
- Cadile C.D., Kitchell B.E., Newman R.G. Telomere length in normal and neoplastic canine tissues. Am J Vet Res. 2007;68:1386–1391. doi: 10.2460/ajvr.68.12.1386. [DOI] [PubMed] [Google Scholar]
- Campbell M.W., Hess P.R., Williams L.E. Chronic lymphocytic leukaemia in the cat: 18 cases (2000-2010) Vet Comp Oncol. 2012;11:256–264. doi: 10.1111/j.1476-5829.2011.00315.x. [DOI] [PubMed] [Google Scholar]
- Campo E. Genetic and molecular genetic studies in the diagnosis of B-cell lymphomas I: mantle cell lymphoma, follicular lymphoma, and Burkitt’s lymphoma. Human Pathol. 2003;34:330–335. doi: 10.1053/hupa.2003.97. [DOI] [PubMed] [Google Scholar]
- Capurro M., Wanless I.R., Sherman M. Glypican-3: a novel serum and histochemical marker for hepatocellular carcinoma. Gastroenterology. 2003;125:89–97. doi: 10.1016/s0016-5085(03)00689-9. [DOI] [PubMed] [Google Scholar]
- Carson F.L. ed 2. 1997. Histotechnology: a self-instructional text. (American Society for Clinical Pathology). [Google Scholar]
- Cheville N.F., Stasko J. Techniques in electron microscopy of animal tissue. Vet Pathol. 2014;51:28–41. doi: 10.1177/0300985813505114. [DOI] [PubMed] [Google Scholar]
- Chijiwa K., Uchida K., Tateyama S. Immunohistochemical evaluation of canine peripheral nerve sheath tumors and other soft tissue sarcomas. Vet Pathol. 2004;41:307–318. doi: 10.1354/vp.41-4-307. [DOI] [PubMed] [Google Scholar]
- Chivukula M., Dabbs D.J. Immunocytology. In: Dabbs D.J., editor. Diagnostic immunocytochemistry. ed 3. Churchill Livingstone; New York: 2010. pp. 890–918. [Google Scholar]
- Cian F., Guzera M., Frost S. Stability of immunophenotypic lymphoid markers in fixed canine peripheral blood for flow cytometric analysis. Vet Clin Pathol. 2014;43:101–108. doi: 10.1111/vcp.12111. [DOI] [PubMed] [Google Scholar]
- Colasacco C., Mount S., Leiman G. Documentation of immunocytochemistry controls in the cytopathologic literature: a meta-analysis of 100 journal articles. Diagn Cytopathol. 2010;39:245–250. doi: 10.1002/dc.21370. [DOI] [PubMed] [Google Scholar]
- Colledge S.L., Raskin R.E., Messick J.B. Multiple joint metastasis of a transitional cell carcinoma in a dog. Vet Clin Pathol. 2013;42:216–220. doi: 10.1111/vcp.12045. [DOI] [PubMed] [Google Scholar]
- Dabbs D.J. Immunocytology. In: Dabbs D.J., editor. Diagnostic immunohistochemistry. Churchill Livingstone; New York: 2002. pp. 625–639. [Google Scholar]
- Dabbs D.J. Immunohistology of metastatic carcinoma of unknown primary. In: Dabbs D.J., editor. Diagnostic immunohistochemistry. ed 2. Churchill Livingstone; New York: 2006. [Google Scholar]
- Dabbs D.J., Wang X. Immunocytochemistry on cytologic specimens of limited quantity. Diagn Cytopathol. 1998;18:166–169. doi: 10.1002/(sici)1097-0339(199802)18:2<166::aid-dc13>3.0.co;2-j. [DOI] [PubMed] [Google Scholar]
- Dardick I., Eyden B., Federman M., editors. Handbook of diagnostic electron microscopy for pathologists-in-training. Igaku-Shoin; New York: 1996. [Google Scholar]
- Dardick I., Herrera G.A. Diagnostic electron microscopy of neoplasms. Hum Pathol. 1998;29:1335–1338. doi: 10.1016/s0046-8177(98)90000-4. [DOI] [PubMed] [Google Scholar]
- DeLellis R.A., Hoda R.S. Immunohistochemistry and molecular biology in cytological diagnosis. In: Koss L.G., Melamed M.R., editors. Koss’ diagnostic cytology and its histopathologic basis. Lippincott Williams & Wilkins; Philadelphia: 2006. pp. 1635–1680. [Google Scholar]
- Denda T., Kamoshida S., Kawamura J. Optimal antigen retrieval for ethanol-fixed cytologic smears. Cancer Cytopathol. 2012;120:167–176. doi: 10.1002/cncy.21192. [DOI] [PubMed] [Google Scholar]
- Dickersin G.R., editor. Diagnostic electron microscopy: a text/atlas. ed 2. Springer; New York: 2000. [Google Scholar]
- Dreitz M.J., Ogilvie G., Sim G.K. Rearranged T lymphocyte antigen receptor genes as markers of malignant T cells. Vet Immunol Immuopathol. 1999;69:113–119. doi: 10.1016/s0165-2427(99)00047-1. [DOI] [PubMed] [Google Scholar]
- Dupré M.P., Courtade-Saidi M. Immunocytochemistry as an adjunct to diagnostic cytology. Ann Pathol. 2012;32:433–437. doi: 10.1016/j.annpat.2012.09.205. [DOI] [PubMed] [Google Scholar]
- Dvorak A.M., Monahan-Earley R.A., editors. Diagnostic ultrastructural pathology I. CRC Press; Boca Raton: 1992. [Google Scholar]
- Erlandson R.A., editor. Diagnostic transmission electron microscopy of tumors. Raven Press; New York: 1994. [Google Scholar]
- Espinosa de los, Monteros A., Fernández A., Millán M.Y. Coordinate expression of cytokeratins 7 and 20 in feline and canine carcinomas. Vet Pathol. 1999;36:179–190. doi: 10.1354/vp.36-3-179. [DOI] [PubMed] [Google Scholar]
- Espinosa de los, Monteros A., Millán M.Y., Ordás J. Immunolocalization of the smooth muscle-specific protein calponin in complex and mixed tumors of the mammary gland of the dog: assessment of the morphogenetic role of the myoepithelium. Vet Pathol. 2002;39:247–256. doi: 10.1354/vp.39-2-247. [DOI] [PubMed] [Google Scholar]
- Eyden B., editor. Organelles in tumor diagnosis: an ultrastructural atlas. Igaku-Shoin; New York: 1996. [Google Scholar]
- Fetsch P.A., Abati A. Ancillary techniques in cytopathology. In: Atkinson B.F., editor. Atlas of diagnostic cytopathology. ed 2. Saunders; Philadelphia: 2004. pp. 747–775. [Google Scholar]
- Fisher C. The comparative roles of electron microscopy and immunohistochemistry in the diagnosis of soft tissue tumors. Histopathology. 2006;48:32–41. doi: 10.1111/j.1365-2559.2005.02287.x. [DOI] [PubMed] [Google Scholar]
- Fivenson D.P., Saed G.M., Beck E.R. T-cell receptor gene rearrangement in canine mycosis fungoides: further support for a canine model of cutaneous T cell lymphoma. J Invest Dermatol. 1994;102:227–230. doi: 10.1111/1523-1747.ep12371767. [DOI] [PubMed] [Google Scholar]
- Flood-Knapik K.E., Durham A.C., Gregor T.P. Clinical, histopathological and immunohistochemical characterization of canine indolent lymphoma. Vet Comp Oncol. 2013;11:272–286. doi: 10.1111/j.1476-5829.2011.00317.x. [DOI] [PubMed] [Google Scholar]
- Fowler L.J., Lachar W.A. Application of immunohistochemistry to cytology. Arch Pathol Lab Med. 2008;132:373–383. doi: 10.5858/2008-132-373-AOITC. [DOI] [PubMed] [Google Scholar]
- Gelain M.E., Mazzilli M., Riondato F. Aberrant phenotypes and quantitative antigen expression in different subtypes of canine lymphoma by flow cytometry. Vet Immunol Immunopathol. 2008;121:179–188. doi: 10.1016/j.vetimm.2007.09.018. [DOI] [PubMed] [Google Scholar]
- Geninet C., Bernex F., Rakotovao F. Sclerosing peritoneal mesothelioma in a dog: a case report. J Vet Med A. 2003;50:402–405. doi: 10.1046/j.0931-184x.2003.00566.x. [DOI] [PubMed] [Google Scholar]
- Ghadially F.N., editor. Diagnostic ultrastructural pathology: a self-evaluation and self-teaching manual. ed 2. Butterworth-Heinemann; Boston: 1998. [Google Scholar]
- Goldstein N.S., Hewitt S.M., Taylor C.R. Recommendations for improved standardization of immunohistochemistry. Appl Immunohistochem Mol Morphol. 2007;15:124–133. doi: 10.1097/PAI.0b013e31804c7283. [DOI] [PubMed] [Google Scholar]
- Gong Y., Sun X., Michael C.W. Immunocytochemistry of serous effusion specimens: a comparison of ThinPrep vs. cell block. Diagn Cytopathol. 2003;28:1–5. doi: 10.1002/dc.10219. [DOI] [PubMed] [Google Scholar]
- Hayat M.A. Factors affecting antigen retrieval. In: Hayat M.A., editor. Microscopy, immunohistochemistry, and antigen retrieval methods for light and electron microscopy. Kluwer Academic; New York: 2002. pp. 53–69. [Google Scholar]
- Heeb H.L., Wilkerson M.J., Chun R. Large granular lymphocytosis, lymphocyte subset inversion, thrombocytopenia, dysproteinemia, and positive Ehrlichia serology in a dog. J Am Anim Hosp Assoc. 2003;39:379–384. doi: 10.5326/0390379. [DOI] [PubMed] [Google Scholar]
- Höinghaus R., Hewicker-Trautwei M., Mischke R. Immunocytochemical differentiation of canine mesenchymal tumors in cytologic imprint preparations. Vet Clin Pathol. 2008;37:104–111. doi: 10.1111/j.1939-165X.2008.00017.x. [DOI] [PubMed] [Google Scholar]
- Horobin R.W. How histological stains work. In: Suvarna K.S., Layton C., Bancroft J.D., editors. Bancroft’s theory and practice of histological techniques. ed 7. Churchill Livingstone; Edinburgh: 2013. pp. 157–172. [Google Scholar]
- Ikeda K., Tate G., Suzuki T. Comparison of immunocytochemical sensitivity between formalin-fixed and alcohol-fixed specimens reveals the diagnostic value of alcohol-fixed cytocentrifuged preparations in malignant effusion cytology. Am J Clin Pathol. 2011;136:934–942. doi: 10.1309/AJCPAH5WR2LFTUSI. [DOI] [PubMed] [Google Scholar]
- Ishikawa K., Sakai H., Hosoi M. Evaluation of cell proliferation in canine tumors by the bromodeoxyuridine labeling method, immunostaining of Ki-67 antigen and proliferating cell nuclear antigen. J Toxicol Pathol. 2006;19:123–127. [Google Scholar]
- Jung D., Alt F.W. Unraveling V(D)J recombination; insights into gene regulation. Cell. 2004;116:299–311. doi: 10.1016/s0092-8674(04)00039-x. [DOI] [PubMed] [Google Scholar]
- Kayser S., Levis M.J. FLT3 tyrosine kinase inhibitors in acute myeloid leukemia: clinical implications and limitations. Leuk Lymphoma. 2014;55:243–255. doi: 10.3109/10428194.2013.800198. [DOI] [PMC free article] [PubMed] [Google Scholar]
- Keller R.L., Avery A.C., Burnett R.C. Detection of neoplastic lymphocytes in peripheral blood of dogs with lymphoma by polymerase chain reaction for antigen receptor gene rearrangement. Vet Clin Pathol. 2004;33:145–149. doi: 10.1111/j.1939-165x.2004.tb00364.x. [DOI] [PubMed] [Google Scholar]
- Keller S.M., Moore P.F. A novel clonality assay for the assessment of canine T cell proliferations. Vet Immunol Immunopathol. 2012;145:410–419. doi: 10.1016/j.vetimm.2011.12.019. [DOI] [PubMed] [Google Scholar]
- Kirbis I.S., Maxwell P., Fležar M.S. External quality control for immunocytochemistry on cytology samples: a review of UK NEQAS ICC (cytology module) results. Cytopathology. 2011;22:230–237. doi: 10.1111/j.1365-2303.2011.00867.x. [DOI] [PubMed] [Google Scholar]
- Kiupel M., Teske E., Bostock D. Prognostic factors for treated canine malignant lymphoma. Vet Pathol. 1999;36:292–300. doi: 10.1354/vp.36-4-292. [DOI] [PubMed] [Google Scholar]
- Kiupel M., Webster J.D., Kaneene J.B. The use of KIT and tryptase expression patterns as prognostic tools for canine cutaneous mast cell tumors. Vet Pathol. 2004;41:371–377. doi: 10.1354/vp.41-4-371. [DOI] [PubMed] [Google Scholar]
- Kisseberth W.C., Nadella W.V., Breen M. A novel canine lymphoma cell line: a translational and comparative model for lymphoma research. Leuk Res. 2007;31:1709–1720. doi: 10.1016/j.leukres.2007.04.003. [DOI] [PubMed] [Google Scholar]
- Kow K., Bailey S.M., Williams E.S. Telomerase activity in canine osteosarcoma. Vet Comp Oncol. 2006;4:184–187. doi: 10.1111/j.1476-5829.2006.00106.x. [DOI] [PubMed] [Google Scholar]
- Lai C.-L., van den Ham R., van Leenders G. Histopathological and immunohistochemical characterization of canine prostate cancer. Prostate. 2008;68:477–488. doi: 10.1002/pros.20720. [DOI] [PubMed] [Google Scholar]
- Lana S., Plaza S., Hampe K. Diagnosis of mediastinal masses in dogs by flow cytometry. J Vet Intern Med. 2006;20:1161–1165. doi: 10.1892/0891-6640(2006)20[1161:dommid]2.0.co;2. [DOI] [PubMed] [Google Scholar]
- Lana S.E., Jackson T.L., Burnett R.C. Utility of polymerase chain reaction for analysis of antigen receptor rearrangement in staging and predicting prognosis in dogs with lymphoma. J Vet Intern Med. 2006;20:329–334. doi: 10.1892/0891-6640(2006)20[329:uopcrf]2.0.co;2. [DOI] [PubMed] [Google Scholar]
- Leong A.S.Y., Suthipintawong C., Vinyuvat S. Immunostaining of cytologic preparations: a review of technical problems. Appl Immunohistochem Mol Morphol. 1999;7:214–220. [Google Scholar]
- Letard S., Yang Y., Hanssens K. Gain-of-function mutations in the extracellular domain of KIT are common in canine mast cell tumors. Mol Cancer Res. 2008;6:1137–1345. doi: 10.1158/1541-7786.MCR-08-0067. [DOI] [PubMed] [Google Scholar]
- Litlekalsoy J., Vatne V., Hostmark J.G. Immunohistochemical markers in urinary bladder carcinomas from paraffin-embedded archival tissue after storage for 5-70 years. BJU Int. 2007;99:1013–1019. doi: 10.1111/j.1464-410X.2006.06699.x. [DOI] [PubMed] [Google Scholar]
- London C.A., Malpas P.B., Wood-Follis S.L. Multi-center, placebo-controlled, double-blind, randomized study of oral toceranib phosphate (SU11654), a receptor tyrosine kinase inhibitor, for the treatment of dogs with recurrent (either local or distant) mast cell tumor following surgical excision. Clin Cancer Res. 2009;15:3856–3865. doi: 10.1158/1078-0432.CCR-08-1860. [DOI] [PubMed] [Google Scholar]
- Long S., Argyle D.J., Nixon C. Telomerase reverse transcriptase (TERT) expression and proliferation in canine brain tumors. Neuropathol Appl Neurobiol. 2006;32:662–673. doi: 10.1111/j.1365-2990.2006.00776.x. [DOI] [PubMed] [Google Scholar]
- Mackay B. Electron microscopy in tumor diagnosis. In: Fletcher C.D.M., editor. Diagnostic histopathology of tumors. ed 3. Churchill Livingstone; New York: 2007. pp. 1831–1859. [Google Scholar]
- Madewell B.R. Cellular proliferation in tumors: a review of methods, interpretation, and clinical applications. J Vet Intern Med. 2001;15:334–340. [PubMed] [Google Scholar]
- Maleszewski J., Lu J., Fox-Talbot K. Robust immunohistochemical staining of several classes of proteins in tissues subjected to autolysis. J Histochem Cytochem. 2007;55:597–606. doi: 10.1369/jhc.6A7152.2007. [DOI] [PubMed] [Google Scholar]
- Marconato L., Zorzan E., Giantin M. Concordance of c-kit mutational status in matched primary and metastatic cutaneous canine mast cell tumors at baseline. J Vet Intern Med. 2014;28:547–553. doi: 10.1111/jvim.12266. [DOI] [PMC free article] [PubMed] [Google Scholar]
- Martini V., Poggi A., Riondato F. Flow-cytometric detection of phenotypic aberrancies in canine small clear cell lymphoma. Vet Comp Oncol Published on line. 2013;5:31. doi: 10.1111/vco.12043. [DOI] [PubMed] [Google Scholar]
- McDonough S.P., Moore P.F. Clinical, hematologic, and immunophenotypic charcterization of canine large granular lymphocytosis. Vet Pathol. 2000;37:637–646. doi: 10.1354/vp.37-6-637. [DOI] [PubMed] [Google Scholar]
- McGavin M.D. Factors affecting visibility of a target tissue in histologic sections. Vet Pathol. 2014;51:9–27. doi: 10.1177/0300985813506916. [DOI] [PubMed] [Google Scholar]
- Mengel M., Wasielewski R., Wiese B. Inter-laboratory and inter-observer reproducibility of immunohistochemical assessment of the Ki-67 labelling index in a large multi-centre trial. J Pathol. 2002;198:292–299. doi: 10.1002/path.1218. [DOI] [PubMed] [Google Scholar]
- Miller R.T. Proceedings of the American Academy of Oral Maxillofacial Pathology Annual Meeting. San Juan; Puerto Rico: 2011. What every pathologist needs to know about technical immunohistochemistry (or how to avoid “immune confusion”) April 30. [Google Scholar]
- Miller R.T., Kubier P. Immunohistochemistry on cytologic specimens and previously stained slides (when no paraffin block is available) J Histotechnol. 2002;25:251–257. [Google Scholar]
- Mimura T., Ito A., Sakuma T. Novel marker D2-40, combined with calretinin, CEA, and TTF-1: an optimal set of immunodiagnostic markers for pleural mesothelioma. Cancer. 2007;109:933–938. doi: 10.1002/cncr.22477. [DOI] [PubMed] [Google Scholar]
- Mittelbronn M., Dietz K., Simon P. Albumin in immunohistochemistry: foe and friend. Appl Immunohistochem Mol Morphol. 2006;14:441–444. doi: 10.1097/01.pai.0000203040.79156.70. [DOI] [PubMed] [Google Scholar]
- Miyata-Takata T., Takata K., Yamanouchi S. Detection of T-cell receptor gamma gene rearrangement in paraffin-embedded T or natural killer/T-cell lymphoma samples using the BIOMED-2 protocol. Leuk Lymphoma. 2014;55:2161–2164. doi: 10.3109/10428194.2013.871634. [DOI] [PubMed] [Google Scholar]
- Mochizuki H., Nakamura K., Sato H. Multiplex PCR and Genescan analysis to detect immunoglobulin heavy chain gene rearrangement in feline B-cell neoplasms. Vet Immunol Immunopathol. 2011;143:38–45. doi: 10.1016/j.vetimm.2011.05.030. [DOI] [PubMed] [Google Scholar]
- Mochizuki H., Nakamura K., Sato H. GeneScan analysis to detect clonality of T-cell receptor gamma gene rearrangement in feline lymphoid neoplasms. Vet Immunol Immunopathol. 2012;145:402–409. doi: 10.1016/j.vetimm.2011.12.015. [DOI] [PubMed] [Google Scholar]
- Moore P.F., Rodriguez-Bertos A., Kass P.H. Feline gastrointestinal lymphoma: mucosal architecture, immunophenotype, and molecular clonality. Vet Pathol. 2012;49:658–668. doi: 10.1177/0300985811404712. [DOI] [PubMed] [Google Scholar]
- Moore P.F., Woo J.C., Vernau W. Characterization of feline T cell receptor gamma (TCRG) variable region genes for the molecular diagnosis of feline intestinal T cell lymphoma. Vet Immunol Immunopathol. 2005;106:167–178. doi: 10.1016/j.vetimm.2005.02.014. [DOI] [PubMed] [Google Scholar]
- Morini M., Bettini G., Morandi F. Deciduoid peritoneal mesothelioma in a dog. Vet Pathol. 2006;43:198–201. doi: 10.1354/vp.43-2-198. [DOI] [PubMed] [Google Scholar]
- Murakami Y., Tateyawa S., Uchida K. Immunohistochemical analysis of cyclins in canine normal testes and testicular tumors. J Vet Med Sci. 2001;63:909–912. doi: 10.1292/jvms.63.909. [DOI] [PubMed] [Google Scholar]
- Pang L.Y., Argyle D. Cancer stem cells and telomerase as potential biomarkers in veterinary oncology. Vet J. 2010;185:15–22. doi: 10.1016/j.tvjl.2010.04.008. [DOI] [PubMed] [Google Scholar]
- Polak J.M., Van Noorden S. ed 3. Garland Science/BIOS Scientific Publishers; Oxford: 2003. Introduction to immunocytochemistry. [Google Scholar]
- Ponce F., Magnol J.P., Ledieu D. Prognostic significance of morphological subtypes in canine malignant lymphomas during chemotherapy. Vet J. 2004;167:158–166. doi: 10.1016/j.tvjl.2003.10.009. [DOI] [PubMed] [Google Scholar]
- Prophet E.B., editor. AFIP laboratory methods in histotechnology. American Registry of Pathology; Washington DC: 1992. [Google Scholar]
- Ramos-Vara J.A. Immunohistochemical methods. In: Howard G.C., Kaser M.R., editors. Making and using antibodies: a practical handbook. ed 2. CRC Press; Boca Raton: 2013. pp. 303–341. [Google Scholar]
- Ramos-Vara J.A. Technical aspects of immunohistochemistry. Vet Pathol. 2005;42:405–426. doi: 10.1354/vp.42-4-405. [DOI] [PubMed] [Google Scholar]
- Ramos-Vara J.A., Beissenherz M.E. Optimization of immunohistochemical methods using two different antigen retrieval methods on formalin-fixed, paraffin-embedded tissues: experience with 63 markers. J Vet Diagn Invest. 2000;12:307–311. doi: 10.1177/104063870001200402. [DOI] [PubMed] [Google Scholar]
- Ramos-Vara J.A., Beissenherz M.E., Miller M.A. Immunoreactivity of A103, an antibody to Melan-A, in canine steroid-producing tissues and their tumors. J Vet Diagn Invest. 2001;13:328–332. doi: 10.1177/104063870101300408. [DOI] [PubMed] [Google Scholar]
- Ramos-Vara J.A., Beissenherz M.E., Miller M.A. Retrospective study of 338 canine oral melanomas with clinical, histologic, and immunohistochemical review of 129 cases. Vet Pathol. 2000;37:597–608. doi: 10.1354/vp.37-6-597. [DOI] [PubMed] [Google Scholar]
- Ramos-Vara J.A., Kiupel M., Baszler T. Suggested guidelines for immunohistochemical techniques in veterinary diagnostic laboratories. J Vet Diagn Invest. 2008;20:393–413. doi: 10.1177/104063870802000401. [DOI] [PubMed] [Google Scholar]
- Ramos-Vara J.A., Miller M.A. Immunohistochemical characterization of canine intestinal epithelial and mesenchymal tumors with a monoclonal antibody to hepatocyte paraffin 1 (Hep Par 1) Histochem J. 2002;34:397–401. doi: 10.1023/a:1023683404230. [DOI] [PubMed] [Google Scholar]
- Ramos-Vara J.A., Miller M.A. Immunohistochemical detection of protein gene product 9.5 (PGP 9.5) in canine epitheliotropic T-cell lymphoma (mycosis fungoides) Vet Pathol. 2007;44:74–79. doi: 10.1354/vp.44-1-74. [DOI] [PubMed] [Google Scholar]
- Ramos-Vara J.A., Miller M.A. When tissue antigens and antibodies get along: revisiting the technical aspects of immunohistochemistry, the red, brown, and blue technique. Vet Pathol. 2014;51:42–87. doi: 10.1177/0300985813505879. [DOI] [PubMed] [Google Scholar]
- Ramos-Vara J.A., Miller M.A., Boucher M. Immunohistochemical detection of uroplakin III, cytokeratin 7, and cytokeratin 20 in canine urothelial tumors. Vet Pathol. 2003;40:55–62. doi: 10.1354/vp.40-1-55. [DOI] [PubMed] [Google Scholar]
- Ramos-Vara J.A., Miller M.A., Johnson G.C. Immunohistochemical characterization of canine hyperplastic hepatic lesions and hepatocellular and biliary neoplasms with monoclonal antibody hepatocyte paraffin 1 and a monoclonal antibody to cytokeratin 7. Vet Pathol. 2001;38:636–643. doi: 10.1354/vp.38-6-636. [DOI] [PubMed] [Google Scholar]
- Ramos-Vara J.A., Miller M.A., Johnson G.C. Immunohistochemical detection of thyroid transcription factor-1, thyroglobulin, and calcitonin in canine normal, hyperplastic, and neoplastic thyroid gland. Vet Pathol. 2002;39:480–487. doi: 10.1354/vp.39-4-480. [DOI] [PubMed] [Google Scholar]
- Ramos-Vara J.A., Miller M.A., Johnson G.C. Melan A and S100 protein immunohistochemistry in feline melanomas: 48 cases. Vet Pathol. 2002;39:127–132. doi: 10.1354/vp.39-1-127. [DOI] [PubMed] [Google Scholar]
- Ramos-Vara J.A., Miller M.A., Johnson G.C. Usefulness of thyroid transcription factor-1 immunohistochemical staining in the differential diagnosis of primary pulmonary tumors of dogs. Vet Pathol. 2005;42:315–320. doi: 10.1354/vp.42-3-315. [DOI] [PubMed] [Google Scholar]
- Ramos-Vara J.A., Miller M.A., Valli V.E.O. Immunohistochemical detection of multiple myeloma 1/interferon regulatory factor 4 (MUM1/IRF-4) in canine plasmacytoma: comparison with CD79a and CD20. Vet Pathol. 2007;44:875–884. doi: 10.1354/vp.44-6-875. [DOI] [PubMed] [Google Scholar]
- Rao S., Lana S., Eickhoff J. Class II major histocompatibility complex expression and cell size independently predict survival in canine B-cell lymphoma. J Vet Intern Med. 2011;25:1097–1105. doi: 10.1111/j.1939-1676.2011.0767.x. [DOI] [PubMed] [Google Scholar]
- Reguera M.J., Rabanal R.M., Puigdemont A. Canine mast cell tumors express stem cell factor receptor. Am J Dermatopathol. 2000;22:49–54. doi: 10.1097/00000372-200002000-00010. [DOI] [PubMed] [Google Scholar]
- Reid V., Doherty J., McIntosh G. The first quantitative comparison of immunohistochemical rabbit and mouse monoclonal antibody affinities using Biacore analysis. J Histotechnol. 2007;30:177–182. [Google Scholar]
- Rhodes A. Quality assurance of immunocytochemistry and molecular morphology. In: Hacker G.W., Tubbs R.R., editors. Molecular morphology in human tissues: techniques and applications. CRC Press; Boca Raton: 2005. pp. 275–293. [Google Scholar]
- Roccabianca P., Vernau W., Caniatti M. Feline large granular lymphocyte (LGL) lymphoma with secondary leukemia: primary intestinal origin with predominance of a CD3/CD8aa phenotype. Vet Pathol. 2006;43:15–28. doi: 10.1354/vp.43-1-15. [DOI] [PubMed] [Google Scholar]
- Roels S., Tilmant K., Ducatelle R. PCNA and Ki67 proliferation markers as criteria for prediction of clinical behavior of melanocytic tumors in cats and dogs. J Comp Pathol. 1999;121:13–24. doi: 10.1053/jcpa.1998.0291. [DOI] [PubMed] [Google Scholar]
- Roh M.H., Schmidt L., Placido J. The application and diagnostic utility of immunocytochemistry on direct smears in the diagnosis of pulmonary adenocarcinoma and squamous cell carcinoma. Diagn Cytopathol. 2012;40:949–955. doi: 10.1002/dc.21680. [DOI] [PubMed] [Google Scholar]
- Ruslander D.A., Gebhard D.H., Tompkins M.B. Immunophenotypic characterization of canine lymphoproliferative disorders. In vivo. 1997;11:169–172. [PubMed] [Google Scholar]
- Sakai H., Noda A., Shirai N. Proliferative activity of canine mast cell tumors evaluated by bromodeoxyuridine incorporation and Ki-67 expression. J Comp Pathol. 2002;127:233–238. doi: 10.1053/jcpa.2002.0586. [DOI] [PubMed] [Google Scholar]
- Sato T., Miyoshi T., Shibuya H. Peritoneal biphasic mesothelioma in a dog. J Vet Med A. 2005;52:22–25. doi: 10.1111/j.1439-0442.2004.00680.x. [DOI] [PubMed] [Google Scholar]
- Scase T.J., Edwards D., Miller J. Canine mast cell tumors: correlation of apoptosis and proliferation markers with prognosis. J Vet Intern Med. 2006;20:151–158. doi: 10.1892/0891-6640(2006)20[151:cmctco]2.0.co;2. [DOI] [PubMed] [Google Scholar]
- Seelig D.M., Avery P., Webb T. Canine T-zone lymphoma: unique immunophenotypic features, outcome, and population characteristics. J Vet Intern Med. 2014;28:878–886. doi: 10.1111/jvim.12343. [DOI] [PMC free article] [PubMed] [Google Scholar]
- Shi S.-R., Shi Y., Taylor C.R. Antigen retrieval immunohistochemistry: a review and future prospects in research and diagnosis over two decades. J Histochem Cytochem. 2011;59:13–32. doi: 10.1369/jhc.2010.957191. [DOI] [PMC free article] [PubMed] [Google Scholar]
- Shtilbans V., Szporn A.H., Wu M. p63 immunostaining in destained bronchoscopic cytological specimens. Diagn Cytopathol. 2005;32:198–203. doi: 10.1002/dc.20217. [DOI] [PubMed] [Google Scholar]
- Skoog L., Tani E. Immunocytochemistry: an indispensable technique in routine cytology. Cytopathology. 2011;22:215–229. doi: 10.1111/j.1365-2303.2011.00887.x. [DOI] [PubMed] [Google Scholar]
- Stoica G., Cohen N., Mendes O. Use of immunohistochemical marker calretinin in the diagnosis of a diffuse malignant metastatic mesothelioma in an equine. J Vet Diagn Invest. 2004;16:240–243. doi: 10.1177/104063870401600313. [DOI] [PubMed] [Google Scholar]
- Stone B.M., Gan D. Application of the tissue transfer technique in veterinary cytopathology. Vet Clin Pathol. 2014;43:295–302. doi: 10.1111/vcp.12138. [DOI] [PubMed] [Google Scholar]
- Sundram U., Kim Y., Mraz-Gernhard S. Expression of the bcl-6 and MUM1/IRF4 proteins correlate with overall and disease-specific survival in patients with primary cutaneous large B-cell lymphoma: a tissue microarray study. J Clin Pathol. 2005;32:227–234. doi: 10.1111/j.0303-6987.2005.00298.x. [DOI] [PubMed] [Google Scholar]
- Suthipintawong C., Leong A.S.Y., Vinyuvat S. Immunostaining of cell preparations: a comparative evaluation of common fixatives and protocols. Diagn Cytopathol. 1996;15:167–174. doi: 10.1002/(SICI)1097-0339(199608)15:2<167::AID-DC17>3.0.CO;2-F. [DOI] [PubMed] [Google Scholar]
- Suthipintawong C., Leong A.S.Y., Chan K.-W. Immunostaining of estrogen receptor, progesterone receptor, MIb1 antigen, and c-erbB-2 oncoprotein in cytologic specimens: a simplified method with formalin fixation. Diagn Cytopathol. 1997;17:127–133. doi: 10.1002/(sici)1097-0339(199708)17:2<127::aid-dc8>3.0.co;2-d. [DOI] [PubMed] [Google Scholar]
- Suter S.E., Small G.W., Seiser E.L. FLT3 mutations in canine acute lymphocytic leukemia. BMC Cancer. 2011;11:38–46. doi: 10.1186/1471-2407-11-38. [DOI] [PMC free article] [PubMed] [Google Scholar]
- Suvarna S.K., Layton C., Bancroft J.D. ed 7. Churchill Livingstone; Edinburgh: 2013. Bancroft’s theory and practice of histological techniques. [Google Scholar]
- Swerdlow S.H. Genetic and molecular genetic studies in the diagnosis of atypical lymphoid hyperplasias versus lymphoma. Human Pathol. 2003;34:346–351. doi: 10.1053/hupa.2003.95. [DOI] [PubMed] [Google Scholar]
- Szczepanski T., van der Velden V.H.J., Van Dongen J.J. Flow-cytometric immunophenotyping of normal and malignant lymphocytes. Clin Chem Lab Med. 2006;44:775–796. doi: 10.1515/CCLM.2006.146. [DOI] [PubMed] [Google Scholar]
- Taylor B.E., Leibman N.F., Luong R. Detection of carcinoma micrometastases in bone marrow of dogs and cats using conventional and cell block cytology. Vet Clin Pathol. 2013;42:85–91. doi: 10.1111/vcp.12011. [DOI] [PubMed] [Google Scholar]
- Teske E., van heerde P., Rutteman G.R. Pronostic factors for treatment of malignant lymphoma in dogs. J Am Vet Med Assoc. 1994;205:1722–1728. [PubMed] [Google Scholar]
- Thomas R., Seiser E.L., Motsinger-Reif A. Refining tumor-associated aneuploidy through ‘genomic recoding’ of recurrent DNA copy number aberrations in 150 canine non-Hodgkin lymphomas. Leuk Lymphoma. 2011;52:1321–1335. doi: 10.3109/10428194.2011.559802. [DOI] [PMC free article] [PubMed] [Google Scholar]
- Valli V., Peters E., Williams C. Optimizing methods in immunocytochemistry: one laboratory’s experience. Vet Clin Pathol. 2009;38:261–269. doi: 10.1111/j.1939-165X.2009.00119.x. [DOI] [PubMed] [Google Scholar]
- Valli V.E., Vernau W., de Lorimier L.-P. Canine indolent nodular lymphoma. Vet Pathol. 2006;43:241–256. doi: 10.1354/vp.43-3-241. [DOI] [PubMed] [Google Scholar]
- Van der Loos C.M. A focus on fixation. Biotech Histochem. 2007;82:141–154. doi: 10.1080/10520290701375302. [DOI] [PubMed] [Google Scholar]
- van Dongen J.J., Langerak A.W., Bruggemann M. Design and standardization of PCR primers and protocols for detection of clonal immunoglobulin and T-cell receptor gene recombinations in suspect lymphoproliferations: report of the BIOMED-2 Concerted Action BMH4-CT98-3936. Leukemia. 2003;17:2257–2317. doi: 10.1038/sj.leu.2403202. [DOI] [PubMed] [Google Scholar]
- van Krieken J.H., Langerak A.W., San Miguel J.F. Clonality analysis for antigen receptor genes: preliminary results from the Biomed-2 concerted action PL 96-3936. Human Pathol. 2003;34:359–361. doi: 10.1053/hupa.2003.99. [DOI] [PubMed] [Google Scholar]
- Varma M., Linden M.D., Amin M.B. Effect of formalin fixation and epitope retrieval techniques on antibody 34βE12 immunostaining of prostatic tissues. Mod Pathol. 1999;12:472–478. [PubMed] [Google Scholar]
- Varsegi G.M., Shidham V. Cell block preparation from cytology specimen with predominance of individually scattered cells. J Visual Exper. 2009;29:e1316. doi: 10.3791/1316. [DOI] [PMC free article] [PubMed] [Google Scholar]
- Vernau W., Moore P.F. An immunophenotypic study of canine leukemias and preliminary assessment of clonality by polymerase chain reaction. Vet Immunol Immunopathol. 1999;69:145–164. doi: 10.1016/s0165-2427(99)00051-3. [DOI] [PubMed] [Google Scholar]
- Vezzali E., Parodi A.L., Marcato P.S. Histopathologic classification of 171 cases of canine and feline non-Hodgkin lymphoma according to the WHO. Vet Comp Oncol. 2010;8:38–49. doi: 10.1111/j.1476-5829.2009.00201.x. [DOI] [PubMed] [Google Scholar]
- Vilches-Moure J.G., Ramos-Vara J.A. Comparison of rabbit monoclonal and mouse monoclonal antibodies in immunohistochemistry in canine tissues. J Vet Diagn Invest. 2005;17:346–350. doi: 10.1177/104063870501700407. [DOI] [PubMed] [Google Scholar]
- Villiers E., Baines S., Law A.M. Identification of acute myeloid leukemia in dogs using flow cytometry with myeloperoxidase, MAC387, and a canine neutrophil-specific antibody. Vet Clin Pathol. 2006;35:55–71. doi: 10.1111/j.1939-165x.2006.tb00089.x. [DOI] [PubMed] [Google Scholar]
- Vosse B.A.H., Seelentag W., Bachmann A. Background staining of visualization systems in immunohistochemistry. Comparison of the avidin-biotin complex system and the EnVision+system. Appl Immunohistochem Mol Morphol. 2007;15:103–107. doi: 10.1097/01.pai.0000213102.33816.13. [DOI] [PubMed] [Google Scholar]
- Vural S.A., Ozyldilz Z., Ozsoy S.Y. Pleural mesothelioma in a nine-month-old dog. Irish Vet J. 2007;60:30–33. doi: 10.1186/2046-0481-60-1-30. [DOI] [PMC free article] [PubMed] [Google Scholar]
- Webster J.D., Miller M.A., DuSold D. Effects of prolonged formalin-fixation on diagnostic immunohistochemistry in domestic animals. J Histochem Cytochem. 2009;57:753–761. doi: 10.1369/jhc.2009.953877. [DOI] [PMC free article] [PubMed] [Google Scholar]
- Webster J.D., Miller M.A., DuSold D. Effects of prolonged formalin fixation on the immunohistochemical detection of infectious agents in formalin-fixed, paraffin-embedded tissues. Vet Pathol. 2010;47:529–535. doi: 10.1177/0300985809359607. [DOI] [PubMed] [Google Scholar]
- Webster J.D., Yuzbasiyan-Gurkan V., Miller R.A. Cellular proliferation in canine cutaneous mast cell tumors: associations with c-KIT and its role in prognostication. Vet Pathol. 2007;44:298–308. doi: 10.1354/vp.44-3-298. [DOI] [PubMed] [Google Scholar]
- Webster J.D., Yuzbasiyan-Gurkan V., Trosko J.E. Expression of the embryonic transcription factor OCT4 in canine neoplasms: a potential marker for stem cell subpopulations in neoplasia. Vet Pathol. 2007;44:893–900. doi: 10.1354/vp.44-6-893. [DOI] [PubMed] [Google Scholar]
- Weiser M.G., Thrall M.A., Fulton R. Granular lymphocytosis and hyperproteinemia in dogs with chronic Ehrlichiosis. J Am Anim Hosp Assoc. 1991;27:84–88. [Google Scholar]
- Werner J.A., Woo J.C., Vernau W. Characterization of feline immunoglobulin heavy chain variable region genes for the molecular diagnosis of B-cell neoplasia. Vet Pathol. 2005;42:596–607. doi: 10.1354/vp.42-5-596. [DOI] [PubMed] [Google Scholar]
- Wilkerson M.J., Dolce K., Koopman T. Lineage differentiation of canine lymphoma/leukemias and aberrant expressin of CD molecules. Vet Immunol Immunopathol. 2005;106:179–196. doi: 10.1016/j.vetimm.2005.02.020. [DOI] [PubMed] [Google Scholar]
- Williams M.J., Avery A.C., Lana S.E. Canine lymphoproliferative disease characterized by lymphocytosis: immunophenotypic markers of prognosis. J Vet Intern Med. 2008;22:596–601. doi: 10.1111/j.1939-1676.2008.0041.x. [DOI] [PubMed] [Google Scholar]
- Woods A.E., Stirling J.W. Transmission electron microscopy. In: Suvarna K.S., Layton C., Bancroft J.D., editors. Bancroft’s theory and practice of histological techniques. ed 7. Churchill Livingstone; Edinburgh: 2013. pp. 493–538. [Google Scholar]
- Workman H.C., Vernau W. Chronic lymphocytic leukemia in dogs and cats: the veterinary perspective. Vet Clin North Am Sm Anim Pract. 2003;33:1379–1399. doi: 10.1016/s0195-5616(03)00120-7. [DOI] [PubMed] [Google Scholar]
- Yamazaki J., Baba K., Goto-Koshino Y. Quantitative assessment of minimal residual disease (MRD) in canine lymphoma by using real-time polymerase chain reaction. Vet Immunol Immunopathol. 2008;126:321–331. doi: 10.1016/j.vetimm.2008.09.004. [DOI] [PubMed] [Google Scholar]
- Yaziji H., Barry T. Diagnostic immunohistochemistry: what can go wrong? Adv Anat Pathol. 2006;13:238–246. doi: 10.1097/01.pap.0000213041.39070.2f. [DOI] [PubMed] [Google Scholar]
- Zavodovskaya R., Chien M.B., London C.A. Use of kit internal tandem duplications to establish mast cell tumor clonality in 2 dogs. J Vet Intern Med. 2004;18:915–917. doi: 10.1892/0891-6640(2004)18<915:uokitd>2.0.co;2. [DOI] [PubMed] [Google Scholar]
- Zhang P.J., Wang H., Wrona E.L. Effects of tissue fixatives on antigen preservation for immunohistochemistry: a comparative study of microwave antigen retrieval on Lillie fixative and neutral buffered formalin. J Histotechnol. 1998;21:101–106. [Google Scholar]
- Zhang Z., Zhao L., Guo H. Diagnostic significance of immunocytochemistry on fine needle aspiration biopsies processed by thin-layer cytology. Diagn Cytopathol. 2012;240:1071–1076. doi: 10.1002/dc.21736. [DOI] [PubMed] [Google Scholar]
- Zucca E., Bertoni F., Roggero E. Molecular analysis of the progression from Helicobacter pylori-associated chronic gastritis to mucosa-associated lymphoid-tissue lymphoma of the stomach. N Engl J Med. 1998;338:804–810. doi: 10.1056/NEJM199803193381205. [DOI] [PubMed] [Google Scholar]