

Abstract
Advances in understanding the pathophysiology of facioscapulohumeral dystrophy (FSHD) have led to the discovery of candidate therapeutics, and it is important to identify markers of disease activity to inform clinical trial design. For drugs that inhibit DUX4 expression, measuring DUX4 or DUX4-target gene expression might be an interim measure of drug activity; however, only a subset of FHSD muscle biopsies shows evidence of DUX4 expression. Our prior study showed that MRI T2-STIR-positive muscles had a higher probability of showing DUX4 expression than muscles with normal MRI characteristics. In the current study, we performed a 1-year follow-up assessment of the same muscle with repeat MRI and muscle biopsy. There was little change in MRI characteristics over the 1-year period and, similar to the initial evaluation, MRI T2-STIR-postive muscles had a higher expression of DUX4-regulated genes, as well as genes associated with inflammation, extracellular matrix and cell cycle. Compared to the initial evaluation, overall the level of expression in these gene categories remained stable over the 1-year period; however, there was some variability for each individual muscle biopsied. The pooled data from both the initial and 1-year follow-up evaluations identified several FSHD subgroups based on gene expression, as well as a set of genes—composed of DUX4-target genes, inflammatory and immune genes and cell cycle control genes—that distinguished all of the FSHD samples from the controls. These candidate markers of disease activity need to be replicated in independent datasets and, if validated, may provide useful measures of disease progression and response to therapy.
Introduction
Facioscapulohumeral dystrophy (FSHD) is caused by the misexpression of the DUX4 transcription factor in skeletal muscle (1). DUX4 is normally expressed in the testis, most likely in the germline, and in the early embryo (2–4), where it activates expression of a portion of the first wave of zygotic gene activation. Many of the DUX4 regulated genes have potential roles in stem cell and germ cell function, and the misexpression of this gene network in skeletal muscle might cause disease pathology through multiple mechanisms. Because there is no known requirement for DUX4 expression in somatic tissues, drugs that inhibit the expression of DUX4 might be effective therapies for FSHD.
Indeed, several drug classes that inhibit DUX4 expression have been identified, including p38 inhibitors, inhibitors of BET proteins and beta2-adrenergic agonists (5, 6). Each of these classes has drugs already approved for human therapy or has completed advanced phase clinical trials with little signs of toxicity. This makes it critical to develop reliable measures of DUX4 expression in FSHD muscle and assess their utility as measures of response to treatment.
In our prior study (7), we enrolled 36 FSHD individuals, performed lower extremity MRI and obtained a needle muscle biopsy for histopathology and RNA sequencing. This study showed that muscles with MRI T2-STIR-positive signal had a higher incidence of DUX4-target gene expression compared to MRI normal muscles. In addition, this study identified the expression of genes associated with extracellular matrix, inflammation and complement activation as markers of FSHD muscle biopsies compared to controls.
To determine the potential utility of these findings for clinical trial design, we performed a 1-year follow-up study that included lower extremity MRI and a repeat biopsy of the same muscle in a similar location. During the 1-year interval, there was very little change in the MRI characteristics for all participants. In the study population overall, the level of expression of DUX4-target, extracellular matrix and inflammation-related genes remained relatively stable; however, some individual paired samples showed greater variance. We also pooled the first and follow-up samples to discover a set of genes that separate all of the FSHD samples, including the mildly affected and MRI normal samples, from controls that include DUX4-regulated genes, inflammatory immune genes and cell cycle control genes.
Results
Study cohort
A total of 36 patients were recruited through the Seattle Paul D. Wellstone Muscular Dystrophy Cooperative Research Center. A total of 35 patients (mean age 54, range 19–75; 22 male/13 female; clinical severity score 0–8) underwent muscle biopsy at the first visit. All patients had genetically confirmed FSHD1 and/or 2. A total of 31 patients had muscle biopsies at the second visit. Supplementary Material Tables S1 and S2 present individual subject characteristics, muscles biopsied, histopathology scores and MRI characteristics from both visits. RNA-seq was performed on 28 out of the 31 follow-up biopsies, with three samples excluded because of low muscle biopsy quality (fibrofatty or connective tissue only) and quantity. An additional sample (32-0008b) was excluded because RNA-seq analysis showed it to be an outlier relative to the other samples (Supplementary Material, Fig. S1)—with very low muscle gene expression and high adipose gene expression (including EGFL6, CSN1S1, SAA1 and LEP)—and histology that showed only fibrofatty tissue.
The same RNA-seq dataset from unaffected control muscle biopsies that was used in the first visit analysis (7) was used for comparison in this study. The control samples were collected from the quadriceps of six females and three males with a mean age of 35 years (range, 19–56 years) at the University of Rochester. One of the control samples that was included in the prior analysis (01-0047) was removed from the current study because this sample was an outlier relative to the other control samples and subsequent review of the subject records showed muscle weakness on exam and abnormal muscle pathology, indicating that this sample was incorrectly included in the normal control biopsy dataset in our earlier study.
DUX4 candidate biomarkers are elevated in FSHD biopsy samples
For the follow-up visit RNA-seq analysis, the gene expression matrices of the 27 FSHD biopsy samples and eight control samples were normalized together. Consistent with the first-year RNA-seq analysis, the four DUX4 biomarkers (LEUTX, KHDC1L, PRAMEF2 and TRIM43) were elevated in most FSHD samples (Fig. 1) (7, 8). Ten FSHD samples showed read counts for the four biomarker genes comparable to the low or background levels in the control samples, whereas the remaining 17 of the 27 (63%) FSHD samples showed increased expression that ranged from moderate to high levels (Supplementary Material, Table S3).
Figure 1.
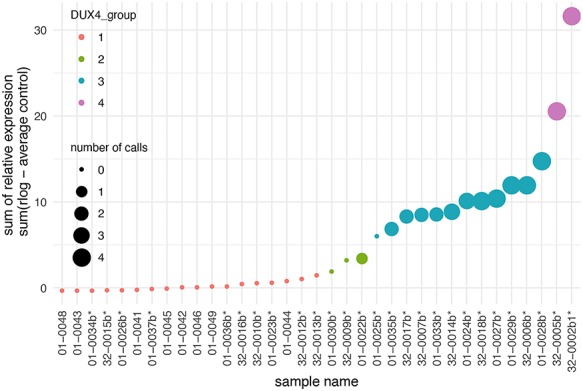
Relative expression of four candidate biomarkers in muscle biopsies from control and follow-up visit FSHD muscles. The sum of the relative expression of four DUX4-regulated genes (LEUTX, KHDC1L, TRIM43 and PRAMEF2) was plotted for each RNA-seq sample. The FSHD biopsies from follow-up visit are indicated by an asterisk (*), whereas control muscle biopsies do not have an asterisk. The size of the spot reflects the number of candidate biomarkers above a threshold level for considering elevated expression from the controls. The color coding divides the sample into four groups based on the clustering and levels of relative expression for four biomarkers. The second year FSHD samples are denoted by ‘b’, such that sample 01-0034b is the second visit sample of subject 01-0034 and the sample named 32-0002b1 here refers to the 32-0002b sample, as deposited to the GEO series GSE140261.
Based on the four DUX4 biomarkers, hierarchical clustering resulted in four sub-groups, classified as DUX4 Group 1–4 (Fig. 1). Group 1 included the 10 FSHD samples and the eight control samples and had absent-to-low-reads of the biomarkers. Group 2 had three samples with elevated but low read counts for TRIM43 and KHDC1L. Group 3, with 12 samples, had higher DUX4-gene expression with two or three DUX4-regulated genes robustly expressed. Group 4, with two samples, had robust expression of all four biomarkers. Similar results were obtained when grouping based on a larger set of 54 previously described DUX4-regulated candidate biomarkers (Supplementary Material, Fig. S2) (8).
Correlation of DUX4 biomarkers to MRI and histopathology
The DUX4 score, represented by the sum of the relative regularized log (rlog) expression (9) of the four candidate biomarkers, was moderately correlated to the pathology score with Spearman correlation 0.51 (Fig. 2A).
Figure 2.
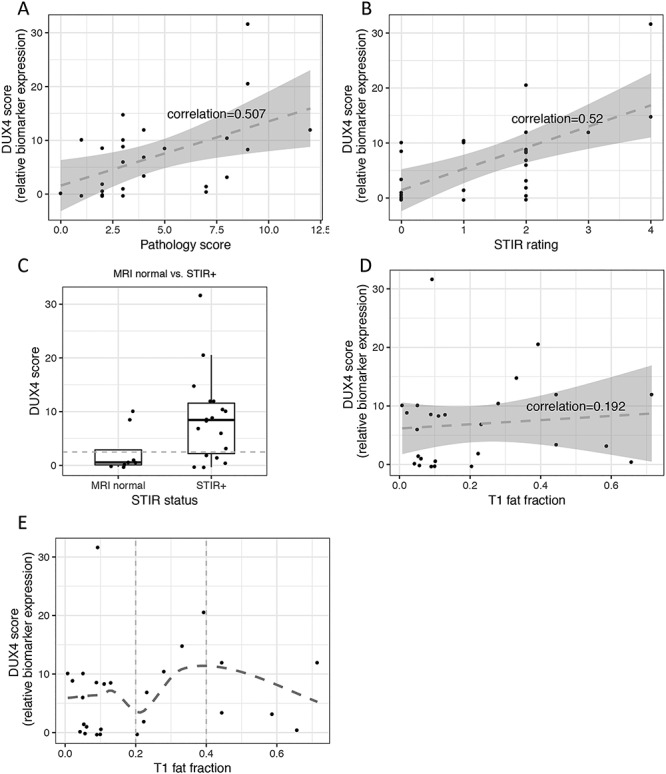
Relation between candidate biomarker expression, pathology score and MRI. The candidate biomarkers’ expression is presented by the sum of the relative expression of the four DUX4 candidate biomarker genes (DUX4 score). (A) DUX4 score versus pathology score scatter plot and linear regression (dashed line) show moderate linear relationship between the two variables. Correlation was computed by Spearman. (B) DUX4 score versus T2-STIR rating scatter plot and linear regression (dashed line) show moderate linear relationship between the two variables. (C) DUX4 score from MRI normal versus T2-STIR-positive: mean (SD) value in FSHD muscle biopsies with normal MRI is 2.56 (4.21 SD) and in muscle biopsies from T2-STIR-positive MRI is 8.69 (8.05 SD); the difference is statistically significant with t-test P-value = 0.03. (D) and (E) show DUX4 score versus T1 fat fraction scatter plots with linear regression and non-linear loose regression, respectively: (D) demonstrates poor linear relationship (dashed line) between DUX4 score and T1 fat fraction, whereas (E) depicts non-linear relationship with a more positive relationship at the mid-range of T1 fat fraction (0.2–0.4).
Similar to our first-year MRI data, the qualitative T2-STIR rating of the biopsied FSHD muscles showed moderate correlation (0.52) to the DUX4 score (Fig. 2B). A total of 13 of 18 (72%) T2-STIR-positive muscles had elevated DUX4 biomarkers (DUX4 score > 2.5). In contrast, only two of seven (28%) MRI-normal muscles had elevated DUX4 scores (01-0024b and 32-0007b). Overall, the mean DUX4 score in MRI normal (2.56 ± 4.21SD) and T2-STIR-positive (8.69 ± 8.05SD) muscles was significantly different (t-test P-value = 0.03, Fig. 2C).
T1 fat fraction correlated poorly with the DUX4 score (spearman correlation = 0.202, Fig. 2D); however, the mid-range of T1 fat fraction (0.2–0.4) displayed a more positive relationship with the DUX4 score compared to higher T1 fat fraction (0.4 and above) (Fig. 2E), possibly due to replacement of muscle tissue by fat at the higher T1 fractions.
Genes associated with extracellular matrix, immune/inflammatory response and immunoglobulins distinguish FSHD from control samples
The principal component analysis (PCA) on the 500 most variable genes of the RNA-seq showed that most, but not all, of the FSHD samples separated from the controls (Fig. 3A). The loading vectors of the PCA indicated that, in addition to DUX4 regulated genes, the set of genes driving the variance among samples was also associated with immune/inflammatory response, immunoglobulins and extracellular matrix. (The top 60 loading variables of the first and second principal components are shown in Supplementary Material, Fig. S3.) This suggested that genes in addition to the DUX4-target genes might increase the power in discriminating the FSHD from the control samples. For example, Figure 3B shows that four of the top loading variables of the first principal component (PC1) have elevated expression in the FSHD Group 1 and Group 2 samples that had absent-or-low DUX4-regulated gene expression. Clustering using selected top loading variables of PC1 and PC2 representing DUX4-regulated, extracellular matrix, immune/inflammatory response, cell cycle and immunoglobulins separated the FSHD samples from controls (Fig. 3C), except for a single FSHD sample, 01-0036b with normal histopathology and MRI signals.
Figure 3.
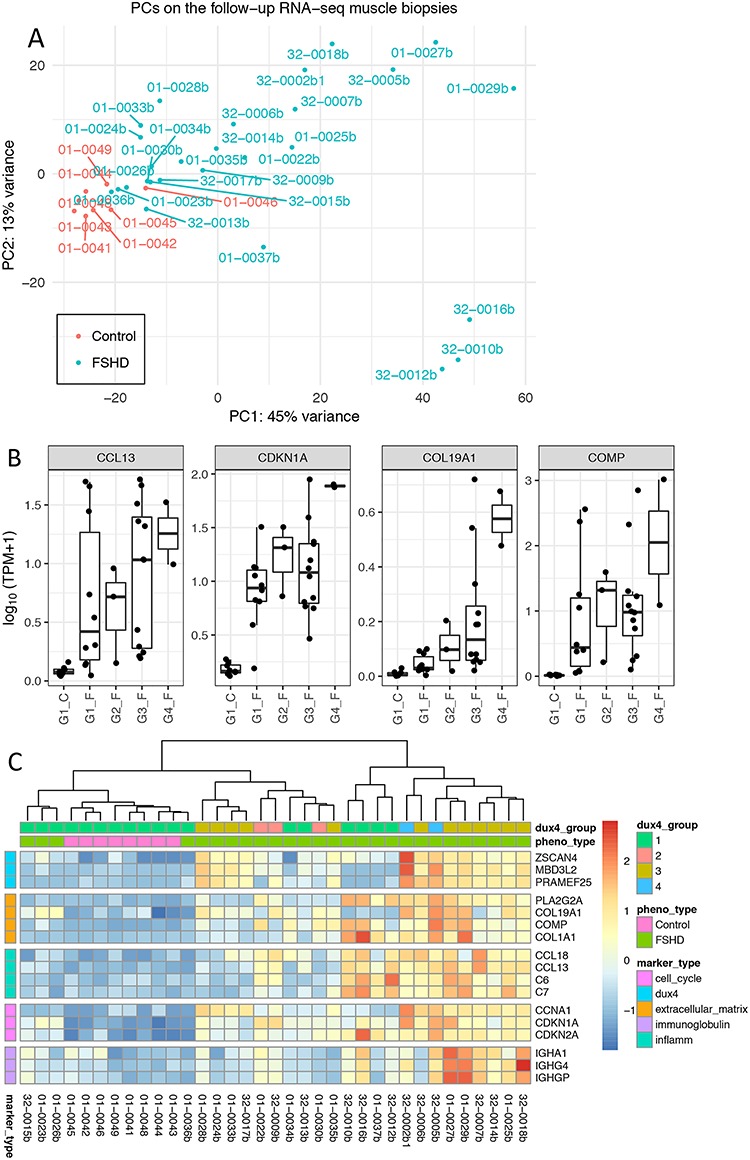
Principal component analysis on the follow-up RNA-seq FSHD biopsies and the controls revealed major genes that contribute to the sample variance. (A) First versus second principal components scatter plot illustrates heterogeneous gene expression in muscle biopsies. (B) Gene expression (TPM) of the four top loading variables of PC1 for each group of the follow-up RNA-seq biopsy samples. Group 1 (G1) samples were characterized with absent-or-low DUX4-regulated expression, whereas G4 samples with highly elevated expression levels. The four top loading variables CCL13, CDKN1A, COL19A1 and COMP exhibited elevated expression in FSHD samples with low-or-absent DUX4-regulated expression (G1 and G2). TPM, transcripts per million. (C) Expression of top loading variables of PC1 and PC2 representing five categories of functions: DUX4-regulated, extracellular matrix, immune/inflammatory response, cell cycle and immunoglobulins. Color scale represents the z-score of the regularized log expression of the genes. The dendrogram by hierarchical clustering algorithm divides the controls and FSHD biopsy samples, except one mildly affected muscle biopsy, 01-0036b with normal histopathology and MRI signals.
Longitudinal changes over two visits
Comparing the first visit pathology scores to the 1-year follow-up visit, there was a trend toward lower scores overall. The median overall pathology scores shifted from 5 to 3 (Fig. 4A), and 14 of 24 paired samples (58%) had slightly lower pathology scores at the follow-up visit, whereas six had higher pathology scores (Supplementary Material, Fig. S4A).
Figure 4.
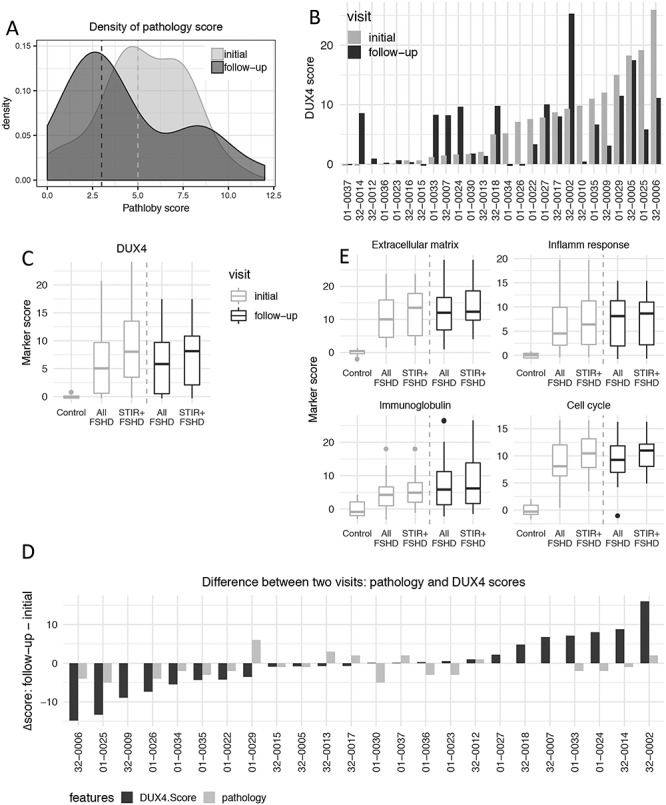
Changes of Histopathology and biomarkers’ expression over two visits. (A) Density estimates the pathology score frequency in the initial (light gray) and 1-year follow-up FSHD biopsies (dark gray). The median from the initial and follow-up visits is 3 and 5, respectively. (B) DUX4 score of paired FSHD muscle biopsies from the initial and 1-year follow-up visits for each individual. (C) DUX4 score comparison between two visits and between all FSHD or T2-STIR-positive FSHD compared to controls. The DUX4 score exhibited elevated DUX4-target expression in all FSHD and T2-STIR-positive FSHD compared to controls in both visits. (D) Pathology (light gray) and DUX4 scores (dark gray) change over the initial and follow-up visits for each individual. Y-axis represents the values of the follow-up visit minus the initial visit. (E) Similar to (C). Extracellular matrix, inflammatory/immune response, immunoglobulin and cell cycle scores comparing all FSHD samples or all T2-STIR-positive FSHD samples to controls over the two visits.
Comparing the first visit to the 1-year follow-up visit, there were few changes in the MRI T2-STIR sequence rating (Table 1 and Supplementary Material, Table S2). Three subjects had an increase in the T2-STIR rating: 01-0029 from STIR 2 to STIR 3; 01-0038 and 01-0022 from STIR 0 to STIR 1 (Table 1). The DUX4 score remained similarly elevated at both time points for 01-0029 and 01-0022, whereas no follow-up sample for RNA-seq was available for 01-0038.
Table 1.
Biopsies whose MRI T2-STIR changed between the two visits
| Visit | T2-STIR | T1 fat fraction | Pathology | DUX4 Score | ||||
|---|---|---|---|---|---|---|---|---|
| Initial | Follow-up | Initial | Follow-up | Initial | Follow-up | Initial | Follow-up | |
| 01-0029 | 2 | 3 | 0.23 | 0.44 | 6 | 12 | 15 | 11 |
| 01-0038 | 0 | 1 | 0.05 | NA | 7 | 6 | NA | NA |
| 01-0022 | 0 | 1 | 0.39 | 0.44 | 6 | 4 | 7 | 3 |
The DUX4 scores were mostly either similar or showed progression from the first visit to the 1-year follow-up visit (Fig. 4B). Only three subjects transitioned from a first visit biopsy with elevated DUX4-target expression to a second visit biopsy with no significant expression of DUX4 targets: 01-0034, 01-0026 and 32-0010 (Table 2). 32-0010 had a normal MRI at both time points and a near-normal pathology score of 2 at the first time point, whereas the second time point the histology showed only connective tissue. 01-0026 and 01-0034 showed an improved pathology score (5-to-1 and 4-to-2, respectively) and stable MRI with T2-STIR signals of 2 and 1, respectively. Four muscles showed a shift from absent or very low-levels of DUX4-target expression to much higher levels: 32-0014, 01-0033, 01-0024 and 32-0007 (Table 3). None of these samples were associated with a higher pathology score or a change in MRI rating, with 01-0024 and 32-0007 maintaining normal MRI appearance. Overall, the FSHD muscles showed similarly elevated DUX4 target levels in the first and second visit samples when comparing all FSHD samples to controls or all T2-STIR-positive samples to controls (Fig. 4C), and comparing individual DUX4-scores showed a moderate correlation (intra-class correlation (ICC) = 0.64; Pearson correlation = 0.46) (Supplementary Material, Fig. S4C). Therefore, while individual muscles showed some fluctuation, the expression of DUX4-targets in the study population remained relatively stable.
Table 2.
FSHD biopsies whose DUX4 expression declined from elevated levels in the initial visit to low-or-absent levels in the follow-up visit
| Visit | T2-STIR | T1 fat fraction | Pathology | DUX4 score | ||||
|---|---|---|---|---|---|---|---|---|
| Initial | Follow-up | Initial | Follow-up | Initial | Follow-up | Initial | Follow-up | |
| 01-0034 | 1 | 1 | 0.04 | 0.09 | 4 | 2 | 5 | 0 |
| 01-0026 | 2 | 2 | 0.11 | 0.1 | 5 | 1 | NA | NA |
| 32-0010a | 0 | 0 | 0.04 | 0.02 | 2 | NA | 10 | 0 |
The follow-up biopsy is mostly connective tissue.
Table 3.
FSHD biopsies whose DUX4 expression increased from low-or-absent levels in the initial visit to elevated levels in the follow-up visit
| Visit | T2-STIR | T1 fat fraction | Pathology | DUX4 score | ||||
|---|---|---|---|---|---|---|---|---|
| Initial | Follow-up | Initial | Follow-up | Initial | Follow-up | Initial | Follow-up | |
| 32-0014 | 2 | 2 | 0.03 | 0.02 | 4 | 3 | 0 | 8 |
| 01-0033 | 2 | 2 | 0.08 | 0.09 | 4 | 2 | 1 | 8 |
| 01-0024 | 0 | 0 | 0.05 | 0.05 | 5 | 3 | 1 | 9 |
| 32-0007 | 0 | 0 | 0.01 | 0.02 | 5 | 5 | 1 | 8 |
Similar to the DUX4-target genes, gene sets representing categories for extracellular matrix, inflammatory response and immunoglobulins were similarly elevated in the first visit and second visit samples when comparing all FSHD samples to controls or all T2-STIR-positive samples to controls (Fig. 4E). On an individual level, most were similar comparing the first and second visit samples (Supplementary Material, Fig. S4B). In general, the direction of change for the DUX4 and overall pathology scores were mostly in the same direction, but a few (15%) were in opposite direction (Fig. 4D).
Classes of RNA-seq biopsy samples
To better identify differences between gene expression in FSHD and control samples and differences between different FSHD samples, we combined the RNA-seq gene expression matrices from the initial evaluation and the 1-year follow-up. Principal component analysis showed that some FSHD samples grouped near the controls, whereas others formed groupings more distinct from the controls (Supplementary Material, Fig. S5A).
To determine the characteristics of each grouping, we performed three steps. ‘Step 1: Feature selection’. Starting with the sample space made by the principal components, we selected the genes that made the greatest contribution to the variation among the samples and best characterized the cluster pattern. For example, the samples grouped together in the lower right corner of Supplementary Material, Fig. S5A were characterized by high expression of DUX4-regulated genes and other categories of FSHD-associated genes, whereas the group in the upper right corner exhibited decreased expression of many muscle-related genes. Overall, the feature dimension was reduced to 705 genes (Supplementary Material, Fig. S5B, Table S4). ‘Step 2: Construct sample space’. The sample space was then defined as the principal components built upon the normalized, regularized log-expression of these selected genes/features. Step 3: K-means. We then applied K-means clustering on the constructed sample space to partition all 69 control and FSHD samples from the initial and follow-up biopsies into five clusters (classes in Fig. 5A).
Figure 5.
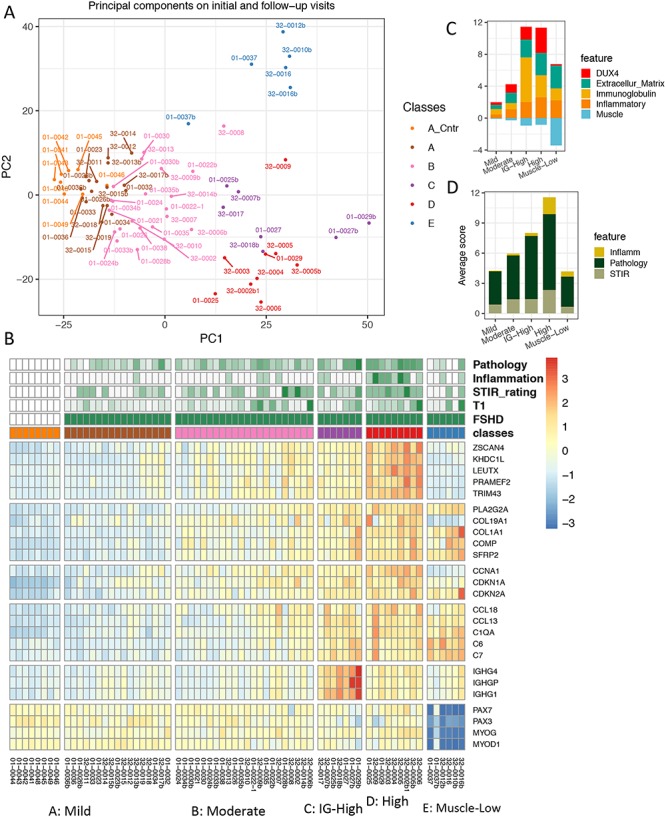
Characteristics of clustered groups among all initial and follow-up RNA-seq samples. (A) First and second principal component scatter plot of all initial and follow-up RNA-seq samples. Colors identify five groups of samples (A–E) partitioned by k-means clustering. Group A includes controls (A_Cntr) and some FSHD samples. (B) Expression of genes representing six FSHD relevant biological functions separated by horizontal gaps (top to bottom): DUX4-regulated, extracellular matrix, cell cycle, immune/inflammatory response, immunoglobulin and muscle development-related. Column gaps separate RNA-seq clustered groups, (A–E). Color scale corresponds to row z-score of regularized log2 expression. (C) Average relative expression of five categories of genes by the RNA-seq sample groups. (D) Average scores of histopathological inflammation, pathology and T2-STIR rating by the RNA-seq sample groups. (B), (C) and (D) illustrate the trend of expression and ratings from the mild, moderate, IG-high to high groups. The muscle-low group, unlike other groups, displays decreased expression in muscle development-related genes and low-to-absent DUX4-target expression.
The five resulting classes were named mild (combining cluster A-control and cluster A-FSHD), moderate (cluster B), IG-high (cluster C), high (cluster D) and muscle-low (cluster E) (Fig. 5A), each of which has distinct patterns in candidate biomarker expression. Figure 5B is a heatmap illustrating the characteristics of each cluster with representative genes for each of the six major categories: DUX4-regulated, extracellular matrix, cell cycle, inflammatory response, immunoglobulin and muscle-associated. Figure 5C summarizes the average expression of five categories of discriminative biomarkers in FSHD relative to the controls (see Method for details), and Figure 5D summarizes the average MRI and pathology scores of each class.
Although FSHD samples in the mild group seemed indistinguishable from the controls on the PCA plot, many FSHD samples in this group showed elevated expression of the cell cycle and proliferation genes (CDKN1A, CKDN2A and CCNA1), the extracellular collagen COL19A1 and some DUX4-regulated genes such as ZSCAN4 and the PRAMEF genes. This mild group also had generally low overall pathology scores (3.14 ± 2.27 SD) and a low T1 fat fraction (0.09 ± 0.057 SD). Samples in the moderate group showed mild-to-moderate elevation of gene expression from each category and slightly higher overall pathology scores (4.33 ± 1.98 SD) and T1 fat fraction (0.198 ± 0.197 SD). Most DUX4-induced PRAMEF and MBD3L family genes were significantly upregulated in this group. Samples in the high group showed moderate-to-high expression of genes from each of the major categories and had the highest overall pathology score (7.56 ± 1.88 SD) and a T1 fat fraction similar to the moderate group (0.24 ± 1.6 SD). In addition, they exhibited a higher frequency of inflammatory infiltrates on histology compared to samples in other groups: 80% of the samples scored 1–3 for inflammation compared to only 6% in the mild group. The IG-high samples had expression in all categories at levels somewhat between the moderate and high group, as well as similar overall pathology scores (6.29 ± 3.64 SD) and T1 fat fraction (0.165 ± 0.151 SE), but were distinguished from the other groups by high levels of immunoglobulin genes. The muscle-low group had very low expression of a set of genes associated with skeletal muscle, including PAX3, PAX7, MYOD and MYOG, nearly undetectable expression of DUX4-regulated genes, and had a wide range of pathology scores (3 ± 2.94 SD) and T1 fat fraction (0.213 ± 0.265 SD). The overall pathology score and T1 fat fraction for each group are shown in Supplementary Material, Figure S6. The 15 top enriched GO terms for each group are shown in Supplementary Material, Figure S7 and the overall DESeq [3] and GO statistics for each group compared to the controls are listed in Supplementary Material, Table S5.
The six biopsy samples in the muscle-low group represent four subjects: 32-0016/32-0016b, 01-0037/01-0037b, 32-0010b and 32-0012b. The T1 fat fractions were very high for 32-0016 and 32-0016b (both visits for subject 32-0016) (0.43 and 0.66) and the RNA-seq expression matrix showed a high expression of adipose genes at both times. 32-0010b and 32-0012b had higher blood RNA content than the other samples, indicating that local hemorrhage might have contaminated these samples and decreased the relative contribution of skeletal muscle RNA. Therefore, decreased muscle tissue in these biopsies might account for the lower muscle genes; however, at this time, we do not have an explanation for the low muscle gene expression in 01-0037 and 01-0037b, which both showed normal MRI and normal or near normal pathology.
Markers discriminate mild FSHD from control samples
To further identify genes that might distinguish the mild FSHD class from the controls, we compared gene expression in the 17 samples from both time points in the mild group to the control samples. The DESeq analysis yielded 73 downregulated and 369 upregulated genes (adjusted P-value <0.05 corresponding to  ) (Supplementary Material, Table S6) including a small set of DUX4-target genes. The GO analysis on the up-regulated genes showed enrichment of cellular response to stimulus and subsets of immune response such as lymphocyte activation, lymphocyte proliferation, leukocyte activation, cell adhesion and innate and humoral immune response (Supplementary Material, Table S6). To further restrict these genes to those most relevant to FSHD, we retained the 164 upregulated genes in mild FSHD samples that were also robustly and differentially expressed in the FSHD samples categorized into the high class (compared to controls, adjusted P-value <0.05 corresponding to
  ) (Supplementary Material, Table S7). Next, we applied receiver operator characteristic (ROC) methods (10) to evaluate the individual performance of the 164 genes in discriminating between the mild FSHD and the control groups. This classification-based evaluation was expressed by (1) the area under the ROC curve (AUC) varying from 0 to 1, where an uninformative classifier yields 0.5 and a perfect classifier yields 1.0 and (2) the partial AUC (pAUC) in which the false-positive rate was <0.2 (Supplementary Material, Table S7). Figure 6A shows the hierarchical cluster heatmap of the 52 genes with an AUC greater than 0.9. As expected, the mild FSHD samples were completely separated from the controls. The ‘leave-one-out’ cross validation by random forests showed a mean predicting error rate of 8% using the 164 genes. Therefore, the majority of these 164 genes can be considered candidate biomarkers for early muscle changes in FSHD and includes a subset of DUX4 target genes (ZSCAN4, CCNA1, KHDC1L, TRIM51 and PRAMEF-family genes), genes associated with extracellular matrix organization (COL19A1 and COMP), cell cycle (CDKN1A, CDKN2A and CCNA1), complement activation (C1QA and C1QB) and subsets of immune/inflammatory response genes (CD4, CD6 and LILRB1).
Figure 6.
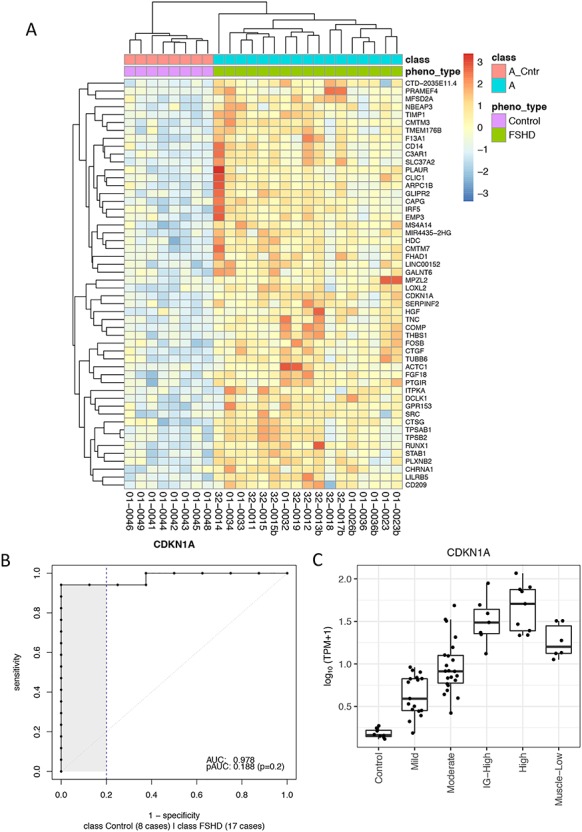
Candidate biomarkers distinguish mildly affected muscles from the controls. (A) Z-score of regularized log expression of 52 candidate biomarkers on 25 samples categorized in mild group (17 FSHDs and eight controls). The 52 candidate biomarkers were selected due to their superior performance in classifying FSHD and control samples among 25 mild group samples: AUC > 0.9. The dendrogram on top illustrates that FSHD samples can be separated from the controls by hierarchical clustering using the 52 selected candidates. (B) ROC curve for CDKN1A, a cell cycle gene identified as one of the best candidate biomarkers in distinguishing mildly affected muscles from the controls. (C) TPM expression of CDKN1A for each clustered group. Boxplot displays the minimum, first quartile, median, third quartiles and maximum. TPM, transcripts per million.
It is worth noting that, among the candidate biomarkers, a cell cycle gene, CDKN1A (aka p21) (AUC = 0.978, Fig. 6B), is one of the best classifiers in discriminating mild FSHD from the controls. The boxplot of CDKN1A expression shown in Figure 6C illustrates that its expression progressed from the mild, moderate, IG-high to high classes. Other candidates show a similar trend of progression, and the boxplots of eight selected candidates are shown in Supplementary Material, Fig. S8. Though CDKN1A is likely not a direct target of DUX4, a few studies of FSHD have reported that overexpression of DUX4 increases CDKN1A expression in mouse C2C12 cell line (11) and the human rhabdomyosarcoma TE671 cell line (12). Another interesting candidate, CDKN2A, is also a cell cycle gene reported to be elevated during myogenic differentiation of the 54–12 FSHD muscle cell line (13). Finally, CCNA1 is a meiotic cyclin that is highly induced by DUX4 in human myoblasts, although its expression and AUC (0.757) (Supplementary Material, Fig. S9A) make it slightly less discriminating between control and mild FSHD compared to CDKN1A.
Inflammatory biomarkers in the more affected high DUX4 category of biopsies
RNA-seq detected inflammatory signatures and immune cell infiltrates, especially in the more affected high DUX4 category of muscle biopsies. To obtain a more precise list of genes involved in the inflammatory response, we compared the nine samples in the high class to the controls. The DESeq2 differential analysis yielded 566 robustly upregulated genes including 81 inflammatory markers, 117 immune response markers, 86 DUX4-target genes and 43 extracellular matrix genes (Supplementary Material, Table S5). Fourteen misregulated CC and CXC chemokines were identified, including CXCL13 and CCL19 that are implicated in lymphoneogenesis (14, 15). Gene ontology analysis applied on the 566 up-regulated genes supported that not only immune response but also the chemokine-mediated signal pathway, lymphocyte proliferation and migration were enriched.
PAX7 target misregulation in FSHD biopsy RNA-seq samples
Banerji et al. (16, 17) identified 562 PAX7-induced and suppressed genes as candidate FSHD biomarkers, defining the PAX7 score as the t-statistics comparing the set of PAX7-induced and suppressed genes (13). Applying their method of analysis on our combined dataset, the calculated PAX7-score decreased progressively from the mild, moderate, IG-high and muscle-low groups (Supplementary Material, Fig. S10A). The landscape of the PAX7-target gene expression, on the other hand, suggested a more complex misregulation in FSHD samples: the majority of the PAX7-induced (~68%) and PAX7-suppressed (~74%) genes showed a mild-to-moderate level of up-regulation in the more affected biopsies (high FSHD samples), whereas about 32% of the PAX7-induced and 26% of the PAX7-suppressed genes showed downregulation (Supplementary Material, Fig. S10B). The progressive decrease in the PAX7-score was largely a result of a group of PAX7-suppressed genes that were progressively less suppressed in the moderate, IG-high and muscle-low samples (Supplementary Material, Fig. S10C). As an alternative approach to using the PAX7 t-statistic score, we compared levels of PAX7-target gene and DUX4-target gene expression in control compared to FSHD groups (Supplementary Material, Fig. S11A and B). In this comparison, the DUX4-target genes showed a more robust association with FSHD than the PAX7-regulated genes, except in the muscle-low samples.
Discussion
The 1-year follow-up analysis was consistent with the findings from the initial analysis of this cohort (7): (a) the T2 STIR+ muscles showed elevated DUX4-target gene expression compared to the MRI normal muscles, (b) the pathology scores were moderately correlated with DUX4 score, (c) genes associated with extracellular matrix structure (e.g. COMP and COL19A1), inflammatory response genes (e.g. CXCL13 and CXCL19), immune response (CD4, CD6 and LILRB1) and cell-cycle genes (e.g. CDKN1A, CDKN2A and CCNA1) were elevated in both the minimally and more severely affected muscles. Because DUX4-regulated genes were among the markers of FSHD even in the mildly affected FSHD muscles, it is likely that the changes in these other gene categories reflect a very low and/or sporadic expression of DUX4 at these early stages of pathology. Comparing the initial and 1-year follow-up visit for the FSHD samples as a group, the expression levels of the DUX4-target genes and the gene sets representing extracellular matrix, inflammatory response, immunoglobulins and cell cycle categories remained elevated to approximately the same degree compared to the control group. Therefore, although individual FSHD subjects had biopsies with either increased or decreased expression of genes within these categories, overall, the population showed relatively stable elevated expression of these markers at the two time points. The greater variability in the individual paired comparisons might reflect variable disease activity over time, regional variation of disease activity in the muscle biopsied or other variables related to the biopsy, such as the degree of bleeding, contaminating non-muscle tissue or a combination of these.
While further studies will be needed to determine the basis of individual variability between biopsies, the overall consistency in the population supports the further exploration of these markers for measuring disease activity in FSHD. In this regard, the moderate intra-class correlation (ICC) of the DUX4-target score over the 1-year time interval might represent a conservative lower limit for reliability and a benchmark for improving predictability. For example, stricter criteria for screening muscle biopsy quality (e.g. eliminating samples with a low expression of skeletal muscle genes or high expression of fat or blood RNAs), shorter inter-biopsy times and expansion of the gene basis for the overall score of disease activity might improve the ICC for the RNA seq score, whereas further refining MRI criteria to include both STIR signal and an early-to-mid range of fat infiltration might also increase the reliability of identifying muscle areas with active disease.
The identification of genes that distinguish the most mildly affected FSHD muscle samples from the controls, together with the principal component analysis that identified gene expression characteristics of different groups of FSHD biopsy samples, begins to generate a model of FSHD progression that will need to be validated by additional studies. The group of 52 genes in Figure 6A was identified as more highly expressed in the mild-FSHD compared to the controls, and to show further increased expression in more affected FSHD muscles. This set of 52 genes contains a set of DUX4-target genes, complement and inflammatory genes, lymphocyte and immunoglobulin genes, cell cycle genes and others that are candidates for identifying the early changes in FSHD muscle. It is important to note that this is a discovery set of genes, and each individual gene will need independent validation; however, together they suggest an early process associated with very low expression of DUX4 and DUX4 target genes. This is associated with inflammation and genes consistent with low levels of immune cell infiltrates and/or expansion, as well as complement system activation and chemo/cytokine gene expression. In more affected muscle, as measured by MRI and pathology, the levels of these genes increase, suggesting a progressive amplification of this initially low-grade process. This inferred progression is mirrored in the four classes based on the principal component analysis: mild, moderate, IG-high and high. As seen in Figure 5A–C, there is an apparent increased progression in the expression of ECM, inflammatory and DUX4 marker genes from the mild (Class A), to moderate (Class B), to IG-high (Class C), to high (Class D), possibly suggesting that the IG-high class might represent a transition from moderate to more severe pathology. Currently, the muscle-low (Class E) is hard to place in this progression, but, as noted in the Results section, most of these cases might be secondary to decreased muscle tissue either due to fatty infiltration or technical aspects related to the biopsy.
Along with validation studies to confirm the gene signatures identified in this study, it will also be important to confirm the cell of origin of the detected RNAs. The expression of genes such as CTLA4 and IGHG4 suggests the presence of T and B cells, respectively, and might relate to induction of complement genes and our prior demonstration of complement activation in the muscle biopsies (7). The cell cycle inhibitor CDKN1A/p21 is induced in differentiating muscle cells and might reflect active regeneration or could be expressed in infiltrating cells. The A1 cyclin CCNA1 is highly induced by DUX4 in muscle cells and has a normal role in germline meiosis, and its presence in the biopsy samples might represent activation of an early developmental program by DUX4 in muscle. Single cell and single fiber RNA sequencing from FSHD muscle biopsies at mild and moderate stages of disease activity will be important to identify the cells of origin of these transcripts and establish a chronological immune-cell phenotyping.
In summary, this study provides a strong basis for clinical trial design in FSHD. For therapies targeted to DUX4 expression or activity, muscles with a high-probability of active disease and DUX4-target gene expression can be identified by MRI, e.g. selecting muscles with a T2-STIR signal and an intermediate fat fraction (e.g. between 0.20 and 0.50). Pre- and post-treatment biopsies to measure the expression of a group of DUX4-target genes, either the four biomarkers used in this and our prior studies or an expanded group of DUX4-target genes, can be used to assess target engagement. RNAs indicating inflammation, ECM production or cell cycle are candidate biomarkers for identifying a potentially meaningful biological response to any decrease in DUX4-marker genes. Also, for drugs that do not target DUX4, these markers of inflammation, ECM, and cell cycle might serve as indicators of disease activity. Although these molecular outcome measures will not substitute for functional outcomes in determining treatment efficacy, they hold great promise for early determination of target engagement and impact on molecular pathophysiology that might justify, or not, larger and longer clinical trials for efficacy.
Materials and Methods
The study was conducted jointly at the University of Washington and the University of Rochester through the Seattle Paul D. Wellstone Muscular Dystrophy Cooperative Research Center. A total of 36 patients were recruited (18 at the University of Washington and 18 at the University of Rochester) from 2015 to 2017. The study was approved by the Human Subjects Committee at each institution, with written informed consent obtained for all participants. Patients were examined and given a 10-point Clinical Severity Score (CSS).
Magnetic resonance imaging (MRI)
Identical MRI muscle imaging protocols were performed at both sites on 3T-T machines (Siemens VB17) utilizing phased array coils placed over the lower extremities (thighs, calves). First, multi-plane localizers (6 mm slice thickness) were acquired followed by T1 (TE = 8.9 ms, TR = 510 ms), STIR (TE = 38 ms, TR = 4790 ms, TI = 220), DIXON (TE = 1.3, 2.48, 3.73, 4.98, 7.38, 9.84 ms, TR = 11.3) and fat saturated T2 (TE = 13.2, 26.4, 39.6 ms, TR = 1450) acquisitions at identical dimensions (5 mm slices, 40 image per location, 1.25 mm in-plane resolution). The tibial spine was used as a landmark for placing the slabs.
MRI analyses
Three main analytic approaches were taken at the biopsied muscle: 1) qualitative assessment of STIR hyperintensity; 2) qualitative assessment of T1 hyperintensity; 3) fat fraction measurement by DIXON method.
Qualitative assessment of STIR hyperintensity
STIR hyperintensity was rated qualitatively (by DS and SF) on a four-point scale: 0, normal appearance; 1, very mild diffuse elevation/may be artifact, close to zero; 2, mild diffuse elevation; 3, moderate areas of increased signal intensity; 4, severe involvement of entire muscle.
Qualitative assessment of T1
Hyperintensity was based on qualitative assessment of the amount of fatty replacement in the muscle: 0, normal appearance; 1, scattered small foci; 2, numerous but <30% muscle volume; 3, confluent patches, 30–60% of muscle volume; 4, >60% replacement; 5, complete replacement.
Quantitative assessment of T1
Processing of DIXON-derived fat/water images and T2 relaxometry images, with the first point truncated to minimize B1-effects, was performed in Matlab (Natick MA) generating summary measures in tabular format for statistical analyses.
Muscle biopsy for pathologic grading and biomarker studies
Subjects underwent lower extremity muscle biopsy in a muscle accessible by needle biopsy, including the tibialis anterior, gastrocnemius muscles, vastus lateralis and one hamstring (biceps femoris) muscle. At the initial visit, T2-STIR hyperintense muscles were preferentially biopsied when possible. At the follow-up visit, a biopsy was performed at approximately the same site as the first biopsy. Biopsies were obtained under sterile condition using either UCH modified Bergstrom needles (Rochester) or regular Bergstrom needles (Seattle).
Muscle pathology grading
The histopathological samples were graded for the severity of the pathologic changes based on 10 μm sections stained with Hematoxylin & Eosin and Trichrome. A pathologic severity score is determined for each biopsy based on a 12-point scale giving a 0–3 score to each of four major histologic features: variability in fiber size, percent of centrally located nuclei, interstitial fibrosis and muscle fiber necrosis/regeneration/inflammation.
RNA-seq library preparation and sequencing
RNA was extracted from frozen crushed muscle biopsy material using TRIzol and single end 100 nt Illumina sequencing was performed by the Fred Hutchinson Cancer Center Genomics Core.
RNA-seq data analysis
The RNA-seq preprocessing pipeline started with filtering out unqualified raw reads and trimming the Illumina universal adapters by Trimmomatic-0.32. The processed reads were then mapped to genome built hg38 by Tophap-2.1.0/Bowtie2-2.2.6. The gene features were collected from GENCODE, version 24, and the gene counts were profiled by using the GenomicAlignment::summarizedOverlap() function, a counterpart to HtSeq-Count in R/Bioconductor. The IntersectionStrict mode only counted reads that completely fall within the range of exons and ignored ambiguous reads straddling different gene features. The normalization, regularized log transformation and differential analysis were performed by DESeq2. Different criteria in defining differentially expressed genes were applied to different classes of FSHD biopsy samples. The samples categorized in the mild class have subtle differences compared to the controls; thus, loose criteria were used: adjusted P-value <0.05 corresponding to  The moderate, IG-high and high classes used more stringent criteria: adjusted P-value <0.05 corresponding to
  . The gene ontology analysis was conducted by the goseq (18) Bioconductor package, and the annotation was based on the GO biological process.
Marker scores
The DUX4 score of RNA-seq biopsy samples was based on four FSHD/DUX4-positive biomarkers that were previously found in (8): LEUTX, KHDG1L, PRAMEF2 and TRIM43. The score is the sum of these four biomarker local regularized log scaling difference from the control average. Additional marker scores such as extracellular matrix, immune/inflammation, cell cycle and immunoglobulin scores were calculated in the same manner and based on discriminative genes (top PC1/PC2 loading variable) found by PCA on the follow-up visit. The extracellular matrix score was based on PLA2GA, COL19A1, COMP and COL1A1. The immune/inflammation score was based on CCL18, CCL13, C6 and C7. The immunoglobulin score was based on IGHA1, IGHG4 and IGHGP. The cell cycle score was based on CCNA1, CDKN1A and CDKN2A.
Inflammatory and other biomarker identification
The 81 inflammatory, 117 immune response and 43 extracellular matrix biomarkers were identified by DESeq2 comparing FSHD samples categorized in the high class to the eight controls with criteria: adjusted P-value <0.05 corresponding to  The differentially upregulated genes were tagged as inflammatory, immune response and extracellular matrix structure biomarkers if they were involved in the GO term GO:0006954, GO:0006955 and GO:0030198, respectively. In addition, the upregulated were tagged as DUX4-target genes if they were overlapping with the differentially upregulated genes in GSE85461 dataset by Jagannathan et al. 2016 (by DESeq2 with adjusted P-value <0.05 corresponding to
Abbreviations
AUC area under the curve
BET bromodomain and extraterminal domain
CSS clinical severity score
FSHD facioscapulohumeral dystrophy
GO gene ontology
IG immunoglobulin
MRI magnetic resonance imaging
PCA principle component analysis
ROC receiver operator characteristics
STIR short tau inversion recovery
Code and data availability
The raw RNA-seq read files are available from Gene Expression Omnibus with accession numbers GSE115650 (initial visit and controls) and GSE140261 (followup visit and controls). The collected processed RNA-seq datasets including gene counts, feature annotation as well as MRI characteristics, scripts and metadata are available from our GitHub repository: (https://github.com/FredHutch/RWellstone_FSHD_muscle_biopsy). The repository also hosts a GitHub-page with detailed narratives of analysis and reproducible R codes (https://fredhutch.github.io/RWellstone_FSHD_muscle_biopsy).
Software
The statistics analysis and visualization were performed using R/3.5.1 and Bioconductor 3.7 packages (DESeq2, goseq and GenomicAlignments). Most of the figures were made by ggplot2 (19) and heatmaps by pheatmap. Bioinformatics tools used for preprocessing data were fastqc, Trimmomatic-0.32, Tophap-2.1.0 and Bowtie2-2.2.6.
Supplementary Material
Acknowledgements
This work was supported by National Institutes of Health (P50 AR065139 to S.J.T., P01 NS069539 to S.J.T.) and the Friends of FSH Research. The authors thank the FSHD community for their help and participation in the study.
Conflict of Interest statement. L.H.W., S.D.F., D.S., S.M.M., R.N.T. and S.J.T. consult for pharmaceutical companies interested in clinical trial design for FSHD. No company funded any part of this study or had any influence in its design, execution, interpretation or publication. The authors declare no conflict of interest.
References
- 1. Tawil R., van der Maarel S.M. and Tapscott S.J. (2014) Facioscapulohumeral dystrophy: the path to consensus on pathophysiology. Skelet. Muscle, 4, 12. [DOI] [PMC free article] [PubMed] [Google Scholar]
- 2. Hendrickson P.G., Dorais J.A., Grow E.J., Whiddon J.L., Lim J.W., Wike C.L., Weaver B.D., Pflueger C., Emery B.R., Wilcox A.L. et al. (2017) Conserved roles of mouse DUX and human DUX4 in activating cleavage-stage genes and MERVL/HERVL retrotransposons. Nat. Genet., 49, 925–934. [DOI] [PMC free article] [PubMed] [Google Scholar]
- 3. Snider L., Geng L.N., Lemmers R.J., Kyba M., Ware C.B., Nelson A.M., Tawil R., Filippova G.N., van der Maarel S.M., Tapscott S.J. et al. (2010) Facioscapulohumeral dystrophy: incomplete suppression of a retrotransposed gene. PLoS Genet., 6, e1001181. [DOI] [PMC free article] [PubMed] [Google Scholar]
- 4. Whiddon J.L., Langford A.T., Wong C.J., Zhong J.W. and Tapscott S.J. (2017) Conservation and innovation in the DUX4-family gene network. Nat. Genet., 49, 935–940. [DOI] [PMC free article] [PubMed] [Google Scholar]
- 5. Campbell A.E., Oliva J., Yates M.P., Zhong J.W., Shadle S.C., Snider L., Singh N., Tai S., Hiramuki Y., Tawil R. et al. (2017) BET bromodomain inhibitors and agonists of the beta-2 adrenergic receptor identified in screens for compounds that inhibit DUX4 expression in FSHD muscle cells. Skelet. Muscle, 7, 16. [DOI] [PMC free article] [PubMed] [Google Scholar]
- 6. Oliva J., Galasinski S., Richey A., Campbell A.E., Meyers M.J., Modi N., Zhong J.W., Tawil R., Tapscott S.J. and Sverdrup F.M. (2019) Clinically advanced p38 inhibitors suppress DUX4 expression in cellular and animal models of facioscapulohumeral muscular dystrophy. J. Pharmacol. Exp. Ther., 370, 219–230. [DOI] [PMC free article] [PubMed] [Google Scholar]
- 7. Wang L.H., Friedman S.D., Shaw D., Snider L., Wong C.J., Budech C.B., Poliachik S.L., Gove N.E., Lewis L.M., Campbell A.E. et al. (2019) MRI-informed muscle biopsies correlate MRI with pathology and DUX4 target gene expression in FSHD. Hum. Mol. Genet., 28, 476–486. [DOI] [PMC free article] [PubMed] [Google Scholar]
- 8. Yao Z., Snider L., Balog J., Lemmers R.J., Van Der Maarel S.M., Tawil R. and Tapscott S.J. (2014) DUX4-induced gene expression is the major molecular signature in FSHD skeletal muscle. Hum. Mol. Genet., 23, 5342–5352. [DOI] [PMC free article] [PubMed] [Google Scholar]
- 9. Love M.I., Huber W. and Anders S. (2014) Moderated estimation of fold change and dispersion for RNA-seq data with DESeq2. Genome Biol., 15, 550. [DOI] [PMC free article] [PubMed] [Google Scholar]
- 10. Margaret Sullivan Pepe G.L., Anderson G.L. and Schummer M. (2003) Selecting differentially expressed genes from microarray experiments. Biometrics, 59, 133–142. [DOI] [PubMed] [Google Scholar]
- 11. Bosnakovski D., Xu Z., Gang E.J., Galindo C.L., Liu M., Simsek T., Garner H.R., Agha-Mohammadi S., Tassin A., Coppee F. et al. (2008) An isogenetic myoblast expression screen identifies DUX4-mediated FSHD-associated molecular pathologies. EMBO J., 27, 2766–2779. [DOI] [PMC free article] [PubMed] [Google Scholar]
- 12. Xu H., Wang Z., Jin S., Hao H., Zheng L., Zhou B., Zhang W., Lv H. and Yuan Y. (2014) Dux4 induces cell cycle arrest at G1 phase through upregulation of p21 expression. Biochem. Biophys. Res. Commun., 446, 235–240. [DOI] [PubMed] [Google Scholar]
- 13. Banerji C.R.S., Panamarova M., Pruller J., Figeac N., Hebaishi H., Fidanis E., Saxena A., Contet J., Sacconi S., Severini S. et al. (2019) Dynamic transcriptomic analysis reveals suppression of PGC1alpha/ERRalpha drives perturbed myogenesis in facioscapulohumeral muscular dystrophy. Hum. Mol. Genet., 28, 1244–1259. [DOI] [PMC free article] [PubMed] [Google Scholar]
- 14. Müller G. and Lipp M. (2003) Concerted action of the chemokine and lymphotoxin system in secondary lymphoid-organ development. Curr. Opin. Immunol., 15, 217–224. [DOI] [PubMed] [Google Scholar]
- 15. Tasca G., Monforte M., Corbi M., Granata G., Lucchetti D., Sgambato A. and Ricci E. (2018) Muscle microdialysis to investigate inflammatory biomarkers in facioscapulohumeral muscular dystrophy. Mol. Neurobiol., 55, 2959–2966. [DOI] [PubMed] [Google Scholar]
- 16. Banerji C.R.S., Panamarova M., Hebaishi H., White R.B., Relaix F., Severini S, Zammit P.S. (2017) PAX7 target genes are globally repressed in facioscapulohumeral muscular dystrophy skeletal muscle. Nat. Commun., 8, 2152. [DOI] [PMC free article] [PubMed] [Google Scholar]
- 17. Banerj C.R.S. and Zammit P.S. (2019) PAX7 target gene repression is a superior FSHD biomarker than DUX4 target gene activation, associating with pathological severity and identifying FSHD at the single-cell level, Hum Mol Genet., 28, 2224–36. [DOI] [PMC free article] [PubMed] [Google Scholar]
- 18. Matthew D., Young M.J.W., Smyth G.K. and Oshlack A. (2010) Method gene ontology analysis for RNA-seq: accounting for selection bias. Genome Biol., 11. [DOI] [PMC free article] [PubMed] [Google Scholar]
- 19. Wickham H. (2016) ggplot2: Elegant Graphics for Data Analysis. Springer Verlag, New York. [Google Scholar]
Associated Data
This section collects any data citations, data availability statements, or supplementary materials included in this article.
Supplementary Materials
Data Availability Statement
The raw RNA-seq read files are available from Gene Expression Omnibus with accession numbers GSE115650 (initial visit and controls) and GSE140261 (followup visit and controls). The collected processed RNA-seq datasets including gene counts, feature annotation as well as MRI characteristics, scripts and metadata are available from our GitHub repository: (https://github.com/FredHutch/RWellstone_FSHD_muscle_biopsy). The repository also hosts a GitHub-page with detailed narratives of analysis and reproducible R codes (https://fredhutch.github.io/RWellstone_FSHD_muscle_biopsy).