Abstract
Our group has proposed the concept of subharmonic aided pressure estimation (SHAPE) utilizing microbubble-based ultrasound contrast agent signals for the noninvasive estimation of hydrostatic blood pressures. An experimental system for in vitro SHAPE was constructed based on two single-element transducers assembled confocally at a 60° angle to each other. Changes in the first, second, and subharmonic amplitudes of five different ultrasound contrast agents were measured in vitro at static hydrostatic pressures from 0 to 186 mmHg, acoustic pressures from 0.35–0.60 MPa peak to peak and frequencies of 2.5–6.6 MHz. The most sensitive agent and optimal parameters for SHAPE were determined using linear regression analysis and implemented on a Logiq 9 scanner (GE Healthcare, Milwaukee, WI). This implementation of SHAPE was then tested under dynamic flow conditions and compared to pressure catheter measurements. Over the pressure range studied the first and second harmonic amplitudes reduced approximately 2 dB for all contrast agents. Over the same pressure range, the subharmonic amplitudes decreased by 9–14 dB and excellent linear regressions were achieved with the hydrostatic pressure variations (r2 ≥ 0.98, p < 0.001). The optimal sensitivity was achieved at a transmit frequency of 2.5 MHz and an acoustic pressure of 0.35 MPa using Sonazoid (GE Healthcare, Oslo, Norway). A Logiq 9 scanner was modified to implement SHAPE on a convex transducer with a frequency range from 1.5–4.5 MHz, acoustic pressures from 0 to 3.34 MPa, and results matched the pressure catheter (r2 = 0.87). In conclusion, subharmonic contrast signals are a good indicator of hydrostatic pressure. Out of the five ultrasound contrast agents tested Sonazoid was the most sensitive for subharmonic pressure estimation. Real-time SHAPE has been implemented on a commercial scanner and offers the possibility of allowing pressures in the heart and elsewhere to be obtained noninvasively.
Keywords: subharmonic signals, ultrasound contrast agents, pressure estimation
INTRODUCTION
The introduction of safe and effective ultrasound contrast agents based on gas-filled microbubbles increases the diagnostic capabilities of ultrasound imaging [1]. Contrast agents not only enhance the backscattered signals, but at higher acoustic pressures (typically > 100 kPa) they also act as nonlinear oscillators producing noticeable energy components in the received echo signals, which span the range of possible frequency emissions from subharmonics through ultraharmonics [1]. In subharmonic imaging (SHI) pulses are transmitted at double the resonance frequency (2fo) and received at the subharmonic (fo). Using the subharmonic signal component for imaging is feasible, as there is a lack of subharmonic generation in tissue while the subharmonic oscillation of the agent modulates the incoming acoustic signal as detected in the backscatter [2]. Further improvements in SHI are possible with the use of pulse inversion methods [3–4]. Feasibility studies of SHI were conducted in vitro and in vivo (animals as well as humans) by our group [5–9] and by others [10–13].
Currently, the only noninvasive way to estimate pressure gradients across heart valves is through the use of Doppler ultrasound where estimates of pressure are generated using a modification of the Bernoulli equation [14]. However, studies have shown that this method can be unreliable [14, 15]. The idea of using microbubbles to monitor pressure was first suggested by Fairbanks and Scully in 1977 [15]. The methods studied to date have utilized the shift in resonant frequency, the disappearance time of microbubbles and the changes in fundamental amplitude from a single bubble [16–20]. However, these studies suffered from a lack of sensitivity (10 mmHg at best) and have not been further developed for commercial or in vivo use. Alternatively, we have proposed subharmonic aided pressure estimation (SHAPE; U.S. Patent 6,302,845) [21] utilizing microbubble-based contrast agent subharmonic signals.
The long term goal of this project is to monitor and quantify pressures in the body via contrast-enhanced SHI. The generation of subharmonic signal in relation to increasing acoustic pressure can be divided into three stages; occurrence, where the subharmonic is too small to reach above the noise floor; growth, where the subharmonic grows rapidly with the acoustic pressure and is clearly visible and saturation, where the broadband noise due to bubble destruction and inertial cavitation dominates and so the subharmonic becomes hard to differentiate from noise [6]. We have established that in the growth phase there is an inverse linear relationship between subharmonic amplitude and hydrostatic pressure and by utilizing this relationship, pressure in the body can be noninvasively estimated [6, 9]. Studies with the contrast agent Levovist showed a 9.6 dB decrease in amplitude when the hydrostatic pressure is increased from 0 mmHg to 186 mmHg (r = 0.98, p < 0.05) [6]. Moreover, in vitro studies aimed at establishing an optimal agent and acoustic parameters for pressure estimation in locally advanced breast cancer have been conducted over a hydrostatic pressure range simulating the interstitial pressure range in tumors [22]. In 2005, we established in vivo proof of concept for SHAPE by measuring the aortic pressure of two dogs using single element transducers, with a root mean square error of less than 27% when compared to a pressure catheter [9]. However, none of our prior research has systematically investigated the potential of different contrast agents in SHAPE with a side by side comparison.
Hence, to establish the optimum agent and acoustic parameters for in vivo cardiac pressure estimation, this study measured the effects of the hydrostatic pressure on the subharmonic performance for five ultrasound contrast agents in vitro. The most sensitive agent and optimal parameters for SHAPE were determined and the algorithm was implemented on a Logiq 9 scanner (GE Healthcare, Milwaukee, WI, USA). Finally, this implementation was tested under dynamic flow conditions to better simulate the environment in the heart and major vessels.
MATERIALS AND METHODS
Static SHAPE
In order to establish the contrast agent best suited for in vivo SHAPE for lower frequency applications (< 7 MHz), such as cardiac and portal vein pressures, five contrast agents were compared: Definity (Lantheus Medical Imaging, N Billerica, MA, USA), Sonazoid (GE Healthcare, Oslo, Norway), Levovist (Schering AG, Berlin, Germany), Optison (GE Healthcare, Princeton, NJ, USA), and ZFX (Zhifuxian,Xinqiao Hospital, the Third Military Medical University, Chongqing, China). Properties of each agent can be found in Table 1.
Table 1.
Properties of the ultrasound contrast agents used for the static in vitro testing of SHAPE
| Agent | Shell | Gas | Mean diameter (μm) | Resonance frequency (MHz) | Commercial availability in USA |
|---|---|---|---|---|---|
| Sonazoid | Lipid | Perfluorobutane | 2.4–3.5 (median) |
4.4 | |
| Definity | Lipid | Perfluropropane | 1.1–3.3 | 2.7 | Cardiac |
| Levovist | Galactose/ palmitic acid |
Air | 2.0–4.0 | 2.0 | |
| Optison | Albumin | Octafluoropropane | 2.0–4.5 | 2.0 | Cardiac |
| ZFX | Lipid | Perfluoropentane | 2.1–4.0 | 3.0 |
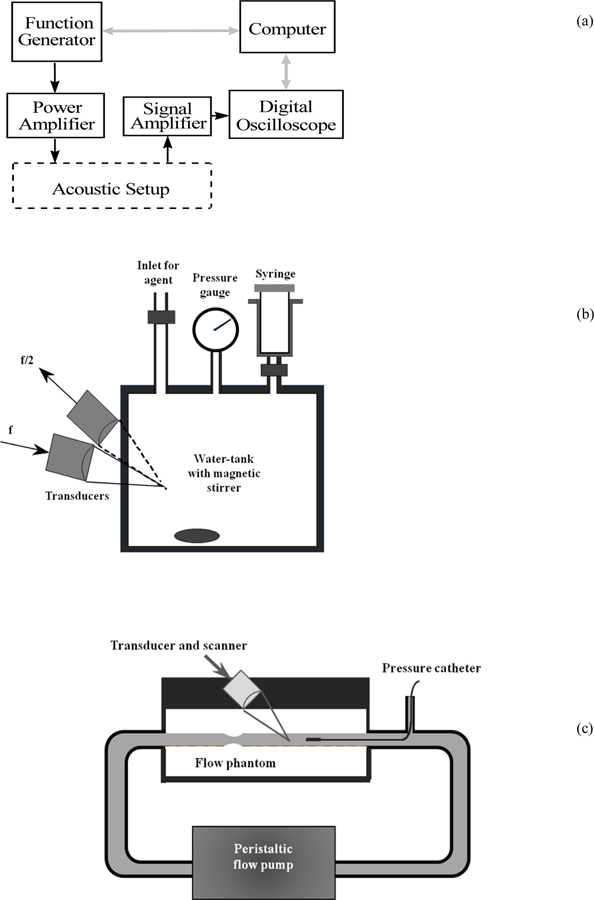
An experimental setup, similar to the one previously employed by our group [6], was constructed to quantify the best imaging parameters for SHAPE (Figure 1). A programmable function generator (Model 8116A; Hewlett Packard, Santa Clara, CA) produced pulses for transmission. The transmit signals were first amplified in a broadband 50 dB RF power amplifier (Model 3100L; ENI, Rochester, NY) and then supplied to an acoustic transmit transducer. Scattered signal from microbubbles were sensed by a receive transducer and amplified with a low-noise RF amplifier (Model 5052 PR, Panametrics, Waltham, MA). The amplified signals were then acquired using a digital oscilloscope equipped with mathematical functions (Model 9350AM, LeCroy, Chestnut Ridge, NY). The data transfer from the digital oscilloscope was controlled by a PC via LabView (National Instruments, Austin, TX). The digitized signals were further processed using fast Fourier transform (FFT) spectrum analysis in the oscilloscope. The amplitude of the fundamental, harmonic and subharmonic signal components were obtained from spectra averaged over 64 sequences to minimize noise and produce a well defined peak.
Figure 1.
The block diagram of the electronic part (a), the acoustic part (b) and the flow system part (c) of the measurement system.
The contrast signals at different hydrostatic pressures were measured using a 2.25 L water tank (cube with inside dimensions of 13.1 cm) that can sustain pressure changes in excess of 200 mmHg. The water tank is also equipped with an acoustic window made out of thin plastic (thickness: 1.5 mm). The pressure inside could be varied by injecting air through an special inlet on the tank and was monitored by a pressure gauge (OMEGA Engineering Inc., Stamford, CT). A single-element focused transducer with a bandwidth of 86 % and a center frequency of 3.6 MHz (Etalon, Lebanon, IN) was used as the transmitter and another transducer with a bandwidth of 38 % and a center frequency of 2.2 MHz (Staveley, East Hartford, CT) was used as the receiver. Both transducers had a diameter of 2.5 cm and a focal length of 5.0 cm. The two transducers were positioned confocally at an angle of 60° to each other (Figure 1b) and 64 cycle acoustic pulses were transmitted at a pulse repetition frequency (PRF) of 5 Hz. Acoustic pressures were determined with a 0.2 mm broadband acoustic hydrophone (Precision Acoustics Ltd, Dorchester, England)
All measurements were carried out in triplicate at room temperature (25 ± 2o C) with direct injection of contrast agents (dosage: 0.1 ml/L) into saline (Isoton II; Coulter, Miami, FL) immediately after activation of the agent. The mixture was kept homogenous by a magnetic stirrer and a waiting period of 30 s was allowed prior to data acquisition to ensure complete mixing. Data acquisition took on average 4 minutes (including the mixing period).
At a transmit frequency 4.4 MHz and acoustic pressure 0.42 MPa changes in the first, second, and subharmonic amplitudes of the five ultrasound contrast agents were measured over a pressure range from 0 to 186 mmHg which is similar to the range of blood pressures encountered in the human body (excluding extreme hypertension). Linear regression analysis was conducted to establish the relationship between changes in hydrostatic pressure and in contrast signal amplitude (calculated separately for first, second, and subharmonic signal components). The statistical software package Stata 9.0 (Stata Corporation, College Station, TX) was used.
Further studies were then conducted for the three agents that showed the most promise at 4.4 MHz and 0.42 MPa. For those three agents the transmit frequency was varied from 2.5 to 6.6 MHz and the acoustic pressure from 0.35 to 0.6 MPa (corresponding to the growth phase of the agents) to establish the optimal parameters and agent needed for SHAPE.
Dynamic SHAPE
A Logiq 9 scanner (GE Healthcare, Milwaukee, WI, USA) was modified to implement SHI on a 4C curved linear transducer (GE Healthcare, Milwaukee, WI, USA) with a frequency range from 1.5–4.5 MHz. A pulse inversion technique (i.e. transmitting one pulse followed by an inverted copy of that pulse and summing up the echoes thereby minimizing linear signal components) was used to distinguish nonlinear components. To further improve signal-to-noise ratio and extract subharmonic components, a band-pass filter was applied to the received signals after beamforming. The filter is centered at half of the transmit frequency and with a 1 MHz bandwidth. Other imaging parameters, including F-number, apodization, focal zone positions, TGC, etc., were also optimized for best sensitivity to the detection and display of subharmonic signal components. The parameters were also adjusted to achieve image uniformity as determined by human observers. A dual screen setup makes it possible to concurrently show the B-image and the subharmonic signals for the region of interest (ROI) in real time, using the color flow processing chain for displaying subharmonic signals [23]. Both images and radiofrequency (RF) signals can be stored for off-line analysis. For subharmonic acquisition 5 different settings were available; the transmit frequency could be kept at 2.5 MHz (pulse length 4, 8 or 16 cycles), 3.1 MHz (pulse length 5 cycles) or 3.8 MHz (pulse length 6 cycles). Acoustic pressure levels of 0 to 100% on the scanner corresponded to 0 to 3.34 MPa and were established using the same 0.2 mm needle hydrophone as used for the single element transducers.
In order to further simulate a clinical environment the implementation was tested in vitro under dynamic flow conditions using a tissue-mimicking flow phantom with a 6 mm diameter vessel embedded at a depth of 2 cm (Model 524; ATS laboratories, Bridgeport, CT). During the experiments Sonazoid was diluted in saline (20 μl per liter of water injected immediately after activation of agent) and a magnetic stirrer was used to maintain mixture while the diluted microbubble suspension was pumped through the flow system by a continuous flow roller pump (S10K II; Sarns Inc., Ann Arbor, MI). Agent mixtures were replaced after each run, and the average duration was 8 minutes. The flow pump was set to generate pressure cycles from 5 to 60 mmHg with a frequency of 1.23 Hz. A 2F high-fidelity manometer-tipped pressure catheter (SPR-350; Millar Instruments, Houston, TX) was positioned inside the vessel and the ultrasound transducer placed correspondingly above the catheter (Figure 1c). Pressure signals from the catheter were acquired through the digital oscilloscope and stored for offline analysis. By synchronizing data acquisition on the oscilloscope and the ultrasound scanner simultaneous pressure measurements were acquired.
Similar to the static experiments, linear regression analysis was employed to establish the best least squares relationship between changes in hydrostatic pressure and in subharmonic signal amplitudes.
RESULTS
Static SHAPE
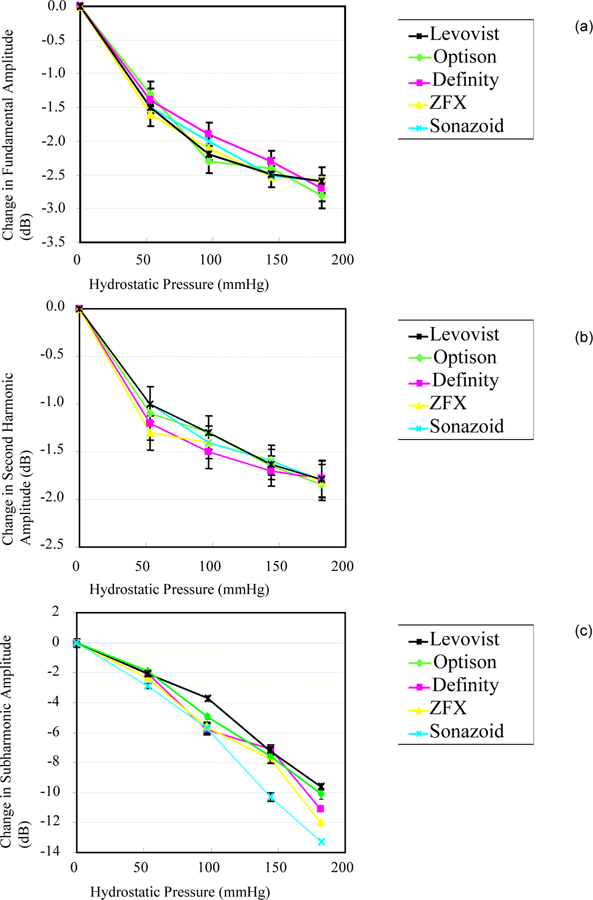
Changes in the first, second, and subharmonic amplitudes of the contrast agents as a function of ambient pressures are shown in Figure 2. Over the pressure range studied, for 4.4 MHz transmit frequency and 0.42 MPa acoustic pressure, the first and second harmonic amplitudes reduced on average by 2.4 (r2 = 0.86–0.94, p < 0.05) and 1.8 dB (,r2 = 0.80–0.91, p < 0.05) respectively. Over the same pressure range the subharmonic amplitude of the contrast agent suspensions decreased by 10 to 14 dB (cf., Figure 2c). A highly significant linear regression was achieved between subharmonic amplitude and hydrostatic pressure (r2 ≥ 0.97; p < 0.001, for all agents). Sonazoid signals decreased the most amongst the agents investigated (an average of 13.3 ± 0.19 dB) and achieved the most linear relationship with pressure (r2 = 0.99; p < 0.001), making it the most sensitive contrast agent for SHAPE at 4.4 MHz transmit frequency and 0.42 MPa acoustic pressure.
Figure 2.
Comparison of the changes in fundamental (a), second harmonic (b) and subharmonic signal amplitude (c) as a function of ambient pressure when transmitting at 4.4 MHz (receiving at 2.2 MHz) and an acoustic pressure of 0.42 MPa. Mean values ± 1 standard deviation are shown (N = 3) for  Levovist,
  Optison,
  Definity,
  ZFX and
  Sonazoid. Notice the difference in scale for the y-axis.
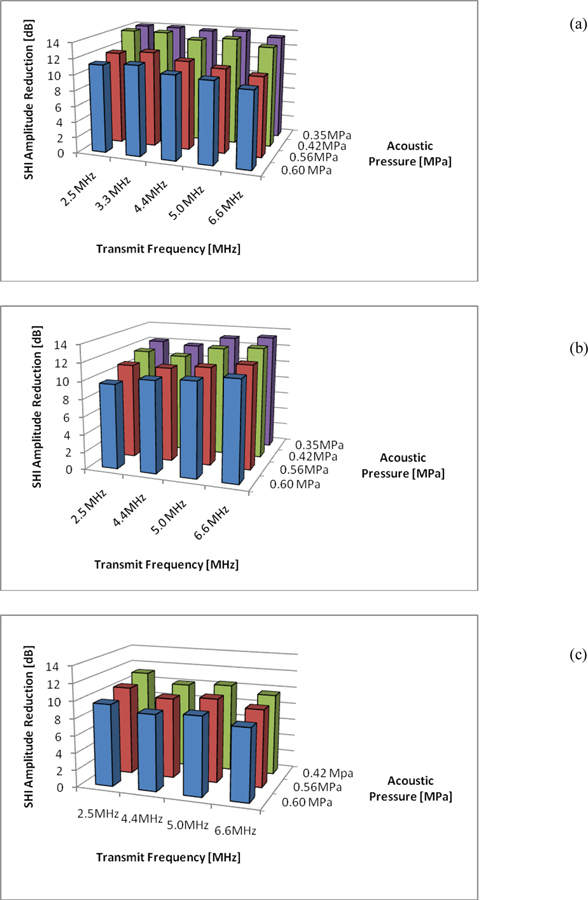
The three agents that showed the most promise at 4.4 MHz and 0.42 MPa were Sonazoid, Definity and Optison. The variability of subharmonic signals for these three agents was further investigated for different transmit frequencies and acoustic pressures to establish the best parameters for SHAPE. Results are shown in figure 3a), b) and c) for Sonazoid, Definity and Optison, respectively). The optimal sensitivity for SHAPE (within the parameter space studied here) was achieved using Sonazoid at a transmit frequency of 2.5 MHz (i.e., receiving at 1.25 MHz) and an acoustic pressure of 0.35 MPa where the subharmonic amplitude declined approximately 14.9dB from 0 mmHg to 186 mmHg. The best sensitivity for Definity was achieved at a transmit frequency of 6.6 MHz and 0.35 MPa resulting in a 13.3 dB drop in subharmonic amplitude whereas for Optison a greatest decrease in subharmonic amplitude of 11.2 dB over the pressure range studied was achieved at 2.5 MHz transmit frequency and 0.42 MPa.
Figure 3.
Maximum decrease in subharmonic signal amplitude over a pressure range of 0 to 186 mmHg as a function of transmit frequency and transmit pressure (averaged over 3 measurements) for Sonazoid (a), Definity (b) and Optison (c).
Dynamic SHAPE
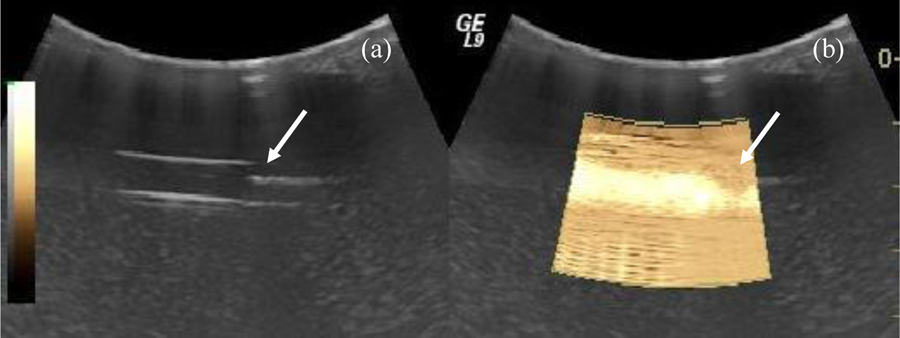
A state-of-the-art Logiq 9 ultrasound scanner was modified to implement SHI and SHAPE. Multiple ultrasound transducers were evaluated for SHI performance and a curved linear transducer (model 4C) was found to have best fit because of its aperture size and frequency range. The radius of curvature of the 4C probe is 60 mm and the bandwidth ranges from 1.5 to 4.5 MHz. For evaluation purposes, multiple settings were defined with center frequencies at 3.8, 3.1 and 2.5 MHz, respectively. An example of SHI (within ROI) of the flow phantom at a transmit frequency of 2.5 MHz (i.e., receiving at 1.25 MHz) is compared to fundamental grayscale imaging in Figure 4. The location of the pressure catheter (i.e., the reference standard) is apparent by the shadowing seen in Figure 4 and lack of subharmonic signal (in Figure 4b). Also, notice the strong subharmonic signal from the bubbles in the ROI (in Figure 4b). Considerable noise can be seen in the far field, presumably because the 4C probe has not been optimized for such a shallow depth (< 3 cm).
Figure 4.
Example of flow phantom imaged in fundamental (a) and in SHI (b) mode (within ROI). The location of the pressure catheter (roughly 2 cm depth) is indicated with arrows.
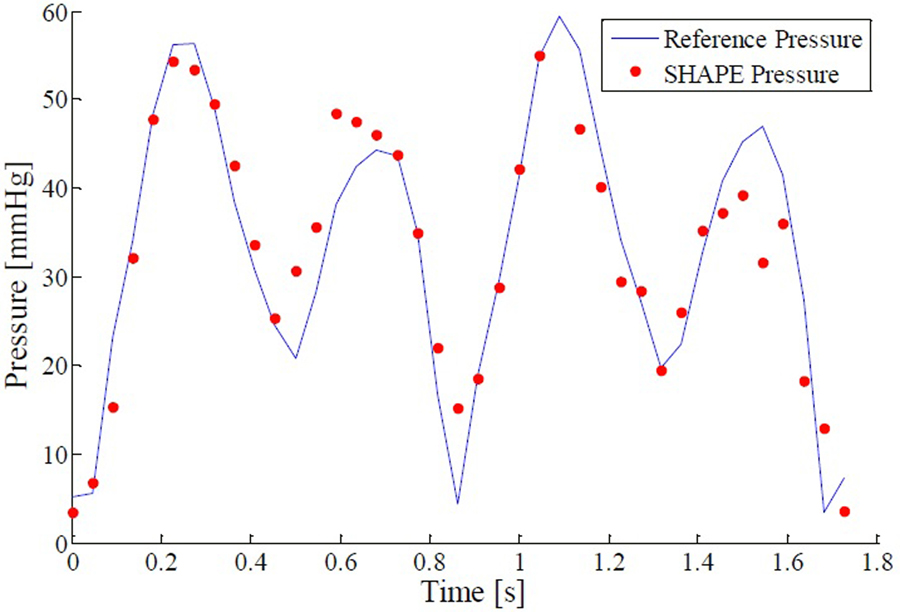
An example of the SHAPE pressure measurements obtained over two cycles (1.8 seconds) in the flow system is presented in Figure 5. The transmit frequency was kept at 2.5 MHz using a pulse length of 8 cycles at an acoustic output of 24 %, corresponding to 0.5 MPa peak to peak pressure (measured with the 0.2 mm hydrophone) . Data was collected from the ROI positioned over the vessel at a frame rate of 22 Hz. The subharmonic amplitude from a single A-line was obtained by averaging over a bandwidth around 1.25 MHz (from 1 to 1.5 MHz). The subharmonic amplitude was then compared to the reference pressure using a linear regression model in order to establish the SHAPE pressure value at each time point. A conversion factor of −4.55 mmHg/dB achieved an excellent fit with the pressure catheter (r2 = 0.87, p < 0.01). The average difference between SHAPE and the reference standard (i.e., the pressure catheter) was 4.1 mmHg and the maximum error was 15.4 mmHg. These results demonstrate the feasibility of SHAPE under dynamic flow conditions using a commercial scanner.
Figure 5.
Best fit example for instantaneous hydrostatic pressures measured by pressure catheter (blue line) and SHAPE (red dots) for a pulse length of 8 cycles transmitting at 2.5 MHz and an acoustic output level of 24 % (r2 = 0.87, p < 0.01)
DISCUSSION AND CONCLUSION
The subharmonic response of contrast microbubbles under different pressures and acoustic parameters has been investigated in vitro. For hydrostatic pressures up to 186 mmHg, the subharmonic amplitude of contrast signals reduced as much as 14.9 dB (for Sonazoid at 2.5 MHz and 0.35 MPa), while the first and second harmonic amplitudes decreased less than 3 dB (cf., Figures 2 and 3). Excellent correlation between the amplitude of the subharmonic signal component and hydrostatic pressure was obtained (r2 ≥ 0.97 for all agents and acoustic parameters). This demonstrates that the subharmonic component is a very good indicator of hydrostatic pressure variation. The optimal sensitivity for SHAPE was achieved with the contrast agent Sonazoid. Currently, it is not fully understood why some agents are more sensitive to hydrostatic pressure changes than others although simulation studies are ongoing and seem to indicate that this difference is due to shell properties [24].
Evaluation of the standard deviations for the subharmonic performance of the contrast agents (the highest standard deviation was 0.26 dB for Definity which corresponds to 2.4 % of the average change in amplitude) shows that these methods are very reproducible. From this data it shows that each contrast agent behaves similarly after each repetition. Such reproducible results show that testing subharmonic performance is a successful technique.
Furthermore, the method has been implemented on a commercial scanner and preliminary studies indicate that SHAPE is able to track rapidly changing pressures under flow conditions similar to those encountered in the human body. Significant linear regression was achieved (r2 = 0.87, p < 0.01) and the conversion factor under the conditions described was −4.55 mmHg/dB. The average absolute error between the dynamic SHAPE pressure and the reference pressure measurements was found to be 4.1 mmHg, mostly in areas of swift pressure change, although minor refinements aimed at optimizing the extraction and processing of the subharmonic signal from the collected RF data could potentially minimize that error.
Other groups have reported comparable in vitro results, although none have been as extensive in testing different agents over a wide range of frequencies and acoustic pressures [25–29]. Andersen and Jensen established an inverse linear relationship between the ratio of the energy of the subharmonic and the fundamental (instead of the subharmonic amplitude as described here) using the contrast agent SonoVue (Bracco Spa, Milan, Italy). However, the standard deviation for this parameter was high and no dynamic conditions or cyclical pressures were considered [25]. Adam et al. studied the pressure relationship of the fundamental, second harmonic and subharmonic amplitudes and attenuation for both static and cyclical pressures using the contrast agent Optison. A time dependent decrease in subharmonic amplitude with pressure was observed (r > 0.71) [26–28]. Recently, a study by Frinking et al. employing an experimental phospholipid shell agent showed that at acoustic pressures higher than 350 kPa the subharmonic amplitude decreases with increasing hydrostatic pressure as demonstrated previously [29]. Conversely, at acoustic pressures lower than 100 kPa a marked increase in subharmonic amplitude with increasing pressure was observed [29]. Our group has not been able to distinguish a subharmonic at acoustic pressures this low with commercially available agents, presumably due to either a lack of sensitivity in the measurement system or perhaps a novel property of the experimental agent used by Frinking and colleagues.
Preliminary studies using commercial ultrasound systems have been conducted in vivo by our group with promising results. Portal vein pressure studies in 14 canines showed an inverse linear relationship between portal vein pressure and subharmonic amplitude (r2 > 0.90;p ≤ 0.01) [30]. Moreover, preliminary cardiac results in 4 canines have been encouraging with resolution on the order of 2 to 10 mmHg [31]. Finally, a proof of concept for SHAPE as a noninvasive monitor of interstitial fluid pressure was recently provided [32]. While these results are promising, the parameter refinements examined in this study are expected to further improve future results.
In conclusion, SHAPE has the potential to become an important, noninvasive clinical tool for measuring changes in pressure. Sonazoid was established to be the optimal agent for lower frequency SHAPE applications such as cardiac and portal vein pressure estimation. Real-time SHAPE has been implemented on a commercial ultrasound scanner and offers the possibility of allowing pressures in the heart and elsewhere in the body, e.g. in the liver and locally advanced breast cancer, to be obtained noninvasively.
ACKNOWLEDGMENTS
This work was supported by American Heart Association grant 06554414 as well as by the U.S. Army Medical Research Material Command under grant W81XWH-08–1-0503 (VGH), National Institute of Health R21 HL081892 and RC1 DK087365 (JRE).
REFERENCES
- [1].Goldberg BB, Raichlen JS, Forsberg F. Ultrasound Contrast Agents: Basic Principles and Clinical Applications (2nd ed). Martin Dunitz Ltd., London, 2001. [Google Scholar]
- [2].Forsberg F, Shi WT, Goldberg BB. Subharmonic imaging of contrast agents. Ultrasonics, 38, 93–98, 2000. [DOI] [PubMed] [Google Scholar]
- [3].Simpson DH, Chin CT, Burns PN. Pulse inversion Doppler: a new method for detecting nonlinear echoes from microbubble contrast agents. IEEE Trans Ultrason Ferroelec Freq Contr, 46, 372–382, 1999. [DOI] [PubMed] [Google Scholar]
- [4].Forsberg F, Liu JB, Chiou HJ, Rawool NM, Parker L, Goldberg BB. Comparison of fundamental and wideband harmonic contrast imaging of liver tumors. Ultrasonics, 38, 110–113, 2000. [DOI] [PubMed] [Google Scholar]
- [5].Shi WT, Forsberg F, Hall AL, Chiao RY, Liu JB, Miller S, Thomenius KE, Wheatley MA, Goldberg BB. Subharmonic imaging with contrast agents: initial results. Ultrasonic Imag, 21, 79–94, 1999. [DOI] [PubMed] [Google Scholar]
- [6].Shi WT, Forsberg F, Raichlen JS, Needleman L, Goldberg BB. Pressure dependence of subharmonic signals from contrast microbubbles. Ultrasound Med. Biol, 25, 275–283, 1999. [DOI] [PubMed] [Google Scholar]
- [7].Forsberg F, Piccoli CW, Merton DA, Palazzo JJ, Hall AL. Breast lesions: imaging with contrast-enhanced subharmonic US - initial experience. Radiology, 244, 718–726, 2007. [DOI] [PubMed] [Google Scholar]
- [8].Forsberg F, Liu JB, Shi WT, Ro R, Lipcan KJ, Deng X, Hall AL. In vivo perfusion estimation using subharmonic contrast microbubble signals. J Ultrasound Med, 25, 15–21, 2006. [DOI] [PubMed] [Google Scholar]
- [9].Forsberg F, Liu JB, Shi WT, Furuse J, Shimizu M, Goldberg BB. In vivo pressure estimation using subharmonic contrast microbubble signals: proof of concept. IEEE Trans Ultrason Ferroelec Freq Control, 52, 581–583, 2005. [DOI] [PubMed] [Google Scholar]
- [10].Shankar PM, Krishna PD, Newhouse VL. Advantages of subharmonic over second harmonic backscatter for contrast-to-tissue echo enhancement. Ultrasound Med. Biol, 24, 395–399, 1998. [DOI] [PubMed] [Google Scholar]
- [11].Chomas J, Dayton P, May D, Ferrara K. Nondestructive subharmonic imaging. IEEE Trans Ultrason Ferroelec Freq Contr, 49, 883–892, 2002. [DOI] [PubMed] [Google Scholar]
- [12].Goertz DE, Cherin E, Needles A, Burns PN, Foster FS. High frequency nonlinear B-scan imaging of microbubble contrast agents. IEEE Trans Ultrason Ferroelectr Freq Control, 52, 65–79, 2005. [DOI] [PubMed] [Google Scholar]
- [13].Needles A, Goertz DE, Karshafian R, Cherin E, Brown AS, Burns PN, Foster FS. High-frequency subharmonic pulsed-wave Doppler and color flow imaging of microbubble contrast agents. Ultrasound Med Biol, 34, 1139–1151, 2008. [DOI] [PubMed] [Google Scholar]
- [14].Strauss AL, Roth FJ, Rieger H. Noninvasive assessment of pressure gradients across iliac artery stenoses:duplex and catheter correlative study. J Ultrasound Med, 12, 17–22, 1993. [DOI] [PubMed] [Google Scholar]
- [15].Reddy AK, Taffet GE, Madala S, Michael LH, Entman ML, Hartley CJ. Noninvasive blood pressure measurement in mice using pulsed Doppler ultrasound. Ultrasound Med Biol, 29, 379–385, 2003. [DOI] [PubMed] [Google Scholar]
- [16].Fairbank WM, Scully MO. A new noninvasive technique for cardiac pressure measurement: resonant scattering of ultrasound from bubbles. IEEE Trans Biomed Eng, 24, 107–110, 1977 [DOI] [PubMed] [Google Scholar]
- [17].Ishihara K, Kitabatake A,Tanouchi J, Fujii K, Uematsu M, Yoshida Y, Kamada T, Tamura T, Chihara K, Shirae K. New Approach to Noninvasive Manometry Based on Pressure Dependent Resonant Shift of Elastic Microcapsules in Ultrasonic Frequency Characteristics. Jap J Appl Phys, 27 (Suppl. 27–1), 125–127, 1988. [Google Scholar]
- [18].Bouakaz A, Frinking PJA, de Jong N, Bom N. Noninvasive measurement of the hydrostatic pressure in a fluid-filled cavity based on the disappearance time of the micrometer-sized free gas bubbles. Ultrasound Med Biol, 25, 1407–1415, 1999. [DOI] [PubMed] [Google Scholar]
- [19].Postema MA, Bouakaz A, de Jong N. Noninvasive microbubble-based pressure measurements: a simulation study. Ultrasonics, 42, 759–762, 2004. [DOI] [PubMed] [Google Scholar]
- [20].Hök B. A new approach to noninvasive manometry: interaction between ultrasound and bubbles. Med Biol Eng Comput, 19, 35–39, 1981. [DOI] [PubMed] [Google Scholar]
- [21].Shi WT, Forsberg F, Goldberg BB, Raichlen JS: Method and System for Pressure Estimation Using Subharmonic Signals from Microbubble-Based Ultrasound Contrast Agents. U.S. Patent No. 6,302,845, 2001.
- [22].Halldorsdottir VG, Leodore LM, Cavanaugh B, Forsberg F. Initial in vitro study of US pressure measurements for monitoring neoadjuvant chemotherapy of breast cancer (abstract). Prog. RSNA, 338, 2009. [Google Scholar]
- [23].Eisenbrey JR, Dave JK, Halldorsdottir VG, Merton DA, Machado P, Liu JB, Miller C, Gonzalez JM, Park S, Dianis S, Chalek CL, Thomenius KE, Brown DB, Navarro V, Forsberg F. Simultaneous grayscale and subharmonic ultrasound imaging on a modified commercial scanner. Ultrasonics, 2011. In Press, Corrected Proof, Available online 10 May 2011. [DOI] [PMC free article] [PubMed]
- [24].Katiyar A, Sarkar K, Forsberg F. Modeling subharmonic response from contrast microbubbles as a function of ambient static pressure. J Acoust Soc Am, 129 (4), 2325–2335, 2011. [DOI] [PMC free article] [PubMed] [Google Scholar]
- [25].Andersen KS, Jensen JA. Impact of acoustic pressure on ambient pressure estimation using ultrasound contrast agent. Ultrasonics, 50, 294–299, 2010. [DOI] [PubMed] [Google Scholar]
- [26].Adam D, Sapunar M, Burla E. On the relationship between encapsulated ultrasound contrast agent and pressure. Ultrasound Med. Biol, 31, 673–686, 2005. [DOI] [PubMed] [Google Scholar]
- [27].Ganor Y, Adam D, Kimmel E. Time and pressure dependence of acoustic signals radiated from microbubbles. Ultrasound Med. Biol, 31, 1367–1374, 2005. [DOI] [PubMed] [Google Scholar]
- [28].Adam D, Burla E. Blood pressure estimation by processing of echocardiography signals. Compu Cardiol, 28, 609–612, 2001. [Google Scholar]
- [29].Frinking PJA, Gaud E, Brochot J, Arditi M. Subharmonic scattering of phospholipid-shell microbubbles at low acoustic pressure amplitudes. IEEE Trans Ultrason Ferroelectr Freq Control, 57, 1762–1771, 2010. [DOI] [PubMed] [Google Scholar]
- [30].Dave JK, Halldorsdottir VG, Eisenbrey JR, Liu JB, Lin F, Zhou JH, Wang HK, Thomenius K, Forsberg F. In vivo subharmonic pressure estimation of portal hypertension in canines. Proc IEEE US Symp, 778–781, 2010
- [31].Forsberg F, Halldorsdottir VG, Dave JK, McDonald M, Liu JB, Leung C, Dickie K. In vivo noninvasive cardiac subharmonic pressure estimation (abstract). Ultrasonic Imaging, 31, 45–46, 2009. [Google Scholar]
- [32].Halldorsdottir VG, Dave JK, Eisenbrey J, Machado P, Liu JB, Merton DA, Cavanaugh BC, Forsberg F. Subharmonic aided pressure estimation for monitoring interstitial fluid pressure in tumors: in vitro and in vivo proof of concept (abstract). J Ultrasound Med, 30, S28, 2011. [DOI] [PMC free article] [PubMed] [Google Scholar]


