

Abstract
Circadian rhythmicity is a defining feature of mammalian metabolism that synchronizes metabolic processes to day-night light cycles. Here, we show that the intestinal microbiota programs diurnal metabolic rhythms in the mouse small intestine through histone deacetylase 3 (HDAC3). The microbiota induced expression of intestinal epithelial HDAC3, which was recruited rhythmically to chromatin and produced synchronized diurnal oscillations in histone acetylation, metabolic gene expression, and nutrient uptake. HDAC3 also functioned non-canonically to coactivate estrogen related receptor α (ERRα), inducing microbiota-dependent rhythmic transcription of the lipid transporter gene Cd36 and promoting lipid absorption and diet-induced obesity. Our findings reveal that HDAC3 integrates microbial and circadian cues to regulate diurnal metabolic rhythms, and pinpoint a key mechanism by which the microbiota controls host metabolism.
One sentence summary:
The intestinal microbiota induces daily metabolic rhythms and controls lipid uptake through the enzyme histone deacetylase 3.
Mammalian metabolism is acutely sensitive to environmental cues. These include circadian day-night light cycles, which govern when food is consumed, and the microbiome, which impacts how food is digested. The intestinal microbiota shapes the expression of host metabolic pathways and influences the development of obesity (1–4). Environmental light signals entrain rhythms in gene expression that are synchronized with the day-night light cycle through the circadian clock (5–7). This circadian synchronization is fundamental to metabolic processes that must be coupled to diurnal sleep-wake and feeding-fasting cycles. It is becoming clear that there is cross-talk between the microbiota and circadian pathways that impacts host metabolism (5–9). However, the molecular mechanisms by which diurnal light signals and the microbiota converge to regulate metabolism are largely unknown.
The microbiota controls diurnal rhythms in epithelial cell histone acetylation
A key mechanism by which the circadian clock generates rhythms in metabolic gene expression is by regulating the recruitment of histone modifiers to chromatin (10–13). We therefore investigated whether the microbiota might regulate host circadian gene expression by altering histone modifications. We collected small intestinal epithelial cells (IECs) from conventional (CV) and germ-free (GF) mice across a 24-hour cycle (fig. S1A). We then performed RNA sequencing (RNA-seq) and chromatin immunoprecipitation followed by sequencing (ChIP-seq) of H3K9ac and H3K27ac, two histone acetylation marks that indicate active promoters and enhancers. As expected, both acetylation marks localized to the regulatory regions of actively transcribed genes (fig. S1B,C). Both H3K9ac and H3K27ac showed synchronized diurnal oscillations in CV IECs with peaks between Zeitgeber time (ZT) 8 and 16 (where ZT0 is light on and ZT12 is light off), and troughs between ZT20 and ZT4 (Fig. 1A,B, Table S2).
Figure 1: Histone acetylation in small intestinal epithelial cells exhibits synchronized diurnal rhythmicity that depends on the microbiota.
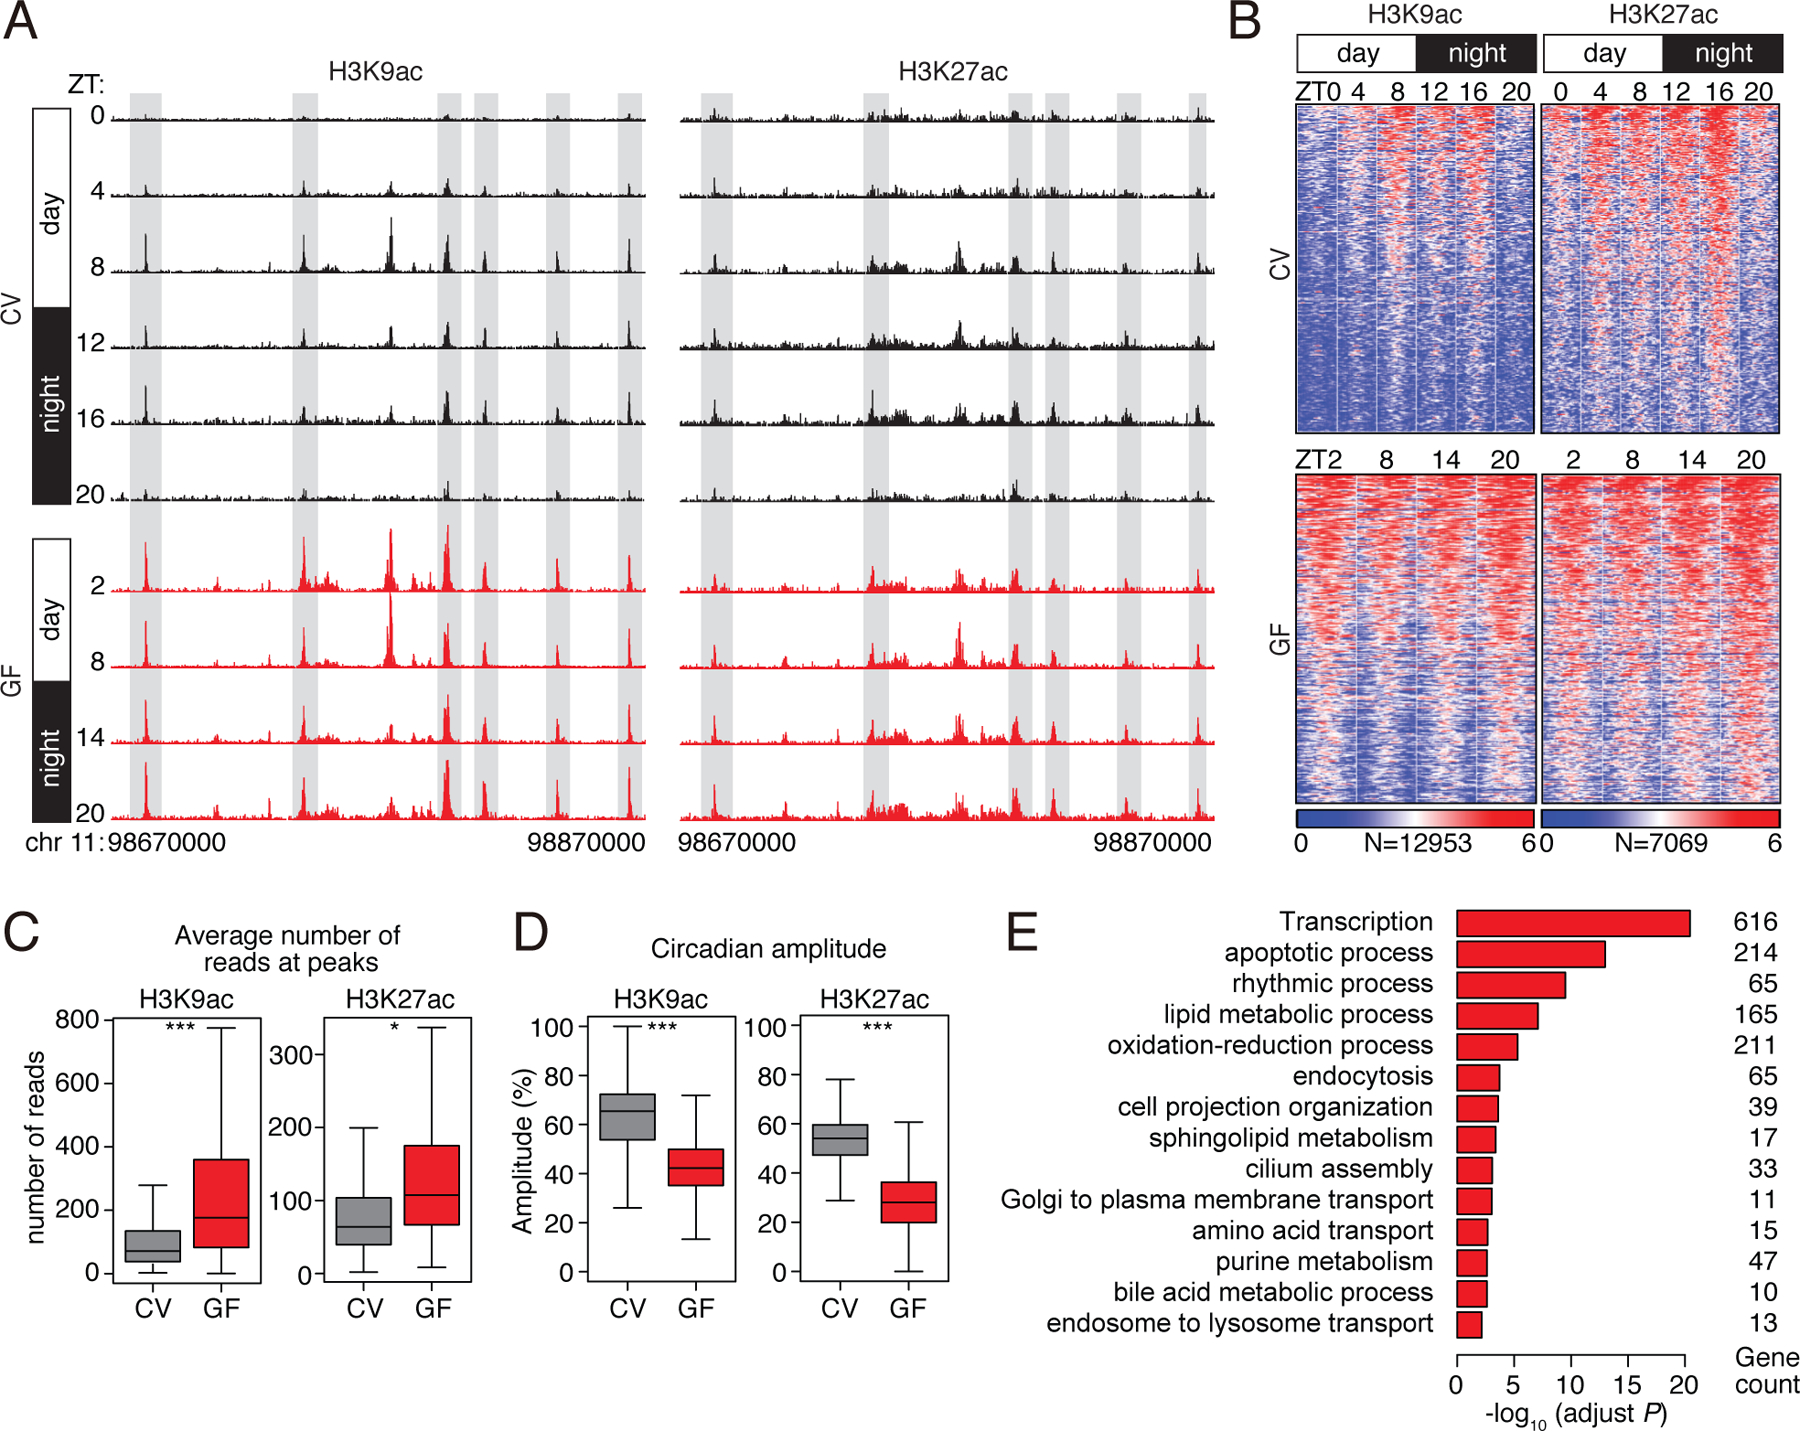
(A) Genome browser view of the 200 kb region surrounding the Nr1d1 locus, showing ChIP-seq analysis of H3K9ac and H3K27ac marks in small intestinal epithelial cells. The analysis was done across a circadian cycle in CV and GF mice. Each track represents the normalized ChIP-seq read coverage at a single time point. Examples of peaks showing microbiota-dependent diurnal rhythmicity are highlighted in gray. N=3 pooled biological replicates per library. (B) Heat maps of H3K9ac and H3K27ac signals (log (reads at 50 bp windows)) from −1 to +1 kb surrounding the centers of all cycling H3K9ac and H3K27ac peaks (adjust P<0.01 by JTK). Each peak in the genome is represented as a horizontal line, ordered vertically by signal strength, and the analysis was done across a circadian cycle in CV and GF mice. The number of peaks in the genome is indicated at the bottom. The blue-red gradient indicates the coverage or signal strength (normalized uniquely mapped reads per 20 million reads). Intensity (C) and amplitude (D) of H3K9ac and H3K27ac peaks in CV and GF mice. *P<0.05, ***P<0.001 by one-tailed paired t-test. (E) Enriched GO categories in genes having H3K9ac- and H3K27ac-targeted genes as determined by the DAVID GO analysis tool. ZT, Zeitgeber; CV, conventional; GF, germ-free.
Although the majority of the H3K9ac and H3K27ac marks were present in both CV and GF mice (fig. S1D), most of the peaks did not oscillate in GF mice as they were constitutively high (Fig. 1A–D). Average signal intensities of both marks were increased and circadian amplitudes were decreased in GF mice (Fig. 1C,D). Genes involved in metabolic processes including nutrient transport and lipid metabolism were enriched near cycling histone acetylation peaks (Fig. 1E), and coincided with dampened oscillations in the abundances of transcripts encoding proteins involved in nutrient transport and lipid metabolism (fig. S2A–C). Thus, the microbiota drives synchronized diurnal oscillations in histone acetylation in the small intestine, and many of the targeted genes regulate nutrient uptake and metabolism. This behavior is distinct from the effect of the microbiota on histone acetylation in the colon, where the overall genome-wide rhythmicity of acetylation is not lost after antibiotic depletion of the microbiota (5).
The microbiota programs rhythmic histone acetylation through HDAC3
H3K9ac and H3K27ac marks cycled diurnally in CV mice but remained constitutively high in GF mice (Fig. 1A–D), suggesting a possible mechanism involving a histone deacetylase (HDAC) that is expressed and cycling in CV but not GF mice (schematic diagram shown in Fig. 2A). HDACs repress transcription by deacetylating histones but can also target non-histone proteins. We examined expression of multiple Hdac genes (Hdac1-Hdac11), finding that Hdac1 and Hdac3 were more highly expressed in IECs than the other Hdac genes (fig. S3A). However, only Hdac3 showed differential expression in CV and GF mice, with lowered abundance of Hdac3 transcripts and HDAC3 protein in IECs from GF as compared to CV mice (Fig. 2B,C; fig. S3B,C). Hdac3 expression increased in IECs after conventionalization of adult GF mice (fig. S3D), and was selectively triggered by monocolonization of GF mice with the commensal bacterial species Bacteroides thetaiotaomicron (fig. S3E). Consequently, HDAC3 protein levels also increased in GF mice monocolonized with B. thetaiotaomicron (fig. S3F). Elevated Hdac3 expression in CV mice required the Toll-like receptor adaptor protein MyD88 (14) (fig. S3G), and accordingly, MyD88−/− mice showed dampened rhythms in small intestinal histone acetylation (fig. S3H, Table S2).
Figure 2: The intestinal microbiota programs the diurnal rhythmicity of epithelial histone acetylation and gene expression through HDAC3.
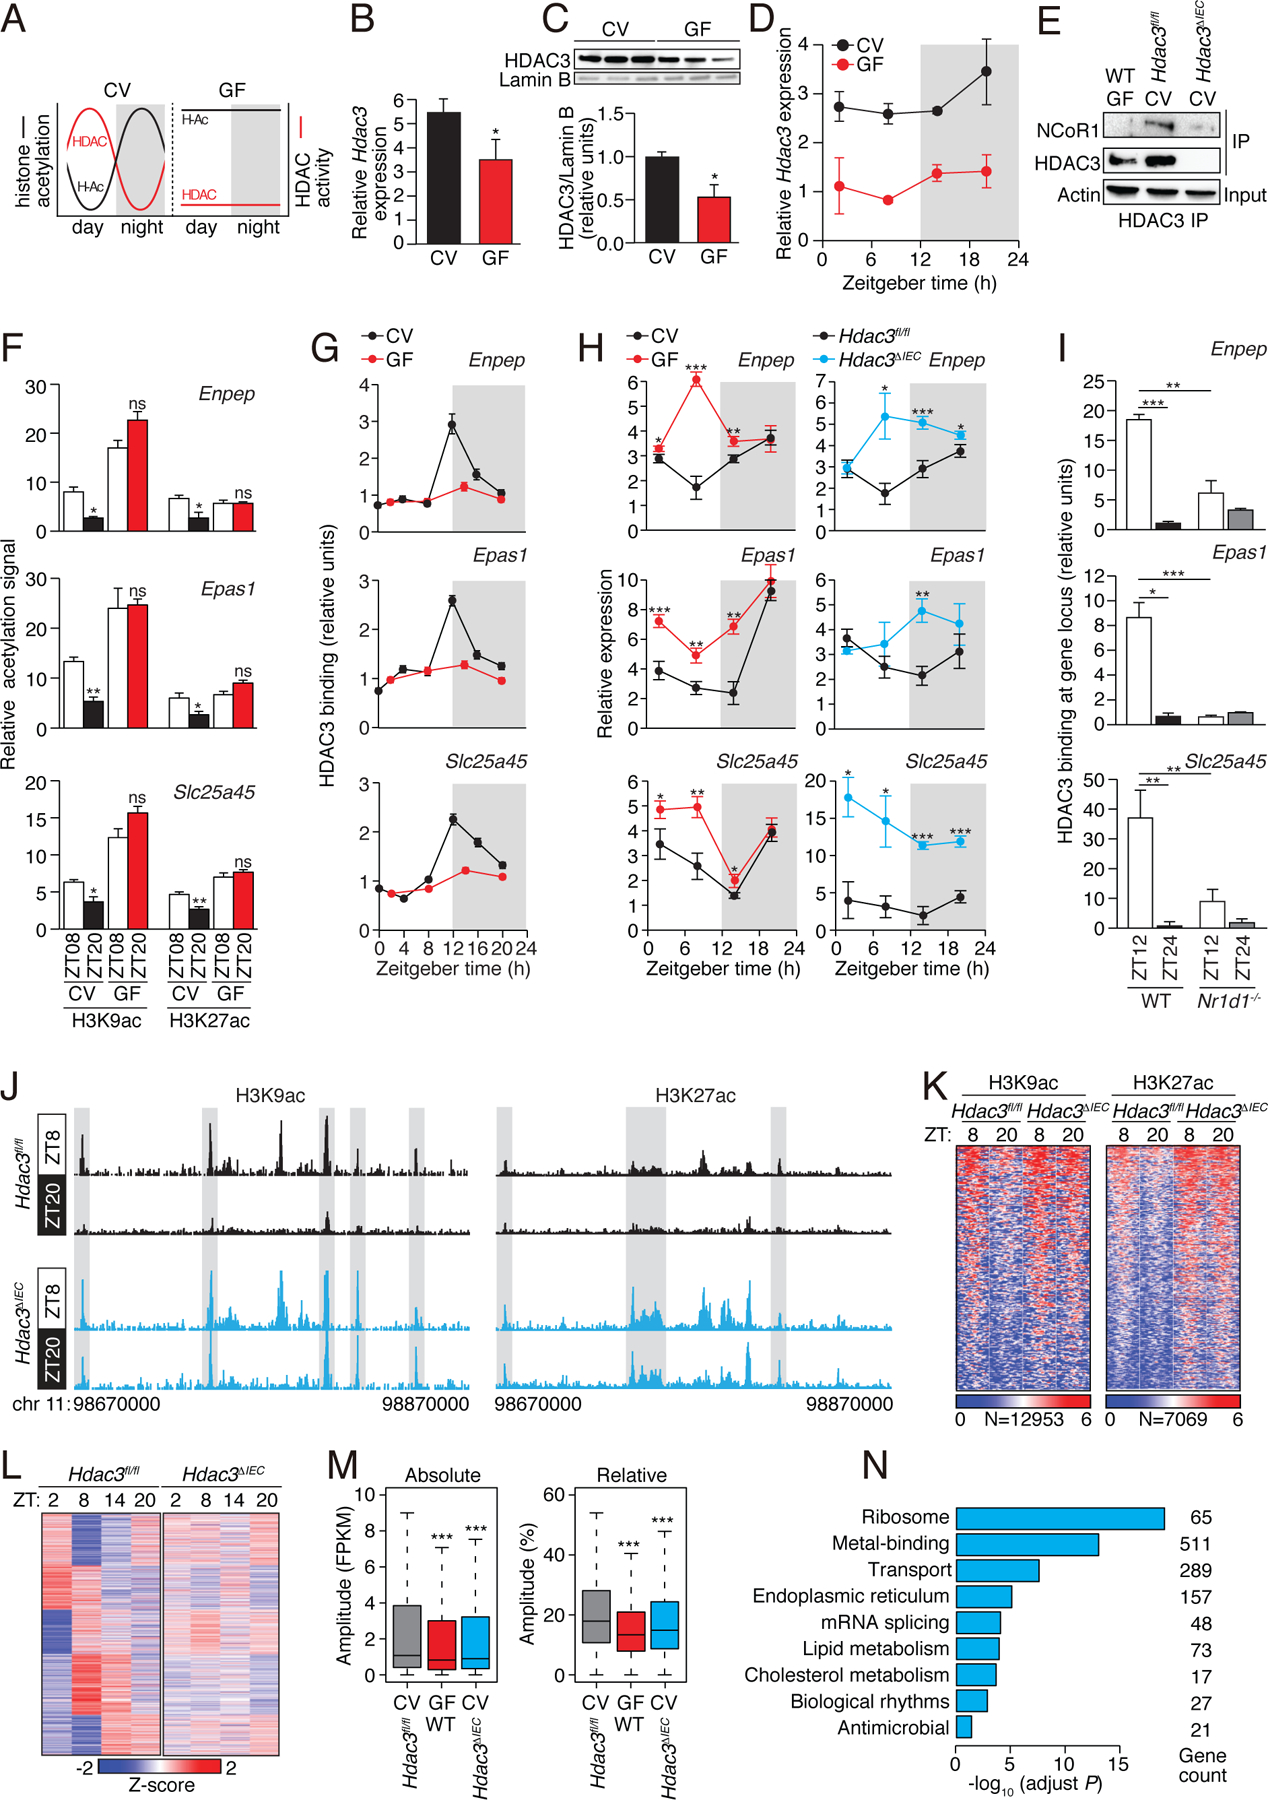
(A) Schematic diagram summarizing the diurnal histone acetylation pattern in CV and GF mice shown in Fig. 1, which suggests a loss of HDAC function in GF mice. (B) RT-qPCR analysis of Hdac3 transcripts in IECs from CV and GF mice at ZT8. N=3 mice per group. (C) Western blot of HDAC3 and Lamin B (loading control) in IECs from protein in intestinal epithelial cells from CV and GF mice at ZT8. Bands were quantified by scanning densitometry and normalized to the Lamin B band intensity. (D) RT-qPCR analysis of Hdac3 transcript abundance in epithelial cells from GF and CV mice across a 24-hour cycle. N=3 mice per group. (E) Co-immunoprecipitation of endogenous HDAC3 and NCoR1 in IECs from GF WT mice and CV Hdac3fl/fl and Hdac3ΔIEC mice. N=3 pooled biological replicates per lane. (F,G) Relative abundance of H3K9ac and H3K27ac marks (F) and bound HDAC3 (G) at the promoters of Enpep, Epas1 and Slc25a45 in CV and GF as determined by ChIP-qPCR analysis. N=3 mice per time point per group. (H) RT-qPCR analysis of Enpep, Epas1 and Slc25a45 transcript abundance in IECs from CV and GF mice or Hdac3fl/fl and Hdac3ΔIEC mice across a 24-hour cycle. N=3 mice per group. (I) Relative abundance of bound HDAC3 at the promoters of Enpep, Epas1 and Slc25a45 in small intestinal epithelial cells from WT and Nr1d1−/− mice as determined by ChIP-qPCR analysis. N=3 mice per time point per group. (J) Genome browser view of the 200 kb region surrounding the Nr1d1 locus, showing ChIP-seq analysis of H3K9ac and H3K27ac marks in small intestinal epithelial cells from Hdac3fl/fl and Hdac3ΔIEC mice. N=3 pooled biological replicates per library. (K) Heat maps of H3K9ac and H3K27ac signals (log (reads at 50 bp windows)) from −1 to +1 kb surrounding the centers of all cycling H3K9ac and H3K27ac peaks. (L) Heat map showing diurnal gene expression patterns in IECs from Hdac3fl/fl and Hdac3ΔIEC mice across a 24-hour cycle by RNA-seq. N=3 pooled biological replicates per library. (M) Absolute (Fragments Per Kilobase of transcript per Million mapped reads, FPKM) or relative oscillating amplitudes of transcripts in GF WT mice and CV Hdac3fl/fl and Hdac3ΔIEC mice. N=3 mice per group. (N) Enriched GO categories of genes with decreased cycling amplitudes as determined by DAVID. *P<0.05; **P<0.01; ***P<0.001; ns, not significant by two-tailed t-test. Means±SEM (error bars) are plotted. GF, germ-free; CV, conventional; ZT, Zeitgeber time.
We reasoned that if HDAC3 is essential for microbiota-driven diurnal rhythms in epithelial histone acetylation, then HDAC3 expression, genome recruitment, or enzymatic activity should be diurnally rhythmic. Hdac3 transcript abundances showed only a modest diurnal oscillation (Fig. 2D), suggesting that the rhythmicity in IEC histone acetylation was not driven by rhythmic Hdac3 expression. In liver and adipose tissue, rhythmicity in histone acetylation is generated when HDAC3 complexes with the nuclear receptor co-repressor (NCoR) (12, 15–18), which is recruited to chromatin in a diurnally rhythmic manner by components of the circadian clock (12). We therefore postulated that rhythms in IEC chromatin acetylation might be generated by rhythmic chromatin recruitment of HDAC3 through binding to NCoR.
In support of this idea, we found that HDAC3 complexed with NCoR in IECs, and that binding was markedly reduced in IECs from GF mice (Fig. 2E). Thus, the microbiota facilitates formation of the HDAC3-NCoR complex in IECs. We next assessed whether HDAC3 was rhythmically recruited to target genes by studying three genes, Enpep, Epas1, and Slc25a45, that showed pronounced microbiota-dependent rhythms in H3K9ac and H3K27ac marks (Fig. 2F; fig. S4A). As predicted, HDAC3 was recruited to each of these genes in a diurnally rhythmic manner that depended on the microbiota (Fig. 2G), and expression of each gene was higher in GF mice than in CV mice (Fig. 2H). Expression was also higher in mice with an IEC-specific deletion of Hdac3 (Hdac3ΔIEC) than in WT mice (Fig. 2H), consistent with the canonical function of HDAC3 as a co-repressor through histone deacetylation (18). Conventionalization of GF mice also reduced histone acetylation signals at these genes and repressed their expression (fig. S4B,C). Thus, the microbiota is required for diurnally rhythmic recruitment of HDAC3 to target gene promoters.
To further understand the molecular basis for rhythmic HDAC3 recruitment, we focused on a circadian clock repressor, REV-ERBα (encoded by the Nr1d1 gene), which recruits the HDAC3-NCoR complex diurnally to the mouse liver genome (12). Binding of HDAC3 to target genes was reduced in the absence of REV-ERBα (Fig. 2I), and genome-wide diurnal changes in H3K9ac marks were lost in Nr1d1−/− mice (fig. S3I, Table S2). Thus, the microbiota enhances formation of the HDAC3-NCoR complex, which is recruited rhythmically to target genes by REV-ERBα. This generates diurnal rhythms in histone deacetylation in IECs.
To determine whether HDAC3 drives genome-wide rhythmic histone acetylation in IECs, we detected H3K9ac and H3K27ac marks by ChIP-seq in IECs from Hdac3ΔIEC mice. Both marks showed diurnal changes in Hdac3fl/fl IECs but remained constitutively high in the Hdac3ΔIEC IECs (Fig. 2J,K, Table S2). We also performed RNA-seq of Hdac3fl/fl and Hdac3ΔIEC IECs across a circadian cycle. Rhythmic oscillations in the abundances of 2729 transcripts were dampened in Hdac3ΔIEC IECs, approximating the amplitudes seen in GF mice (Fig. 2L,M). Genes having dampened oscillations in Hdac3ΔIEC mice were enriched for nutrient transport and lipid metabolism pathways (Fig. 2N), similar to the enrichment of these pathways among genes with oscillating acetylation marks (Fig. 1E). Rhythmic expression of the clock genes Bmal1 (Arnt1), Per2, and Nr1d1 was maintained in Hdac3ΔIEC IECs (Fig. 3A,B; Table S3), indicating that the core clock mechanism remains intact. Thus, the intestinal microbiota regulates genome-wide diurnal rhythms in IEC acetylation and gene expression through HDAC3.
Figure 3: Intestinal epithelial HDAC3 regulates the diurnal rhythmicity of nutrient uptake.
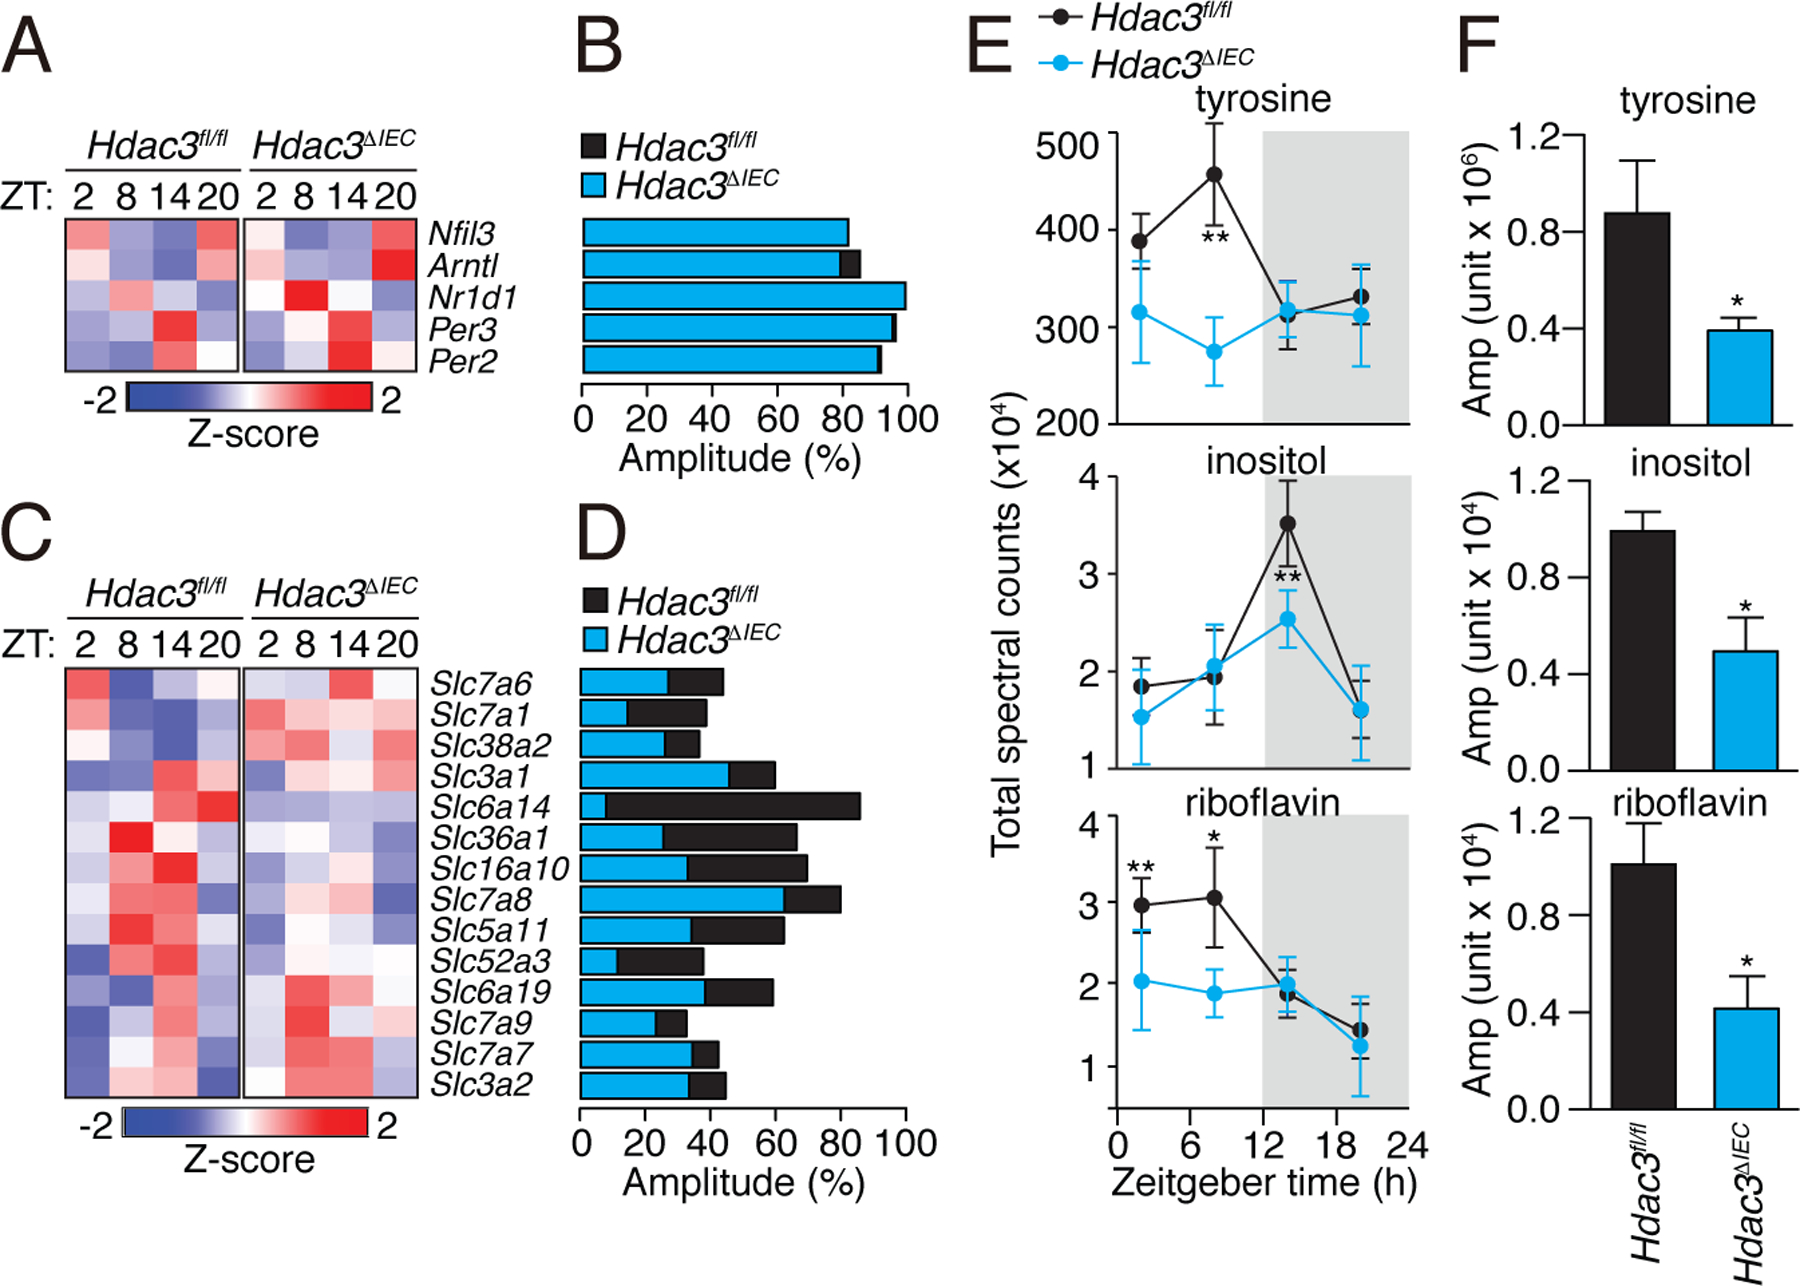
(A) Diurnal expression pattern of circadian clock genes in Hdac3fl/fl and Hdac3ΔIEC mice IECs are represented by a heat map, with amplitudes shown in (B). (C) Diurnal expression patterns of transporter genes in Hdac3fl/fl and Hdac3ΔIEC mice IECs are represented by a heat map, with amplitudes shown in (D). (E) Diurnal oscillations of serum tyrosine, inositol and riboflavin in Hdac3fl/fl and Hdac3ΔIEC mice with the amplitudes shown in (F). N=3 mice per group. *P<0.05 by two-tailed t-test.
Epithelial HDAC3 regulates rhythmic nutrient uptake
The RNAseq analysis identified several nutrient transporter genes with diurnally rhythmic expression that was dampened in Hdac3ΔIEC mice (Fig. 3C,D; Table S3). These genes included Slc5a11, Slc52a3, and Slc16a10, which transport aromatic amino acids, inositol, and riboflavin respectively (19–22). Accordingly, Hdac3ΔIEC mice showed dampened daily rhythms in the serum concentrations of several metabolites, including tyrosine (an aromatic amino acid), inositol, and riboflavin (Fig. 3E,F; fig. S5; Table S4). This suggests that epithelial HDAC3 regulates nutrient uptake in the small intestine.
Epithelial HDAC3 controls intestinal lipid absorption
Genes with functions in lipid metabolism also showed dampened diurnal expression rhythms in the Hdac3ΔIEC mice. Seventeen of these genes showed increased overall expression in the Hdac3ΔIEC mice, including Acsl3, Cpt1a/b, Ppara, and Agpat2, which participate in fatty acid β-oxidation and lipid biosynthesis (Fig. 4A,B; Table S3). In contrast, eighteen genes that regulate lipid uptake and processing had decreased overall expression in the Hdac3ΔIEC mice. These genes included Cd36, encoding a fatty acid transporter (23), Fabp4/5, encoding fatty acid binding proteins (24), and Scd1, encoding a stearoyl-coenzyme A-desaturase (25)(Fig. 4A,B; Table S3). Consistent with the reduced Cd36 expression, Hdac3ΔIEC mice had lowered IEC total lipid concentrations and increased fecal lipid concentrations (Fig. 4C,D). Our finding of decreased lipid uptake differs from a prior report of increased lipid stores in IECs of Hdac3ΔIEC mice (26). However, we note that the mice in the prior study were fed a defined safflower lipid diet that differs from the HFD used in our studies (TestDiet AIN-76A), possibly explaining the discordant findings. We also observed lower concentrations of serum triglycerides and non-esterified fatty acids (Fig. 4E) and dampened diurnal rhythms in serum triglyceride concentrations in the Hdac3ΔIEC mice (Fig. 4F,G). Thus, HDAC3 enhances expression of the lipid transporter CD36, stimulates lipid uptake by IECs, and promotes diurnal rhythmicity in serum triglyceride concentrations.
Figure 4: Intestinal epithelial HDAC3 controls lipid absorption in the intestine.
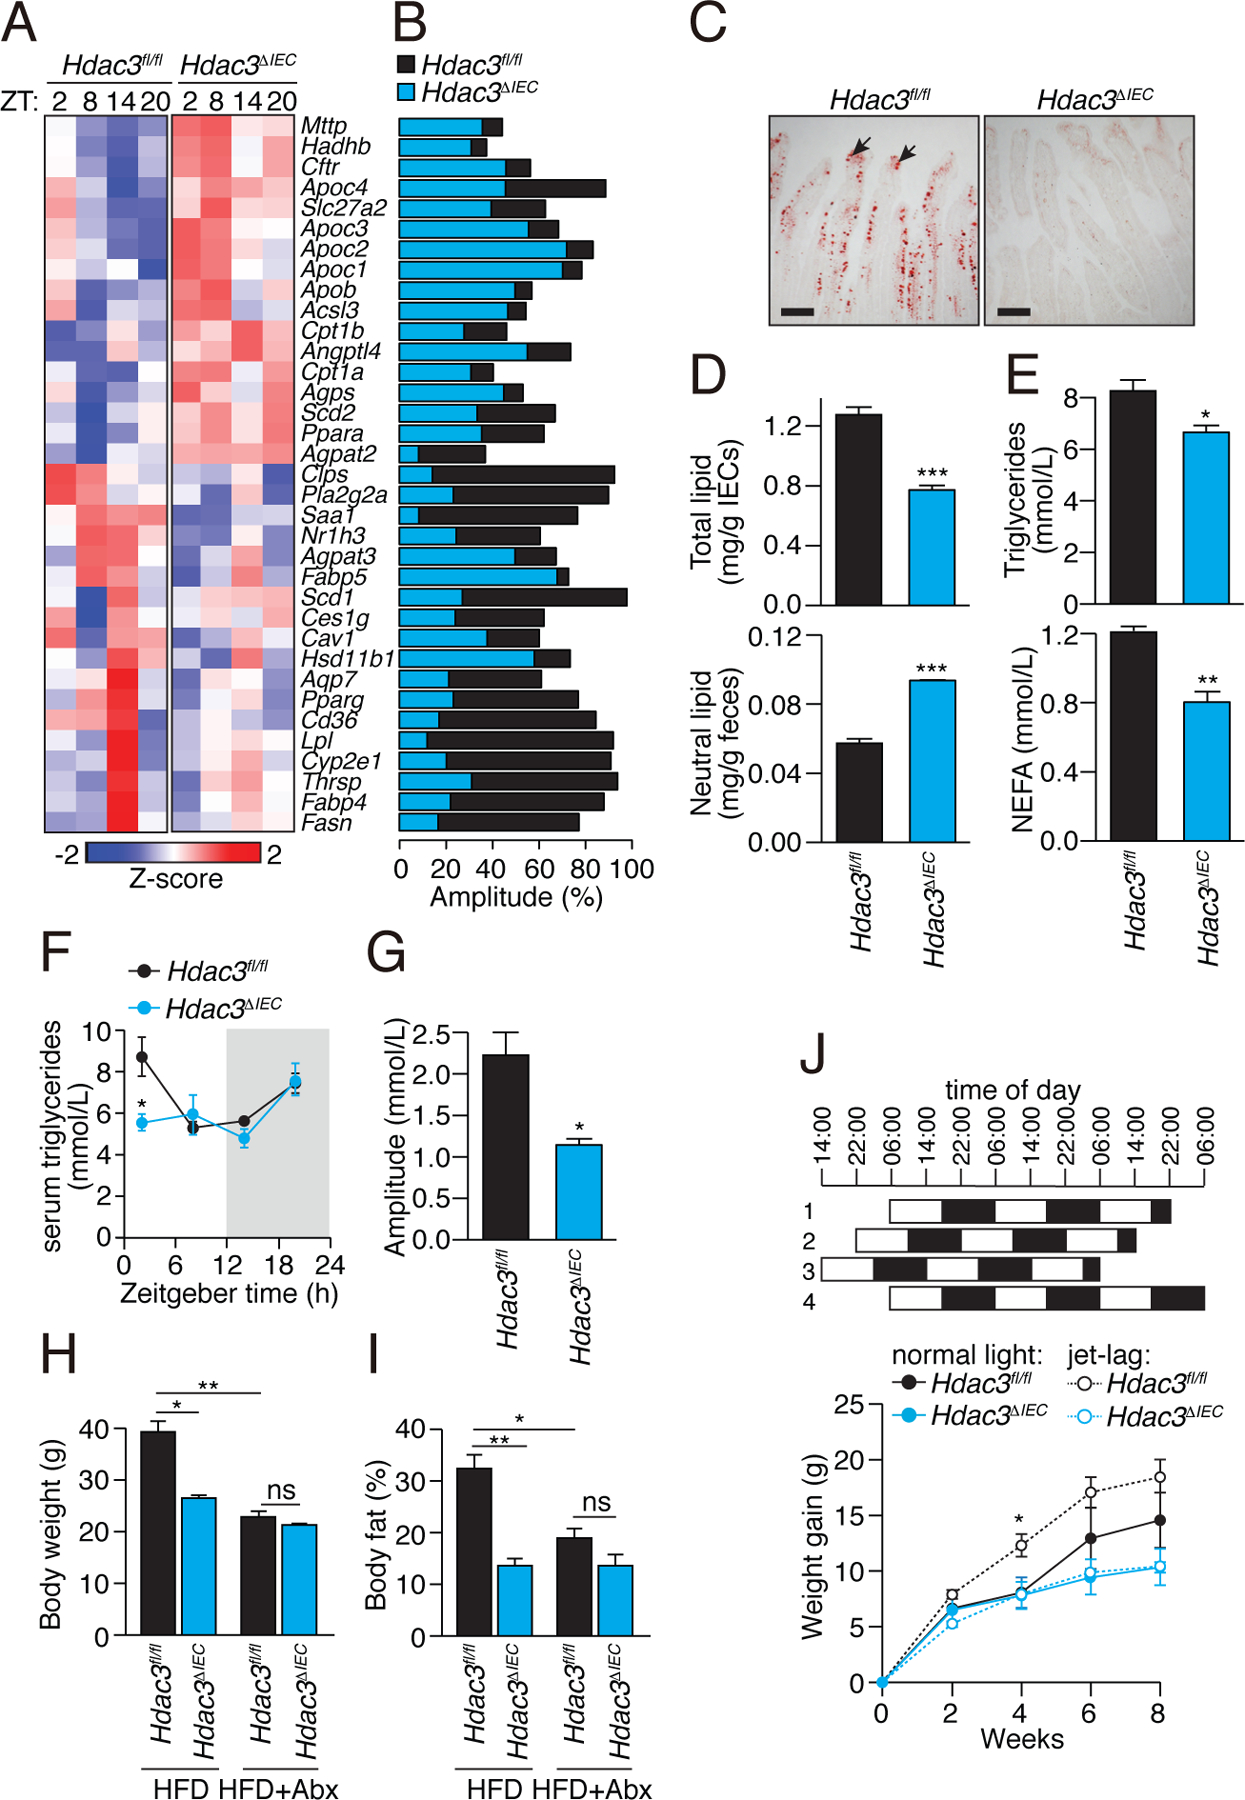
(A) Diurnal expression pattern of lipid metabolic genes in IECs from Hdac3fl/fl and Hdac3ΔIEC mice IECs is represented by a heat map, with amplitudes shown in (B). (C) Oil red O staining of lipids in small intestines of Hdac3fl/fl and Hdac3ΔIEC mice fed a HFD. Intestines were harvested at ZT8. Black arrows indicate epithelial cells. Scale bars=100 μm. (D) Quantification of total lipids (at ZT8) in IECs and neutral lipids in feces from Hdac3fl/fl and Hdac3ΔIEC mice fed a HFD. N=6, 5 mice per group. ***P<0.001 by two-tailed t-test. (E) Quantification of triglycerides and free fatty acids (at ZT4) in serum from Hdac3fl/fl and Hdac3ΔIEC mice fed a HFD. N=6, 5 mice per group. *P<0.05; **P<0.01 by one-tailed t-test. (F) Diurnal oscillations of serum triglyceride concentrations in Hdac3fl/fl and Hdac3ΔIEC mice fed a chow diet, with amplitudes shown in (G). N=3 mice per group. *P<0.05 by one-tailed t-test. Statistical test for circadian rhythms: P=0.002 for Hdac3fl/fl and P=0.287 for Hdac3ΔIEC mice. (H,I) Weight (H) and body fat percentage (I) of Hdac3fl/fl and Hdac3ΔIEC mice fed a HFD with or without antibiotics for 10 weeks. N=5 mice per group. *P<0.05; **P<0.01; ns, not significant by one-tailed t-test. (J) Weight gain in mice fed a HFD with or without jet lag. Jet lag was induced by an 8-hour light cycle shift every three days. N=5 mice per group). *P<0.05 two-tailed t-test. Means±SEM (error bars) are plotted. ZT, Zeitgeber time; HFD, high fat diet.
The lowered lipid uptake into Hdac3ΔIEC IECs suggested that the Hdac3ΔIEC mice might be protected against high fat diet-induced obesity. Indeed, when placed on a high-fat, high-sugar Western-style diet (HFD) for 10 weeks, the Hdac3ΔIEC mice maintained lower body weights and had lower body-fat percentages than Hdac3fl/fl mice (Fig. 4H,I; fig. S6A), which accords with a prior report (26). The Hdac3ΔIEC mice also had increased glucose tolerance, decreased insulin resistance, smaller epididymal fat pads, and less liver fat accumulation (fig. S6B–D). The metabolic differences between Hdac3fl/fl and Hdac3ΔIEC mice were not due to altered physical activity, energy utilization (fig. S7A), food intake (fig. S7B,C), or altered microbiota taxonomic composition (fig. S8A,B), which were similar between the two groups. The HFD caused marked changes in the microbiota, but the changes were not HDAC3-dependent (fig. S8C,D). Thus, epithelial HDAC3 enables HFD-induced obesity in mice, likely by enhancing intestinal lipid absorption.
The microbiota is essential for diet-induced obesity, and thus GF mice have lower body fat percentages and are protected from HFD-induced obesity relative to CV mice (2). The lowered expression and dampened rhythmic recruitment of HDAC3 to epithelial chromatin in GF mice suggested a causal role for epithelial HDAC3 in microbiota-dependent obesity. Depletion of the microbiota through antibiotic treatment produced lowered body weight and body fat percentages in the Hdac3fl/fl mice, resulting in body compositions that did not differ significantly from those of Hdac3ΔIEC mice (Fig. 4H,I). Thus, epithelial HDAC3 is necessary for the microbiota to promote HFD-induced obesity in mice.
Chronic circadian light cycle disruptions exacerbate HFD-induced obesity in mice (8). Consistent with prior findings (8), Hdac3fl/fl mice subjected to experimental jet lag (an 8-hour shift every 3 days) gained weight faster than Hdac3fl/fl mice on a normal day-night light cycle (Fig. 4J). However, Hdac3ΔIEC mice were protected from the metabolic effects of jet lag and gained weight at a similar rate as Hdac3ΔIEC mice on a normal light cycle. Their overall weight gain was also lower than Hdac3fl/fl mice that were either jet-lagged or under a normal light cycle. Thus, epithelial HDAC3 worsens jet lag-induced obesity in mice.
Epithelial HDAC3 controls rhythmic expression of Cd36
We next investigated the molecular mechanisms by which HDAC3 regulates the rhythmic expression of lipid metabolic pathways in the small intestinal epithelium. Canonically, HDAC3 acts as a corepressor through its histone deacetylation activity. The elevated expression of genes involved in fatty acid β-oxidation and lipid biosynthesis in Hdac3ΔIEC mice (Fig. 4A) suggested that HDAC3 functions canonically as a corepressor of these genes. Accordingly, H3K9ac marks at Cpt1a, Acsl3, Ppara, and Agpat2 oscillated diurnally in conventional mice but were constitutively elevated and non-rhythmic in GF mice and conventional Hdac3ΔIEC mice (Fig. 5A,B; fig. S9A,B; Table S5), consistent with HDAC3 promoting histone deacetylation that suppresses transcription of these genes.
Figure 5: Epithelial HDAC3 regulates expression of the lipid transporter gene Cd36 by coactivating ERRα through PGC-1α.
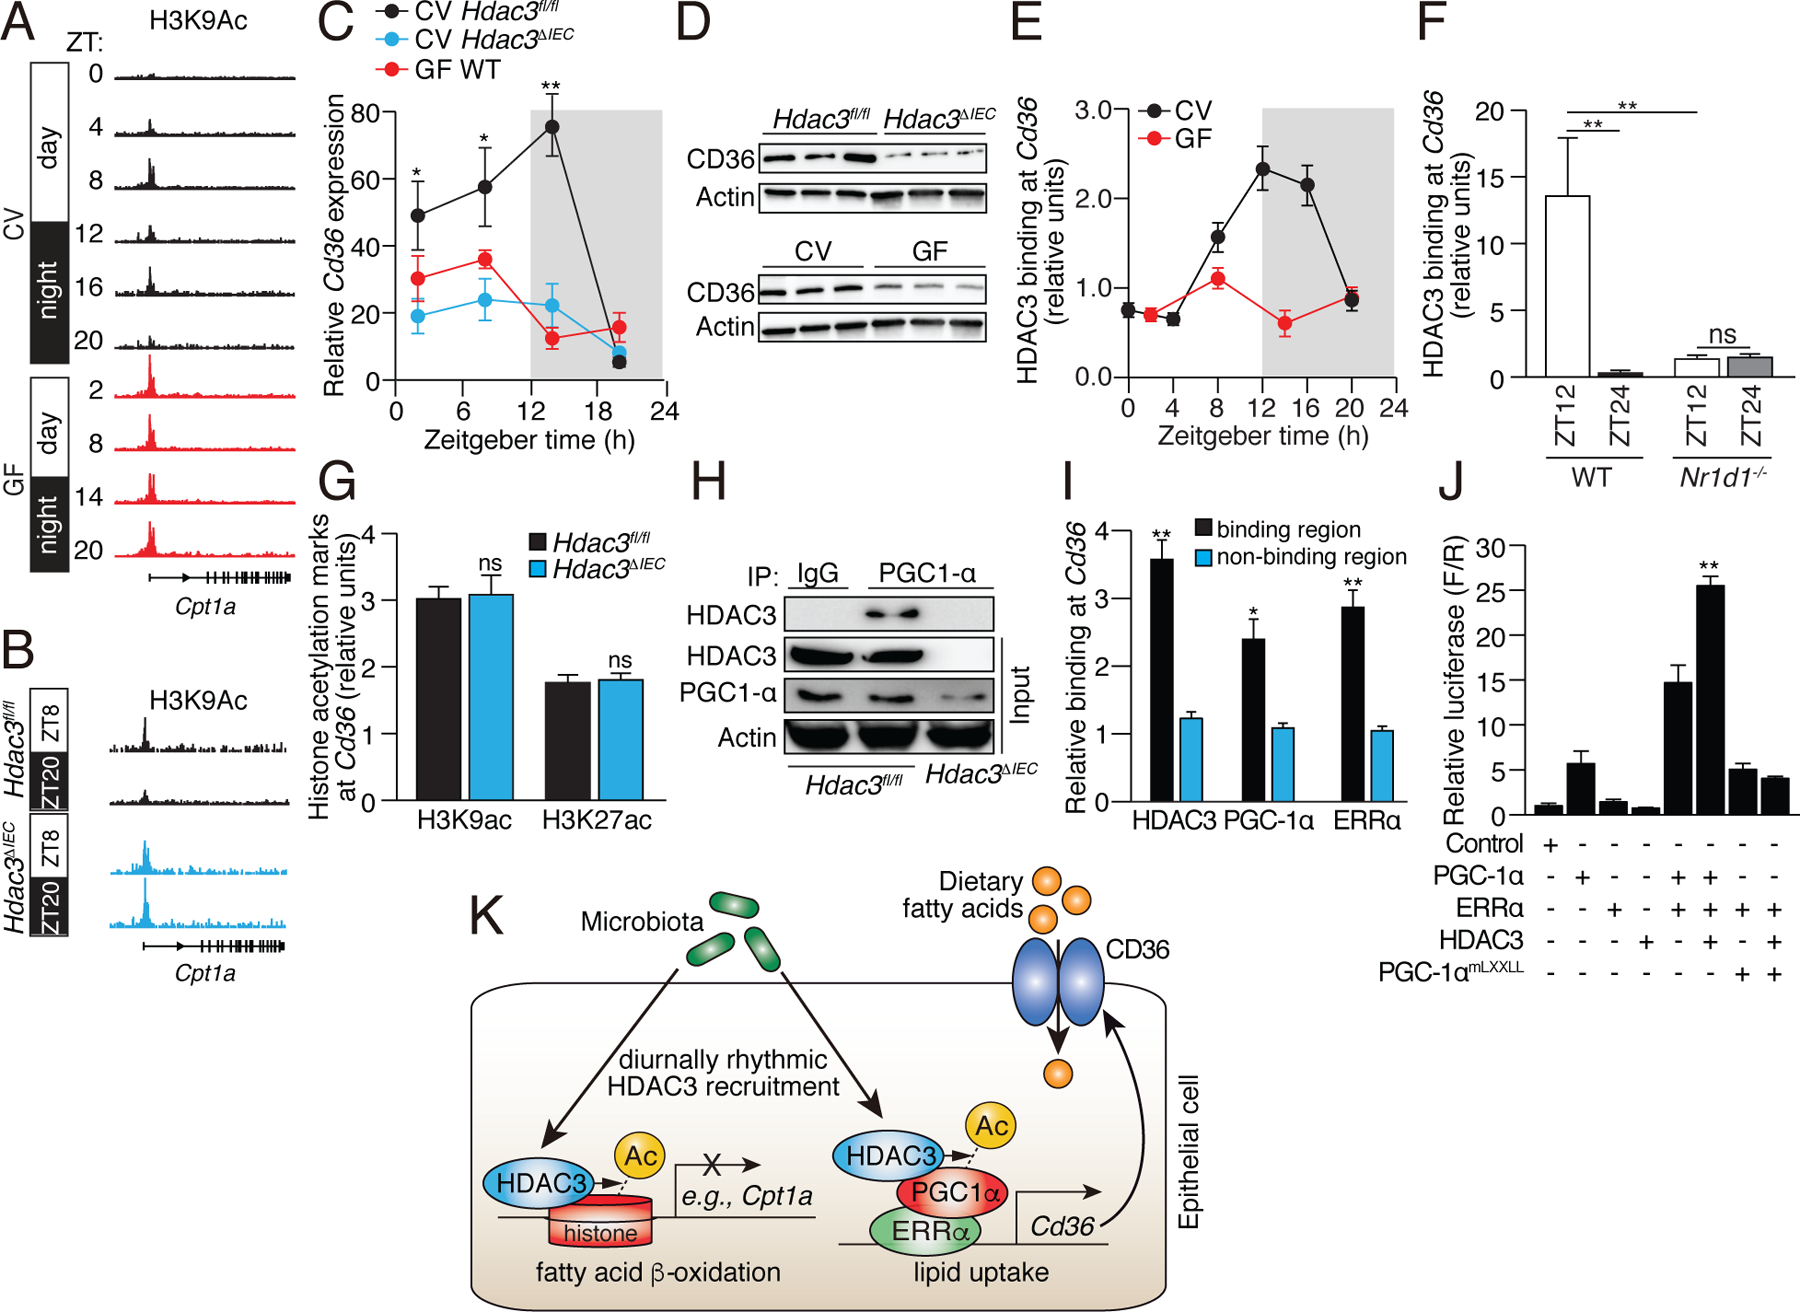
(A,B) Genome browser view of the Cpt1a locus, showing H3K9ac marks in small intestinal epithelial cells from CV and GF WT mice (A), and CV Hdac3fl/fl and Hdac3ΔIEC mice (B). Statistical test for circadian rhythms: P=0.0007 for CV, P=0.504 for GF, and P=0.00012 for Hdac3fl/fl and Hdac3ΔIEC mice. (C,D) Diurnal expression of Cd36 transcript (C) and protein (D) in IECs from Hdac3fl/fl CV mice, Hdac3ΔIEC CV mice and GF WT mice. N=3 mice per group. (E) ChIP-qPCR analysis of HDAC3 binding at the Cd36 promoter in CV and GF mice across a day-night cycle. (F) Relative abundance of bound HDAC3 at Cd36 in small intestinal epithelial cells from WT and Nr1d1−/− mice as determined by ChIP-qPCR analysis. N=3 mice per time point per group. (G) ChIP-qPCR analysis of H3K9ac and H3K27ac marks at Cd36 in IECs from Hdac3fl/fl and Hdac3ΔIEC mice (at ZT14). (H) Co-immunoprecipitation of endogenous HDAC3 and PGC-1α in IECs from Hdac3fl/fl and Hdac3ΔIEC mice. N=3 pooled biological replicates per lane. (I) ChIP-qPCR analysis of HDAC3, PGC-1α and ERRα shows co-localization at the Cd36 promoter in IECs from CV WT mice. “Binding region” refers to a known binding site for each protein at the Cd36 locus in adipose tissue (17). N=3 mice per group. (J) Luciferase reporter assay of transcription driven by a Cd36 promoter, demonstrating combinatorial effects of HDAC3, PGC-1α and ERRα. Empty vector was used in the control group. N=3 per group. (K) Model showing how the intestinal microbiota regulates diurnal rhythms in epithelial metabolic pathways through HDAC3. *P<0.05; **P<0.01; ns, not significant by two-tailed t-test. Means±SEM (error bars) are plotted. ZT, Zeitgeber time; CV, conventional; GF, germ-free.
By contrast, genes that control lipid uptake, transport, and processing, including Cd36, Scd1, and Fabp4, showed lowered expression in Hdac3ΔIEC IECs (Fig. 4A). This suggested that HDAC3 regulates expression of these genes either indirectly or through a non-canonical coactivation mechanism. Several of the genes in this group (including Cd36, Scd1, and Fabp4) are induced by the microbiota through the circadian transcription factor NFIL3 (7), suggesting that HDAC3 might regulate their expression by controlling Nfil3 expression. However, Nfil3 expression was not markedly altered in Hdac3ΔIEC mice and remained rhythmic (Fig. 3A,B), arguing against a role for NFIL3.
To further understand the mechanism of gene activation by HDAC3 we studied the fatty acid transporter gene Cd36. Cd36 expression in the intestinal epithelium oscillated diurnally in conventional Hdac3fl/fl mice, but the oscillations were dampened and overall transcript and protein levels were lowered in GF mice and CV Hdac3ΔIEC mice (Fig. 5C,D). This finding supports the idea that the microbiota promotes Cd36 expression and hence lipid absorption through HDAC3. HDAC3 was recruited rhythmically to Cd36 in a microbiota- and REV-ERBα-dependent manner (Fig. 5E,F), but H3K9ac and H3K27ac marks at Cd36 were not markedly altered in Hdac3ΔIEC mice (Fig. 5G, fig. S10). These data suggest that HDAC3 regulates Cd36 expression directly but not through histone acetylation.
In adipose tissue, HDAC3 functions as a co-activator of estrogen-related receptor α (ERRα)(17). Transcriptional activation by ERRα requires the proliferator-activated receptor gamma coactivator 1 α (PGC1α), which is in turn activated by HDAC3-mediated deacetylation (17, 27). We therefore considered whether a similar mechanism might underlie HDAC3 activation of Cd36 expression in IECs. Supporting this idea, analysis of published genome-wide ChIP-seq data from adipose tissue showed simultaneous recruitment of HDAC3 and ERRα to multiple Cd36 promoter and enhancer sites ((17); Fig. S11A). Further, HDAC3 co-immunoprecipitated with PGC1α in IECs, indicating a direct physical interaction between the proteins in epithelial cells (Fig. 5H). HDAC3, PGC-1α and ERRα colocalized at Cd36 in IECs (Fig. 5I), and HDAC3 markedly increased the transcriptional activity of ERRα at Cd36 (Fig. 5J; Fig. S11B). This increase occurred with wild-type PGC1α, but not with a mutant PGC1α that cannot interact with ERRα (17). Thus, the microbiota promotes diurnally rhythmic expression of intestinal Cd36 through HDAC3 and its function as a co-activator of ERRα (Fig. 5K).
Conclusion
Circadian rhythmicity is a defining characteristic of mammalian metabolism that coordinates expression of cellular metabolic machinery with environmental light cycles. Our finding that the intestinal microbiota programs the daily rhythmic expression of small intestinal metabolic networks illuminates an essential role for the microbiota in regulating host metabolism, and indicates that the microbiome, the circadian clock, and the mammalian metabolic system are tightly co-evolved. We identify epithelial HDAC3 as a key mechanism that integrates inputs from the microbiota and circadian light cycles and conducts these signals to host metabolic genes. The microbiota-circadian clock interaction mediated by HDAC3 regulates intestinal lipid uptake and likely evolved as a mechanism to enhance the efficiency of dietary lipid absorption. However, in the context of a high fat, high sugar Western-style diet, this interaction enables obesity and the worsening of obesity by circadian clock disruption. Our results also suggest how disruption of microbiota-clock interactions, such as through antibiotic treatment or chronic circadian disruptions including jet lag, could worsen human metabolic disease. These findings also point to new avenues for treating metabolic disease by chemical or microbiological targeting of HDAC3.
Supplementary Material
Acknowledgements
We thank B. Hassell and M. Robinson for assistance with mouse experiments.
Funding: This work was supported by NIH grant R01 DK070855 (L.V.H.), Welch Foundation Grant I-1874 (L.V.H.), the Helen D. Bader Center for Research on Arthritis and Autoimmune Diseases (L.V.H.), and the Howard Hughes Medical Institute (L.V.H.). Z.K. was supported by NIH T32 AI005284 and NIH K99 DK120897. C.Y. was supported by NIH K99 GM129415.
Footnotes
Competing interests: The authors have no competing interests.
Data and materials availability: All data and code to understand and assess the conclusions of this research are available in the main text, supplementary materials, and via the Gene Expression Omnibus repository with accession number GSE134303.
References
- 1.Turnbaugh PJ, Hamady M, Yatsunenko T, Cantarel BL, Duncan A, Ley RE, Sogin ML, Jones WJ, Roe BA, Affourtit JP, Egholm M, Henrissat B, Heath AC, Knight R, Gordon JI, A core gut microbiome in obese and lean twins. Nature 457, 480–484 (2009). [DOI] [PMC free article] [PubMed] [Google Scholar]
- 2.Backhed F, Ding H, Wang T, Hooper LV, Koh GY, Nagy A, Semenkovich CF, Gordon JI, The gut microbiota as an environmental factor that regulates fat storage. Proc. Natl. Acad. Sci. USA 101, 15718–15723 (2004). [DOI] [PMC free article] [PubMed] [Google Scholar]
- 3.Turnbaugh PJ, Ley RE, Mahowald MA, Magrini V, Mardis ER, Gordon JI, An obesity-associated gut microbiome with increased capacity for energy harvest. Nature 444, 1027–1031 (2006). [DOI] [PubMed] [Google Scholar]
- 4.Tilg H, Kaser A, Gut microbiome, obesity, and metabolic dysfunction. J. Clin. Invest 121, 2126–2132 (2011). [DOI] [PMC free article] [PubMed] [Google Scholar]
- 5.Thaiss CA, Levy M, Korem T, Dohnalova L, Shapiro H, Jaitin DA, David E, Winter DR, Gury-BenAri M, Tatirovsky E, Tuganbaev T, Federici S, Zmora N, Zeevi D, Dori-Bachash M, Pevsner-Fischer M, Kartvelishvily E, Brandis A, Harmelin A, Shibolet O, Halpern Z, Honda K, Amit I, Segal E, Elinav E, Microbiota diurnal rhythmicity programs host transcriptome oscillations. Cell 167, 1495–1510 e1412 (2016). [DOI] [PubMed] [Google Scholar]
- 6.Mukherji A, Kobiita A, Ye T, Chambon P, Homeostasis in intestinal epithelium is orchestrated by the circadian clock and microbiota cues transduced by TLRs. Cell 153, 812–827 (2013). [DOI] [PubMed] [Google Scholar]
- 7.Wang Y, Kuang Z, Yu X, Ruhn KA, Kubo M, Hooper LV, The intestinal microbiota regulates body composition through NFIL3 and the circadian clock. Science 357, 912–916 (2017). [DOI] [PMC free article] [PubMed] [Google Scholar]
- 8.Thaiss CA, Zeevi D, Levy M, Zilberman-Schapira G, Suez J, Tengeler AC, Abramson L, Katz MN, Korem T, Zmora N, Kuperman Y, Biton I, Gilad S, Harmelin A, Shapiro H, Halpern Z, Segal E, Elinav E, Transkingdom control of microbiota diurnal oscillations promotes metabolic homeostasis. Cell 159, 514–529 (2014). [DOI] [PubMed] [Google Scholar]
- 9.Leone V, Gibbons SM, Martinez K, Hutchison AL, Huang EY, Cham CM, Pierre JF, Heneghan AF, Nadimpalli A, Hubert N, Zale E, Wang Y, Huang Y, Theriault B, Dinner AR, Musch MW, Kudsk KA, Prendergast BJ, Gilbert JA, Chang EB, Effects of diurnal variation of gut microbes and high-fat feeding on host circadian clock function and metabolism. Cell Host Microbe 17, 681–689 (2015). [DOI] [PMC free article] [PubMed] [Google Scholar]
- 10.Doi M, Hirayama J, Sassone-Corsi P, Circadian regulator CLOCK is a histone acetyltransferase. Cell 125, 497–508 (2006). [DOI] [PubMed] [Google Scholar]
- 11.Mehra A, Baker CL, Loros JJ, Dunlap JC, Post-translational modifications in circadian rhythms. Trends Biochem. Sci 34, 483–490 (2009). [DOI] [PMC free article] [PubMed] [Google Scholar]
- 12.Feng D, Liu T, Sun Z, Bugge A, Mullican SE, Alenghat T, Liu XS, Lazar MA, A circadian rhythm orchestrated by histone deacetylase 3 controls hepatic lipid metabolism. Science 331, 1315–1319 (2011). [DOI] [PMC free article] [PubMed] [Google Scholar]
- 13.Feng D, Lazar MA, Clocks, metabolism, and the epigenome. Mol. Cell 47, 158–167 (2012). [DOI] [PMC free article] [PubMed] [Google Scholar]
- 14.Warner N, Nunez G, MyD88: a critical adaptor protein in innate immunity signal transduction. J. Immunol 190, 3–4 (2013). [DOI] [PubMed] [Google Scholar]
- 15.Wen YD, Perissi V, Staszewski LM, Yang WM, Krones A, Glass CK, Rosenfeld MG, Seto E, The histone deacetylase-3 complex contains nuclear receptor corepressors. Proc. Natl. Acad. Sci. USA 97, 7202–7207 (2000). [DOI] [PMC free article] [PubMed] [Google Scholar]
- 16.Yin L, Lazar MA, The orphan nuclear receptor Rev-erbalpha recruits the N-CoR/histone deacetylase 3 corepressor to regulate the circadian Bmal1 gene. Mol. Endocrinol 19, 1452–1459 (2005). [DOI] [PubMed] [Google Scholar]
- 17.Emmett MJ, Lim HW, Jager J, Richter HJ, Adlanmerini M, Peed LC, Briggs ER, Steger DJ, Ma T, Sims CA, Baur JA, Pei L, Won KJ, Seale P, Gerhart-Hines Z, Lazar MA, Histone deacetylase 3 prepares brown adipose tissue for acute thermogenic challenge. Nature 546, 544–548 (2017). [DOI] [PMC free article] [PubMed] [Google Scholar]
- 18.Emmett MJ, Lazar MA, Integrative regulation of physiology by histone deacetylase 3. Nat. Rev. Mol. Cell Biol, (2018). [DOI] [PMC free article] [PubMed] [Google Scholar]
- 19.Coady MJ, Wallendorff B, Gagnon DG, Lapointe JY, Identification of a novel Na+/myo-inositol cotransporter. J. Biol. Chem 277, 35219–35224 (2002). [DOI] [PubMed] [Google Scholar]
- 20.Yamamoto S, Inoue K, Ohta KY, Fukatsu R, Maeda JY, Yoshida Y, Yuasa H, Identification and functional characterization of rat riboflavin transporter 2. J. Biochem 145, 437–443 (2009). [DOI] [PubMed] [Google Scholar]
- 21.Kim DK, Kanai Y, Chairoungdua A, Matsuo H, Cha SH, Endou H, Expression cloning of a Na+-independent aromatic amino acid transporter with structural similarity to H+/monocarboxylate transporters. J. Biol. Chem 276, 17221–17228 (2001). [DOI] [PubMed] [Google Scholar]
- 22.Kim DK, Kanai Y, Matsuo H, Kim JY, Chairoungdua A, Kobayashi Y, Enomoto A, Cha SH, Goya T, Endou H, The human T-type amino acid transporter-1: characterization, gene organization, and chromosomal location. Genomics 79, 95–103 (2002). [DOI] [PubMed] [Google Scholar]
- 23.Coburn CT, Knapp FF Jr., Febbraio M, Beets AL, Silverstein RL, Abumrad NA, Defective uptake and utilization of long chain fatty acids in muscle and adipose tissues of CD36 knockout mice. J. Biol. Chem 275, 32523–32529 (2000). [DOI] [PubMed] [Google Scholar]
- 24.Hotamisligil GS, Johnson RS, Distel RJ, Ellis R, Papaioannou VE, Spiegelman BM, Uncoupling of obesity from insulin resistance through a targeted mutation in aP2, the adipocyte fatty acid binding protein. Science 274, 1377–1379 (1996). [DOI] [PubMed] [Google Scholar]
- 25.Cohen P, Miyazaki M, Socci ND, Hagge-Greenberg A, Liedtke W, Soukas AA, Sharma R, Hudgins LC, Ntambi JM, Friedman JM, Role for stearoyl-CoA desaturase-1 in leptin-mediated weight loss. Science 297, 240–243 (2002). [DOI] [PubMed] [Google Scholar]
- 26.Whitt J, Woo V, Lee P, Moncivaiz J, Haberman Y, Denson L, Tso P, Alenghat T, Disruption of epithelial HDAC3 in intestine prevents diet-induced obesity in mice. Gastroenterology, (2018). [DOI] [PMC free article] [PubMed] [Google Scholar]
- 27.Rodgers JT, Lerin C, Gerhart-Hines Z, Puigserver P, Metabolic adaptations through the PGC-1 alpha and SIRT1 pathways. FEBS Lett 582, 46–53 (2008). [DOI] [PMC free article] [PubMed] [Google Scholar]
- 28.Montgomery RL, Potthoff MJ, Haberland M, Qi X, Matsuzaki S, Humphries KM, Richardson JA, Bassel-Duby R, Olson EN, Maintenance of cardiac energy metabolism by histone deacetylase 3 in mice. J. Clin. Invest 118, 3588–3597 (2008). [DOI] [PMC free article] [PubMed] [Google Scholar]
- 29.Madison BB, Dunbar L, Qiao XT, Braunstein K, Braunstein E, Gumucio DL, Cis elements of the villin gene control expression in restricted domains of the vertical (crypt) and horizontal (duodenum, cecum) axes of the intestine. J. Biol. Chem 277, 33275–33283 (2002). [DOI] [PubMed] [Google Scholar]
- 30.Cash HL, Whitham CV, Behrendt CL, Hooper LV, Symbiotic bacteria direct expression of an intestinal bactericidal lectin. Science 313, 1126–1130 (2006). [DOI] [PMC free article] [PubMed] [Google Scholar]
- 31.Tu BP, Mohler RE, Liu JC, Dombek KM, Young ET, Synovec RE, McKnight SL, Cyclic changes in metabolic state during the life of a yeast cell. Proc. Natl. Acad. Sci. USA 104, 16886–16891 (2007). [DOI] [PMC free article] [PubMed] [Google Scholar]
- 32.Ye C, Sutter BM, Wang Y, Kuang Z, Tu BP, A metabolic function for phospholipid and histone methylation. Mol. Cell 66, 180–193 e188 (2017). [DOI] [PMC free article] [PubMed] [Google Scholar]
- 33.Stappenbeck TS, Hooper LV, Manchester JK, Wong MH, Gordon JI, Laser capture microdissection of mouse intestine: characterizing mRNA and protein expression, and profiling intermediary metabolism in specified cell populations. Methods Enzymol 356, 167–196 (2002). [DOI] [PubMed] [Google Scholar]
- 34.Kuang Z, Cai L, Zhang X, Ji H, Tu BP, Boeke JD, High-temporal-resolution view of transcription and chromatin states across distinct metabolic states in budding yeast. Nat. Struct. Mol. Biol 21, 854–863 (2014). [DOI] [PMC free article] [PubMed] [Google Scholar]
- 35.Kuang Z, Pinglay S, Ji H, Boeke JD, Msn2/4 regulate expression of glycolytic enzymes and control transition from quiescence to growth. eLife 6, (2017). [DOI] [PMC free article] [PubMed] [Google Scholar]
- 36.Trapnell C, Roberts A, Goff L, Pertea G, Kim D, Kelley DR, Pimentel H, Salzberg SL, Rinn JL, Pachter L, Differential gene and transcript expression analysis of RNA-seq experiments with TopHat and Cufflinks. Nat. Protocols 7, 562–578 (2012). [DOI] [PMC free article] [PubMed] [Google Scholar]
- 37.Hughes ME, Hogenesch JB, Kornacker K, JTK_CYCLE: an efficient nonparametric algorithm for detecting rhythmic components in genome-scale data sets. J. Biol. Rhythms 25, 372–380 (2010). [DOI] [PMC free article] [PubMed] [Google Scholar]
- 38.Kuang Z, Ji Z, Boeke JD, Ji H, Dynamic motif occupancy (DynaMO) analysis identifies transcription factors and their binding sites driving dynamic biological processes. Nucleic Acids Res 46, e2 (2018). [DOI] [PMC free article] [PubMed] [Google Scholar]
- 39.Langmead B, Salzberg SL, Fast gapped-read alignment with Bowtie 2. Nat. Methods 9, 357–359 (2012). [DOI] [PMC free article] [PubMed] [Google Scholar]
- 40.Zhang Y, Liu T, Meyer CA, Eeckhoute J, Johnson DS, Bernstein BE, Nusbaum C, Myers RM, Brown M, Li W, Liu XS, Model-based analysis of ChIP-Seq (MACS). Genome Biol 9, R137 (2008). [DOI] [PMC free article] [PubMed] [Google Scholar]
- 41.Love MI, Huber W, Anders S, Moderated estimation of fold change and dispersion for RNA-seq data with DESeq2. Genome Biol 15, 550 (2014). [DOI] [PMC free article] [PubMed] [Google Scholar]
Associated Data
This section collects any data citations, data availability statements, or supplementary materials included in this article.