Abstract
Background:
Global electrical heterogeneity (GEH) is a useful predictor of adverse clinical outcomes. However, reproducibility of GEH measurements on 10-second routine clinical ECG is unknown.
Methods:
Data of the prospective cohort study of incident hemodialysis patients (n=253; mean age 54.6±13.5y; 56% male; 79% African American) were analysed. Two random 10-second segments of 5-minute ECG recording in sinus rhythm were compared. GEH was measured as spatial QRS-T angle, spatial ventricular gradient (SVG) magnitude and direction (azimuth and elevation), and a scalar value of SVG measured by (1) sum absolute QRST integral (SAI QRST), and (2) QT integral on vector magnitude signal (iVMQT). Bland-Altman analysis was used to calculate agreement.
Results:
For all studied vectorcardiographic metrics, agreement was substantial (Lin’s concordance coefficient >0.98), and precision was perfect (>99.99%). 95% limits of agreement were ±14° for spatial QRS-T angle, ±13° for SVG azimuth, ±4° for SVG elevation, ±14 mV*ms for SVG magnitude, and ±17 mV*ms for SAI QRST. SAI QRST and iVMQT were in substantial agreement with each other.
Conclusion:
Reproducibility of a 10-second automated GEH ECG measurements was substantial, and precision was perfect.
1. Introduction
Electrocardiographic (ECG) Global Electrical Heterogeneity (GEH) recently emerged as an electrical substrate of sudden cardiac death (SCD) in the general population [1]. GEH is associated with cardiac structure and function [2] and is included as an important component of the GEH SCD risk score (www.ecgpredictscd.org).[1] An underlying genomic architecture of GEH has been recently revealed.[3]
We calculate GEH on routinely available resting 10-second ECG (after its Kors-transformation to orthogonal XYZ ECG), by measuring five features: Wilson’s spatial ventricular gradient (SVG) magnitude and direction (azimuth and elevation), spatial QRS-T angle, and a scalar value of SVG. Originally, scalar value of SVG was measured as a sum absolute QRST integral (SAI QRST). However, SVG scalar can be calculated by different approach. Comparison of SAI QRST with alternative measurements of SVG scalar has not been performed.
Before implementation of GEH in clinical practice, the reproducibility of GEH measurements must be studied. The goal of this study was two-fold: (1) evaluate reproducibility of GEH measurements on two random 10-second ECG recordings, and (2) assess agreement between SAI QRST and alternative measure of SVG scalar.
2. Methods
We analysed the data of the prospective cohort study of incident hemodialysis patients in the greater Baltimore area in Maryland: The Predictors of Arrhythmic and Cardiovascular Risk in End-stage renal disease (PACE) study.[4,5] Study was approved by the Institutional Review Board, and all study participants signed written consent form before enrolment.
2.1. Study population
Data of the PACE study participants with available 5-minute recording of resting orthogonal Frank ECG were included in this analysis.
2.2. ECG recording and segment selection
At each study visit high resolution (1000Hz) orthogonal Frank XYZ ECG was recorded at rest in the supine position for at least 5 minutes using the Norav 1200 M PC ECG machine (Norav Medical Ltd, Thornhill, ON, Canada). Two random 10-second segments of 5-minute ECG recording in sinus rhythm were uniformly selected for all ECG recordings. An investigator (EAPA) inspected the 10-second segments to ensure that there was no noise distortion and that entire 10-second comprised out of normal sinus beats only.
2.3. GEH measurements
Two median beats were constructed: one for each 10-second epoch. Custom MATLAB (MathWorks, Inc, Natick, MA) software code end equations are provided at https://github.com/Tereshchenkolab/Global-Electrical-Heterogeneity. The electrical origin point of vectorcardiogram (VCG) was defined as the time interval when the electrical heart vector does not move in threedimensional space (i.e. is electrically silent). Fiducial points (peaks, onset and offset of QRS and T) were detected on vector magnitude (VM) signal. Accuracy of fiducial points’ detection was checked using visual aid (EAPA). Spatial peak and area QRS, T, and SVG vectors were defined. Direction (azimuth and elevation) and magnitude of each vector were measured. Wilson’s ventricular gradient was calculated.[1] Scalar value of SVG was measured by two approaches. First, as previously described,[6,7] SAI QRST was calculated as the arithmetic sum of areas under the QRST curve on XYZ leads, with baseline defined as the voltage at the end of the T-wave. In addition, scalar value of SVG was calculated as a QT integral on VM signal (iVMQT), as an area under the VM signal curve from the QRS-onset to T-offset.
2.4. Statistical analysis
The reproducibility of the automated ECG measurements was assessed using Bland-Altman analysis [8]. The degree of agreement was expressed as the bias (the mean difference) with 95% limits of agreement (mean±2 standard deviations), and the relative % bias, (the mean difference of two measurements divided by their mean value). Precision was defined as 100% minus relative % bias. The statistical correlation between pairs for each parameter was calculated as Pearson’s correlation coefficient r. Lin’s concordance correlation coefficient ρc was calculated to describe the strength of agreement: >0.99 indicates almost perfect agreement; 0.95–0.99, substantial agreement; 0.90–0.95, moderate agreement; <0.90, poor agreement. Bradley-Blackwood procedure was used to simultaneously compare the means and variances of the 2 measurements.
The agreement between SAI QRST and iVMQT was also assessed via Bland-Altman analysis.[9] Due to expected differences in absolute values of SAI QRST and iVMQT, we used detrended values of log-transformed SAI QRST and iVMQT. STATA MP 15.1 (StataCorp LP, College Station, TX) was used for all statistical analyses.
3. Results
3.1. Study population
Data of 253 PACE participants (mean age 54.6±13.5y; 56% male; 79% African American) were included in this study. Nearly all participants (99%) had a history of hypertension, 54% had a history of diabetes, and 44% had a history of cardiovascular disease. Average study participant was obese with body mass index BMI of 30.2±8.1, and had a normal left ventricular ejection fraction LVEF of 66.7±11.5%.
3.2. Reproducibility of GEH
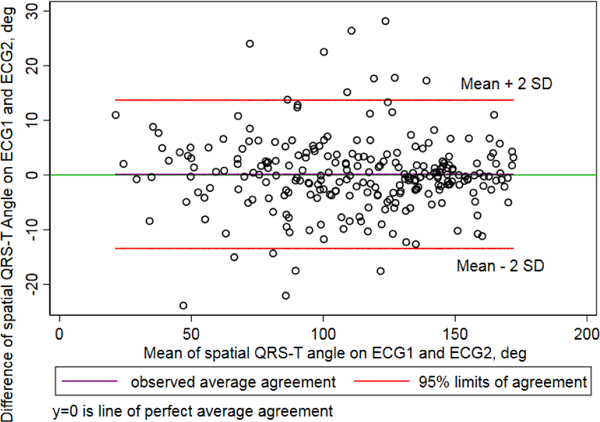
Bradley-Blackwood F test was not significant for all measures (Table 1), which confirmed that bias did not depend on average values. Therefore, the bias and 95% limits of agreement adequately described the differences between all pairs of measurements. For spatial QRS-T angle (Figure 1), there was a negligible bias of 0.14°(0.001%), with 95% limits of agreement from −13.4° to 13.7°. Lin’s concordance coefficient confirmed substantial agreement (Table 1). Precision of spatial QRS-T angle measurement was 99.996%. Similarly, substantial agreement was observed for all GEH measurements. The highest, almost perfect agreement was observed for elevation measurements. Precision of all GEH measurements exceeded 99.9%.
Table 1.
Reproducibility agreement of GEH ECG measurements on two random 10-second ECG segments, and agreement between log-transformed detrended SAI QRST and iVMQT (n = 253 participants).
| Measurement | ECG1 mean(SD) |
ECG2 mean(SD) |
Bias | 95% Limits of agreement |
% bias | Lin ρc (95%CI) | Pearson r | Bradley- Blackwood F (P) |
|---|---|---|---|---|---|---|---|---|
| Heart rate, bpm | 71.0(9.8) | 71.0(9.9) | −0.04 | −5.2 to 5.2 | 0.0006 | 0.964 (0.954–0.972) |
0.964 | 0.171(0.843) |
| Peak QRS−Tangle,° | 104.2(44.6) | 104.4(44.9) | −0.18 | −13.3 to 13.0 | 0.002 | 0.989 (0.986–0.991) |
0.989 | 0.211(0.809) |
| Area QRS−Tangle,° | 112.4(35.4) | 112.2(35.6) | 0.14 | −13.4 to 13.7 | 0.001 | 0.981 (0.976–0.985) |
0.981 | 0.090(0.914) |
| Peak QRS azimuth,° | 49.6(41.9) | 49.8(41.9) | −0.204 | −10.8 to 10.4 | 0.004 | 0.991 (0.989–0.993) |
0.991 | 0.188(0.828) |
| Area QRS azimuth,° | 46.8(44.7) | 46.8(44.8) | 0.009 | −4.1 to 4.1 | 0.0002 | 0.999 (0.999–0.999) |
0.999 | 0.147(0.863) |
| Peak T azimuth,° | −54.9(57.1) | −54.4(57.2) | −0.54 | −11.9 to 10.8 | 0.01 | 0.995 (0.993–0.996) |
0.995 | 1.13(0.326) |
| Area T azimuth,° | −61.5(49.9) | −60.9(49.2) | −0.62 | −16.4 to 15.2 | 0.01 | 0.987 (0.983–0.990) |
0.987 | 1.72(0.183) |
| Peak SVG azimuth,° | 43.2(41.2) | 43.3(41.3) | −0.14 | −11.9 to 11.7 | 0.004 | 0.989 (0.986–992) |
0.990 | 0.103(0.902 |
| Area SVG azimuth,° | 22.4(45.4) | 22.’(45.0) | 0.28 | −12.0 to 12.6 | 0.011 | 0.990 (0.988–0.992) |
0.990 | 0.948(0.389) |
| Peak QRS elevation,° | 74.5(19.8) | 74.5(20.0) | −0.03 | −3.8 to 3.8 | 0.0004 | 0.995 (0.994–0.996) |
0.995 | 1.73(0.180) |
| Area QRS elevation,° | 77.6(19.4) | 77.6(19.5) | −0.02 | −3.5 to 3.4 | 0.0003 | 0.996 (0.995–0.997) |
0.996 | 0.243(0.784) |
| Peak T elevation,° | 70.6(23.2) | 70.5(23.2) | 0.14 | −6.8 to 7.1 | 0.002 | 0.988 (0.985–0.991) |
0.988 | 0.215(0.807) |
| Area T elevation,° | 71.1(24.1) | 70.9(24.4) | 0.18 | −9.6 to 10.0 | 0.003 | 0.979 (0.973–0.983) |
0.979 | 0.668(0.514) |
| Peak SVG elevation,° | 71.0(20.3) | 71.1(20.4) | −0.07 | −3.7 to 3.6 | 0.001 | 0.996 (0.995–0.997) |
0.996 | 0.829(0.438) |
| Area SVG elevation,° | 66.2(19.8) | 66.0(19.4) | 0.18 | −6.5 to 6.9 | 0.001 | 0.985 (0.980–0.988) |
0.985 | 1.89(0.154) |
| Peak QRSmag, mV | 2.8(1.2) | 2.8(1.2) | −0.003 | −0.18 to 0.17 | 0.001 | 0.997 (0.997–0.998) |
0.998 | 1.02(0.362) |
| Area QRS,mV*ms | 82.6(43.5) | 82.7(43.7) | −0.07 | −6.4 to 6.2 | 0.0009 | 0.997 (0.996–0.998) |
0.997 | 0.396(0.673) |
| Peak Tmag, mV | 0.49(0.3) | 0.48(0.3) | 0.003 | −0.07 to 0.07 | 0.006 | 0.991 (0.988–0.993) |
0.991 | 2.72(0.07) |
| Area T,mV*ms | 43.5(26.8) | 43.3(26.2) | 0.23 | −9.3 to 9.8 | 0.005 | 0.983 (0.978–0.987) |
0.984 | 2.34(0.100) |
| Peak SVGmag,mV | 2.7(1.2) | 2.7(1.2) | 0.0005 | −0.68 to 0.68 | 0.0002 | 0.995 (0.994–0.996) |
0.995 | 0.38(0.68) |
| Wilson SVG,mV*ms | 78.1(37.1) | 78.0(37.2) | 0.17 | −13.7 to 14.0 | 0.002 | 0.982 (0.977–0.986) |
0.982 | 1.25(0.289) |
| SAI QRST, mV*ms | 233.0(83.9) | 233.7(83.7) | −0.63 | −16.8 to 15.5 | 0.003 | 0.995 (0.994–0.996) |
0.995 | 0.462(0.631) |
| iVMQT, mV*ms | 157.3(56.7) | 157.8(56.7) | −0.49 | −11.2 to 10.2 | 0.003 | 0.995 (0.994–0.996) |
0.995 | 0.462(0.630) |
| Log(SAI QRST) mean (DS) 0.004(0.32) |
Log(iVMQT) mean (SD) 0.004(0.32) |
Bias −0.00001 |
95% Limits of Agreement −0.11 to 0.11 |
Lin ρc (95%CI) 0.986(0.983–0.989) |
Pearson r 0.986 |
Bradley−Blackwood F (P) 0.355(0.702) |
||
Figure 1.

Bland-Altman plot demonstrating agreement of spatial QRS-T angle on 2 random 10-second segments.
3.3. Agreement between SAI QRST and iVMQT
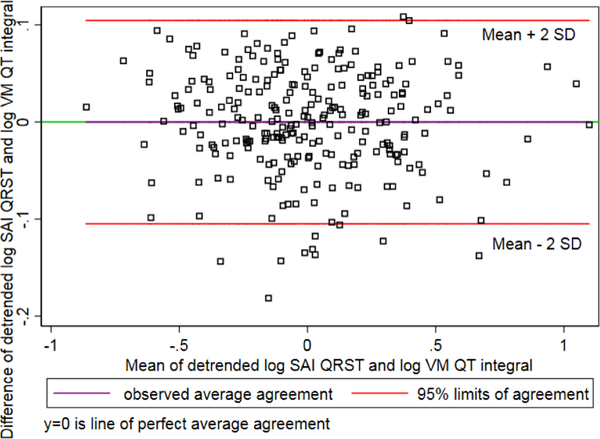
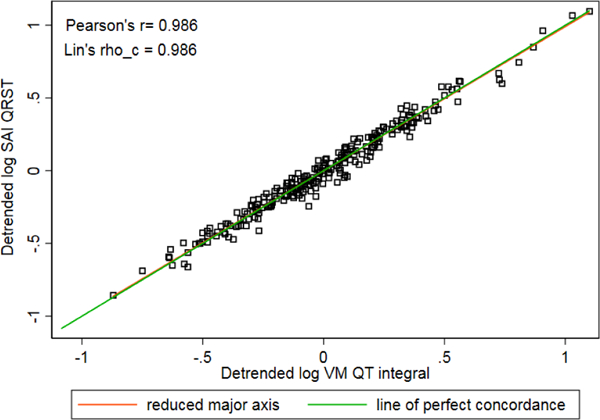
Detrended log-transformed values of SAI QRST and iVMQT demonstrated substantial agreement (Figure 2) and high concordance (Figure 3).
Figure 2.

Bland-Altman plot demonstrating agreement of detrended log-transformed SAI QRST and iVMQT.
Figure 3.

Concordance scatterplot of detrended log-transformed SAI QRST and iVMQT.
4. Discussion
Our study showed that GEH, measured on two random 10-second ECG segments is measured with perfect precision and substantial reproducibility. Precision of “area”-based VCG measures is higher than of “peak”-based VCG measures. Observed in this study, 95% limits of agreement are clinically important and should be taken into consideration. Reproducibility of GEH in this study was an order of magnitude higher than previously reported reproducibility of QRS duration.[8] GEH precision is better than precision of QT interval by 2–3 orders of magnitude. [8] SVG’s scalar can be calculated as either SAI QRST, or iVMQT., per their perfect agreement.
As GEH ECG measurements are reproducible and clinically useful,[1] implementation of GEH in clinical practice is recommended. In the future, automated GEH measurements can be incorporated in the architecture of electronic medical record, and GEH monitoring can be further explored.[10]
5. Conclusion
Reproducibility of a 10-second automated GEH ECG measurements was substantial, and precision was perfect, which demonstrated the overall robustness of the method.
References
- [1].Waks JW, Sitlani CM, Soliman EZ et al. Global electric heterogeneity risk score for prediction of sudden cardiac death in the general population: the atherosclerosis risk in communities (ARIC) and cardiovascular health (CHS). Circulation 2016;133:2222–34. [DOI] [PMC free article] [PubMed] [Google Scholar]
- [2].Biering-Sorensen T, Kabir M, Waks JW et al. Global ecg measures and cardiac structure and function: The ARIC study (atherosclerosis risk in communities). Circ Arrhythm Electrophysiol 2018;11:e005961. [DOI] [PMC free article] [PubMed] [Google Scholar]
- [3].Tereshchenko LG, Sotoodehnia N, Sitlani CM et al. Genome-wide associations of global electrical heterogeneity ecg phenotype: the ARIC (atherosclerosis risk in communities) study and CHS (cardiovascular health study). Journal of the American Heart Association 2018;7. [DOI] [PMC free article] [PubMed] [Google Scholar]
- [4].Parekh RS, Meoni LA, Jaar BG et al. Rationale and design for the predictors of arrhythmias and cardiovascular disease in end stage renal disease (PACE) study. BMC Nephrol 2015;16:63. [DOI] [PMC free article] [PubMed] [Google Scholar]
- [5].Tereshchenko LG, Kim ED, Oehler A et al. Electrophysiologic substrate and risk of mortality in incident hemodialysis. Journal of the American Society of Nephrology : JASN 2016;27:3413–3420. [DOI] [PMC free article] [PubMed] [Google Scholar]
- [6].Sur S, Han L, Tereshchenko LG. Comparison of sum absolute QRST integral, and temporal variability in depolarization and repolarization, measured by dynamic vectorcardiography approach, in healthy men and women. PLoS One 2013;8:e57175. [DOI] [PMC free article] [PubMed] [Google Scholar]
- [7].Tereshchenko LG, Cheng A, Fetics BJ et al. A new electrocardiogram marker to identify patients at low risk for ventricular tachyarrhythmias: sum magnitude of the absolute QRST integral. J Electrocardiol 2011;44:208–216. [DOI] [PMC free article] [PubMed] [Google Scholar]
- [8].Huang T, James CA, Tichnell C et al. Statistical evaluation of reproducibility of automated ECG measurements: an example from arrhythmogenic right ventricular dysplasia/cardiomyopathy clinic. Biomedical Signal Processing and Control 2014;13:23–30. [DOI] [PMC free article] [PubMed] [Google Scholar]
- [9].Bland JM, Altman DG. Statistical methods for assessing agreement between two methods of clinical measurement. Lancet 1986;1:307–310. [PubMed] [Google Scholar]
- [10].Kabir MM, Perez-Alday EA, Thomas J, Sedaghat G, Tereshchenko LG. Optimal configuration of adhesive ECG patches suitable for long-term monitoring of a vectorcardiogram. J Electrocardiol 2017;50:342–348. [DOI] [PMC free article] [PubMed] [Google Scholar]


