Abstract
This review summarizes recent findings and discusses a clinical significance of a vectorcardiographic (VCG) Global electrical heterogeneity (GEH). GEH concept is based on the concept of the spatial ventricular gradient (SVG), which is a global measure of the dispersion of total recovery time. We quantify GEH by measuring five features of the SVG vector (SVG magnitude, direction (azimuth and elevation), a scalar value, and spatial QRS-T angle) on orthogonal XYZ ECG. In analysis of more than 20,000 adults we showed that GEH is independently associated with sudden cardiac death (SCD) after adjustment for demographics, cardiovascular disease (time-updated incident non-fatal cardiovascular events [coronary heart disease, heart failure, stroke, atrial fibrillation, use of beta-blockers], and known risk factors [cholesterol, triglycerides, physical activity index, smoking, diabetes, obesity, hypertension, anti-hypertensive medications, creatinine, alcohol intake, left ventricular ejection fraction, and time-updated ECG metrics (heart rate, QTc, QRS duration, ECG–left ventricular hypertrophy, bundle branch block or interventricular conduction delay)]. This finding suggests that GEH represents an independent electrophysiological substrate of SCD.
1. History of spatial ventricular gradient
The concept of global electrical heterogeneity (GEH) is based on Wilson’s spatial ventricular gradient (SVG). We recently reviewed in details history and underlying electrophysiological principles behind SVG.[1]
The original idea was conceived by Wilson in 1930s, as the concept of the ventricular gradient. Ventricular gradient defines a vector along which non-uniformity in excitation and repolarization is the most prominent, i.e. it is perpendicular to the line of conduction block. Wilson’s frontal plane ventricular gradient was extended into the spatial ventricular gradient (SVG) in 1954. In 1957 Burger published a mathematical proof that demonstrated the SVG was theoretically independent of the initial site of stimulation, and that the SVG always points toward the area of myocardium with the shortest total recovery time. Independence of the SVG from myocardial activation sequence was shown in many experimental and theoretical studies, including studies analyzing human body surface potential mapping. Subsequent analyses demonstrated that SVG depends on the heterogeneity of action potential morphology and duration. Thus, SVG captures the magnitude and direction of the steepest gradient between the areas of the heart with the longest and the shortest total recovery time. In 1988 Mark Josephson’s group showed that susceptibility to ventricular arrhythmias is characterized by heterogeneity in total recovery time (which is a combination of both dispersion of endocardial activation and dispersion of refractoriness). GEH, as a global measure of the dispersion of total recovery time, is a surrogate for an underlying arrhythmogenic substrate, encompassing dispersion of endocardial activation (e.g., electrophysiological substrate of post-infarction ventricular arrhythmia), as well as the dispersion of refractoriness (e.g., electrophysiological substrate of inherited or iatrogenic long QT syndromes).
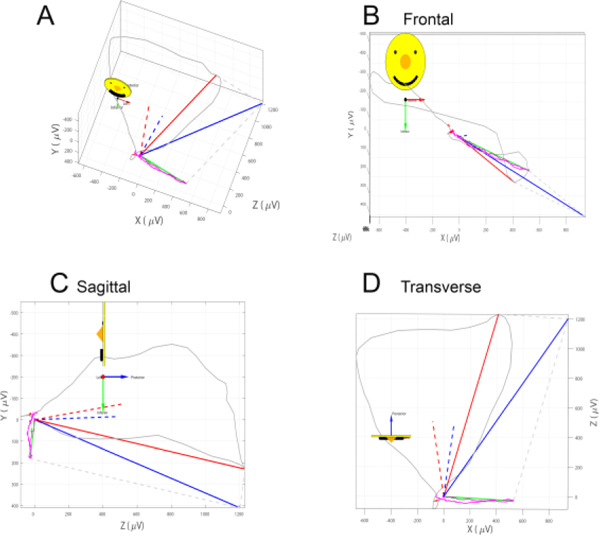
We quantify GEH by measuring five features of the SVG vector (Figure 1; SVG magnitude, direction (azimuth and elevation), a scalar value, and QRS-T angle) on orthogonal XYZ ECG. Spatial QRS-T angle[2] is a well-known marker of the risk of ventricular tachyarrhythmias and sudden cardiac death in the general population, heart failure, and other populations.
Figure 1.

A vectorcardiographic QRS and T loops with measured QRS (red), T (green), and spatial ventricular gradient (SVG; blue) vectors. Peak vectors are shown as solid lines. Area vectors are shown as dashed lines. A. Vectorcardiogram. B. Frontal plane. C. Sagittal plane. D. Transverse plane.
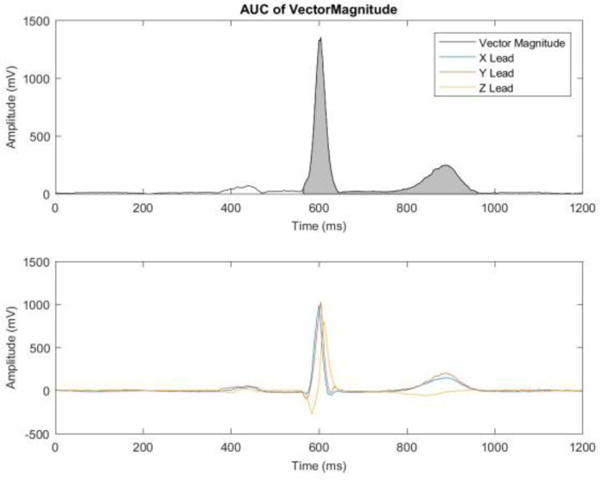
The sum absolute QRST integral (SAI QRST) is a scalar analog of the SVG [3–6], associated with ventricular tachyarrhythmias in heart failure.[3, 4, 7] SAI QRST is associated with electrical dyssynchrony[8], mechanical response to cardiac resynchronization therapy [9], and mortality in cardiac resynchronization therapy patients[10]. Patient-specific time-varying associations between SAI QRST and high sensitivity troponin I suggest that SAI QRST reflects subclinical myocardial injury.[11] Scalar analog of SVG can be also calculated as an area under the curve on vector magnitude signal measured from the QRS onset to T wave offset, or QT integral on vector magnitude signal (Figure 2). We demonstrated agreement between detrended values of SAI QRST and vector magnitude QT integral in several works, including one presented in this Computing in Cardiology 2018 symposium.
Figure 2.

A vector magnitude signal (top panel) and an XYZ leads (bottom panel) of a representative ECG. A gray area illustrates QT integral on Vector Magnitude as a measure of the scalar value of spatial ventricular gradient.
2. Measurement of GEH on ECG
Custom MATLAB (MathWorks, Inc, Natick, MA) software was developed in Tereshchenko Laboratory. The software code and all mathematical equations are provided at https://phvsionet.org/phYsiotools/geh/. The 12-lead ECG is transformed into orthogonal XYZ leads using Kors transformation.[12] Our laboratory maintains the GitHub software repository and will be posting further updates at: https://github.com/Tereshchenkolab.
2.1. GEH does not correlate with traditional ECG measures or cardiac structure and function
We studied GEH in two large prospective cohorts: the Atherosclerosis Risk In Communities (ARIC) study, and Cardiovascular Health Study (CHS). As examined in the pooled ARIC+CHS population,[13, 14] the strength of correlation between GEH measures and traditional ECG measures is weak to negligible. In a cross-sectional analysis of associations of GEH with left ventricular structure and function[15] (measured by echocardiography at ARIC visit 5), GEH explained only 5–7% of left ventricular ejection fraction and global longitudinal strain, 7–14% of the variability in left ventricular mass index, and 13–26% of the variability in left ventricular end-systolic and end-diastolic volume indices. Of note, QrS duration (but not GEH) demonstrated the strongest cross-sectional association with left ventricular structure and function metrics.[15] Knowledge about correlation between GEH and traditional ECG measures is important for further analyses of GEH in multivariable models.
3. Global electrical heterogeneity and sudden cardiac death
Sudden cardiac death (SCD) is a tragic event for a family and a significant healthcare issue for the society. Prediction and prevention of SCD in a population of relatively low-risk individuals has not been previously developed. Mechanisms of SCD are incompletely understood. Unexplained SCD in the absence of overt structural heart disease has clinical implications beyond the patient, with family members at potential risk.
In the pooled ARIC+CHS population,[14] we showed that 5 GEH measurements were independently associated with SCD after adjustment for demographics, manifested cardiovascular disease (time-updated incident non-fatal cardiovascular events [coronary heart disease, heart failure, stroke, atrial fibrillation, use of betablockers], and known cardiovascular disease risk factors such as total cholesterol, high density lipoprotein, triglycerides, physical activity index, smoking, diabetes, body mass index, hypertension, anti-hypertensive medications, creatinine, alcohol intake, left ventricular ejection fraction, and time-updated ECG risk-factors (heart rate, QTc, QRS duration, ECG - left ventricular hypertrophy, bundle branch block or interventricular conduction delay). GEH selectively predicted SCD over non-sudden cardiac death and non-cardiac death in competing risks models, suggesting that abnormal GEH selectively identified participants with abnormal electrophysiological substrate rather than merely identifying sicker patients with structural heart disease.
Our group developed a useful and readily available tool to identify individuals at increased SCD risk[14]. The score is freely available on the website http://www.ecgpredictscd.org/calculator/. In the pooled ARIC+CHS population,[14] with the addition of GEH measures, 50/486 (10.3%) SCD victims were appropriately reclassified into a higher-risk category, and almost all of them (49/50) were appropriately reclassified from intermediate-risk to high-risk. Overall, 14.9% of SCD-free participants were appropriately reclassified from intermediate-risk to low-risk. Only 8/486 (1.7%) SCD victims were inappropriately reclassified from high-risk to intermediate-risk, and no SCD victims were inappropriately reclassified from high-risk to low-risk. Reclassification improvement was dramatically better in subgroups of patients who are at higher risk of SCD[14] (e.g., ventricular conduction abnormalities and ventricular pacing subgroups, where > 30% SCD victims were reclassified from intermediate- to high-risk).[14]
4. Global electrical heterogeneity and cardiac mechanical function
In the cross-sectional and longitudinal analysis of the ARIC,[15] we showed that GEH reflects subclinical abnormalities in cardiac structure and function and represents one mechanism by which abnormal electrophysiological substrate may lead to an increased risk of left ventricular dysfunction and SCD. Fast worsening of GEH was associated with increased risk of SCD, whereas slow worsening of GEH was related to the development of left ventricular dysfunction.
Cross-sectional analysis showed that association between GEH and systolic cardiac function was weak to negligible. All 5 GEH metrics explained 9% of left ventricular ejection fraction variability, 10% of the variability in global longitudinal strain, 17% in the variability of left ventricular mass, and 16% of the variability in left ventricular end-systolic or end-diastolic volume index. Our results suggest that electrical and mechanical domains cannot be viewed as interchangeable. These findings also explain why GEH was complementary to left ventricular ejection fraction in the prediction of SCD: they are complementary to each other but reflect different properties of the heart.
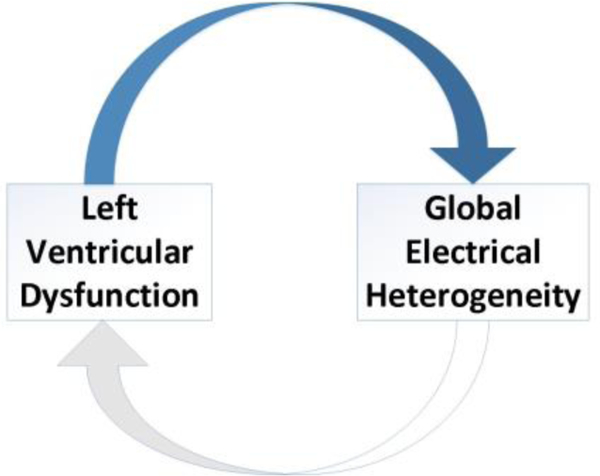
Association of GEH with cardiac structure and function was stronger in participants with diagnosed cardiovascular disease (heart failure, coronary heart disease, which suggested that the presence of cardiovascular disease worsens GEH. Also, we for the first time observed that there was a distinctly different longitudinal pattern of SVG azimuth changes over 25-years span. Those participants who remained free from cardiovascular disease and left ventricular dysfunction had SCG azimuth gradually turning in opposite direction as compared to those who either died or developed left ventricular dysfunction. This finding suggests that GEH can counteract subclinical myocardial injury and diminish the influence of risk factors over the lifespan. Therefore, we proposed a vicious cycle hypothesis (Figure 3), which has to b tested in future studies.
Figure 3.

The hypothetical vicious cycle of GEH and left ventricular dysfunction.
5. The underlying genetic architecture of Global Electrical Heterogeneity
Genomic studies, such as genome-wide association studies (GWAS), other genomic (proteomic, metabolomic, epigenomic, multi -omic), and the whole genome sequencing studies emerged as a robust approach to study mechanisms and underlying biology of various diseases.
GWAS of traditional ECG traits, including QRS duration, QT interval, PR interval, heart rate, ECG - left ventricular hypertrophy, ST-T amplitude identified ECG-trait associated loci. However, traditional surface ECG metrics are very crude and non-specific measures of an underlying electrophysiological substrate. Historically ECG measures were developed based on available previous-century technology (a ruler). Advances in computer science, digital signal processing, and understanding of cardiac arrhythmia mechanisms led to the development of novel mechanistic ECG measures.
Genome-wide study of GEH in approximately 14,000 participants of ARIC and CHS identified ten genetic loci, associated with GEH.[13] While exact biological function behind identified genetic “tags” is unknown and requires further study, these first GEH GWAS findings shade the light on underlying mechanisms of GEH.
Four out of ten loci have not been previously reported associated with any other ECG phenotype: loci on chromosomes 9 (near HMCN2), 15 (IGF1R), 11 (11p11.2 region cluster), and 7 (near ACTB). Three out of ten loci are in proximity to previously reported variants, but not in linkage disequilibrium with them, thus representing independent signals: lncRNA (RP11–481J2.2), a locus on chromosome 1 (LUZP1-KDM1A), and on chromosome 3 (SCN5A), which is located on a well-known sodium channel gene. Three GEH-associated loci (near TBX3, HAND1, and NFIA) are known loci, associated with QRS duration and PR interval. Most (7/10) loci remained associated with GEH phenotypes after additional adjustment for traditional ECG metrics.
The strongest GEH-associated locus was mapped near the TBX3 gene, which plays a crucial role in the development of the cardiac conduction system. TBX3 determines the fate of cardiac progenitor cells regarding whether or not it becomes a cell with central conduction system properties (i.e., with the function of automaticity), or myocardial cell. TBX3 deficiency can also lead to the insufficient development of atrioventricular node, which might manifest as prolonged PR. The implication of TBX3 can potentially explain the involvement of all 3 SCD mechanisms (ventricular fibrillation, asystole, and pulseless ventricular activity).
6. Summary
In summary, GEH concept translates historical Wilson’s idea of SVG into modem analytical and prognostic tool. Further studies of underlying biology behind GEH will help to understand the mechanisms of GEH development in the context of a cardiovascular disease continuum. Implementation of GEH measurements into clinical practice will help to improve prediction of SCD. Further studies of GEH in different patient populations are needed.
Acknowledgments
The NIH R01HL118277 partially supported this work.
References
- [1].Waks JW, Tereshchenko LG. Global electrical heterogeneity: A review of the spatial ventricular gradient. J Electrocardiol. 2016;49(6):824–30. [DOI] [PMC free article] [PubMed] [Google Scholar]
- [2].Oehler A, Feldman T, Henrikson CA, Tereshchenko LG. QRS-T angle: A review. Annals Noninvasive Electrocardiol 2014;19(6):534–42. [DOI] [PMC free article] [PubMed] [Google Scholar]
- [3].Tereshchenko LG, McNitt S, Han L, Berger RD, Zareba W. ECG marker of adverse electrical remodeling post-myocardial infarction predicts outcomes in MADIT II study. PLoS One. 2012;7(12):e51812. [DOI] [PMC free article] [PubMed] [Google Scholar]
- [4].Tereshchenko LG, Cheng AA, Fetics BJ, Butcher B, Marine JE, Spragg DD, et al. A new electrocardiogram marker to identify patients at low risk for ventricular tachyarrhythmias: Sum magnitude of the absolute QRST integral. Journal of Electrocardiology. 2011;44(2):208–16. [DOI] [PMC free article] [PubMed] [Google Scholar]
- [5].Sur S, Han L, Tereshchenko LG. Comparison of sum absolute QRST integral, and temporal variability in depolarization and repolarization, measured by dynamic vectorcardiography approach, in healthy men and women. PLoS One. 2013;8(2):e57175. [DOI] [PMC free article] [PubMed] [Google Scholar]
- [6].Kozmann G, Tuboly G, Szathmáry V, Švehhkova J, Tyšler M. Computer modelling of beat-to-beat repolarization heterogeneity in human cardiac ventricles. Biomedical Signal Processing and Control. 2014;14(0):285–90. [Google Scholar]
- [7].Tereshchenko LG, Cheng A, Fetics BJ, Marine JE, Spragg DD, Sinha S, et al. Ventricular arrhythmia is predicted by sum absolute QRST integralbut not by qrs width. J Electrocardiol. 2010;43(6):548–52. [DOI] [PMC free article] [PubMed] [Google Scholar]
- [8].Tereshchenko LG, Ghafoori E, Kabir MM, Kowalsky M. Electrical dyssynchrony on noninvasive electrocardiographic mapping correlates with SAI QRST on surface ECG. Computing in Cardiology. 2015;42:69–72. [PMC free article] [PubMed] [Google Scholar]
- [9].Tereshchenko LG, Cheng A, Park J, Wold N, Meyer TE, Gold MR, et al. Novel measure of electrical dyssynchrony predicts response in cardiac resynchronization therapy: Results from the SMART-AV trial. Heart Rhythm. 2015;12(12):2402–10. [DOI] [PMC free article] [PubMed] [Google Scholar]
- [10].Jacobsson J, Borgquist R, Reitan C, Ghafoori E, Chatterjee NA, Kabir M, et al. Usefulness of the sum absolute QRST integral to predict outcomes in patients receiving cardiac resynchronization therapy. Am J Cardiol. 2016;118(3):389–95. [DOI] [PMC free article] [PubMed] [Google Scholar]
- [11].Tereshchenko LG, Feeny A, Shelton E, Metkus T, Stolbach A, Mavunga E, et al. Dynamic changes in high-sensitivity cardiac troponin I are associated with dynamic changes in sum absolute QRST integral on surface electrocardiogram in acute decompensated heart failure. Ann Noninvasive Electrocardiol. 2017;22(1):e12379. [DOI] [PMC free article] [PubMed] [Google Scholar]
- [12].Kors JA, van HG, Sittig AC, van Bemmel JH. Reconstruction of the frank vectorcardiogram from standard electrocardiographic leads: Diagnostic comparison of different methods. EurHeart J. 1990;11(12): 1083–92. [DOI] [PubMed] [Google Scholar]
- [13].Tereshchenko LG, Sotoodehnia N, Sitlani CM, Ashar FN, Kabir M, Biggs ML, et al. Genome-wide associations of global electrical heterogeneity ECG phenotype: The Atherosclerosis Risk In Communities (ARIC) and Cardiovascular Health (CHS) Study. J Am Heart Assoc. 2018;7(8):e008160. [DOI] [PMC free article] [PubMed] [Google Scholar]
- [14].Waks JW, Sitlani CM, Soliman EZ, Kabir M, Ghafoori E, Biggs ML, et al. Global electric heterogeneity risk score for prediction of sudden cardiac death in the general population: The Atherosclerosis Risk In Communities (ARIC) and Cardiovascular Health (CHS) Studies. Circulation. 2016;133(23):2222–34. [DOI] [PMC free article] [PubMed] [Google Scholar]
- [15].Biering-Sorensen T, Kabir M, Waks JW, Thomas J, Post WS, Soliman EZ, et al. Global ecg measures and cardiac structure and function: The ARIC study (Atherosclerosis Risk In Communities). Circ Arrhythm Electrophysiol. 2018;11(3):e005961. [DOI] [PMC free article] [PubMed] [Google Scholar]


