Abstract
Celastrol, a pentacyclic triterpene is the most potent anti-obesity agent that has been reported to date1. The mechanism of celastrol’s leptin sensitizing and anti-obesity effects has not yet been elucidated. In this study, we identified interleukin 1 receptor 1 (IL1R1) as a mediator of celastrol action by using temporally-resolved analysis of the hypothalamic transcriptome in celastrol-treated DIO, lean and db/db mice. We demonstrate that IL1R1-deficient mice are completely resistant to celastrol’s leptin sensitization, anti-obesity, anti-diabetic and anti-NASH effects. Thus, we conclude that IL1R1 is a gate-keeper for celastrol’s metabolic actions.
Increased ER stress in the hypothalamus plays a central role in the development of leptin resistance, and thus obesity2-5. Given these findings, we undertook in silico screens utilizing systems biology approaches to identify new chemical chaperones that would serve as stronger leptin sensitizers. These efforts yielded celastrol, a pentacyclic triterpene as a potentially efficacious chemical chaperone and leptin sensitizer1. Celastrol reduces the body weight of diet-induced obese (DIO) mice by 45–50% and further ameliorates insulin resistance/type-2 diabetes, nonalcoholic steatohepatitis (NASH), hypercholesterolemia, and liver damage in DIO mice1.
Considering that leptin signaling in the hypothalamus is critical to regulate food intake and body weight6,7, we investigated how celastrol alters the hypothalamic transcriptome. Given that celastrol’s leptin-sensitizing effect requires both high levels of circulating leptin and intact leptin receptor signaling1, we extended this analysis to include db/db mice, which have high circulating levels of leptin, but lack intact leptin receptor signaling, as well as lean control mice, which have low levels of circulating leptin. We reasoned that inclusion of all three groups would support the elucidation of differentially expressed genes and gene networks that mediate celastrol’s leptin-sensitizing effect in DIO mice. Thus, we undertook a time course analysis of hypothalamic gene expression changes in celastrol-treated DIO mice as well as db/db and lean mice. Hypothalamic RNA from DIO, db/db, and lean mice was used for microarray analysis after 6 h, 1-day and 4-day celastrol treatment. Genes with potential relevance for celastrol-mediated leptin sensitization were identified through a temporal pattern-based analysis (Fig. 1)
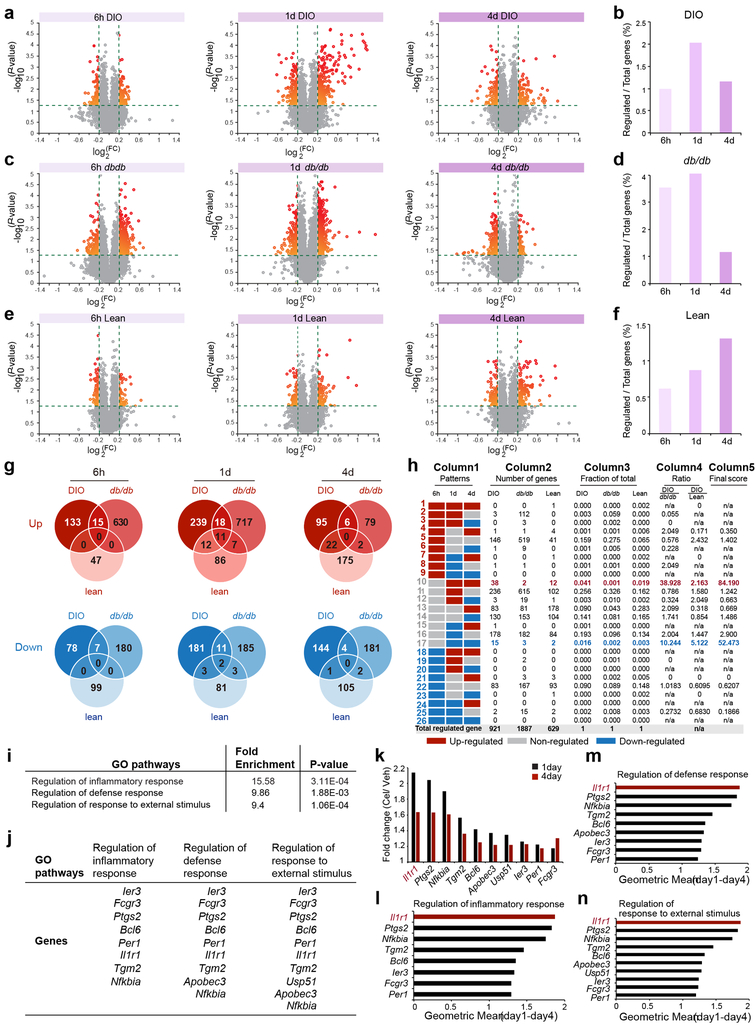
Figure 1. Identification of IL1R1 as a candidate mediator of celastrol’s action.
DIO, db/db, and lean mice were treated with either vehicle (Veh) or celastrol (Cel) for 6 h (250 μg/kg, i.p.), 1 d (100 μg/kg, i.p.), or 4 d (100 μg/kg, i.p., once a day), and total RNA was extracted from the hypothalamus for transcriptome analysis. (a, c, e) Volcano plots depicting regulation of the hypothalamic transcriptome by celastrol in DIO, db/db and lean mice: (a) DIO mice. n=3 mice (6 h, 1 d and 4 d) for vehicle-treated groups, n=4 mice (6 h and 1 d) or 3 mice (4 d) for celastrol-treated groups; (c) db/db mice. n=4 mice (6 h, 1 d and 4 d) for vehicle-treated groups, and n=3 mice (6 h) or 4 mice (1 d and 4 d) for celastrol-treated groups; (e) lean control mice. n=4 mice (6 h, 1 d and 4 d) for vehicle-treated groups, and n=4 mice (6 h) or 3 mice (1 d and 4 d) for celastrol-treated groups. Relative gene expression levels (fold change, FC) in the celastrol- versus vehicle-treated groups are plotted on the x-axes as mean log2 ratios (log2(FC)), while log10 transformed P-values are plotted on the y-axes (−log10(P-value)). Vertical and horizontal green dashed lines indicate FC and significance criteria ∣log2(FC)∣>0.2 and P<0.05 (two-tailed Student’s t-test). (b, d, f) The number of genes that surpassed threshold criteria as a percentage of the transcriptome in (b) DIO, (d) db/db and (f) lean mice at the 6 h, 1 d, and 4 d time points. (g) The number of up- or down-regulated genes that surpassed threshold criteria in DIO, db/db and lean mice at the 6 h, 1 d and 4 d time points. (h) Column 1 (Patterns): The 26 possible temporal patterns of celastrol-regulated genes (up-regulated, non-regulated, or down-regulated versus vehicle), by consideration of three time points (6 h, 1 d and 4 d). Column 2 (Number of genes): Number of genes that fell into each temporal pattern in DIO, db/db and lean mice. Total number of celastrol-regulated genes in each model are summed (at bottom). Column 3 (Fraction of total): Fraction of total celastrol-regulated genes in DIO, db/db and lean mice that fell into each temporal pattern. Column 4 (Ratio): The ratio of DIO to db/db and DIO to lean values in Column 3, showing the differential patterns in DIO group relative to db/db and lean groups. Column 5 (Final Score): Multiplication of Column 4 Ratio values (DIO/db/db × DIO/lean). (i) Identification of Gene Ontology (GO) pathways significantly enriched in genes found in Pattern 10 (n=38 genes, Fisher/Binominal test with Bonferroni adjusted P value). (j) Genes in each of the enriched pathways: (i) regulation of inflammatory response, ii) regulation of defense response, and iii) regulation of response to external stimulus. (k) The fold changes (Cel/Veh) in DIO mice at 1 day and 4 days for the individual Pattern 10 genes present in the identified GO pathways. (l-n) Geometric mean of 1-day and 4-day fold changes of these genes in the GO pathways (l) “Regulation of inflammatory response”, (m) “Regulation of defense response” and (n) “Regulation of response to external stimulus”.
We first grouped the genes depending on two threshold criteria that the fold up- or down-regulation in celastrol-treated mice was ∣log2(FC)∣>0.20; and the associated P value be less than 0.05 (−log10(P)>1.3) (Fig. 1a, c, e). These threshold criteria reduced the analysis to 0.99%, 2.03% and 1.16% of hypothalamic transcripts in DIO mice at the 6 h, 1-day, or 4-day time points, respectively (Fig. 1b). Similar identification of celastrol-associated gene expression changes was repeated for the db/db and lean mice groups (Fig. 1d,f).
We next grouped together up- and down-regulated genes that met threshold criteria at each time point for all groups to identify the union and non-union sets (Fig. 1g). This analysis surprisingly revealed that no genes were up- or down-regulated commonly in DIO, db/db and lean mice at the 6 h, 1-day, and 4-day time points. Thus, we turned our attention to the temporal patterns of celastrol-mediated gene expression changes that appeared specific to DIO mice—but not db/db or lean mice (see methods).
From the pattern analysis, Patterns 10 and 17 had the highest Final score values for DIO group, differentiating this group from db/db and lean groups (Fig. 1h). Pattern 10 was characterized by no regulation of the included genes 6 hours after celastrol administration, but up-regulated gene expression at both the 1-day and 4-day time points. Conversely, pattern 17 was characterized by no regulation after 6 hours, but down-regulated gene expression at both the 1-day and 4-day time points (Extended Data 1). To identify biological pathways containing the genes in patterns 10 and 17, we employed enrichment analysis in Gene Ontology Consortium. We were unable to obtain enriched pathways using the pattern 17 which had small number of genes (15 genes). However, using pattern 10, we identified three pathways in which these celastrol-upregulated genes were significantly enriched (Fig. 1i-j) and found Interleukin 1 receptor type1 (IL1R1) as the most regulated gene within the enriched pathways at both 1-day and 4-day time points after celastrol treatment (Fig. 1k). A combined analysis of the scores of day 1 and 4 together, further revealed Il1r1 with the highest score (see methods) (Fig. 1l-n).
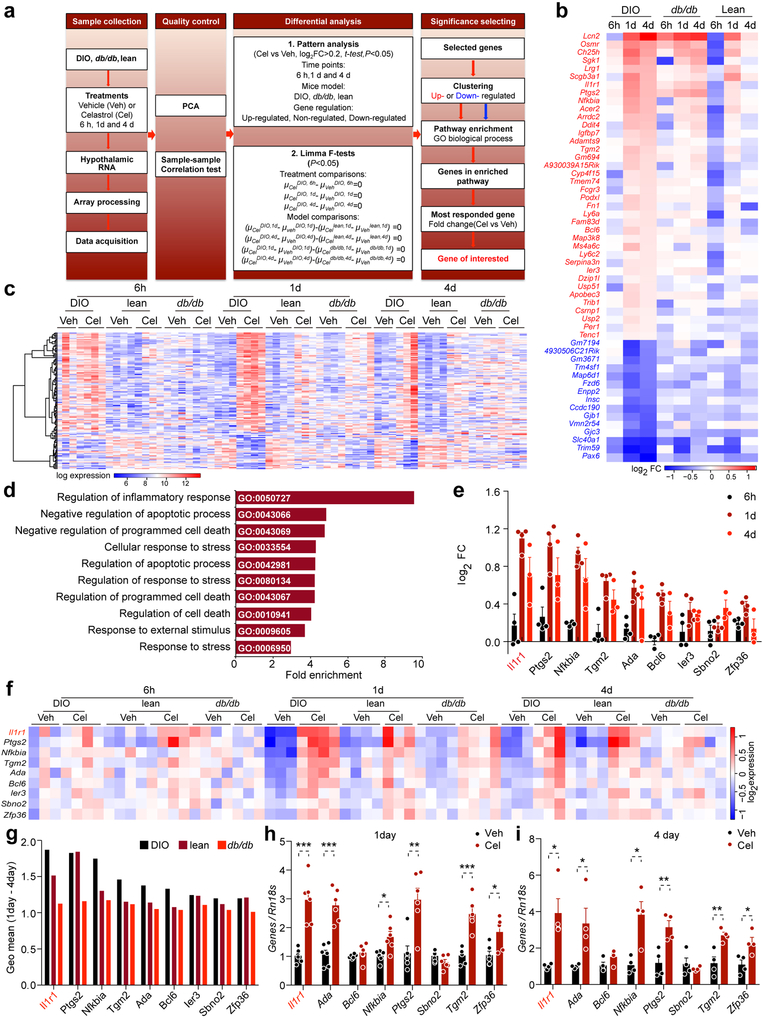
We additionally used a linear model combining all experimental conditions. For each gene, we performed an F test for the set of seven simultaneous contrasts in the model and computed P values using tools in the Bioconductor limma package (Extended Data 1). By this method (see material methods), we ended up with enrichment of “Regulation of inflammatory response” pathway, which was the same that we identified via the temporal pattern-based analysis (Extended Data 1). The celastrol-associated changes in Il1r1 mRNA and other genes involved in this enriched pathway were further confirmed by qPCR (Extended Data 1).
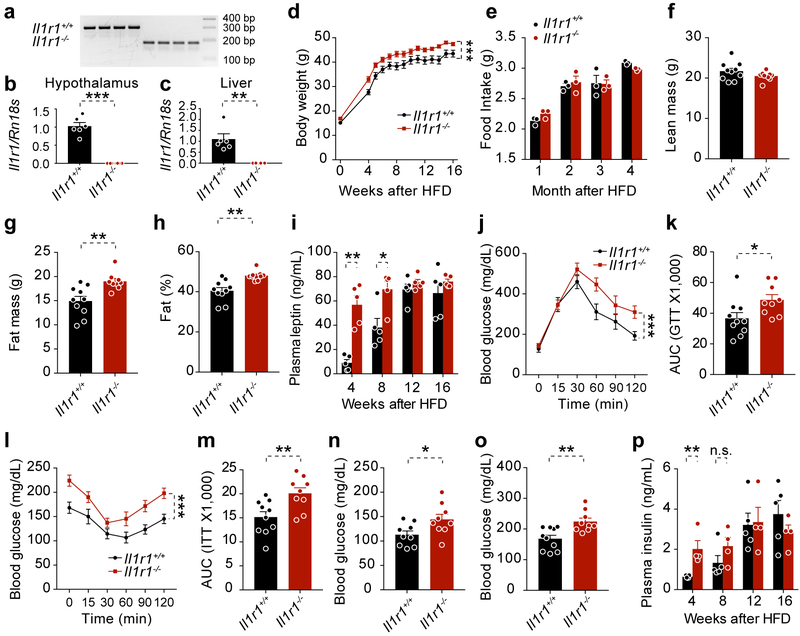
Considering that IL1R1 is the major receptor mediating the biological function of interleukin-1 (IL-1) cytokine family8,9 and plays diverse roles in the maintenance of body homeostasis during and other processes10,11 and that IL1R1 deficiency in mice results in mature-onset obesity and leptin resistance12, we obtained Il1r1−/− mice13 and placed them on a high fat diet (HFD) feeding for 16 weeks to induce obesity. The Il1r1−/− mice gained more weight during HFD feeding (Extended Data 2). Daily food intake and lean body mass was not different between the groups, but body fat was increased in Il1r1−/− versus Il1r1+/+ mice (Extended Data 2). Until week 8 of HFD feeding, leptin levels were higher in Il1r1−/− mice; however, this difference disappeared by week 12 (Extended Data 2). Performance of a glucose tolerance test (GTT) revealed that Il1r1−/− mice were more glucose intolerant (Extended Data 2), and an insulin tolerance test (ITT) showed that Il1r1−/− mice were less insulin sensitive than controls (Extended Data 2). Il1r1−/− mice had higher blood glucose levels compared to the Il1r1+/+ mice (Extended Data 2). Circulating insulin levels were higher in Il1r1−/− mice after 4 weeks of HFD feeding, though not thereafter (Extended Data 2).
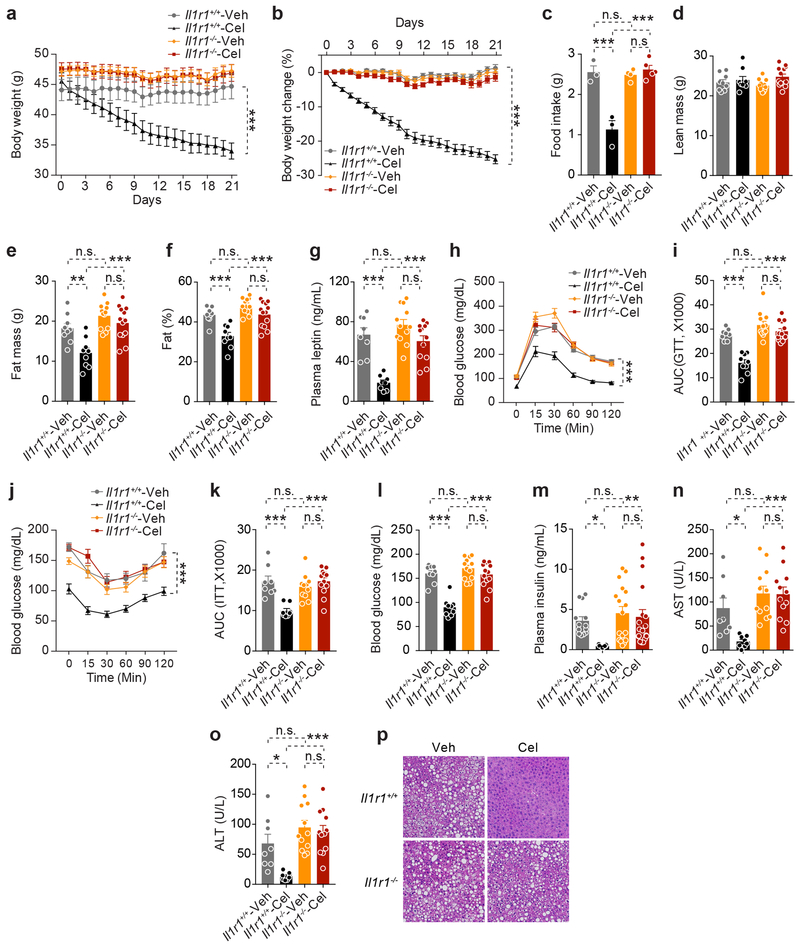
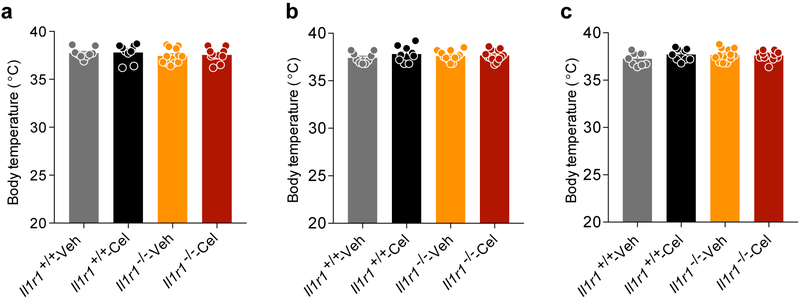
After induction of obesity, Il1r1+/+ and Il1r1−/− mice were treated with either vehicle or celastrol. Celastrol significantly decreased the body weights of Il1r1+/+ mice, but failed to decrease body weights of Il1r1−/− mice (Fig. 2a,b). The reduction of food intake in celastrol-treated Il1r1+/+ mice was abolished in Il1r1−/− mice (Fig. 2c). Celastrol did not alter lean body mass in either group (Fig. 2d). Celastrol-induced reduction in body fat and leptin levels was blocked by IL1R1 deficiency (Fig. 2e-g). GTT (Fig. 2h,i) and ITT (Fig. 2j,k), as well as analyses of blood glucose and insulin levels (Fig. 2l,m) demonstrated that deficiency of IL1R1 was sufficient to abrogate enhancement in glucose homeostasis. Furthermore, celastrol treatment failed to reduce AST and ALT levels or hepatic steatosis in Il1r1−/− mice (Fig. 2n-p). However, celeastrol had no effect on the core body temperature of both genotypes (Extended Data 3).
Figure 2. IL1R1 is required for celastrol’s anti-obesity effects.
Il1r1+/+ and Il1r1−/− mice were fed a HFD for 20 weeks and treated with vehicle (Veh) or celastrol (Cel, 100 μg/kg, i.p., once a day) for 3 weeks. n=9 for vehicle- or celastrol-treated Il1r1+/+ mice; n=12 for vehicle- and n=13 for celastrol-treated Il1r1−/− mice. (a) Body weight. Cel vs. Veh, P<0.0001 for Il1r1+/+ mice and P=0.653 for Il1r1−/− mice. (b) Percent change in body weight of Il1r1+/+ and Il1r1−/− mice during the treatment period. Cel vs. Veh, P<0.0001 for Il1r1+/+ mice and P=0.104 for Il1r1−/− mice. (c) Average 24-hour food intake per mouse during the first week of vehicle or celastrol treatment. Cel vs. Veh, P<0.0001 for Il1r1+/+ mice and P=0.9 for Il1r1−/− mice. (d-f) DEXA of Il1r1+/+ and Il1r1−/− mice treated with vehicle or celastrol for 3 weeks. (d) Lean body mass. (e) Fat mass. Cel vs. Veh, P=0.005 for Il1r1+/+ mice and P>0.99 for Il1r1−/− mice. (f) Fat % at the end of the treatment period. Cel vs. Veh, P=0.0005 for Il1r1+/+ mice and P=0.175 for Il1r1−/− mice. (g) Plasma leptin levels in Il1r1+/+ and Il1r1−/− mice after 3 weeks of vehicle or celastrol treatment. Cel vs. Veh, P<0.0001 for Il1r1+/+ mice and P=0.162 for Il1r1−/− mice. (h) GTT after 1 week of vehicle or celastrol treatment and (i) AUC analysis of GTT. Cel vs. Veh, P<0.0001 for Il1r1+/+ mice and P=0.811 for Il1r1−/− mice. (j) ITT after 2 weeks of treatment and (k) AUC analysis of ITT. Cel vs. Veh, P<0.0001 for Il1r1+/+ mice and P=0.634 for Il1r1−/− mice. (l) Six-hour fasting blood glucose of Il1r1+/+ and Il1r1−/− mice after 1 week of vehicle or celastrol treatment. Cel vs. Veh, P<0.0001 for Il1r1+/+ mice and P=0.88 for Il1r1−/− mice. (m) Plasma insulin levels of Il1r1+/+ mice and Il1r1−/− mice after 3 weeks treatment. Cel vs. Veh, P=0.04 for Il1r1+/+ mice and P>0.99 for Il1r1−/− mice. (n) Plasma AST after 3 weeks of celastrol treatment. Cel vs. Veh, P=0.04 for Il1r1+/+ mice and P>0.99 in Il1r1−/− mice. (o) Plasma ALT after 3 weeks of celastrol treatment. Cel vs. Veh, P=0.02 for Il1r1+/+ mice and P>0.99 for Il1r1−/− mice. (p) H&E staining of liver sections from Il1r1+/+ and Il1r1−/− mice treated with vehicle or celastrol for 3 weeks. The experiments were repeated in two independent cohorts with similar outcomes (total n=14 for vehicle- or celastrol-treated Il1r1+/+ mice; n=17 for vehicle- and n=19 for celastrol-treated Il1r1−/− mice). Values indicate average ± s.e.m. P values were determined by two-way ANOVA with Bonferroni’s multiple comparisons test. * P < 0.05, ** P < 0.01, *** P < 0.001, n.s., not significant (P>0.05).
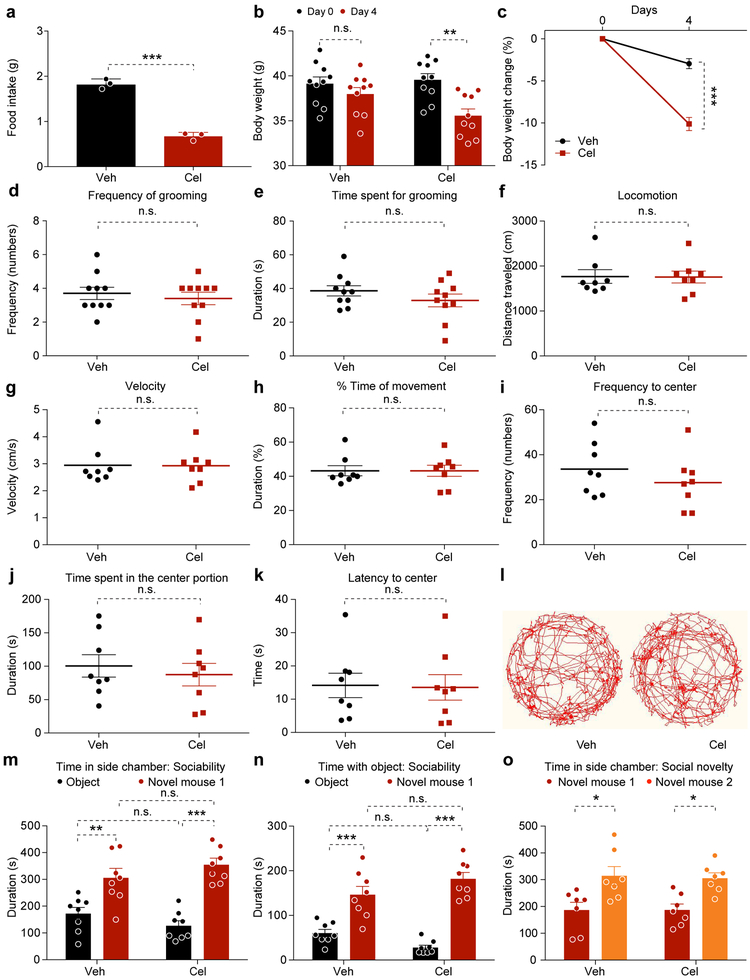
To investigate whether celastrol induces sickness-generated behavior to reduce food intake, we performed several behavioral tests on wild type DIO mice. As expected, food intake and body weight were significantly lower in the celastrol-treated mice (Extended Data 4). First, we performed home-cage and open field test in vehicle- and celastrol-treated mice and documented that celastrol treatment was not associated with changes in innate self-maintenance behavior (Extended Data 4). During the open field test, total locomotor movement, average movement velocity, and the percentage of time spent moving revealed no difference between the groups (Extended Data 4). Meanwhile, the mice travelled to the central portion of the open field did not differ significantly between the groups (Extended Data 4). Thus, celastrol-treated mice appeared to have no greater (or less) anxiety in the context of the open field test compared to the control group.
We next performed consecutive sociability and social novelty tests. During the sociability test, the time spent in the chamber containing a novel mouse (novel mouse 1) was similar in vehicle- and celastrol-treated mice, as were respective times spent in directly socializing with the novel mouse (Extended Data 4). During the social novelty test, both groups spent more time in the chamber in which a second novel mouse (novel mouse 2) was introduced (Extended Data 4). Thus, celastrol had no negative effect on sociability or normal social preference.
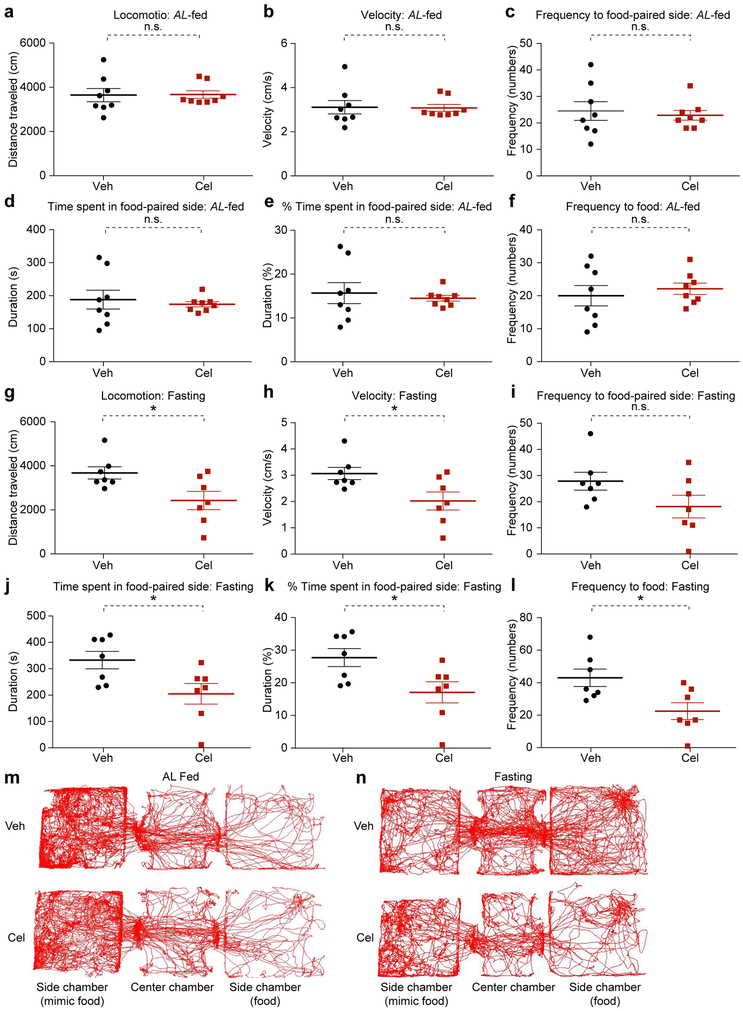
We then placed separate cohorts of ad libitum-fed (AL-fed) or 20-hour fasted mice into a (food)-conditioned place preference assay during the light cycle. Mice in the vehicle- and celastrol-treated groups showed similar level of activity and preference for food in the AL-fed state (Extended Data 5). Thus, celastrol treatment that resulted in weight loss had no effect on motivation to seek food in the context of a mildly aversive side-chamber when compared to sated DIO mice. The second cohort was used to assess how celastrol affects food-paired place preference after fasting. The celastrol-treated mice showed significantly lower locomotor activity and average velocity of movement versus controls (Extended Data 5). In this assay, the celastrol group displayed lower motivation to seek food (Extended Data 5). Thus, we infer that celastrol-treated DIO mice are not food-averse, but are instead specifically less-motivated to seek food compared to the fasted-control mice, which explains the reduction of locomotor activity seen in the dark cycle of celastrol-treated DIO mice1.
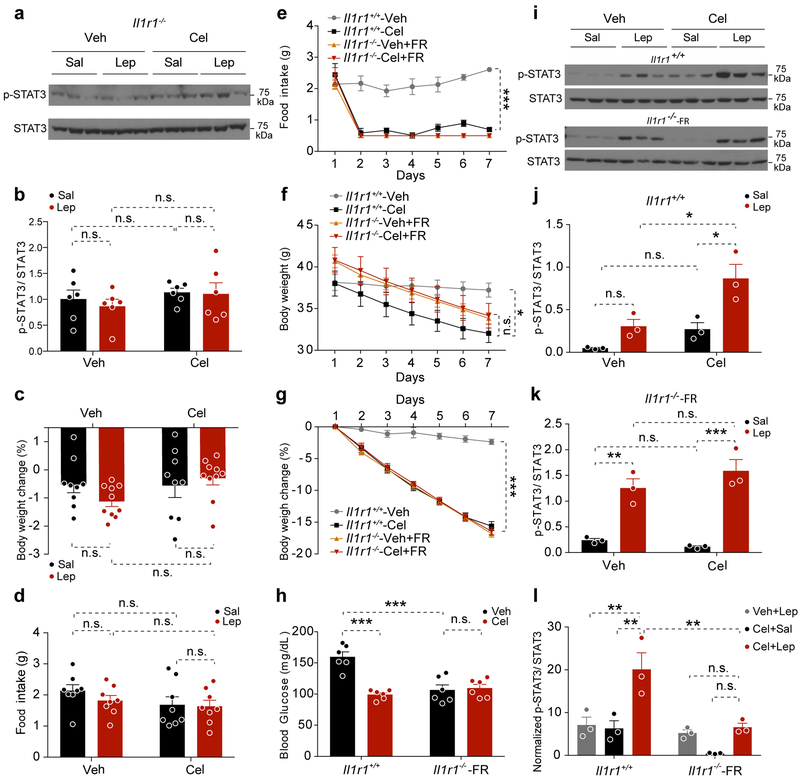
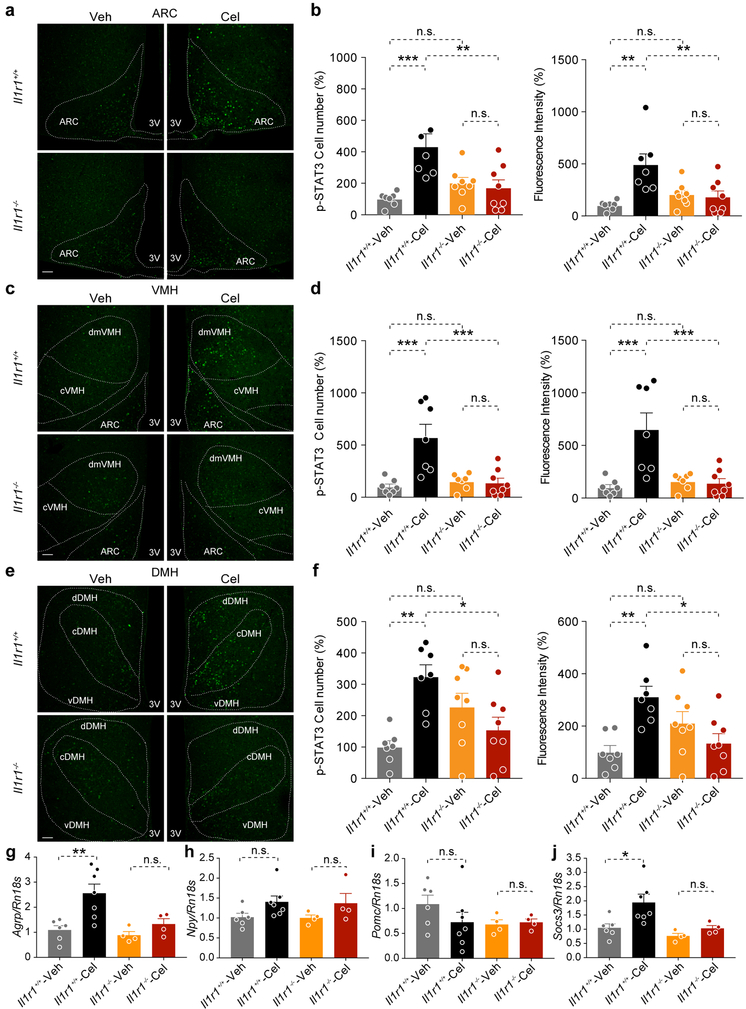
We next investigated the hypothalamic STAT3Tyr705 phosphorylation to assess the status of leptin sensitivity. Celastrol increased the total number and total fluorescence intensity of p-STAT3Tyr705 in the ARC, VMH and DMH in Il1r1+/+ mice, however, this effect was lost in Il1r1−/− mice (Extended Data 6). We next pre-treated Il1r1−/− mice with either vehicle (Veh) or celastrol (Cel), then administered saline (Sal) or leptin (Lep) to each group. Hypothalamic immunoblotting showed that celastrol pre-treatment was unable to increase either basal or leptin-induced p-STAT3Tyr705 in the Il1r1−/− mice (Fig. 3a,b).
Figure 3. IL1R1 is required for celastrol’s ability to enhance actions of exogenous leptin.
(a, b) Il1r1−/− mice were treated with vehicle (Veh) or celastrol (Cel, 500 μg/kg, i.p.). After 15 hours, the mice were administered either saline (Sal) or leptin (Lep, 1 mg/kg, i.p. injection) 45 minutes before collection of hypothalami. The results are a combination of two independent experiments (total n=6 mice in each group). (a) Representative immunoblots for p-STAT3Tyr705 and total STAT3 in the hypothalamus. (b) Quantitation of the ratios of p-STAT3Tyr705 to STAT3 signals on immunoblots. (c, d) Il1r1−/− mice were treated with vehicle (Veh) or celastrol (Cel, 100 μg/kg, i.p., daily) for 2 days and then administered saline (Sal) or leptin (Lep, 1 mg/kg). (c) Percent change in body weight during the 16-hour period after saline or leptin administration. Lep vs. Sal, P=0.883 for Veh-treated mice and P>0.99 for Cel-treated mice. (d) Cumulative food intake during the 16-hour period after saline or leptin treatment. The results in c, d combine data from two independent cohorts (total n=9 mice for saline-injected groups and n=10 mice for leptin-injected groups). (e-l) Il1r1+/+ mice and food-restricted (FR) Il1r1−/− mice (0.5 g/day) were injected with vehicle (Veh) or celastrol (Cel, 100 μg/kg, i.p.) daily for 7 days. Subsequently the mice were divided into two subgroups and administered Sal or leptin Lep (1 mg/kg, i.p.) for 45 min. (n=6 mice for each group). (e) Daily food intake (g). Cel vs. Veh, P<0.0001 for Il1r1+/+ mice. (f) Body weight. Cel vs. Veh, P<0.0001 for Il1r1+/+ mice and P=0.657 for Il1r1−/− mice. (g) Percent change in body weight over the 7-day treatment. Cel vs. Veh, P<0.0001 for Il1r1+/+ mice and P=0.235 for Il1r1−/− mice. (h) Fed blood glucose in Il1r1+/+ and pair-fed Il1r1−/− mice after 7 days of treatment. Cel vs. Veh, P<0.0001 for Il1r1+/+ mice and P>0.99 for Il1r1−/− mice; Il1r1+/+-Veh vs. Il1r1−/−-Veh, P=0.0001. (i) Representative immunoblots of p-STAT3Tyr705 and total STAT3 in hypothalamus of the Il1r1+/+ and Il1r1−/− mice shown in e-h. (j) Ratios of p-STAT3Tyr705 to total STAT3 signals on blots of Il1r1+/+ hypothalamus. Sal vs. Lep, P=0.01 for Cel-treated groups and P=0.639 for Veh-treated groups; Veh vs. Cel, P=0.02 for Lep-treated groups. (k) Ratios of p-STAT3Tyr705 to total STAT3 signals on blots of Il1r1−/− hypothalamus. Sal vs. Lep, P=0.0005 for Cel-treated groups and P=0.006 for Veh-treated groups, Veh vs. Cel, P=0.833 for Lep-treated groups. (l) Normalized ratios of p-STAT3Tyr705 to total STAT3 signals on blots of Il1r1+/+ and Il1r1−/− in the hypothalamus. (Veh+Lep) vs. (Cel+Lep), P=0.007, and (Cel+Sal) vs. (Cel+Lep), P=0.004 for Il1r1+/+ mice; (Veh+Lep) vs. (Cel+Lep), P>0.99, and (Cel+Sal) vs. (Cel+Lep), P=0.691 for Il1r1−/− mice; Il1r1+/+ vs. Il1r1−/− mice, P=0.005 for Cel+Lep groups. Values indicate mean ± s.e.m. P values were determined by two-way ANOVA with Bonferroni’s multiple comparisons test. * P < 0.05, ** P < 0.01, *** P < 0.001, n.s., not significant (P>0.05).
Furthermore, celastrol pre-treatment alone or administration together with exogenous leptin did not affect the body weight or food intake of Il1r1−/− mice (Fig. 3c,d). We next pre-treated both Il1r1−/− and Il1r1+/+ mice with vehicle or celastrol, but fed the Il1r1−/− mice on each day with half amount of food consumed by celastrol-treated Il1r1+/+ mice (Fig. 3e). The food restricted (FR) Il1r1-/- mice—whether treated with vehicle or celastrol—lost similar amounts of body weight as in the celastrol-treated Il1r1+/+ mice (Fig. 3f), resulting in a >15% loss in body weight in all but the vehicle-treated Il1r1+/+ group (Fig. 3g) and had similar blood glucose levels as celastrol-treated Il1r1+/+ mice (Fig. 3h). At day 7 we injected saline or leptin and analyzed p-STAT3Tyr705 levels in the hypothalamus. Celastrol treatment resulted in significantly higher leptin-stimulated p-STAT3Tyr705 in Il1r1+/+ mice (Fig. 3i,j,l). By contrast, although leptin clearly stimulated p-STAT3Tyr705 in both vehicle- and celastrol-treated Il1r1−/− mice that were food restricted, there was not a significantly higher level of p-STAT3Tyr705 in the celastrol-treated Il1r1-/- mice (Fig. 3i,k,l).
Analysis of hypothalamic gene expression showed higher Agrp and Socs3 mRNA levels in the hypothalamus of celastrol-treated Il1r1+/+ mice, however, this effect was absent in Il1r1−/− mice. Npy and Pomc mRNA levels were not significantly different between the groups (Extended Data 6).
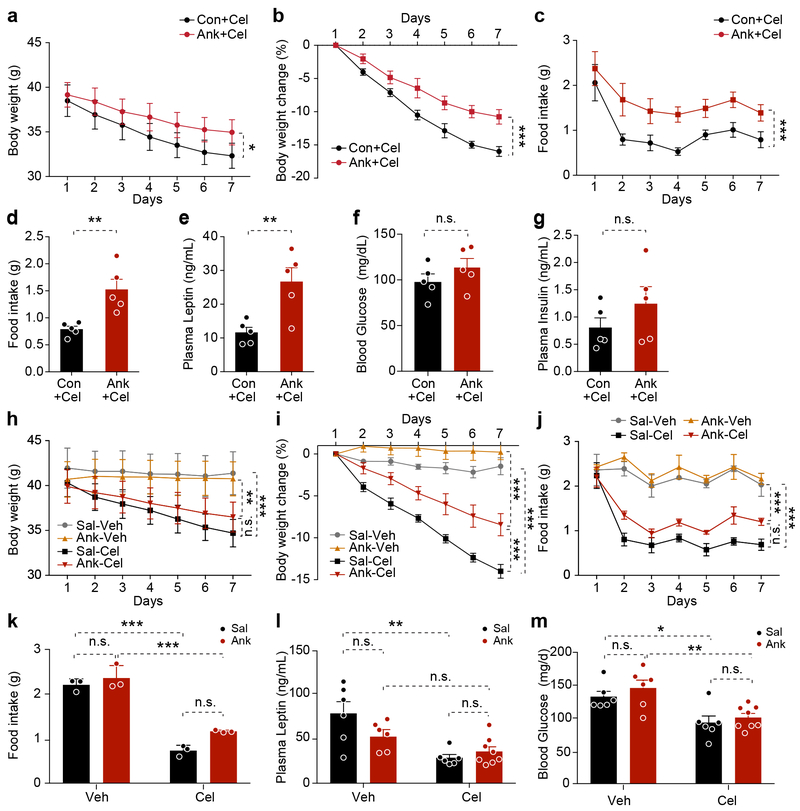
To investigate whether central or peripheral IL1R1 is involved in mediating celastrol’s anti-obesity action, we used an IL1R1 antagonist (anakinra, Ank) to reduce its activity14. We have centrally administered either artificial cerebrospinal fluid (aCSF) as control (Con) or Ank for two days and then celastrol (Cel) peripherally for seven days. The body weight of the Con group was reduced around 16%, whereas the Ank group declined around 10.8% (Fig. 4a,b) after celastrol treatment. Daily food intake was significantly lower in the Con group (vs. Ank), (Fig. 4c,d). Furthermore, circulating leptin was significantly lower in the Con group than the Ank group, but blood glucose and insulin levels were not different between groups (Fig. 4e-g).
Figure 4. Administration of Anakinra attenuates celastrol action.
(a-g) DIO mice were centrally administered with aCSF or anakinra (Ank, 5 μg/mouse/day, i.c.v.) in combination with celastrol (100 μg/kg i.p., daily) for 7 days (n=5 mice for each group). (a) Body weight. P=0.02. (b) Percent body weight reduction. P<0.0001. (c) Daily food intake. P<0.0001. (d) Average 24-hour food intake per mouse during the treatment. P=0.005. (e) Plasma leptin levels. P=0.008. (f) Six-hour fasting blood glucose. P=0.267. (g) Fasted plasma insulin after 7 days of treatment. P=0.257. The experiment was repeated in two independent cohorts with similar outcome (total n=12 mice in control group, n=11 mice in antagonist-treated group). (h-m) DIO mice were peripherally administered IL1R1 antagonist (Ank, 30 mg/kg, twice/day) by i.p injection in combination with celastrol (100 μg/kg, daily, i.p.) for 7 days (n=6 mice, Sal+Veh, Sal+Cel and Ank+Veh groups and n=8 mice, Ank+Cel group). (h) Body weight (g). Sal+Veh vs. Sal+Cel, P=0.0001, and (Ank+Veh) vs. (Ank+Cel), P=0.006, (Sal+Cel) vs. (Ank+Cel), P=0.336. (i) Percent body weight reduction. P<0.0001 for each of (Sal+Veh) vs. (Sal+Cel), (Ank+Veh) vs. (Ank+Cel), and (Sal+Cel) vs. (Ank+Cel). (j) Daily food intake. P<0.0001 for each of (Sal+Veh) vs. (Sal+Cel), (Ank+Veh) vs. (Ank+Cel), and (Sal+Cel) vs. (Ank+Cel). (k) Average 24-h food intake per mouse. Sal vs. Ank, P>0.99 for Veh-treated groups and P=0.08 for Cel-treated groups; Veh vs. Cel, P<0.0001 for Sal-treated groups and P=0.0001 for Ank-treated groups. (l) Plasma leptin levels. Sal vs. Ank, P=0.174 for Veh-treated groups and P>0.99 for Cel-treated groups; Veh vs. Cel, P=0.001 for Sal-treated groups and P=0.756 for Ank-treated groups. (m) Six-hour fasting blood glucose after 7 days treatment. Sal vs. Ank, P>0.99 for both Veh- and Cel-treated groups; Veh vs. Cel, P<0.04 for Sal-treated groups and P=0.008 for Ank-treated groups. Values indicate mean ± s.e.m. P values were determined by two-way ANOVA with Bonferroni’s multiple comparisons test (a-c and h-m) or two-tailed Student’s t test (d-g). * P < 0.05, ** P < 0.01, *** P < 0.001, n.s., not significant (P>0.05).
Ank crosses the blood brain barrier15. To investigate whether peripheral administration of Ank would create similar effects as central administration, we first injected DIO mice peripherally with Sal or Ank and then administered Veh or Cel. Similar results to that of central administration of Ank were obtained from these experiments (Fig. 4h-m). These data suggest that both central and peripheral administration of Ank reduced anorexigenic and anti-obesity effects of celastrol, suggesting that celastrol reduces food intake and body weight through its effects on the CNS in an IL1R1-dependent manner.
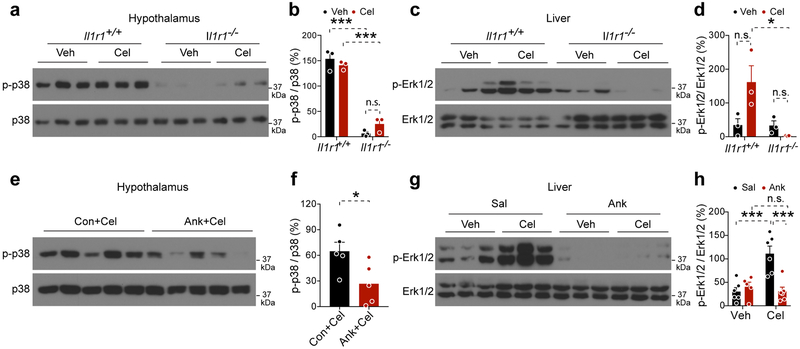
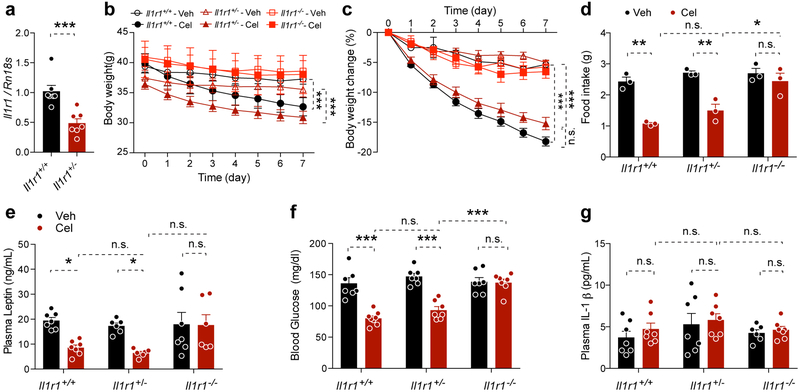
The Il1r1−/− mice had lower p-p38 than Il1r1+/+ mice in hypothalamus and lower p-Erk1/2 in liver (Extended Data 7). Central administration of Ank resulted in lower hypothalamic p-p38 (Extended Data 7). Peripheral administration of Ank resulted in lower hepatic pErk1/2 in both groups, though this was significant in only the latter case (Sal+Cel versus Ank+Cel) (Extended Data 7). These data show that Ank treatment, similar to the IL1R1 deficiency, was associated with lower MAP kinase phosphorylation in hypothalamus and/or liver, indicating that Ank treatment was effective. We next treated Il1r1+/+, Il1r1+/− and Il1r1−/− mice with either vehicle or celastrol and documented that haploinsufficiency of Il1r1 is sufficient to respond to the celastrol treatment. Celastrol treatment did not alter the circulating IL-1β levels in Il1r1+/+, Il1r1+/− and Il1r1−/− mice (Extended Data 8), suggesting the anti-obesity function of celastrol is independent of circulating IL-1β.
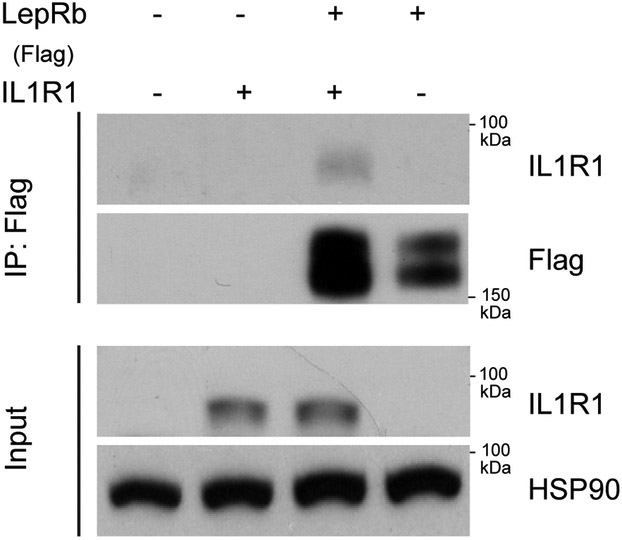
LepRb and IL1R1 are members of the cytokine receptor family, for which signaling activity requires dimerization16. Co-immunoprecipitation of Flag-LepRb in cells showed that LepRb and IL1R1 might physically interact (Extended Data 9). However, we have not yet demonstrated that this interaction occurs in the mouse hypothalamus, or that it underlies celastrol’s anti-obesity effects.
Mammals, through evolution, have developed strong mechanisms to sense and cope with starvation by reducing energy expenditure and activating central mechanisms that promote food seeking. By contrast, the chronic presence of excess energy stores in the body neither increases energy expenditure, nor reduces food-seeking in the modern, obesogenic environment. Rather, the obese state is associated with lower energy expenditure, as well as excess food intake that is sufficient to maintain body weight around a higher lower bound. One explanation for this phenomenon is the development of leptin resistance17, and perhaps generalized cytokine resistance18,19. Similar in its effects to leptin receptor deficiency, leptin resistance is an obesity-associated condition in which high levels of leptin fail to appropriately signal the presence of adequate energy stores within the organism20,21.
Conserved throughout metazoan lineages22, but present in prototypical form even in protozoans23, ER stress signaling provides an important homeostatic control for dealing with intracellular nutrient deprivation or excess24. Relief of obesity-associated ER stress with chemical chaperones has been shown to reduce leptin resistance1,2,25, leading to the identification of celastrol as a truly effective treatment for diet-induced obesity in mice1. An important conclusion of this work is that leptin resistance from hypothalamic ER stress1 is not just a result of obesity, but actively contributes to maintenance of this pathologic state.
Our results establish that IL1R1 is required for the effects of celastrol in DIO mice to promote leptin sensitization, reduce food consumption and obesity, and restore glucose tolerance and insulin sensitivity—as well as to reduce hepatic steatosis and improve liver function. The identification of IL1R1 as a mediator of improved metabolic health (secondary to celastrol action) offers unique insight into obesity and its associated ailments. IL1R1 belongs to the cytokine receptor superfamily and activates inflammatory signaling pathways26,27. The involvement of IL1R1 in increasing leptin sensitivity is against the general dogma that cytokine/inflammatory signaling pathways contribute in key fashion to the aggravation of obesity and associated metabolic diseases28,29. Leptin itself is a cytokine, and its receptor belongs to a cytokine (IL6) receptor family7,30. As is well known, deficiency of leptin or its receptor leads to morbid obesity. Similarly, IL1R1 deficiency—as published previously12,31 and confirmed herein—leads to a higher degree of obesity and metabolic disturbance. These data support that cytokine signaling can be co-opted for beneficial metabolic purposes18,19,31-36, and that development of cytokine resistance could be one of the mechanisms underlying development of ER stress, obesity and type-2 diabetes 18,19. Further understanding the exact mechanism(s) of action by which celastrol and IL1R1 increase leptin sensitivity will take extensive efforts, but will undoubtedly yield new opportunities for effective therapy of obesity and its associated diseases.
Methods
Animals and treatment
We performed all animal experiments according to the relevant ethical regulations and approved protocols by the Boston Children’s Hospital Institutional Animal Care and Use Committee. Wild-type C57BL/6J mice (stock number 000664), db/db (stock number 000697) mice, and Il1r1 homozygous knockout mice (stock number 003245) were purchased from Jackson Laboratories. Heterozygous Il1r1 knockout mice (Il1r1+/−) were generated by crossing male Il1r1 homozygous knockout mice with wild-type female mice. Il1r1 knockout (Il1r1−/−) mice and their wild-type controls (Il1r1+/+) were generated by intercrossing Il1r1+/− mice.
To generate diet-induced obese (DIO) mice, wild-type (C57BL/6J) or Il1r1+/+ and Il1r1−/− male mice were placed on high fat diet (HFD, 45 kcal% from fat) at the age of 4–6 weeks and maintained on the same diet for 16–20 weeks. HFD was purchased from Research Diets (New Brunswick, NJ). Eight-week-old db/db and lean mice were placed on normal chow diet (NCD, 13.5% calories from fat) from Lab Diet (St Louis, MO). Mice were housed in a 12 h dark/light cycle with the dark cycle lasting from 7pm to 7am. All mice had ad libitum food and water access unless otherwise indicated. Celastrol was dissolved in sterile DMSO (25 μl), and administered to the mice intraperitoneally 60–90 min prior to the dark cycle, unless otherwise specified. The corresponding vehicle groups were injected intraperitoneally with a total volume of 25 μl sterile DMSO.
Total RNA extraction and microarray analysis
The DIO, lean, and db/db mice were injected intraperitoneally with vehicle or celastrol one time (250 μg/kg) and sacrificed shortly thereafter 6 hours, or injected once per day (100 μg/kg) for one day, or four days, and sacrificed 6 hours after the final injection. The hypothalami were extracted and stored at −80 °C until RNA extraction. To extract total RNA, 500 μl of TRIzol was added to each sample. The tissues were homogenized with a bench-top TissueLyser II (Qiagen, Valencia, CA), and the hypothalamic RNA was extracted according to the manufacturer’s instruction of TRIzol lysis reagent. For microarray analysis, the extracted total RNA was cleaned using RNeasy Min Cleanup Kit (74104, QIAGEN) and 1 μg total RNA was used for microarray analysis in Molecular Biology Core Facilities of Dana Farber Cancer Institute-Harvard Medical School. Briefly, the total RNA was processed using the Affymetrix GeneChip™ WT Reagent Kit. The kit generates amplified and biotinylated sense-stranded DNA targets for hybridization. Fragmented, biotinylated cDNA was hybridized to Mouse Gene 1.0 ST arrays for 16 h at 45 °C and 60 rpm in an Affymetrix GeneChip™ Hybridization Oven 645. Mouse GeneChip ST arrays were washed and stained using the Affymetrix FS450 automated fluidics station. GeneChips were scanned in an Affymetrix GCS3000 7G scanner with autoloader.
Microarray Data Analysis
To begin analysis of the microarray data, we performed principle component analysis and sample-sample correlation test as quality control to look for unexpected relationships between the individual samples. For differential analysis of gene expression between celastrol- and vehicle-treated groups, as well as between DIO and db/db, DIO and lean, we first performed temporal pattern-based gene identification approach, which used liberal thresholds (P<0.05 by t test and log2fold change>0.2) and grouped up- or down-regulated genes. Based on three time points used (6 hours, 1 day and 4 days), and three possible regulations in celastrol- versus vehicle-injected mice at each time point (up-regulated, non-regulated, or down-regulated) in DIO mice, there were 27 (i.e. 3×3×3) possible patterns in total. One of the 27 patterns—containing genes “non-regulated” at all three time points—was automatically excluded from consideration, as it contained no genes that met fold change and significance criteria. Thus, we examined 26 patterns of celastrol-associated gene-expression changes (refer to Figure 1h, Column 1). For each pattern, we separately denoted the number of genes that exceeded our threshold criteria in each of the three mouse models (refer to Figure 1h, Column 2). We then calculated the fraction of all threshold-exceeding genes in each mouse model that were accounted for by each of the 26 temporal patterns (refer to Figure 1h, Column 3) (e.g. for pattern 10, 38/921=0.041 in the DIO model). To highlight the temporal patterns that accounted, in the greatest part, for differences in celastrol-mediated regulation between DIO and control mice (db/db and lean), we divided each Column 3 DIO value by the corresponding Column 3 values for db/db and lean control mice. The two Ratio values created in this step (refer to Figure 1h, Column 4) effectively normalized the weighting of temporal patterns of regulation in DIO mice by the respective weightings in the db/db or lean control groups. To obtain a combined score that incorporated comparisons of DIO mice to both db/db and lean mice, we multiplied the two Ratio values in Column 4 to create a ‘Final score’ for each temporal pattern (refer to Figure 1h, Column 5). Patterns 10 and 17 were found to have the highest Final score values.
To identify biological pathways containing the genes in patterns 10 and 17, we employed enrichment analysis in Gene Ontology Consortium (GO). We were unable to obtain enriched pathways using the smaller pattern 17 (just 15 genes). However, using the larger pattern 10, we identified three pathways in which these celastrol-upregulated genes were significantly enriched: (i) Regulation of inflammatory response, (ii) Regulation of defense response, and (iii) Regulation of response to external stimulus) (refer to Figure 1i-j). To create a combined analysis of day 1 and 4 together, we calculated the geometric mean (√(Fold changed1 * Fold changed4)) as the final metric for the enrichment of each gene evaluated (refer to Figure 1l-n).
We also used a linear model combining all experimental conditions as factors to identify celastrol-regulated genes. For each gene, we performed an F test for the set of seven simultaneous contrasts in the model and computed P values (Benjamini-Hochberg) using tools in the Bioconductor limma package:
cDNA synthesis and quantitative real-time PCR
Total RNA was extracted from the tissues with TRIzol lysis reagent following manufacturer’s protocol. Complementary DNA (cDNA) was synthesized with 1 μg of total RNA using iScript cDNA synthesis kit (Bio-Rad) according to the manufacturer’s protocol. QPCR was conducted by SYBER GREEN on QuantStudio™ 6 Flex Real-Time PCR system (Life Technologies). The relative expression of genes of interest was calculated by comparative Ct method and RN18S was used as an endogenous control. The primers used to detect the genes are as follows:
| Il1r1: | Forward: 5’-GTGCTACTGGGGCTCATTTGT-3’ |
| Reverse: 5’-GGAGTAAGAGGACACTTGCGAAT-3’ | |
| RN18S: | Forward: 5’- AGTCCCTGCCCTTTGTACACA-3’ |
| Reverse: 5’- CGATCCGAGGGCCTCACTA-3’ | |
| Agrp: | Forward: 5’- ATGCTGACTGCAATGTTGCTG-3’ |
| Reverse: 5’- CAGACTTAGACCTGGGAACTCT-3’ | |
| Npy: | Forward: 5’- ATGCTAGGTAACAAGCGAATGG-3’ |
| Reverse: 5’- TGTCGCAGAGCGGAGTAGTAT-3’ | |
| Pomc: | Forward: 5’- ATGCCGAGATTCTGCTACAGT-3’ |
| Reverse: 5’- TCCAGCGAGAGGTCGAGTTT-3’ | |
| Socs3: | Forward: 5’- ATGGTCACCCACAGCAAGTTT −3’ |
| Reverse: 5’- TCCAGTAGAATCCGCTCTCCT-3’ |
Behavioral studies
Home-cage behavior: DIO mice were singly housed during acclimation with daily injection of vehicle. After acclimation, the mice were injected with vehicle or celastrol (100 μg/kg, i.p.,daily) for 3 days prior to the behavioral test. On the experiment day, 1 h after light cycle, the mice were administered vehicle or celastrol (200 μg/kg, i.p.), and then placed in the testing room 1 h for acclimation. During the test, the mice in the home cage were placed under the CCD camera of the Ethovision video tracking system for 20 min. The grooming frequency and the grooming bouts were blindly analyzed.
Open field test: DIO mice were injected with vehicle or celastrol (100 μg/kg, i.p., daily) for 3 days prior to the behavioral test. On the fourth day of treatment, 1 h after light cycle, the mice were administered a single dose of either vehicle or celastrol (200 μg/kg, i.p.), and the open field test was conducted 6 h after the last injection in an ad libitum-fed state. Before the test, mice were exposed to the field for 5 minutes for 2 consecutive days. During the test, mice were placed into the side of the field and allowed to explore the apparatus for 10 min. Noldus Ethovision tracking software was used to map the central portion of the field. The locomotor activity was recorded by a CCD camera and analyzed using Noldus Ethovision video tracking system.
Social behavior tests: DIO mice were injected with vehicle or celastrol (100 μg/kg, i.p., daily) for 3 days prior to the behavioral test. On the fourth day, 1 h after light cycle, the mice were treated with vehicle or celastrol (200 μg/kg, i.p.) for 6 h, and the behavioral test was conducted in an ad libitum-fed state using a three-chambered apparatus, which includes a center chamber and two side chambers. The dividing walls had doorways allowing access into each chamber. Each side chamber was paired with a wire cup as the novel object, where the novel mouse will be located. In the habituation phase, the mice were placed in the center chamber and allowed to freely access to all chambers for 5 min without the novel mouse in the wire cup. At the end of habituation, the treated mice were returned to their home cage, and a novel mouse (novel mouse1) was placed into the wire cup located in the corner of right side chamber. In the sociability phase, the mice were placed in the center chamber again and allowed to freely move between chambers for 10 min. After the sociability test, the treated mice were returned to their home cage and novel mouse1 remained in the right chamber. For the social novelty test, a second novel mouse (novel mouse2) was introduced to the wire cup located in the left side chamber. The treated mice were placed in the center chamber again, and allowed to freely access to all the chambers for 10 min. The activities, including total movement, time spent in different chambers as well as time spent with different novel mice, were recorded by a CCD camera and analyzed using Noldus Ethovision video tracking software.
Conditioned place preference test: Mice were tested for food-conditioned place preference in a three-chambered apparatus, side chambers and center chamber. One side chamber was paired with black wall, rough floor and non-eatable object (food mimic), while the other side chamber was paired with white wall, smooth floor and food. The experiment included 3 phases:
In the preconditioning phase (day 1), the mice were placed in the center chamber and allowed to freely access to the side chambers for 15 min. In the conditioning phase, the mice had free access to food-paired side chamber on days 2, 4 and 6, and had no access to food-paired side chamber on days 3, 5 and 7. The mice were injected with vehicle (25 μl DMSO, i.p, daily) through day 1 to day 4. Prior to place preference test, mice received injections of vehicle or celastrol (100 μg/kg, i.p., daily, 5 pm) for 3 days (from day 5 to day 7). The mice were then either fasted for 20h (fasting groups) or allowed to freely access food (ad libitum-fed groups).
The testing phase was performed during the light cycle on the fourth day of celastrol treatment following injection of vehicle or celastrol (200 μg/kg, i.p., 8 am) for 5 h. The mice were placed in the center chamber and allowed to freely move between chambers for 20 min. The frequency traveled to each chamber and food-located zones, as well as the total and percentage of time spent in each chamber were recorded via a CCD camera with Noldus Ethovision video tracking system and analyzed using Noldus Ethovision program.
Blood collection
Blood was collected from the tail vein with heparinized capillary tubes, transferred to ice-cold eppendorf tubes, and centrifuged at 3000 rpm for 30 min at 4 °C. Plasma portions were transferred to new vials and stored at −80 °C until processing.
Glucose Tolerance Test (GTT) and Insulin Tolerance Test (ITT)
For GTT, mice were fasted for 15 h (5 pm to 8 am) and dextrose (1 g/kg) was administered intraperitoneally. Blood glucose levels were measured with a glucometer with the blood obtained from the tail before and after 15, 30, 60, 90 and 120 min of dextrose administration.
For ITT, mice were fasted for 6 h (from 8 am to 2 pm). Recombinant human insulin (1 IU/kg) was administrated intraperitoneally. Blood glucose levels were measured with a glucometer with the blood obtained from the tail before and 15, 30, 60, 90 and 120 min after insulin administration.
Leptin administration and food intake/body weight measurements
DIO Il1r1−/− mice were administered vehicle or celastrol (100 μg/kg, i.p.) once a day for two days. One hour after the second injection (7 pm), we further divided the vehicle and celastrol-injected groups into two subgroups. Each subgroup of mice was injected with either saline or leptin (1 mg/kg, i.p.). Food intake and body weight changes were measured during the 16 h experimental period after saline or leptin administration.
Body Composition Measurement
We assessed total lean mass, fat mass and fat percentage using dual-energy X-ray absorptiometry (DEXA; Lunar PIXImus2, GE Lunar Corp., Madison, WI, USA).
Body Temperature Measurement
The body temperature was measured by inserting a probe (Model BAT-12, Physitemp Instruments Inc, Clifton, New Jersey) into the rectum of mice after 1, 2 and 3 weeks of celastrol treatment.
Total protein extraction and western blotting
Hypothalamus or liver were homogenized with a bench-top TissueLyser II in ice-cold tissue lysis buffer (25 mM Tris-HCl, pH 7.4; 100 mM NaF; 50 mM Na4P2O7; 10 mM Na3VO4; 10 mM EGTA; 10 mM EDTA; 1% NP-40; supplemented with phosphatase and protease inhibitors) and then subjected to centrifugation at 13,400 g for 30 min at 4°C. Protein concentration was quantified using a Protein Assay Kit (Bio-Rad). Protein samples were mixed with 5x Laemmli buffer and boiled at 95 °C for 5 min before loading on sodium dodecyl sulfate poly acrylamide gels (SDS-PAGE). After electrophoresis, we transferred the proteins onto PVDF membranes at 4 °C, 100 V for 2 h, and blocked the membranes in TBS-0.1% Tween-20 (TBST) with 10% blocking reagent. We incubated the membranes with primary antibodies overnight in TBST containing 10% blocking reagent. After primary incubation, we washed the membranes three times for 20 min with TBST and then incubated the membranes with secondary antibodies in TBST with 10% blocking reagent for 1 h at room temperature. After washing the membrane three times in TBST, we developed the membranes using a chemiluminescence assay system and quantified band intensities using ImageJ (NIH) analysis program.
Hormone and metabolite measurements from mouse plasma
Plasma leptin, insulin, ALT, and AST were measured using the corresponding ELISA or assay kits according to the manufacturer’s instructions. The plasma from DIO mice was diluted 5–10 times in leptin ELISA. We used 5 μl of plasma for the insulin ELISA and AST assay, and 10 μl for the ALT assay.
Immunoprecipitation
HEK 293 cells were transfected with LacZ, muse IL1R1 or Flag-tagged LepRb for 24 h. Immunoprecipitation cell lysates (500 μg per sample) were incubated with anti-Flag® M2 Affinity Agarose Gel (A2220, 30 μl, Sigma) for 3 h at room temperature with a gentle rotation. Beads were precipitated by centrifugation at 800 g for 30 s and washed three times with ice-cold lysis buffer. The pellet was resuspended in 2X Laemmli buffer and incubated at 100 °C for 5 min. The supernatants were collected and used for western blot to detect Flag and IL1R1. The expression levels of IL1R1 and HSP90 in the total cell lysates were detected as loading controls.
Immunohistofluorescence (IHF) staining
DIO Il1r1+/+ or Il1r1−/− mice were acclimated with 25 μl of DMSO by intraperitoneally 60 min prior to dark cycle for 7 days. Then, mice were injected with either 25 μl of vehicle or celastrol (100 μg/kg) for 3 days. Fourteen hours after the third injection, each group of mice was injected once more with vehicle or celastrol (200 μg/kg), and were then fasted for 6 h. Subsequently,brains were fixated with perfusion of ice-cold 4% paraformaldehyde (PFA) through the heart after blood was flushed away by phosphate buffered saline (PBS: 3.2 mM Na2HPO4, 0.5 mM KH2PO4, 1.3 mM KCl, 135 mM NaCl, pH 7.4). Following additional overnight fixation in 4% PFA, brains were incubated sequentially with 20% sucrose and 30% sucrose for two days, and frozen in Tissue-Tek OCT compound (Sakura Finetek; Torrance, CA) on dry ice and stored at −80°C. A total of 48 sections (30 μm/section, divided to 4 sets, 12 sections /set, from bregma −0.9 to −2.3), including the whole arcuate nucleus (ARC), ventromedial hypothalamus (VMH) and dorsomedial hypothalamus (DMH) from each mouse were collected using cryostat (Leica) and stored in ice-cold PBS. One set of sections from each brain was subjected to phospho-STAT3 (Tyr705, p-STAT3) staining. The floating sections were washed with PBS twice for 5 min at room temperature and then incubated with 0.3% H2O2 - 0.1% NaOH in PBS for 20 min, 0.3% Glycine for 10 min and 0.03% SDS for 10 min. Following 1 h incubation with blocking buffer (3% normal goat serum, 0.3% Triton X-100, 0.02% NaN3 in PBS), the sections were incubated with p-STAT3Tyr705 antibody (1:3000 in blocking buffer, Cat. 9145, Cell Signaling) for 48h at 4°C. After washing for 10 min with PBST (0.05% Tween 20 in PBS) three times, the sections were incubated with Alexa Fluor 488 conjugated goat anti-rabbit IgG for 1 h at room temperature. After three additional washes with PBST, the sections were placed on microcopy slides and coverslipped, and then subjected to imaging processing. The images from ARC, VMH and DMH were acquired with a ZEISS 710 confocal microscope under 20X objective (resolution: 1042×1042 pixels) for analysis. The representative image was acquired under 10X objective to show the wide field. The sections without detectable p-STAT3 signal were not subjected to the analysis. The fluorescence-positive cell numbers and fluorescence intensities representing p-STAT3 were analyzed by using Image J software with the option of analysis particle, which determined area of measurement and calculated mean grey value, particle numbers and integrated fluorescence densities. The same setting was applied for all image processing and analysis. The sum of p-STAT3 positive cell numbers (p-STAT3 cell number) and fluorescence intensities from sections of ARC, VMH and DMH of each brain were calculated and presented as the percentage to control group (vehicle plus saline treated group). All the images were blindly processed and analyzed by the investigator.
Hematoxylin and eosin (H&E) staining
After treatment of Il1r1+/+ or Il1r1−/− mice with vehicle or celastrol (100 μg/kg, i.p.) for three weeks, the liver was dissected and stored in 10% buffered formalin phosphate. Paraffin embedded liver sections were H&E stained.
Cannula placement and intracerebroventricular (ICV) injection
DIO mice were anesthetized using a ketamine-xylazine (100–20 mg/kg) combination and placed on a stereotaxic apparatus. 26 gauge guide cannulas (C315G-SPC, PlasticsOne) were implanted to the lateral ventricle using appropriate coordinates (bregma, –0.22 mm; midline, +1 mm; dorsal surface, –2,1 mm). Dental acrylic was used to secure the cannula to the skull. A dummy cannula (C315DC-SPC, PlasticsOne) was twisted onto the guided cannula. Animals were allowed to recover for 10 days prior to experiment. The body weight and food intake were measured daily.
During the ICV injection, the dummy cannula was removed and the internal cannula (C315I-SPC, PlasticsOne) was inserted into the guide cannula. The internal cannula was connected to a plastic tube containing a Hamilton syringe at its end, allowing free movement of mice during injection. Two days prior to celastrol treatment, anakinra (5 μg in 2 μl aCSF, daily) was infused into the ventricle in 10 min. The internal cannula was kept in brain for 1 minute before replacement, and 2 μl aCSF was infused in the same way to the control group. During the treatment of mice with celastrol, aCSF or anakinra was infused 2 h before celastrol intraperitoneal injection.
Statistical Analysis
All data are presented as mean ± S.E.M. Statistical significance was measured using Student’s t test (two-tailed) or two-way ANOVA as indicated in figure legends. P values below 0.05 were considered significant. Numbers of cohorts and n values for each experiment were indicated in figure legends. Dead or sick mice before the end of experiments or statistical outliers (judged by Grubb’s outlier test) were excluded in the final analysis. No statistical method was used to pre-determine sample size and sample size was determined based on previous experiments, our previous experience and the literature. The variance was similar in the groups being compared.
Data Availability
The raw data for mouse hypothalamic microarray is available from NCBI GEO repository with accession number: GSE124353 for DIO mice, GSE124355 for db/db mice and GSE124356 for lean mice. The source images for p-STAT3 staining can be found through figshare.com/s/0741ab007eefdf3f6605. All other data that support the findings of this study are available from the corresponding author upon reasonable request.
Extended Data
Extended Data Fig. 1. Microarray analysis of hypothalamic transcriptome.
(a) Flow chart for microarray analysis. (b) Heatmap depicting the average log2FC (Cel/Veh) of the 38 up-regulated genes and 15 down-regulated genes in the Pattern10 and Pattern17 of Figure 1 h. (c) Heat map showing clustering of 74 up-regulated genes and 29 down regulated genes from limma F-test analysis. (d) Gene Ontology (GO) pathways significantly enriched in 74 up-regulated genes from limma F-test analysis. (e) The log2 fold change (log2FC) of the nine genes present in the GO pathway “regulation of inflammatory response” in DIO mice after 6 h, 1 day and 4 day of vehicle or celastrol administration. n=4 mice for 6 h and 1 day or n=3 mice for 4 day group. Values indicate mean ± s.e.m. (f) Heat map showing log2 expression of identified nine genes present in the GO pathway “regulation of inflammatory response” in DIO, lean and db/db mice at 6 h, 1 day and 4 day of time points. (g) Geometric mean of 1 day and 4 day fold changes of the identified genes in DIO, lean and db/db mice. (h,i) Hypothalamic mRNA levels of identified genes in DIO mice treated with vehicle or celastrol for (h) 1 day (Il1r1, P=0.0002, Ada, P=0.0001, Nfkbia, P=0.01, Ptgs2, P=0.003, Tgm2, P=0.0002, Zfp36, P=0.01. n=6 mice for each group) and (i) 4 days (Il1r1, P=0.01, Ada, P=0.03, Nfkbia, P=0.01, Ptgs2, P=0.009, Tgm2, P=0.007, Zfp36, P=0.02. n=4 mice for each group). Values indicate average ± s.e.m. P values were determined by two-tailed Student’s t test (h,i). * P < 0.05, ** P < 0.01, *** P < 0.001.. P values were determined by two-tailed Student’s t test (h,i). * P < 0.05, ** P < 0.01, *** P < 0.001.
Extended Data Fig. 2. IL1R1 deficiency leads to significantly higher levels of obesity.
Il1r1−/− mice and their wild-type (Il1r1+/+) littermates were fed a HFD for 16 weeks to induce obesity. The experiments were repeated two times with similar results. (a) PCR analysis of Il1r1 locus in genomic DNA of Il1r1+/+ and Il1r1−/− mice. (b, c) qPCR analysis of Il1r1 mRNA levels in the (b) hypothalamus (P<0.0001) and (c) liver (P=0.007). n=6 for Il1r1+/+ group and n=4 for Il1r1−/− group. (d) Body weights of Il1r1+/+ and Il1r1−/− mice during HFD feeding (n=10 mice for Il1r1+/+ group and n=9 mice for Il1r1−/− group, P<0.0001). (e) Average 24-hour food intake per mouse after four, eight, 12, or 16 weeks of HFD feeding (n=3 cages for each group). (f-h) DEXA analysis of body composition after 16 weeks of HFD (n=10 mice for Il1r1+/+ group and n=9 mice for Il1r1−/− group): (f) lean mass (P=0.163), (g) fat mass (P=0.003) and (h) fat % (P=0.001). (i) Plasma leptin levels of Il1r1+/+ and Il1r1−/− mice at four, eight, 12 and 16 weeks of HFD feeding (n=5 for each group. 4 weeks, P=0.001; 8 weeks, P=0.02). (j) Blood glucose levels of Il1r1+/+ and Il1r1−/− mice during GTT performed after 10 weeks on HFD and (k) AUC analysis of GTT (n=10 mice for Il1r1+/+ group and n=9 for Il1r1−/− group. P=0.03). (l) Blood glucose levels of Il1r1+/+ and Il1r1−/− mice during ITT performed after 12 weeks on HFD and (m) AUC analysis of ITT (n=10 mice for Il1r1+/+ group and n=9 mice Il1r1−/− group. P=0.007). (n) 15-hour fasting blood glucose of Il1r1+/+ and Il1r1−/− mice after 10 weeks of HFD (n=10 mice for Il1r1+/+ mice and n=9 mice Il1r1−/− group. P=0.03). (o) Six-hour fasting blood glucose levels of Il1r1+/+ and Il1r1−/− mice after 12 weeks on HFD (n=10 mice for Il1r1+/+ group and n=9 mice Il1r1−/− group. P=0.003). (p) Plasma insulin levels in Il1r1+/+ and Il1r1−/− mice after 4, 8, 12 or 16 weeks on HFD (n=5 mice for Il1r1+/+ group and n=4 mice for Il1r1−/− group. 4 weeks, P=0.007; 8 weeks, P=0.184). Values indicate average ± s.e.m. P values were determined by two-way ANOVA with Bonferroni's multiple comparisons test (d, j and l) or two-tailed Student’s t test (b- c, e-i, k, m-p). * P < 0.05, ** P < 0.01, *** P < 0.001, n.s., not significant (P>0.05).
Extended Data Fig. 3. Celastrol does not change the body temperature of Il1r1+/+ or Il1r1−/− mice.
Il1r1+/+ and Il1r1−/− mice were fed HFD for 20 weeks and treated with vehicle or celastrol (100 μg/kg, i.p., once a day) for 3 weeks. Graphs show core body temperature (°C) of Il1r1+/+ and Il1r1−/− mice after (a) 1 week, (b) 2 weeks or (c) 3 weeks of vehicle or celastrol treatment. Values indicate average ± s.e.m. n=9 for both vehicle- and celastrol-treated groups for Il1r1+/+ mice; n=12 for vehicle- and n=13 for celastrol-treated groups for Il1r1−/− mice. P values were determined by two-way ANOVA with Bonferroni's multiple comparisons test; P>0.99 between each group at 1 week, 2 weeks and 3 weeks of vehicle or celastrol treatment.
Extended Data Fig. 4. Celastrol does not affect home-cage, anxiety, or social behavior in DIO mice.
DIO mice were treated with vehicle or celastrol (100 μg/kg, i.p., once a day) for 3 days. On the fourth day, home-cage behavior (grooming, d,e), open field test (f-l) and social behavior (m-o) were assessed at ad libitum-fed condition. (a) Average 24-hour food intake per mouse during the treatment (n=3 cages for each group, P=0.0001). (b) Body weight (Day 0 vs. Day 4, P>0.99 for Vehicle-treated group and P=0.002 for celastrol-treated group) and (c) percent body weight reduction before (Day 0) and after 4 days (Day 4) vehicle- or celastrol-treatment (P<0.0001). (d) Frequency (numbers) of grooming (P=0.572). (e) Total time the mice spent grooming during home-cage behavior test (P=0.255). n=10 for both vehicle- and celastrol-treated groups. (f) Total distance traveled by the mice (P=0.956). (g) Average velocity of movement during the open field test (P=0.956). (h) Duration (% of time in the assay) the mice spent moving (P=0.999). (i) Frequency (numbers during assay) that mice traveled to the central portion of field (P=0.331). (j) Total time spent in the central portion of field (P=0.591). (k) Latency (in seconds) until initial entry into the central portion of open field (P=0.913). (l) Representative movement-tracking plots of vehicle- and celastrol-treated mice in the open field assay. n=8 for each group. (m) Total time the mice spent in the object-paired side chamber (object) versus novel mouse 1-paired side chamber (novel mouse 1). Object chamber vs. Novel mouse chamber, P=0.007 in vehicle-treated group and P<0.0001 in celastrol-treated group. (n) Total time the mice spent with object, which was in the left chamber and with novel mouse 1, and in the right chamber during the sociability test. Object vs. Novel mouse, P=0.0003 in vehicle-treated group and P<0.0001 in celastrol-treated group. (o) Total time the mice spent in the novel mouse 1-paired (novel mouse 1) or novel mouse 2-paired side chamber (novel mouse 2) during social novelty test (Novel mouse 1 vs. Novel mouse 2, P=0.01 in vehicle-treated group and P=0.02 in celastrol-treated group). n=8 for both groups during sociability test and n=7 for both groups during social novelty test. Values indicate average ± s.e.m. P values were determined by two-tailed Student t test (a, d-k) or two-way ANOVA with Bonferroni's multiple comparisons test (b,c, m-o). * P < 0.05, ** P < 0.01, *** P < 0.001, n.s., not significant (P>0.05).
Extended Data Fig. 5. Celastrol treatment decreases motivation for food-seeking in only fasted mice.
(a-f) Conditioned place preference assay (CPP) under ad libitum fed (AL-fed) condition: DIO mice were treated with celastrol (100 μg/kg, i.p., once a day) for three days. On the fourth day, 1 h after the beginning of the light cycle, the mice were administered vehicle or celastrol (200 μg/kg, i.p.) and the CPP assay was performed 6 h later under AL-fed condition (n=8 for both vehicle- and celastrol-treated groups). (a) Total distance that the mice traveled during the test (P=0.941). (b) Average velocity of movement during the CPP assay (P=0.934). (c) Frequency (numbers during assay) that mice traveled to the food-paired side chamber (P=0.688). (d) Total time the mice spent in the food-paired side chamber (P=0.641). (e) Percentage of total assay time the mice spent in the food-paired side chamber (P=0.641). (f) Frequency (numbers during assay) that the mice traveled to the food-containing zone within the food-paired chamber (P=0.557). (g-l) CPP under 20-hour fasted condition: DIO mice were treated with celastrol (100 μg/kg, i.p.) once a day and fasted for 15 h after the third injection. On the fourth day, 1h after the beginning of the light cycle, the mice were administered vehicle or celastrol (200 μg/kg, i.p.) and the CPP assay was performed 5 h after this injection under fasting condition (n=7 for both vehicle- and celastrol-treated groups). (g) Total distance traveled by the mice during the CPP assay (P=0.02). (h) Average velocity of movement (P=0.02). (i) Frequency with which the mice traveled to the food-paired side chamber (P=0.104). (j) Total time the mice spent in the food-paired side chamber during the test (P=0.02). (k) Percent of total assay time the mice spent in the food-paired side chamber (P=0.02). (l) Frequency with which the mice traveled to the food-containing zone within the food-paired side chamber (P=0.01). (m,n) Representative traces showing movements of individual vehicle- and celastrol-treated mice in the CPP assays conducted under (m) AL-fed or (n) 20-hour fasted state. Values indicate average ± s.e.m. P values were determined by two-tailed Student t test. * P < 0.05, n.s., not significant (P>0.05).
Extended Data Fig. 6. Celastrol fails to increase STAT3 phosphorylation and gene expression in the hypothalamus of Il1r1−/− mice.
Il1r1+/+ and Il1r1−/− male mice were fed a HFD for 20 weeks and then administered either vehicle (Veh) or celastrol (Cel, 100 μg/kg, i.p.) daily for 3 days. Each group of mice subsequently received a single dose of vehicle or celastrol (200 μg/kg, i.p.) on the morning of the fourth day and was then fasted for 6 hours prior to extraction of the hypothalamus. Phosphorylation of STAT3 (p-STAT3Tyr705) in the medial basal hypothalamus (MBH) was analyzed by immunofluorescence staining using a phospho-specific antibody. (a, c, e) Representative images of p-STAT3Tyr705 immunostaining in the (a) arcuate nucleus (ARC), (c) ventromedial hypothalamus (VMH) and (e) dorsomedial hypothalamus (DMH) of Il1r1+/+ and Il1r1−/− mice after 4 days of vehicle or celastrol treatment. (b, d, f) Quantitation of total p-STAT3Tyr705-positive cell number and total fluorescence intensity of p-STAT3Tyr705 in the (b) ARC (Il1r1+/+-Veh vs. Il1r1+/+-Cel, P=0.0007, and Il1r1+/+-Cel vs. Il1r1−/−-Cel, P=0.006 for cell number. Il1r1+/+-Veh vs. Il1r1+/+-Cel, P=0.001, and Il1r1+/+-Cel vs. Il1r1−/−-Cel, P=0.008 for fluorescence intensity). (d) VMH (Il1r1+/+-Veh vs. Il1r1+/+-Cel, P=0.0003, and Il1r1+/+-Cel vs. Il1r1−/−-Cel, P=0.0006 for cell number. Il1r1+/+-Veh vs. Il1r1+/+-Cel, P=0.0004, and Il1r1+/+-Cel vs. Il1r1−/−-Cel, P=0.0007 for fluorescence intensity). (f) DMH (Il1r1+/+-Veh vs. Il1r1+/+-Cel, P=0.002, and Il1r1+/+-Cel vs. Il1r1−/−-Cel, P=0.02 for cell number. Il1r1+/+-Veh vs. Il1r1+/+-Cel, P=0.004, and Il1r1+/+-Cel vs. Il1r1−/−-Cel, P=0.01 for fluorescence intensity). The experiments a-f were repeated in two independent cohorts with similar outcomes and the results in b, d and f represent the combination of two independent experiments (total n=7 for both vehicle- and celastrol-treated mice in Il1r1+/+ group; n=8 for both vehicle- and celastrol-treated mice in Il1r1−/− group). Scale bars, 100 μm. 3V, third ventricle. (g-j) Expression levels of genes in the hypothalamus of Il1r1+/+ and Il1r1−/− mice treated with vehicle or celastrol (100 μg/kg, i.p., once a day) for 4 days. (g) Agrp (Il1r1+/+-Veh vs. Il1r1+/+-Cel, P=0.005 and Il1r1−/−-Veh vs. Il1r1−/−-Cel, P>0.99), (h) Npy (Il1r1+/+-Veh vs. Il1r1+/+-Cel, P=0.362 and Il1r1−/−-Veh vs. Il1r1−/−-Cel, P=0.871), (i) Pomc (Il1r1+/+-Veh vs. Il1r1+/+-Cel, P=0.757 and Il1r1−/−-Veh vs. Il1r1−/−-Cel, P>0.99) and (j) Socs3 mRNA (Il1r1+/+-Veh vs. Il1r1+/+-Cel, P=0.03 and Il1r1−/−-Veh vs. Il1r1−/−-Cel, P>0.99). (n=6 for vehicle- and n=7 celastrol-treated mice in Il1r1+/+ group; n=4 for both vehicle- and celastrol-treated mice in Il1r1−/− group). Values indicate average ± s.e.m. P values were determined by two-way ANOVA with Bonferroni's multiple comparisons test. * P < 0.05, ** P < 0.01, *** P < 0.001, n.s., not significant (P>0.05).
Extended Data Fig. 7. IL1R1 deficiency or IL1R1 antagonist treatment reduce MAP kinase phosphorylation.
(a-d) Ad libitum fed Il1r1+/+ mice and food restricted Il1r1−/− mice (~0.5 g food/day) were treated with vehicle (Veh) or celastrol (Cel, 100 μg/kg, i.p., daily) for 7 days and the phosphorylation states of hypothalamic or hepatic MAP kinases (p38, Erk1,2) were analyzed by western blot. (a) Representative immunoblots for phospho-p38 MAP kinase (p-p38) and total p38 MAP kinase (p38) in the hypothalamus of Il1r1+/+ and Il1r1−/− mice. (b) Ratios of quantitated p-p38 densities to p38 densities. n=3 mice for each group. Il1r1+/+-Veh vs. Il1r1−/−-Veh, P<0.0001, Il1r1+/+-Cel vs. Il1r1−/−-Cel, P<0.0001, Il1r1−/−-Veh vs. Il1r1−/−-Cel, P>0.99. (c) Representative immunoblots for phospho-MAP kinase (p-Erk1/2) and Erk1/2 MAP kinase in the liver of Il1r1+/+ and Il1r1−/− mice. (d) Ratios of quantitated p-Erk1/2 densities to Erk1/2 densities. n=3 mice for each group. Il1r1+/+-Veh vs. Il1r1+/+-Cel, P=0.06, Il1r1+/+-Cel vs. Il1r1−/−-Cel, P=0.01, Il1r1−/−-Veh vs. Il1r1−/−-Cel, P>0.99. (e,f) DIO mice were administered IL1R1 antagonist anakinra (Ank, 5 μg/mouse/day) through intracerebroventricular infusion into the third ventricle in combination with celastrol (100 μg/kg, i.p. daily) for 7 days. (e) Representative immunoblots for p-p38 and total p38 in the hypothalamus. (f) Ratios of quantitated p-p38 densities to p38 densities. n=5 mice for each group, P=0.03. (g,h) DIO mice were treated with IL1R1 antagonist (Ank, 30 mg/kg, i.p. injection, twice a day) in combination with celastrol (100 μg/kg, i.p. daily) for 7 days. (g) Representative immunoblots for p-Erk1/2 and total Erk1/2 in the liver. (h) Ratios of quantitated p-Erk1/2 densities to Erk1/2 densities. n=6 mice for each group, Sal+Veh vs. Sal+Cel, P=0.0004, Ank+Veh vs. Ank+Cel, P>0.99, Sal+Cel vs. Ank+Cel, P=0.0004. Values indicate average ± s.e.m. P values were determined by two-way ANOVA with Bonferroni's multiple comparisons test (b, d, h) or two-tailed Student’s t test (f). * P < 0.05, *** P < 0.001, n.s., not significant (P>0.05).
Extended Data Fig. 8. Celastrol effect on the mice with Il1r1 heterozygous deletion.
(a) Hypothalamic Il1r1 mRNA levels in Il1r1+/+ and Il1r1+/− mice determined by qPCR. n=7 mice for each group. Values indicate average ± s.e.m., P=0.0009, determined by two-tailed Student’s t test. (b-g) Il1r1+/+ and Il1r1+/− or Il1r1−/− mice (with 37-40 g of average body weight) were fed on chow diet and treated with vehicle or celastrol (100 μg/kg, i.p., once a day) for 7 days. n=7 mice for each group. (b) Body weight. Il1r1+/+-Veh vs. Il1r1+/+-Cel, P=0.0005, Il1r1+/−-Veh vs. Il1r1+/−-Cel, P<0.0001, Il1r1−/−-Veh vs. Il1r1−/−-Cel, P=0.753. (c) Percentage of body weight change during the treatment. Il1r1+/+-Veh vs. Il1r1+/+-Cel and Il1r1+/−-Veh vs. Il1r1+/−-Cel, P<0.0001, Il1r1−/−-Veh vs. Il1r1−/−-Cel, P=0.576. (d) Average daily food intake during the treatment. Il1r1+/+-Veh vs. Il1r1+/+-Cel, P=0.001, Il1r1+/−-Veh vs. Il1r1+/−-Cel, P=0.002, Il1r1−/−-Veh vs. Il1r1−/−-Cel, P>0.99, Il1r1+/+-Cel vs. Il1r1+/−-Cel, P>0.99, Il1r1+/−-Cel vs. Il1r1−/−-Cel, P=0.02. (e) Plasma leptin levels after 7 days treatment. Il1r1+/+-Veh vs. Il1r1+/+-Cel, P=0.03, Il1r1+/−-Veh vs. Il1r1+/−-Cel, P=0.04, Il1r1−/−-Veh vs. Il1r1−/−-Cel, P>0.99, Il1r1+/+-Cel vs. Il1r1+/−-Cel, P>0.99, Il1r1+/−-Cel vs. Il1r1−/−-Cel, P=0.06. (f) Six-hour fasting blood glucose after 7 days treatment. Il1r1+/+-Veh vs. Il1r1+/+-Cel and Il1r1+/−-Veh vs. Il1r1+/−-Cel, P<0.0001, Il1r1−/−-Veh vs. Il1r1−/−-Cel and Il1r1+/+-Cel vs. Il1r1+/−-Cel, P>0.99, Il1r1+/−-Cel vs. Il1r1−/−-Cel, P=0.0002. (g) Plasma IL-1* levels after 7 days treatment (P>0.99, between each group). Values indicate average ± s.e.m. P values were determined by two-way ANOVA with Bonferroni's multiple comparisons test. * P < 0.05, *** P < 0.001, n.s., not significant (P>0.05).
Extended Data Fig. 9. IL1R1 interacts with LepRb.
HEK293 cells were transfected with plasmids expressing Lac Z, human IL1R1 (hIL1R1), Flag-tagged LepRb or hIL1R1 and Flag-tagged LepRb together. The experiments were repeated for two times with similar outcome. Representative immunoblots depict the immunoblotting results of IL1R1 and Flag in the Flag immunoprecipitates (top). The expression levels of IL1R1 and HSP90 in the input total cell lysates are shown in the lower panels.
ACKNOWLEDGMENTS
This work was mainly supported by the funds provided to U.O. from Department of Medicine, Smith President’s Innovation Award from Boston Children’s Hospital and also by grants R01DK098496 and R56DK098496 provided to U.O. by the National Institutes of Health, and support from Fidelity Biosciences Research Initiative.
Footnotes
COMPETING INTERESTS
U.O. is a scientific founder, shareholder, and member of scientific advisory board and board of directors of ERX Pharmaceuticals Inc.
REFERENCES
- 1.Liu J, Lee J, Salazar Hernandez MA, Mazitschek R & Ozcan U Treatment of obesity with celastrol. Cell 161, 999–1011 (2015). [DOI] [PMC free article] [PubMed] [Google Scholar]
- 2.Ozcan L, et al. Endoplasmic reticulum stress plays a central role in development of leptin resistance. Cell Metab 9, 35–51 (2009). [DOI] [PubMed] [Google Scholar]
- 3.Ozcan U, et al. Endoplasmic reticulum stress links obesity, insulin action, and type 2 diabetes. Science 306, 457–461 (2004). [DOI] [PubMed] [Google Scholar]
- 4.Lee J & Ozcan U Unfolded protein response signaling and metabolic diseases. J Biol Chem 289, 1203–1211 (2014). [DOI] [PMC free article] [PubMed] [Google Scholar]
- 5.Williams KW, et al. Xbp1s in Pomc neurons connects ER stress with energy balance and glucose homeostasis. Cell Metab 20, 471–482 (2014). [DOI] [PMC free article] [PubMed] [Google Scholar]
- 6.Dietrich MO & Horvath TL Hypothalamic control of energy balance: insights into the role of synaptic plasticity. Trends Neurosci 36, 65–73 (2013). [DOI] [PubMed] [Google Scholar]
- 7.Pan WW & Myers MG Jr. Leptin and the maintenance of elevated body weight. Nat Rev Neurosci 19, 95–105 (2018). [DOI] [PubMed] [Google Scholar]
- 8.Vasilyev FF, Silkov AN & Sennikov SV Relationship between interleukin-1 type 1 and 2 receptor gene polymorphisms and the expression level of membrane-bound receptors. Cell Mol Immunol 12, 222–230 (2015). [DOI] [PMC free article] [PubMed] [Google Scholar]
- 9.Sims JE, et al. Interleukin 1 signaling occurs exclusively via the type I receptor. Proc Natl Acad Sci U S A 90, 6155–6159 (1993). [DOI] [PMC free article] [PubMed] [Google Scholar]
- 10.Garber C, et al. Astrocytes decrease adult neurogenesis during virus-induced memory dysfunction via IL-1. Nat Immunol 19, 151–161 (2018). [DOI] [PMC free article] [PubMed] [Google Scholar]
- 11.Pang IK, Ichinohe T & Iwasaki A IL-1R signaling in dendritic cells replaces pattern-recognition receptors in promoting CD8(+) T cell responses to influenza A virus. Nat Immunol 14, 246–253 (2013). [DOI] [PMC free article] [PubMed] [Google Scholar]
- 12.Garcia MC, et al. Mature-onset obesity in interleukin-1 receptor I knockout mice. Diabetes 55, 1205–1213 (2006). [DOI] [PubMed] [Google Scholar]
- 13.Glaccum MB, et al. Phenotypic and functional characterization of mice that lack the type I receptor for IL-1. J Immunol 159, 3364–3371 (1997). [PubMed] [Google Scholar]
- 14.Abbate A, et al. Anakinra, a recombinant human interleukin-1 receptor antagonist, inhibits apoptosis in experimental acute myocardial infarction. Circulation 117, 2670–2683 (2008). [DOI] [PubMed] [Google Scholar]
- 15.Fox E, et al. The serum and cerebrospinal fluid pharmacokinetics of anakinra after intravenous administration to non-human primates. J Neuroimmunol 223, 138–140 (2010). [DOI] [PMC free article] [PubMed] [Google Scholar]
- 16.Peelman F, Zabeau L, Moharana K, Savvides SN & Tavernier J 20 years of leptin: insights into signaling assemblies of the leptin receptor. J Endocrinol 223, T9–23 (2014). [DOI] [PubMed] [Google Scholar]
- 17.Frederich RC, et al. Leptin levels reflect body lipid content in mice: evidence for diet-induced resistance to leptin action. Nat Med 1, 1311–1314 (1995). [DOI] [PubMed] [Google Scholar]
- 18.Liu J, et al. Inflammation Improves Glucose Homeostasis through IKKbeta-XBP1s Interaction. Cell 167, 1052–1066 e1018 (2016). [DOI] [PMC free article] [PubMed] [Google Scholar]
- 19.Lee J, et al. p38 MAPK-mediated regulation of Xbp1s is crucial for glucose homeostasis. Nat Med 17, 1251–1260 (2011). [DOI] [PMC free article] [PubMed] [Google Scholar]
- 20.Myers MG Jr., Leibel RL, Seeley RJ & Schwartz MW Obesity and leptin resistance: distinguishing cause from effect. Trends Endocrinol Metab 21, 643–651 (2010). [DOI] [PMC free article] [PubMed] [Google Scholar]
- 21.Schwartz MW & Baskin DG Leptin and the brain: then and now. J Clin Invest 123, 2344–2345 (2013). [DOI] [PMC free article] [PubMed] [Google Scholar]
- 22.Gardner BM, Pincus D, Gotthardt K, Gallagher CM & Walter P Endoplasmic reticulum stress sensing in the unfolded protein response. Cold Spring Harb Perspect Biol 5, a013169 (2013). [DOI] [PMC free article] [PubMed] [Google Scholar]
- 23.Joyce BR, Tampaki Z, Kim K, Wek RC & Sullivan WJ Jr. The unfolded protein response in the protozoan parasite Toxoplasma gondii features translational and transcriptional control. Eukaryot Cell 12, 979–989 (2013). [DOI] [PMC free article] [PubMed] [Google Scholar]
- 24.Iurlaro R, et al. Glucose Deprivation Induces ATF4-Mediated Apoptosis through TRAIL Death Receptors. Mol Cell Biol 37(2017). [DOI] [PMC free article] [PubMed] [Google Scholar]
- 25.Lee J, et al. Withaferin A is a leptin sensitizer with strong antidiabetic properties in mice. Nat Med 22, 1023–1032 (2016). [DOI] [PMC free article] [PubMed] [Google Scholar]
- 26.O’Neill LA The interleukin-1 receptor/Toll-like receptor superfamily: 10 years of progress. Immunological reviews 226, 10–18 (2008). [DOI] [PubMed] [Google Scholar]
- 27.O’Neill LAJ & Dinarello CA The IL-1 receptor/toll-like receptor superfamily: crucial receptors for inflammation and host defense. Immunology Today 21, 206–209 (2000). [DOI] [PubMed] [Google Scholar]
- 28.Gregor MF & Hotamisligil GS Inflammatory mechanisms in obesity. Annu Rev Immunol 29, 415–445 (2011). [DOI] [PubMed] [Google Scholar]
- 29.Saltiel AR & Olefsky JM Inflammatory mechanisms linking obesity and metabolic disease. J Clin Invest 127, 1–4 (2017). [DOI] [PMC free article] [PubMed] [Google Scholar]
- 30.Villanueva EC & Myers MG Jr. Leptin receptor signaling and the regulation of mammalian physiology. Int J Obes (Lond) 32 Suppl 7, S8–12 (2008). [DOI] [PMC free article] [PubMed] [Google Scholar]
- 31.McGillicuddy FC, et al. Long-term exposure to a high-fat diet results in the development of glucose intolerance and insulin resistance in interleukin-1 receptor I-deficient mice. Am J Physiol Endocrinol Metab 305, E834–844 (2013). [DOI] [PMC free article] [PubMed] [Google Scholar]
- 32.Copps KD, et al. Irs1 serine 307 promotes insulin sensitivity in mice. Cell Metab 11, 84–92 (2010). [DOI] [PMC free article] [PubMed] [Google Scholar]
- 33.Wernstedt Asterholm I, et al. Adipocyte inflammation is essential for healthy adipose tissue expansion and remodeling. Cell Metab 20, 103–118 (2014). [DOI] [PMC free article] [PubMed] [Google Scholar]
- 34.Jiao P, et al. Constitutive activation of IKKbeta in adipose tissue prevents diet-induced obesity in mice. Endocrinology 153, 154–165 (2012). [DOI] [PubMed] [Google Scholar]
- 35.Awazawa M, et al. Adiponectin enhances insulin sensitivity by increasing hepatic IRS-2 expression via a macrophage-derived IL-6-dependent pathway. Cell Metab 13, 401–412 (2011). [DOI] [PubMed] [Google Scholar]
- 36.Sadagurski M, et al. Human IL6 enhances leptin action in mice. Diabetologia 53, 525–535 (2010). [DOI] [PMC free article] [PubMed] [Google Scholar]
Associated Data
This section collects any data citations, data availability statements, or supplementary materials included in this article.
Data Availability Statement
The raw data for mouse hypothalamic microarray is available from NCBI GEO repository with accession number: GSE124353 for DIO mice, GSE124355 for db/db mice and GSE124356 for lean mice. The source images for p-STAT3 staining can be found through figshare.com/s/0741ab007eefdf3f6605. All other data that support the findings of this study are available from the corresponding author upon reasonable request.


