

Abstract
Recent outbreaks of deadly infectious diseases, such as Ebola and Middle East respiratory syndrome coronavirus, have motivated the research for accurate, rapid diagnostics that can be administered at the point of care. Nucleic acid biomarkers for these diseases can be amplified and quantified via polymerase chain reaction (PCR). In order to solve the problems of conventional PCR—speed, uniform heating and cooling, and massive metal heating blocks—an innovative optofluidic cavity PCR method using light‐emitting diodes (LEDs) is accomplished. Using this device, 30 thermal cycles between 94 °C and 68 °C can be accomplished in 4 min for 1.3 μL (10 min for 10 μL). Simulation results show that temperature differences across the 750 μm thick cavity are less than 2 °C and 0.2 °C, respectively, at 94 °C and 68 °C. Nucleic acid concentrations as low as 10–8 ng μL–1 (2 DNA copies per μL) can be amplified with 40 PCR thermal cycles. This simple, ultrafast, precise, robust, and low‐cost optofluidic cavity PCR is favorable for advanced molecular diagnostics and precision medicine. It is especially important for the development of lightweight, point‐of‐care devices for use in both developing and developed countries.
Keywords: light‐emitting diodes, molecular diagnostics, optical cavities, point‐of‐care diagnostics, polymerase chain reaction
Novel optical cavity polymerase chain reaction (PCR) driven by a light‐emitting diode (LED) is demonstrated for fast, accurate, and reliable PCR‐based diagnostics. Using optical cavity PCR, nucleic acid amplification with the template DNA concentration has been successfully demonstrated, ranging from 10−5 to 10−8 ng μL−1 within 5–15 min with excellent repeatability and reproducibility.
1. Introduction
Recent global outbreaks of deadly diseases, such as Ebola virus disease (EVD), Middle East respiratory syndrome coronavirus (MERS‐CoV), and human infection with Avian influenza A (H7N9) virus, have motivated an urgent need for rapid and accurate diagnostics.1, 2, 3, 4, 5 Polymerase chain reaction (PCR), the “gold standard” for many medical diagnostic tests, has become an essential technique in the fields of clinical laboratories, environmental science, forensic science, and agricultural science.6, 7, 8, 9, 10 Typically, PCR, which requires multiple cycles between two or three discrete temperatures, requires an hour or more per amplification because of the large thermal mass of Peltier‐based heating blocks, as well as the slow heat transfer between the heating block and the plastic PCR tube.11 However, fast/ultrafast PCR is highly desirable for applications such as time‐sensitive diagnosis of infectious diseases, methicillin‐resistant Staphylococcus aureus (MRSA) and sepsis at the point‐of‐care (POC) level, because fast therapeutic turnaround time (TAT) decreases not only the mortality rate but also the severe risk of unknowingly transmitting the disease to others.11, 12, 13 Therefore, many industrial companies and academic groups have worked on improving PCR thermal cyclers to reduce the amplification time by increasing the heating and cooling rates.
Commercial PCR systems such as the LightCycler 2.0, which uses air heating/cooling and capillary tubes, and the xxpress PCR, which uses direct resistive heating, can perform 30 thermal cycles within 10 min.11, 14 These systems are excellent equipment in research laboratory; however, they are not suitable for POC testing due to their high power consumption (800–1000 W maximum) and heavy weight (more than 20 kg). In resource‐limited environments such as in developing countries or field laboratories, we need a portable, robust, simple, and fast PCR, which is easy to use with low power through miniaturization and integration.15, 16
In order to meet these requirements, integrated microfluidic approaches for fast/ultrafast PCR systems have been extensively studied to reduce amplification time by decreasing sample volume (i.e., thermal mass), which allows for fast heat transfer and, thus, faster thermal cycling with less power consumption.16, 17, 18, 19, 20, 21, 22, 23, 24, 25, 26 The most commonly used method for static microfluidic PCR thermal cycling is resistive heating with microfabricated thin film heaters and a resistance temperature detector (RTD).19, 20 In this design, the PCR runs in the microfluidic chamber above resistive thin film heaters. While the power consumption is relatively low in this method, it requires a complicated fabrication process to integrate the thin film heater and RTD on the same chip. Peltier heat block technology is also widely used for both static and continuous‐flow PCR due to its rapid heating and cooling rates, but this technology also requires higher power consumption.21, 22 In continuous‐flow PCR, PCR amplification occurs when the reaction samples pass through discrete temperature zones.23, 24 This method can produce faster thermal cycling than can static PCR, but it requires an external syringe pump for flow control and lacks the capability to change the number of cycles. Another approach includes infrared (IR)‐mediated noncontact selective heating of the PCR mixture for PCR thermal cycling using an IR laser or filament lamp, which harnesses water's strong IR absorbance property at wavelengths greater than 1000 nm.25, 26 However, as the volume of the PCR mixture increases from nanoliter to microliter, the total thermal cycling time also increases from ≈5 to ≈40 min.
Recently, the plasmonic photothermal heating of gold (Au) nanoparticles (AuNPs) using a pulsed or continuous‐wave laser has been widely investigated for the photothermal therapy of cancer and fast PCR.27, 28 However, this arrangement is not ideal for POC testing, because it not only requires expensive lasers but also lacks reliable AuNP‐based sample preparation. More recently, we have introduced a novel ultrafast photonic PCR method that combines a thin Au film as a plasmonic photothermal light‐to‐heat converter and light‐emitting diodes (LEDs) as a heat source.29 In comparison to AuNPs‐based fast PCR, the plasmonic photothermal heating of microfabricated Au thin film for ultrafast photonic PCR has many advantages since microfabrication technology can provide precise geometrical controls, accurate thin film thickness process, enabling novel integrated devices, and reproducible microdevices. In this method, the 120 nm thick Au film on the bottom of the reaction well generates heat due to its strong absorption of the light from a 3 W blue LED, resulting in the heating of the surrounding solution to 150 °C within 3 min, as well as the ultrafast completion of 30 thermal cycles within 5 min. While this method is promising for POC diagnostics due to its ultrafast thermal cycling ability, low power consumption, and simple configuration for system integration, we need to improve its relatively low amplification efficiency. In order to accomplish accurate and reliable PCR‐based diagnostics, we have to solve the issues of temperature gradient in the PCR mixture caused by heating only on one side and the reliable positioning of the thermocouple for temperature control.
Here, we present a novel LED‐driven optical cavity PCR for accurate, fast, and reliable POC diagnostics. By employing an optical cavity consisting of two thin Au films for evenly absorbed light, the temperature uniformity of the PCR mixture is greatly improved, showing a temperature difference of less than 2 °C at 94 °C and 0.2 °C at 68 °C. Depending on the PCR reaction volume from 1.3 to 10 μL, 30 thermal cycles from 94 °C to 68 °C can be accomplished within 4–10 min. The temperature variations during 30 thermal cycles are below 1 °C for both 94 °C and 68 °C, showing precision temperature controllability. Nucleic acids (c‐MET cDNA) at concentrations as low as 10−8 ng μL−1 (two copies per μL) were successfully amplified using the LED‐driven optical cavity PCR, with high repeatability and reproducibility. We propose that this PCR method is suitable for POC platforms because it shows excellent reliability and reproducibility and is capable of fast thermal cycling with amplification efficiency comparable to that of commercial benchtop PCR systems.
2. Results and Discussion
2.1. Optical Cavity PCR
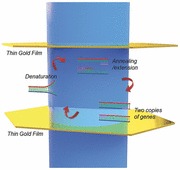
Figure 1 a shows a schematic of light absorption in the optical cavity PCR for nucleic acid amplification with PCR. The optical cavity comprises two thin Au films on the top (denoted as Au film2 in Figure 1a) and bottom (denoted as Au film1 in Figure 1a) of the PCR cavity, both of which were deposited on a poly(methyl methacrylate) (PMMA) sheet. The two Au films act as a plasmonic photothermal light‐to‐heat converter for PCR thermal cycling, as previously reported.29 When the LED is illuminated, the emitted light is reflected, absorbed, and transmitted to Au film1. Subsequently, the transmitted light is also reflected, absorbed, and transmitted to Au film2. The reflected light on Au film2 exhibits multiple reflections, absorptions, and transmissions in the optical cavity. Based on this model, the total absorption of Au film1 and film2 are given by and , where I 0 is the initial intensity of the light from the LED and A 1 (and A 2), T 1 (and T 2), and R 1 (and R 2) are the absorbance, transmittance, and reflectance of Au film1 (and film2), respectively. The thicknesses of the Au films were optimized to obtain uniform light absorption by both Au films for the greatest uniform temperature distribution as well as the greatest total light absorption . First, the average transmittance, reflectance, and absorbance of thin Au films over the emission wavelength of the LED was calculated from the measured absorption spectra of thin Au films with different thicknesses and based on the emission spectrum of the LED (Figure S1 and Table S1, Supporting Information). Then, the absorption ratio and total absorption were calculated for different combinations of top and bottom Au thicknesses, as shown in Table 1 . The combination of a 10 nm thick Au film1 and a 120 nm thick Au film2 was optimal for both the absorption ratio (1.06) and the total absorption of light (70%); hence, these values were used as the thicknesses of the thin Au films for the optical cavity PCR chamber. For the nucleic acid amplification through PCR, thermal cycling, consisting of two or three discrete temperatures for denaturation, annealing, and extension can be achieved by simply turning on and off the heat source LED (Figure 1b). Figure 1d shows a schematic of the LED‐driven optical cavity PCR. A reference chamber with a type‐K thermocouple was placed next to the optical cavity PCR chamber. The reference and cavity PCR chambers were designed to be covered by the beam waist (ø 12 mm) at the focal length to ensure that both chambers receive the same intensity of light so that photothermal heating occurs at the same rate. Both chambers were placed at the focal length of the lens (25 mm from the top surface of the lens) for the highest light absorption. The photograph for the experimental setup of the LED‐driven optical cavity PCR can be found in Figure S2 in the Supporting Information. An optical cavity PCR device can be designed with multiple cavities to allow for multiplexed PCR.
Figure 1.
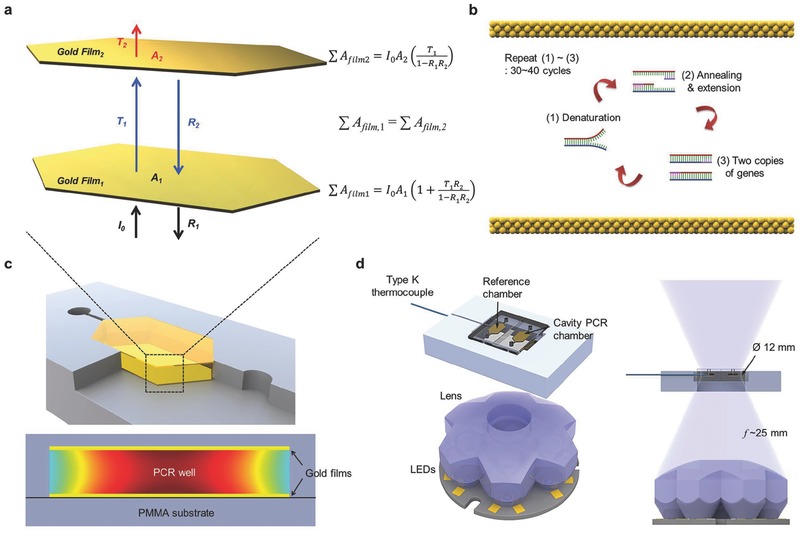
Optical Cavity PCR. a) Schematic of light absorption in the optical cavity for nucleic acid amplification through a polymerase chain reaction (PCR). When a light is illuminated with initial intensity I 0, light is then reflected (R 1), absorbed (A 1), and transmitted (T 1) at gold (Au) film1. Subsequently, the transmitted light is also reflected (R 2), absorbed (A 2), and transmitted (T 2) at Au film2. The reflected light at Au film2 exhibits multiple reflections, absorptions, and transmissions in the optical cavity. The total light absorption of each Au film can be calculated based on this model. For the uniform temperature distribution of the PCR mixture in the optical cavity, the total light absorption at Au film1 should be equal to the total light absorption at Au film2 . A 1 (and A 2), T 1 (and T 2), and R 1 (and R 2): absorbance, transmittance, and reflectance of the Au film1 (and film2), respectively. b) The absorbed light contributes to the photothermal heating of Au atoms for the thermal cycling of the PCR. Thermal cycling, consisting of two or three discrete temperatures for denaturation, annealing, and extension, can be achieved by turning on and off the LED for nucleic acid amplification through the PCR. c) Schematic of cross‐sectional image of cavity PCR chamber and temperature distribution in the PCR chamber. d) Schematic of the LED‐driven optical cavity PCR. (The photograph of the experimental setup is shown in Figure S2, Supporting Information.) A reference chamber with a type‐K thermocouple is placed next to the cavity PCR chamber. The reference and cavity PCR chambers are designed to be covered by the beam waist (ø 12 mm) at the focal length to ensure that both chambers are heated at the same rate. The chambers are placed at the focal length of the lens (25 mm) for efficient light absorption.
Table 1.
Optimization of the Au film in the optical cavity PCR chamber for uniform temperature distribution
| Ratioa)/total absorptionb) | Au film2 (nm) | |||||
|---|---|---|---|---|---|---|
| 10 | 20 | 40 | 80 | 120 | ||
| Au film1 (nm) | 10 | 2.10/0.48 | 1.64/0.56 | 1.32/0.63 | 1.06/0.69 | 1.04/0.70 |
| 20 | 4.44/0.51 | 3.36/0.56 | 2.64/0.61 | 2.14/0.65 | 2.09/0.65 | |
| 40 | 15.34/0.54 | 11.21/0.56 | 8.58/0.58 | 7.00/0.59 | 6.84/0.60 | |
| 80 | 174.78/0.62 | 126.47/0.62 | 96.13/0.62 | 78.57/0.63 | 76.77/0.63 | |
| 120 | 1970.97/0.63 | 1425.38/0.63 | 1082.92/0.63 | 885.19/0.63 | 864.94/0.63 | |
a)Ratio =;
b)Total absorption = .
2.2. Simulation for the Temperature Uniformity of Optical Cavity PCR
We performed a set of heat transfer simulations using COMSOL to theoretically characterize the temperature uniformity inside the optical cavity during PCR thermal cycling (Figure S3, Supporting Information). Figure 2 a–d shows the calculated temperature distribution inside the 750 μm thick PCR chamber for bottom‐only and cavity (top and bottom) heating at 94 °C (for denaturation) and 68 °C (for annealing/extension). It is clear that cavity heating provides a more uniform temperature distribution compared with bottom‐only heating, especially at 94 °C. The temperature gradients across the height of the chamber (along the white arrow) are plotted in Figure 2e. The cavity heating shows better temperature uniformity, with a difference of only 1.9 °C and 0.2 °C compared to the temperature difference of 14.4 °C and 0.4 °C for bottom‐only heating at 94 °C and 68 °C, respectively. The effect of the PCR chamber height on the temperature uniformity was also investigated, as shown in Figure 2f. As the height of the PCR chamber decreases, the temperature difference (∆T = T max − T min) across the height of the chamber decreases for both the bottom‐only and cavity heating configurations because heat transfer can be more effective in the smaller volume of a thinner PCR chamber. Furthermore, it is noteworthy that the cavity heating shows significantly smaller temperature differences for all chamber heights at both the denaturation and annealing/extension temperatures. Therefore, employing cavity heating allows for uniform heating of the PCR mixture for efficient and reliable nucleic acid amplification.
Figure 2.
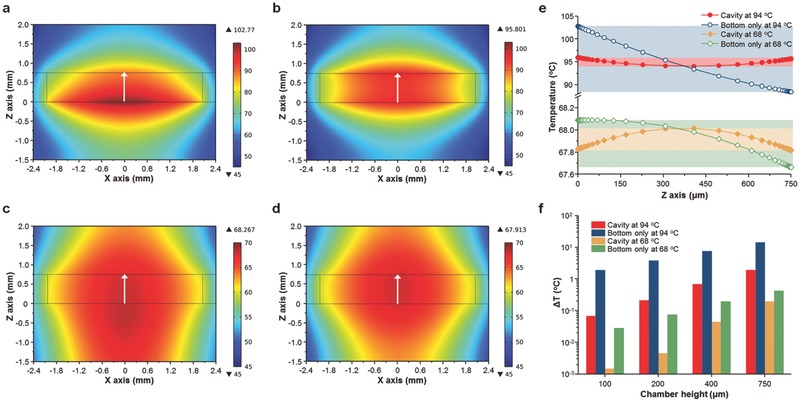
Simulation for the temperature distribution in the cavity PCR chamber. Calculated temperature distribution for a and c) bottom‐only and b and d) top and bottom (cavity) heating conditions in the PCR chamber when the temperature at the center of the chamber (0 μm on the x axis and 375 μm on the z axis) reaches 94 °C for denaturation and 68 °C for annealing/extension. The height of the chamber is 750 μm. e) The temperature profiles of the PCR chambers are shown along the white arrows in (a)–(d). The cavity heating clearly shows better temperature uniformity at both 94 °C and 68 °C. f) Temperature difference along the z axis (0 μm on the x axis) of the PCR chamber as a function of PCR chamber height. The cavity heating shows better temperature uniformity than the bottom‐only heating, with better uniformity at shorter heights.
2.3. LED‐Driven Optical Cavity PCR Thermal Cycler
Figure 3 a shows the representative temperature profile for 30 PCR thermal cycles from 94 °C to 68 °C using the LED‐driven optical cavity for different chamber heights. The total time to achieve 30 PCR cycles decreases as the cavity height decreases, attaining the minimum time (average 235.5 s) with a 100 μm thick cavity PCR chamber, which shows good linearity with an adjusted R2 value of 0.9899, as shown in Figure 3b (Figure S4, Supporting Information, for the total time in the case of bottom‐only heating). Using the thermal cycling result, heating and cooling rates were calculated as previously described.28, 29 The average rates during 30 PCR cycles and sample standard deviations were obtained, as shown in Figure 3c. The fastest heating and cooling rates of 7.50 ± 0.46 °C and 6.35 ± 0.49 °C s−1 were obtained from the 100 μm thick PCR chamber. The maximum and minimum temperatures attained during each PCR cycle varied within less than 1 °C at 94 °C and less than 0.5 °C at 68 °C, showing comparable temperature accuracy to commercially available benchtop thermal cyclers. In particular, due to the lower heat mass as well as fast heat transfer between the thin Au film and the PCR mixture through a 50 nm thick SiO2 layer, the overshoot and undershoot for the cavity PCR were very low (0.85 °C at 94 °C, 0.25 °C at 68 °C) compared to the benchtop thermal cycler (≈2 °C at 94 °C, ≈4 °C at 68 °C) when fast cycling was performed because the benchtop thermal cycler is not designed for fast thermal cycling (Figure S5, Supporting Information). To ensure that both chambers at position 1 (reference chamber) and position 2 (optical cavity PCR chamber) were heated at the same rate, a reference chamber with a type‐K thermocouple was placed at both positions and thermal cycling was performed. Figure 3e shows a comparison of the temperature profiles during thermal cycling between positions 1 and 2. From this figure, it can clearly be observed that both positions received the same intensity of light from the LED for the photothermal heating of thin Au films (Figure S6, Supporting Information).
Figure 3.
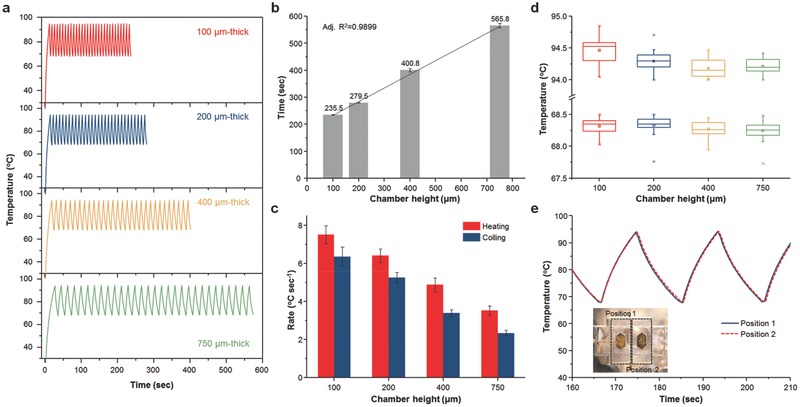
LED‐driven thermal cycling of cavity PCR. a) Representative temperature profiles of 30 optical cavity PCR thermal cycles with different chamber heights. For each height, 30 cycles from 94 °C (denaturation) to 68 °C (annealing/extension) were run. b) Time for 30 PCR thermal cycles with different chamber heights. c) Heating and cooling rates as a function of the cavity PCR chamber height. An increase in the chamber height increases the cycle time and decreases the heating/cooling rates. d) Measured temperature distribution at 94 °C (denaturation) and 68 °C (annealing/extension) during 30 thermal cycles with different chamber heights. e) Comparison of temperature profiles during thermal cycling between position 1 (reference chamber) and position 2 (cavity PCR chamber) to ensure that both chambers are heated at the same rate. The inset displays a photograph of the PCR chamber holder, showing positions 1 and 2.
2.4. Nucleic Acid Amplification Using Optical Cavity PCR
To verify our LED‐driven optical cavity PCR method, we demonstrated the amplification of nucleic acids (c‐MET cDNA, lung cancer biomarker). Figure 4 a shows an image of the 2% agarose gel from the benchtop thermal cycler (Bio‐Rad C1000 thermal cycler with CFX96 real‐time PCR detection system) and the cavity PCR (750 μm thick PCR chamber) with different cycle numbers from 95 °C to 68 °C. For the benchtop PCR, a three‐step thermal cycling protocol recommended by the manufacturer was used (Figure S7, Supporting Information). It is clear that as the cycle number is increased, the intensity of the band increases for the cavity PCR. The cavity PCR with a different chamber height (200, 400, and 750 μm thicknesses) was performed as shown in Figure 4b. For the comparison, the same volume of PCR byproducts from different chamber heights was used for gel electrophoresis as diluted to 20 μL volume due to the small PCR sample volume for the 200 μm thick cavity chamber. It is noteworthy that the gel intensity from the 200 μm thick cavity PCR chamber is low, and this may be attributed to the faster cycling time and subsequently lower amplification efficiency. By optimizing the PCR reagents, the amplification efficiency can be further improved. The total reaction times for both the benchtop and cavity PCR are summarized in Figure 4c. A reduction of 70%–85% in total reaction time can be obtained using cavity PCR, although the total reaction times for the KAPA2G Fast PCR kit are already 20%–70% shorter than for the conventional PCR assay. Figure 4d shows the 2% agarose gel image from the cavity PCR with different initial concentrations of template DNA. There is a clear trend in the change in band intensity as the concentration changes. Furthermore, 40 cycles of cavity PCR were able to amplify as low as 10−8 ng μL−1 (two copies per μL−1) within 15 min. We also successfully amplified the c‐MET cDNA prepared from nonsmall cell lung cancer cell (NSCLC, H1975) to show the utility of the optical cavity PCR method for the heterogeneous biological samples as shown in Figure 4e. In addition to its fast and sensitive nucleic acid amplification, the cavity PCR is highly repeatable and reproducible. The cavity PCR was performed in series with different concentration of template DNA as shown in Figure S8 in the Supporting Information. The success rate of the cavity PCR with different concentrations of initial template DNA is plotted in Figure 4f to show the excellent repeatability and reproducibility of the cavity PCR method. The success rate for extremely low concentrations can be further improved with a mass‐manufactured cavity PCR chamber. The cavity PCR was also successfully operated by minimally trained undergraduate students (Figure S9, Supporting Information). The demonstration of the robust LED‐driven optical cavity PCR indicates that this method is an ideal candidate for implementation into POC platforms that require fast, accurate, and reliable nucleic acid amplification.
Figure 4.
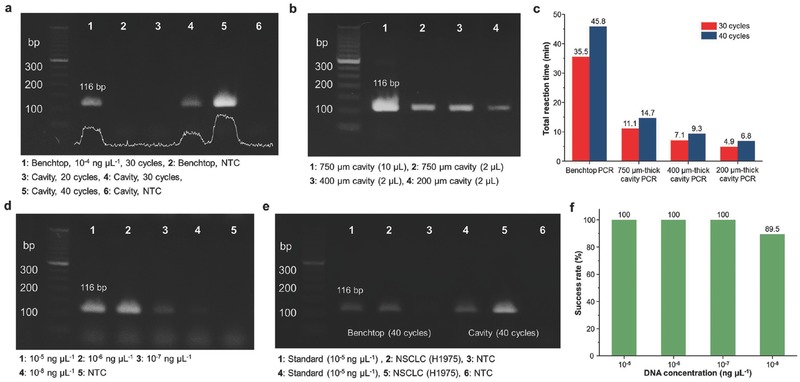
Nucleic acid amplification using cavity PCR. a) Results from 2% agarose gel demonstrating a clear trend of increased PCR byproduct with an increase in PCR cycle numbers. b) Image of 2% agarose gel with different heights of cavity PCR chamber. For the comparison, the same volume (2 μL) of PCR byproduct was used for gel electrophoresis. c) Summary of total amplification time for the benchtop and cavity PCR. The reaction time for the benchtop is based on the cycling protocol recommended by the manufacturer. A 70%–85% reduction in total reaction time can be achieved. d) Results from 2% agarose gel demonstrating a trend in band intensity with different concentrations of initial c‐MET cDNA. The lowest concentration of template DNA is 10−8 ng μL−1 (two copies per μL). e) Results from 2% agarose gel showing the amplification of c‐MET cDNA prepared from NSCLC cell for the heterogeneous biological sample. (Standard: c‐MET cDNA purchased from Sino Biological Inc.) f) Success rate (%) of the cavity PCR with different concentrations of c‐MET cDNA (n = 7 for 10−5, 10−6, 10−7 ng μL−1, n = 19 for 10−8 ng μL−1).
The optical cavity PCR used in this study was effective in not only fast PCR thermal cycling but also reliable nucleic acid amplification, yielding results comparable to the conventional benchtop PCR system. Providing the test results within 30 min is necessary to make a single visit to the POC viable.11 Our cavity PCR can meet this requirement because it can accomplish 30 PCR thermal cycles within 4–10 min and can amplify nucleic acid concentrations as low as 10−8 ng μL−1 (two copies per μL) within 15 min. By optimizing the thickness of the thin Au films of the cavity, light absorption can be uniformly absorbed at the top and bottom thin Au layers of the cavity, resulting in excellent temperature uniformity with a difference of only 1.9 °C and 0.2 °C at 94 °C and 68 °C, respectively. As a result, cavity PCR shows excellent repeatability and reproducibility due to its excellent temperature uniformity and precise temperature accuracy. In general, the faster the thermal cycling is driven, the greater the variation of the temperature across the PCR sample will be, due to thermal inertia.11 However, in the optical cavity PCR, there is not a significant difference in the temperature accuracy with different sample volumes, ranging from 1.3 to 10 μL. This could be due to not only the low thermal mass but also the fast heat transfer between the thin Au film and the PCR mixture through the ultrathin 50 nm thick SiO2 passivation layer. At present, the power consumption for heating is relatively high (≈20 W) compared to previous work (≈3 W)29 because seven LEDs on a single PCB were chosen to have a wide beam waist for heating the reference and cavity PCR chambers at the same rate. However, by using two 3 W LEDs for each reference and cavity PCR chamber, the power consumption could be further reduced (≈6 W). Our current efforts are focused on real‐time quantitative PCR (qPCR) using fluorescent detection as well as integrating multiple wells to allow for high‐throughput multiplexed amplification. Although the gel electrophoresis is considered as one of the gold standards for the analysis of PCR byproduct from conventional PCR, the result would not be completely quantitative, and additional steps are required. Therefore, the fluorescent detection for the real‐time qPCR is highly required, and we are investigating the real‐time optical cavity PCR method for quantitative analysis. For the high‐throughput multiplexed amplification, a LED array for the simultaneous heating of multiple wells can be used, but this also can increase the power consumption. To challenge the power consumption issue for multiple wells applications, optimization for the size of the cavity PCR chamber and uniform light distribution from the LED array to ensure simultaneous heating of multiple wells should be considered as our future work.
3. Conclusion
In conclusion, we demonstrated a fast and reliable optical cavity PCR method for nucleic acid amplification. The optical cavity, which comprised two thin Au films with different thicknesses, shows excellent temperature uniformity and accurate temperature controllability. We achieved fast 30 thermal cycles between 94 °C (denaturation) and 68 °C (annealing/extension) within 4–10 min for 1.3–10 μL volume. Using the optical cavity PCR method, we reliably amplified cMET cDNA with concentrations ranging from 10−5 to 10−8 ng μL−1 (two copies μL−1) in less than 5–15 min. In addition, we demonstrated the repeatability and reproducibility of our cavity PCR method. We propose that this simple and robust ultrafast cavity PCR is ideal for POC diagnostics.
4. Experimental Section
Fabrication of the Optical Cavity PCR Chamber: The 1 mm thick PMMA sheets for the top and bottom layer of the optical cavity, as well as 100, 200, 400, and 750 μm thick PMMA sheets for the cavity chamber, were cut with a VersaLASER VL‐200 laser cutting system (Universal Laser System, Inc., Scottsdale, AZ, USA). The top layer was incubated in an oven at 56 °C for 6 h to allow for annealing of the damaged regions sustained from laser cutting. The bottom and the cavity chamber layers were first bonded together using thermal bonding at 140 °F with a pressure of 0.2 metric ton after a UV/ozone treatment of the PMMA sheets for 10 min. Then, the bottom (bonded with the cavity chamber layer) and top layers were cleaned with 70% ethanol twice for 10 min, rinsed with deionized (DI) water, and dried using N2. Thin Au films with different thicknesses (10, 20, 40, 80, and 120 nm) were deposited on the bottom and top PMMA sheets by electron beam (E‐beam) evaporation under a base pressure of 2 × 10⁻⁷ Torr. A 50 nm thick SiO2 passivation layer was deposited over the thin Au films by RF sputtering to prevent the inhibition of the PCR reaction by the thin Au film. Finally, the bottom (bonded with the cavity chamber layer) and top layers were bonded together to form the optical cavity PCR chamber using thermal bonding at 140 °F with a pressure of 0.2 metric ton after a UV/ozone treatment of the PMMA sheets for 10 min.
Simulation: COMSOL Multiphysics software (Ver. 4.3) for the 2D axial symmetric heat transfer simulation was used. Details of the geometric and material properties for the simulation are shown in Figure S3 and Table S2 in the Supporting Information. The thin Au films were placed on both the top and bottom PMMA sheets. For the bottom‐only heating, only the bottom Au layer was the heat source (input power = 0.340 W), whereas for the cavity heating, both the top (input power = 0.185 W) and bottom Au (input power = 0.192 W) layers were the heat sources. The temperature was monitored at the middle of the chamber (red dot) to represent where the type‐K thermocouple would be placed in the reference chamber for the temperature control. The simulation results corresponded well with the experimental results, as shown in Figure S10 in the Supporting Information. The different chamber heights (100, 200, 400, and 750 μm) were applied to the simulation to calculate the temperature distribution inside the PCR chamber at the denaturation and annealing temperatures of 94 °C and 68 °C, respectively.
LED‐Driven Optical Cavity PCR Thermal Cycles: LEDs (Luxeon Rebel royal blue, seven LEDs mounted on a 40 mm round coolbase, peak wavelength of 447.5 nm, 6230 mW at 700 mA injection current, part number SR‐02‐R0800) were used for photothermal heating of the thin Au films in the optical cavity, using a Keithley 2400 source meter. To focus the light from the LEDs, a lens (Polymer Optics 7 Cell Cluster Concentrator Optic array, part number 263) was employed. The temperature of the solution was monitored and recorded in real time by a type‐K insulated thermocouple purchased from OMEGA Engineering (part number 5SC‐TT‐K‐40‐36) for thermal cycling. Temperature cycling using an LED, 80 mm cooling fan, source meter, and thermocouple was controlled through the LabVIEW program. A National Instruments (NI) 9213 16‐channel thermocouple module with high‐speed mode, auto zero, and cold junction compensation (CJC) was used for accurate temperature acquisition from the type‐K thermocouple.
Preparation of the PCR Reagent and DNA Template: Human HGFR, or c‐MET cDNA, was used as a template for the PCR. The c‐MET DNA was purchased from Sino Biological Inc. KAPA2G Fast DNA polymerase (5 U μL−1), 5× KAPA2G Buffer A (1.5 × 10⁻³ m MgCl2 at 1×) and dNTP Mixture (10 × 10−3 m each) were purchased from KAPA Biosystems. Forward primer (5′‐GGACTGCAGCAGCAAAGCCAATTT‐3′) and reverse primer (5′‐TGTTGACGCTGCCACAGCTAATGA‐3′) for a 116 base pair (bp) c‐MET amplicon were purchased from Integrated DNA technologies. For the conventional benchtop PCR with recommended concentrations, the PCR reaction consisted of 0.08 μL KAPA2G DNA polymerase, 4 μL 5× KAPA2G buffer A, 0.4 μL dNTP mixture, 1 μL each forward and reverse c‐MET primers (stock solution 10 × 10−6 m), 6.7 μL bovine serum albumin (BSA) (3% w/v stock solution for a final concentration of 10 μg μL−1 BSA) and 2 μL template cDNA. Water was added to bring the final volume to 20 μL. To increase the amplification efficiency in the fast cycling cavity PCR, high concentrations of polymerase and primers were used, as previously reported.30, 31 The PCR reaction for the cavity PCR consisted of 0.4 μL KAPA2G DNA polymerase, 2 μL of 5× KAPA2G buffer A, 0.2 μL dNTP mixture, 1 μL each forward and reverse c‐MET primers (stock solution 100 × 10−6 m), 3.3 μL of BSA (3% w/v stock solution for a final concentration of 10 μg μL−1 BSA) and 1 μL of template DNA. Again, water was added until the reaction was brought to a final volume of 10 μL. The concentration of c‐MET cDNA also varied and was brought to as low as 10−8 ng μL−1 (two copies per μL). A Bio‐Rad C1000 thermal cycler with CFX96 real‐time PCR detection system was used for the reference PCR system. PCR was performed at a volume of 20 μL for the benchtop and 2.5, 5, and 10 μL for the cavity PCR with different chamber thicknesses. The PCR mixture was loaded into the optical cavity PCR chamber using a pipette until the inlet on the other side of the chamber had filled with fluid, ensuring that no air bubbles would be formed during thermal cycling. The two inlets were sealed with PCR sealing tape to ensure that no bubble formed or to prevent the loss of fluid. The cavity PCR chamber was placed in line with the reference chamber with the 120 nm thick Au film on top, because this is the optimal configuration for uniform light absorption and the maximum total absorption of the thin Au films. After amplification, a mixture of 10 μL of PCR byproduct (collected from the cavity PCR chamber using a pipette) and 10 μL of E‐Gel sample loading buffer (Invitrogen) were loaded onto E‐Gel 2% agarose gels with SYBR Safe DNA gel stain (Invitrogen) and run in an E‐Gel iBase Power System (Invitrogen). A gel image was taken with an E‐Gel Safe Imager Transilluminator. A 50bp DNA ladder was used to confirm the size of the product. For the preparation of heterogeneous biological sample, RNeasy Plus Mini Kit (Qiagen, Redwood City, CA) was used to extract total RNA from NSCLC, H1975. Briefly, the cells were lysed in the 350 μL RLT Plus Buffer containing 7 μL of 2 m dithiothreitol (DTT) by pipetting vigorously for 1 min. The homogenized lysate was transferred into the gDNA eliminator spin column and centrifuged at 14 000 rpm for 30 s. The RNA in the aqueous phase was mixed with 350 μL of 70% ethanol and transferred into an RNeasy Mini spin column. The precipitated RNA was captured in the column by centrifugation at 14 000 rpm for 30 s and washed with 700 μL of RW1 Buffer, followed by washing twice with 500 μL of RPE Buffer. To elute the purified total RNA captured in the membrane of column, 42 μL of RNase‐free water was added directly to the spin column membrane and collected in a clean tube by centrifugation at 14 000 rpm for 1 min. Afterward, the extracted total RNA was reverse transcribed with iScript reverse transcription supermix for RT–qPCR (Bio‐Rad, Hercules, CA) according to the manufacturer's protocol, and stored at −80 °C. The concentration of c‐MET cDNA from NSCLC cell was measured around 10−3 ng μL−1 by comparing threshold cycle (C t) value obtained via qPCR. For PCR amplification, the sample was diluted ten times and used instead of c‐MET cDNA purchased from Sino Biological Inc. In addition to c‐MET cDNA, λ‐DNA was also used as a template for PCR for initial cavity PCR optimization. The λ‐DNA and Takara Z‐Taq DNA polymerase (2.5 U μL−1), 10× Z‐Taq Buffer (Mg2+ plus, 30 × 10−3 m) and dNTP Mixture (2.5 × 10⁻³ m each) were purchased from Takara Bio Company. Forward primer (5′‐TGAAGTCTGCCCGTGTCGGTTATT‐3′) and reverse primer (5'‐ACCATCCGTCGGCAACCAGATAA‐3′) were purchased from Integrated DNA Technologies. The PCR reaction to amplify a 104 bp λ‐DNA target with Z‐Taq DNA polymerase included 0.5 μL Z‐Taq DNA polymerase, 5 μL of 10× Z‐Taq Buffer, 4 μL of dNTP mixture, 4.5 μL of 10 × 10−6 m primers (each), and 10 μL of BSA (50 μg), brought to 50 μL with PCR‐grade water. The final concentration of the template λ‐DNA varied from 0.01 to 10 ng μL−1.
Supporting information
As a service to our authors and readers, this journal provides supporting information supplied by the authors. Such materials are peer reviewed and may be re‐organized for online delivery, but are not copy‐edited or typeset. Technical support issues arising from supporting information (other than missing files) should be addressed to the authors.
Supplementary
Acknowledgements
This work was supported in part by a grant from the PCARI‐IHITM (Grant No. 131) and in part by the Global Research Lab Program (2013‐050616) and in part by the Air Force Office of Scientific Research Grants AFOSR FA2386‐13‐1‐4120. We thank Byungrae Cho for help with heat transfer simulation and Charley Y. Cui for help with fabrication of the optical cavity PCR chamber.
References
- 1., Ebola Situation Report, World Health Organization, Geneva, Switzerland: 2015. [Google Scholar]
- 2. Broadhurst M. J., Kelly J. D., Miller A., Semper A., Bailey D., Groppelli E., Simpson A., Brooks F. T., Hula S., Nyoni W., Sankoh A. B., Kanu S., Jalloh A., Ton Q., Sarchet N., George P., Perkins M. D., Wonderly B., Murray M., Pollock N. R., Lancet 2015, 386, 867. [DOI] [PubMed] [Google Scholar]
- 3. Jiang L., Wang N., Zuo T., Shi X., Poon K. V., Wu Y., Gao F., Li D., Wang R., Guo J., Fu L., Yuen K., Zheng B., Wang X., Zhang L., Sci. Transl. Med. 2014, 6, 234ra59. [DOI] [PubMed] [Google Scholar]
- 4. Corman V. M., Ölschläger S., Wendtner C., Drexler J. F., Hess M., Drosten C., J Clin Virol. 2014, 60, 168. [DOI] [PMC free article] [PubMed] [Google Scholar]
- 5. Lam T. T., Zhou B., Wang J., Chai Y., Shen Y., Chen X., Ma C., Hong W., Chen Y., Zhang Y., Duan L., Chen P., Jiang J., Zhang Y., Li L., Poon L. L. M., Webby R. J., Smith D. K., Leung G. M., Peiris J. S. M., Holmes E. C., Guan Y., Zhu H., Nature 2015, 522, 102. [DOI] [PubMed] [Google Scholar]
- 6. Marston H. D., Folkers G. K., Morens D. M., Fauci A. S., Sci. Transl. Med. 2014, 6, 253ps10. [DOI] [PubMed] [Google Scholar]
- 7. Muldrew K. L., Curr. Opin. Pediatr. 2009, 21, 102. [DOI] [PubMed] [Google Scholar]
- 8. Smith C. J., Osborn A. M., FEMS Microbiol. Ecol. 2009, 67, 6. [DOI] [PubMed] [Google Scholar]
- 9., DNA Technology in Forensic Science, The National Academies Press, Washington, DC: 1992. [PubMed] [Google Scholar]
- 10. Postollec F., Falentin H., Pavan S., Combrisson J., Sohier D., Food Microbiol. 2011, 28, 848. [DOI] [PubMed] [Google Scholar]
- 11. Burroughs N., Karteris E., PCR Technology: Current Innovations, 3rd ed., CRC Press, Boca Raton, USA: 2013, p. 143. [Google Scholar]
- 12. Lee E. J., Shin S. D., Song K. J., Kim S. C., Cho J. S., Lee S. C., Park J. O., Cha W. C., Am. J. Emer. Med. 2011, 29, 489. [DOI] [PubMed] [Google Scholar]
- 13. Liesenfeld O., Lehman L., Hunfeld K.‐P., Kost G., Eur. J. Microbiol. Immunol. 2014, 4, 1. [DOI] [PMC free article] [PubMed] [Google Scholar]
- 14. Lyon E., Wittwer C. T., J. Mol. Diagn. 2009, 11, 93. [DOI] [PMC free article] [PubMed] [Google Scholar]
- 15. Yager P., Edwards T., Fu E., Helton K., Nelson K., Tam M. R., Weigl B. H., Nature 2006, 442, 412. [DOI] [PubMed] [Google Scholar]
- 16. Zhang C., Xing D., Nucleic Acids Res. 2007, 35, 4223. [DOI] [PMC free article] [PubMed] [Google Scholar]
- 17. Zhang Y., Ozdemir P., Anal. Chim. Acta 2009, 638, 115. [DOI] [PubMed] [Google Scholar]
- 18. Park S., Zhang Y., Lin S., Wang T.‐H., Yang S., Biotechnol. Adv. 2011, 29, 830. [DOI] [PMC free article] [PubMed] [Google Scholar]
- 19. Liu P., Li X., Greenspoon S. A., Scherer J. R., Mathies R. A., Lab Chip 2011, 11, 1041. [DOI] [PubMed] [Google Scholar]
- 20. Wang F., Burns M. A., Biomed. Microdevices 2010, 12, 533. [DOI] [PMC free article] [PubMed] [Google Scholar]
- 21. Khandurina J., McKnight T. E., Jacobson S. C., Waters L. C., Foote R. S., Ramsey J. M., Anal. Chem. 2000, 72, 2995. [DOI] [PubMed] [Google Scholar]
- 22. Wang J., Chen Z., Corstjens P. L. A. M., Mauk M. G., Bau H. H., Lab Chip 2006, 6, 46. [DOI] [PubMed] [Google Scholar]
- 23. Kopp M. U., de Mello A. J., Manz A., Science 1998, 280, 1046. [DOI] [PubMed] [Google Scholar]
- 24. Crews N., Wittwer C. T., Gale B., Biomed. Microdevices 2008, 10, 187. [DOI] [PubMed] [Google Scholar]
- 25. Lounsbury J. A., Karlsson A., Miranian D. C., Cronk S. M., Nelson D. A., Li J., Haverstick D. M., Kinnon P., Saul D. J., Landers J. P., Lab Chip 2013, 13, 1384. [DOI] [PubMed] [Google Scholar]
- 26. Terazono H., Hattori A., Takei H., Takeda K., Yasuda K., Jpn. J. Appl. Phys. 2008, 47, 5212. [Google Scholar]
- 27. Kennedy L. C., Bickford L. R., Lewinski N. A., Coughlin A. J., Hu Y., Day E. S., West J. L., Drezek R. A., Small 2011, 7, 169. [DOI] [PubMed] [Google Scholar]
- 28. Roche P. J. R., Beitel L. K., Khan R., Lumbroso R., Najih M., Cheung M. C.‐K., Thiemann J., Veerasubramanian V., Trifiro M., Chodavarapu V. P., Kirk A. G., Analyst 2012, 137, 4475. [DOI] [PubMed] [Google Scholar]
- 29. Son J. H., Cho B., Hong S., Lee S. H., Hoxha O., Haack A. J., Lee L. P., Light: Sci. Appl. 2015, 4, e280. [Google Scholar]
- 30. Farrar J. S., Wittwer C. T., Clin. Chem. 2015, 61, 145. [DOI] [PubMed] [Google Scholar]
- 31. Montgomery J. L., Wittwer C. T., Clin. Chem. 2014, 60, 334. [DOI] [PubMed] [Google Scholar]
Associated Data
This section collects any data citations, data availability statements, or supplementary materials included in this article.
Supplementary Materials
As a service to our authors and readers, this journal provides supporting information supplied by the authors. Such materials are peer reviewed and may be re‐organized for online delivery, but are not copy‐edited or typeset. Technical support issues arising from supporting information (other than missing files) should be addressed to the authors.
Supplementary