

Abstract
Background
The relationships between tonsillar immune responses, and viral infection and allergy are incompletely known.
Objective
To study intratonsillar/nasopharyngeal virus detections and in vivo expressions of T‐cell‐ and innate immune response‐specific cytokines, transcription factors, and type I/II/III interferons in human tonsils.
Methods
Palatine tonsil samples were obtained from 143 elective tonsillectomy patients. Adenovirus, bocavirus‐1, coronavirus, enteroviruses, influenza virus, metapneumovirus, parainfluenza virus, rhinovirus, and respiratory syncytial virus were detected using PCR. The mRNA expression levels of IFN‐α, IFN‐β, IFN‐γ, IL‐10, IL‐13, IL‐17, IL‐28, IL‐29, IL‐37, TGF‐β, FOXP3, GATA3, RORC2, and Tbet were directly analyzed by quantitative RT‐PCR.
Results
Fifty percentage of subjects reported allergy, 59% had ≥1 nasopharyngeal viruses, and 24% had ≥1 intratonsillar viruses. Tonsillar virus detection showed a strong negative association with age; especially rhinovirus or parainfluenza virus detection showed positive association with IFN‐γ and Tbet expressions. IL‐37 expression was positively associated with atopic dermatitis, whereas IFN‐α, IL‐13, IL‐28, and Tbet expressions were negatively associated with allergic diseases. Network analyses demonstrated strongly polarized clusters of immune regulatory (IL‐10, IL‐17, TGF‐β, FOXP3, GATA3, RORC2, Tbet) and antiviral (IFN‐α, IFN‐β, IL‐28, IL‐29) genes. These two clusters became more distinctive in the presence of viral infection or allergy. A negative correlation between antiviral cytokines and IL‐10, IL‐17, IL‐37, FOXP3, and RORC2 was observed only in the presence of viruses, and interestingly, IL‐13 strongly correlated with antiviral cytokines.
Conclusions
Tonsillar cytokine expression is closely related to existing viral infections, age, and allergic illnesses and shows distinct clusters between antiviral and immune regulatory genes.
Keywords: Allergy, cytokine, T cell, tonsil, virus
Abbreviations
- AdV
adenovirus
- BoV
bocavirus‐1
- CT
cycle threshold
- CV
coronavirus
- EF1‐α
elongation factor‐1α
- EV
enteroviruses
- FOXP3
forkhead box protein 3
- Flu
influenza A or B virus
- IFN
interferon
- IL
interleukin
- MPV
metapneumovirus
- PBMC
peripheral blood mononuclear cells
- PCR
polymerase chain reaction
- PIV
parainfluenza virus types 1–4
- RORC2
retinoic acid receptor‐related orphan receptor C2
- RSV
respiratory syncytial virus
- RV
rhinovirus
- suppl.
supplementary
- Th
T helper cell
- TGF‐β
transforming growth factor‐β
Exacerbations of childhood asthma, adult asthma, and chronic obstructive pulmonary disease have been linked to positive virus detections in 95%, 78%, and 64% of the cases, respectively 1, 2, 3. Susceptibility to certain viral infections and defects in viral clearance could play a role in pulmonary inflammatory processes. Pediatric studies have shown a strong link between susceptibility to rhinovirus‐associated wheezing and the development of asthma 4, 5. In addition, respiratory syncytial virus (RSV)‐induced bronchiolitis has been linked to asthma and atopy development 6, 7. Studies in adults have shown an association between persistent/latent adenovirus infections and chronic lung diseases 8. Moreover, the persistence of respiratory viruses, virus load, and virus coinfections have been related to more severe respiratory illnesses 3, 9.
The susceptibility to rhinovirus infections has been associated with low interferon (IFN)‐α/‐β/‐γ/‐λ and interleukin (IL)‐10 responses and increased T helper cell (Th) 2‐type (IL‐4, IL‐5, IL‐13) cytokine responses in peripheral blood mononuclear cells (PBMC) 10, 11. Similarly, low IFN‐γ response, increased IL‐4/IFN‐γ ratio in PBMC, and low FOXP3+ natural regulatory T‐cell numbers in the circulation have been suggested as risk factors for RSV‐induced bronchiolitis 12, 13. Factors linked to the persistence of adenovirus infection are not well known 8. It is generally accepted that low or deficient innate and adaptive immune responses may contribute to the morbidity and mortality of viral infections.
Tonsils represent the primary nasopharyngeal lymphoid tissue and constitute the first contact point of the immune system to food and aeroallergens and infectious agents. A peripheral T‐cell repertoire exists in tonsils, and tonsils have an active role in inducing and maintaining peripheral tolerance to allergens 14, 15. Peripheral T‐cell tolerance to allergens mediated by regulatory T (Treg) cells is an essential mechanism in allergen tolerance developed by allergen‐specific immunotherapy or natural high‐dose allergen exposure 16, 17. Considering tonsils as organs that have a role in immune tolerance induction, intensive research has been needed on the associations between the features of cytokine response and viral infections to better understand the link between respiratory viral infections and chronic respiratory diseases. Therefore, we studied the associations between tonsillar cytokine and T‐cell subset‐related transcription factor expressions and respiratory viral infections. We investigated the in vivo intratonsillar mRNA expressions of Th1 (IFN‐γ, Tbet), Th2 (IL‐13, GATA3), Th17 (IL‐17, RORC2), and Treg type (IL‐10, TGF‐β, FOXP3) and type I/III interferons (IFN‐α, IFN‐β, IL‐28, IL‐29) and the recently discovered IL‐1 family cytokine IL‐37 in connection with intratonsillar virus expressions in elective tonsillectomy patients.
Methods
Patients
Human tonsil samples were obtained from consecutive routine tonsillectomy patients of all ages with or without reported allergy from Satakunta Central Hospital, Pori, Finland. The inclusion criteria were elective tonsillectomy according to clinical indication and written informed consent from the study subject or his/her parents. The study protocol was approved by the Ethics Committee of Satakunta Central Hospital, Pori, Finland.
Sample collection
A standard questionnaire was used to obtain information on allergic diseases and respiratory symptoms within 30 days before the operation (Table S1). Tonsillectomy was performed according to routine clinical procedure, and tonsils were stored in RNAlater RNA stabilization reagent (Qiagen, Hilden, Germany) 14. During anesthesia, nasopharyngeal aspirate was also obtained using a standardized procedure and stored at −80°C 18. More details are shown in Supplementary methods.
Analysis of viruses and cytokines
Viral diagnostics of naive nasopharyngeal aspirates and intratonsilar samples were performed according to clinical routine using PCRs for adenovirus, bocavirus‐1, coronaviruses (229E, OC43, NL63, and HKU1), enteroviruses, influenza A and B viruses, metapneumovirus, parainfluenza virus types 1‐4, respiratory syncytial virus and rhinovirus for all samples, and polyomaviruses KI and WU for 47 samples 3, 18. Gene expressions of IFN‐α, IFN‐β, IFN‐γ, IL‐10, IL‐13, IL‐17, IL‐28, IL‐29, IL‐37, TGF‐β, FOXP3, GATA3, RORC2, and Tbet were analyzed by quantitative real‐time PCR (Applied Biosystems, Foster City, CA, USA) 14. For more details, see Suppl. methods and Table S2.
Statistical analysis
In addition to conventional statistics, linear and logistic regressions were used to analyze the associations between virus detection, age, and atopic characteristics (version 8.0.2, SAS Institute Inc. Cary, NC, USA). Agreement statistics between intratonsillar and nasopharyngeal virus diagnostics were calculated with kappa coefficients. In heatmaps, partial Spearman correlations between gene expressions were computed over different disease groups, controlling for age. The differences between gene‐to‐gene correlations according to disease groups were analyzed using the procedure developed by Fisher 19. The statistically significant correlations are also displayed in network representations (Cytoscape software, http://www.cytoscape.org) 20. Statistical significance was established at the level of P < 0.05. More details are in Suppl. methods.
Results
Patient characteristics
Tonsil and nasopharyngeal aspirate samples were obtained from 143 routine tonsillectomy patients. Patient characteristics are shown in Table 1. Briefly, the median age of the study subjects was 16 years and 49.6% reported allergy. All operations were carried out during the ‘cold phase’ of chronic tonsil condition. Main indications for tonsillectomy were hypertrophic tonsils and/or recurrent tonsillitis (Table 1). The median for the last day of respiratory symptoms was 20 days before the operation, excluding sore throat in 40 subjects due to operation indication. Medication data are shown in Suppl. results.
Table 1.
Patient characteristics
| Factor | n = 143 |
|---|---|
| Age (years)a | 16 (8, 25) |
| Male | 74 (52%) |
| Indication for tonsillectomy | |
| Hypertrophic tonsils | 48 (34%) |
| Recurrent tonsillitis | 43 (30%) |
| Other indicationb | 6 (4%) |
| Mixed indications of these | 46 (32%) |
| Tonsillectomy and adenotomy | 39 (27%) |
| Self‐reported allergy | 63/127 (50%) |
| Food | 14/109 (13%) |
| Drug | 12/109 (11%) |
| Seasonal, i.e., pollen | 10/109 (9%) |
| Perennial, i.e., animal or house dust mite | 5/109 (5%) |
| Other | 5/109 (5%) |
| Physician‐diagnosed atopic dermatitis | 19/132 (14%) |
| Self‐reported allergic rhinitis | 36/131 (27%) |
| Physician‐diagnosed asthma | 18/129 (14%) |
| Active smoking | 24/127 (19%) |
| Respiratory symptoms at the operation dayc | 24/126 (19%) |
| Last day of respiratory symptoms, days agod | 20 (6, 31) |
| Respiratory symptoms within 2 week | 50/126 (40%) |
| Respiratory symptoms within 4 weeks | 69/126 (55%) |
Values are shown as medians (interquartile range) or n (%).
Range 2, 65 years.
Chronic white patches in tonsils (n = 2), recurrent fever (n = 1), throat abscess (n = 1), teeth braces (n = 1), and food remnants in tonsils (n = 1).
Seven subjects had cough, 4 had rhinitis, 3 had temperature >38°C, and ≤1 had other symptoms. Forty subjects had sore throat, but it was excluded from the count due to operation indication.
If >30 days, 31 days was used in the calculation. Sore throat was excluded from the calculation.
Viruses detected in tonsils and nasopharyngeal aspirates
Fifty‐nine percent of the nasopharyngeal aspirates were positive for ≥1 viruses and 20% for ≥2 viruses (Fig. 1A, Table S3). Rhinovirus (48%) was the most prevalent virus followed by bocavirus‐1 (13%), adenovirus (10%), enteroviruses (8%), coronavirus (6%), and other viruses (<5% each). Twenty‐four percentage of the tonsillar samples were positive for ≥1 viruses and 8% for ≥2 viruses. Bocavirus‐1, adenovirus, and enteroviruses were found 8% each, followed by parainfluenza virus (5%) and other viruses (<5% each).
Figure 1.
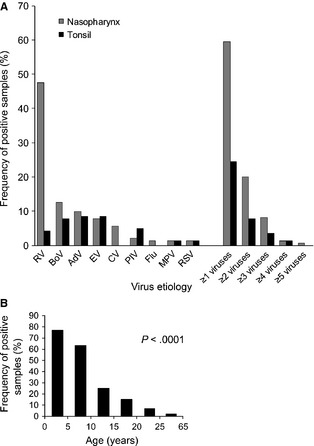
Detected viruses in nasopharyngeal and intratonsillar samples (A) and age‐dependent decrease in intratonsillar virus detections (B). RV, rhinovirus; EV, enteroviruses; AdV adenovirus; CV, coronavirus; BoV, bocavirus‐1; Flu, influenza A or B virus; PIV, parainfluenza virus types 1–4; MPV, metapneumovirus; RSV, respiratory syncytial virus.
Both nasopharyngeal and intratonsillar virus detection rates decreased by age (both P < 0.0001). Nasopharyngeal samples were clear of viruses by the age 40 and tonsillar samples by the age 25, excluding one case (Fig. 1B). In nasopharyngeal samples, rhinovirus, bocavirus‐1, adenovirus, and more than one virus detection rates decreased by age (all P < 0.001). In tonsillar samples, bocavirus‐1, enterovirus, adenovirus, parainfluenza virus, and virus co‐detection rates decreased by age (all P < 0.05). Enterovirus, but not any other virus, detection showed agreement between nasopharyngeal and intratonsillar samples (kappa coefficient 0.48, 95% confidence interval 0.22, 0.74; Table S4).
Cytokine and transcription factor expression profiles in tonsils
The intratonsillar mRNA expression levels of the analyzed cytokines and transcription factors are listed in Table S5. Increasing age showed a significant negative correlation with IL‐10, IL‐17, IL‐37, and Tbet mRNA expressions in tonsils (all P < 0.01, Fig. 2), but did not show any correlation with the other investigated cytokines and transcription factors (Fig. S1). When allergic diseases were considered, atopic dermatitis was associated with higher IL‐37 expression in tonsils, and this association remained significant after adjustment for age (P = 0.018, Fig. 3A). The inverse correlation between IL‐37 and age was seen in patients without atopic dermatitis (r = −0.38, P < 0.0001), but not in those with atopic dermatitis (P > 0.7). Cytokine and transcription factor data and their associations with clinical factors are shown in Tables S6 and S7. In brief, allergy was associated with lower Tbet expression and lower Tbet/GATA3 ratio, which both remained significant after adjustment for age (both P < 0.01). Allergic rhinitis was associated with lower IL‐13 and IL‐28 expressions, and asthma was associated with lower IFN‐α and IL‐28 expressions (all P < 0.05, adjusted for age). In addition, respiratory symptoms within the last 2 weeks before tonsillectomy correlated negatively with FOXP3 expression (mean difference −0.42, 95% confidence interval −0.78, −0.047, P = 0.027).
Figure 2.
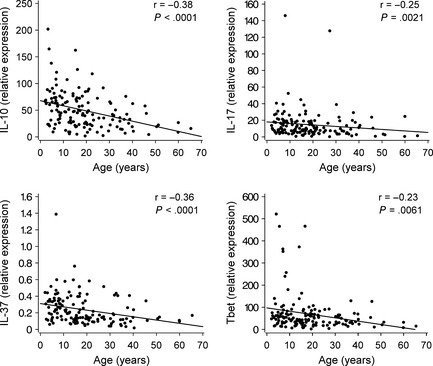
Correlations between IL‐10, IL‐17, IL‐37, and Tbet expressions and age. Spearman correlations are shown. Regression lines have been added for better visulization.
Figure 3.
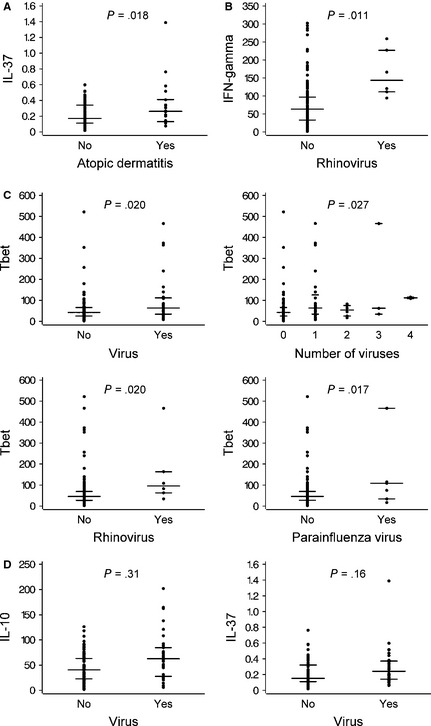
Intratonsillar gene expression according to atopic dermatitis and intratonsillar virus status. IL‐37 expression vs atopic dermatitis (A). IFN‐γ expression vs rhinovirus detection (B). Tbet expression according to virus characteristics (C). IL‐10 and IL‐37 expressions vs virus detection (D). Medians and interquartile ranges are shown. Log‐transformed values were used. Adjusted P‐values are shown.
Rhinovirus detection was independently associated with higher IFN‐γ in tonsils (P = 0.011, Fig. 3B). Intratonsillar virus detection overall, number of detected viruses, rhinovirus detection, and parainfluenza virus detection were independently associated with high Tbet expression (P < 0.05 for all, adjusted for age and allergy, Fig. 3C). The significant univariable associations between intratonsillar virus detection and IL‐10 or IL‐37 expressions did not remain significant in multivariable models, while age and/or atopic dermatitis remained significant as adjustments (Fig. 3D). RORC2 expression was independently and negatively associated with nasopharyngeal and/or tonsillar virus detection (P < 0.05). The association between cytokine and transcription factor data and virology are fully detailed in Tables S8 and S9 and Fig. S2A and B.
Distinct expression profiles of cytokines and transcription factors in tonsils
This study enabled us to investigate the correlations between the expressions of cytokines and transcription factors, because all of them were directly analyzed in the tonsils without any further cell culture, representing the in vivo situation. IL‐37 expression most closely and positively correlated with IL‐10, IL‐17, FOXP3, GATA3, RORC2, and Tbet expressions (all P < 0.01, Fig. 4). In contrast, a negative correlation of IL‐37 was observed with IFN‐α, IFN‐β, and IFN‐γ when all of the tonsils were considered (all, P < 0.05).
Figure 4.
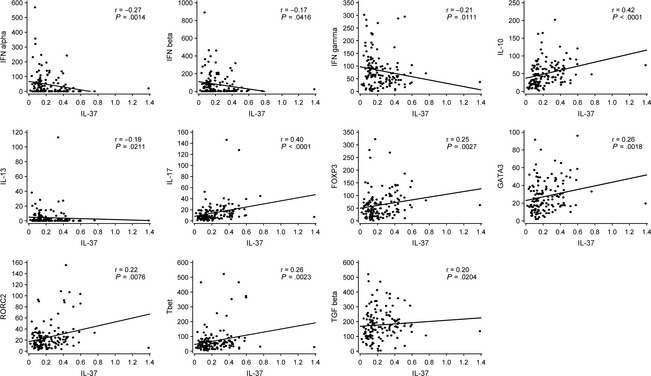
Significant correlations between the intratonsillar expressions of IL‐37 and other investigated genes, IFN‐α, IFN‐β, IFN‐γ, IL‐10, IL‐13, IL‐17, FOXP3, GATA3, RORC2, Tbet, and TGF‐β. Spearman correlations are shown. Regression lines have been added for better visulization.
Age‐adjusted gene‐to‐gene correlations are illustrated in heatmaps in Fig 5. Overall, two clusters, which showed high positive intracluster correlations, were observed as ‘antiviral’ cluster (IFN‐α, IFN‐β, IFN‐γ, IL‐28, IL‐29) and ‘immune activation/regulatory’ cluster (IL‐10, IL‐17, IL‐37, TGF‐β, FOXP3, GATA3, RORC2, Tbet) (see overall age‐adjusted data in Fig. S3). These two clusters showed strong negative correlations between each other excluding IFN‐γ, which appeared as an intermediary link between antiviral immune response and general immune response. Interestingly, correlations between IFN‐γ and other antiviral genes were less prominent in the presence of a virus. The four key Th cell lineage‐specific transcription factors, namely FOXP3, GATA3, RORC2, and Tbet, showed very strong positive correlations with each other. The immune regulatory and Treg cell‐related factors IL‐10, IL‐37, TGF‐β, and FOXP3 also closely and positively correlated with each other.
Figure 5.

Age‐adjusted heatmaps of intratonsillar gene‐to‐gene correlations and their differences according to intratonsillar and/or nasopharyngeal virus infection (A) and reported allergy status (B). The red–blue scale indicates the strength and direction of the correlations, and the gray scale indicates the P‐value of the differences between correlations. P‐values < 0.001, 0.01, and 0.05 are indicated with ***, **, and *, respectively.
The presence of a tonsillar and/or nasopharyngeal viral infection induced a very strong negative correlation between the antiviral cluster cytokines and the regulatory cluster, which mostly disappeared in the absence of a virus (Fig. 5A). The negative correlation of FOXP3, IL‐10, and particularly IL‐17 with antiviral cluster was most prominent only in the presence of a virus, which disappeared in the absence of a virus. Interestingly, as a Th2 cytokine, IL‐13 consistently appeared in the antiviral cluster showing strong positive correlations with antiviral cytokines. IL‐13 showed a more pronounced negative correlation with the regulatory cluster in the presence of a tonsillar virus or allergy. The positive correlation between IFN‐γ and other antiviral cytokines significantly decreased in the presence of a virus.
The existence of allergy also modestly deepened the negative relationship between the immune regulatory and antiviral clusters when compared to individuals without allergy (Fig. 5B).
Interestingly, allergy was associated with strong positive correlation between TGF‐β and Tbet, whereas the positive correlation between IL‐10 and IL‐17 in nonallergic patients disappeared in the presence of allergy. Gene‐to‐gene correlations are shown in more detail in Tables S10 and S11.
Gene network graphs in Fig. 6 illustrate the antiviral and regulatory clusters in disease states of virus infection and allergy and their negative interrelations, excluding the only positive connection through IFN‐γ (P‐values are shown in Fig. 5). Overall, the distinction between the two clusters significantly increased in the presence of a tonsillar virus or clinical allergy.
Figure 6.
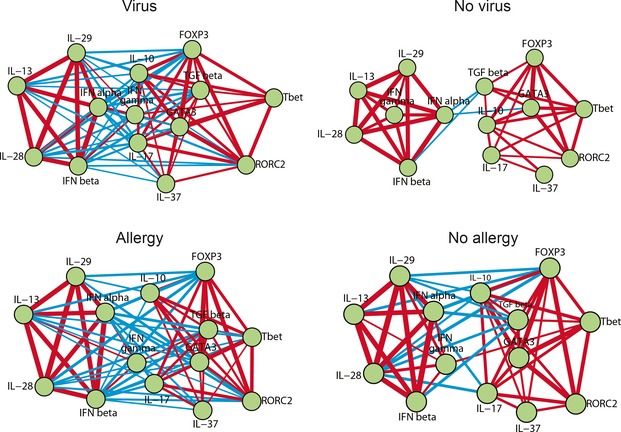
Age‐adjusted network representation of the significant intratonsillar gene correlations according to intratonsillar and/or nasopharyngeal virus infection and reported allergy status as demonstrated also in the heatmaps of Fig. 5. Nodes indicate genes. Lines indicate the presence of significant correlations. Positive correlations are displayed as red and negative correlations as blue. The line thickness is proportional to the magnitude of the correlation coefficient.
Discussion
This study provides new insights into the immune regulation and antiviral response in human tonsils in relation to age, infection, and allergic illnesses. Interestingly, intratonsillar virus detection strongly decreased by age, and only one virus‐positive case was found above the age of 25. The network analyses showed two main clusters, antiviral and immune activation/regulation‐related clusters. These two clusters had very strong negative intercluster correlation, which became more distinctive in the presence of viral infection or reported allergy.
It was remarkable that having allergy influenced many gene‐to‐gene interactions by markedly deepening the negative relationships between the antiviral and immune activation/regulatory clusters. A fine balance between allergen‐specific T‐cell activation vs allergen‐specific tolerance lies in the expression intensity of Th2 cells vs IL‐10‐secreting Treg cells in human tonsils 14. Indeed, changes in gene‐to‐gene correlations were found between IL‐10 and IL‐17 and between TGF‐β and Tbet in relation to allergy. Interestingly, the newly discovered anti‐inflammatory cytokine IL‐37 was positively associated with atopic dermatitis, and subjects with allergy showed lower Th1 expression and lower innate immune responses than those without allergy. The presence of asthma was negatively associated with type I/III interferons, which is in agreement with previous in vivo data 11.
The role of IL‐37 (formerly IL‐1 family member 7) in respiratory viral infections or allergy development has not been previously studied. It has previously been demonstrated as a natural suppressor of innate inflammatory and immune responses in vitro and in animal studies 21, 22, 23. Our data may suggest that IL‐37 may inhibit IFN‐γ expression as shown previously with T regulatory cells 24. In agreement, we showed low‐to‐moderate positive correlation between IL‐37 and IL‐10, IL‐17 and FOXP3. Our findings on IL‐37 expression, the independent positive association with atopic dermatitis and nonindependent positive association with virus infection, could imply that an inflammatory state in general, not just a viral infection, is likely to increase the expression of IL‐37 similar to IL‐10 expression 17. Several isoforms of IL‐37 exist, but our primer set covered them all. Moreover, IL‐37 is produced as a precursor that needs to be activated by caspase 1 21; therefore, the relationship between mRNA expression of IL‐37 and biological activity is not necessarily direct.
One of the key findings of the present study was that IL‐13 fell apart from typical T‐cell activation response and unexpectedly showed very strong correlation and clustered with antiviral cytokines that became particularly significant in the presence of a tonsillar virus or allergy status. This finding may help to explain the role of IL‐13 in virus‐induced exacerbation of asthma. Interestingly, our data suggest a different way of regulation in contrast to GATA3 25. In virus infection, IL‐13 released together with antiviral interferons may reduce the extent of inflammation and tissue injury, because IL‐13 inhibits monocyte and macrophage production of proinflammatory factors 26. The data are scarce on the disconnection between GATA3 and IL‐13 in viral infection, but specific viral infections may either decrease or increase GATA3‐mediated expression of Th2 cytokines 7, 27. Moreover, IFN‐β may induce the expression of IL‐13 receptor, leading to a consequential suppression of responsiveness to IL‐13 28.
Our network analyses revealed that virus infection is also associated with many alterations in gene‐to‐gene interactions similar to allergy. In light of the recent demonstration of breaking allergen‐specific T‐cell tolerance in human tonsils by triggering of Toll‐like receptor (TLR) 4 or TLR8 and the proinflammatory cytokines IL‐1β or IL‐6 29, we speculate that viral infections may have an important role in breaking peripheral tolerance and thereby promoting the development or exacerbation of allergic diseases. Rhinovirus is particularly interesting in this regard because it is the most important trigger of wheeze and asthma, especially in atopic individuals 5, 9, 30, 31. We demonstrate as a new finding that the intratonsillar virus, especially rhinovirus and parainfluenzavirus, detection was independently and positively associated with Th1 type expression. IFN‐γ, which is mainly controlled by Tbet, has an important antiviral activity and capacity to downregulate Th2 type response 16, 25, 32, 33. The existence of virus infection and allergy increased the complexity of the gene networks, and interestingly, both disease conditions had similar polarizing influence on the overall gene‐to‐gene correlation profiles. A negative correlation between antiviral and regulatory genes, particularly IL‐17, was observed only in the presence of a virus. IL‐17 is a proinflammatory cytokine, and its downregulation most likely limits virus‐induced inflammation 25. It was remarkable that the only positive interaction between the antiviral and regulatory clusters was through IFN‐γ.
In the search for covariates, we found that age showed low negative correlation with the expressions of several genes and viruses in tonsils. With high age, each component of immunity is affected, T cells being most susceptible 34. Virology, follicular helper T cells as a possible cellular source of investigated genes, and potential limitations of the study have been discussed in more detail in Suppl. discussion.
Taken together, the present study provides several new and potentially important findings considering tonsils as a new in vivo model for the understanding of immune response development and immune tolerance induction. Intranodal immunotherapy has been demonstrated highly effective 35, but more data are needed on the basic immune mechanisms in lymphnoids 36.
Financial Support
T.J. and his laboratory are supported by the Academy of Finland (Grants 114034 and 132595), the Finnish Medical Foundation, the Sigrid Juselius Foundation, and the Foundation for Pediatric Research. O.P. is a Ramon y Cajal Scholar funded by MINECO and the European Social Fund. M.A.'s laboratory is sponsored by EU 7th Framework Program PREDICTA: Post‐Infectious Immune Reprogramming and Its Association with Persistence and Chronicity of Respiratory Allergic Diseases (No: 260895). C.A.A.'s laboratory is supported by the Swiss National Science Foundation Grant 32‐132899 and Christine Kühne‐Center for Allergy Research and Education (CK‐CARE).
Author Contributions
Drs Jartti and Akdis C participated sufficiently in the work to take public responsibility for the whole content; Jartti, Palomares, and Akdis C contributed to study concept and design; Jartti, Palomares, Waris, Nieminen, Puhakka, Rückert, Aab, Vuorinen, Allander, Akdis M, and Akdis C involved in the acquisition of data; Jartti, Palomares, Tastan, Vahlberg, Akdis M, and Akdis C involved in analysis and interpretation of data; Jartti, Palomares, Tastan, Vahlberg, Akdis M, and Akdis C drafted the manuscript; Jartti, Palomares, Waris, Tastan, Nieminen, Puhakka, Rückert, Aab, Vuorinen, Allander, Vahlberg, Ruuskanen, Akdis M, and Akdis C involved in critical revision of the manuscript for important intellectual content; Jartti, Palomares, Rückert, Vuorinen, Akdis M, and Akdis C provided administrative, technical, or material support; Akdis C supervised the study.
Conflicts of interest
The authors declare that they have no conflicts of interest.
Supporting information
Figure S1. The correlations between age and the expressions of IFN‐α, IFN‐β, IFN‐γ, IL‐13, IL‐28, IL‐29, FOXP3, GATA3, RORC2, and TGF‐β.
Figure S2. Intratonsillar cytokine and transcription factor expression according intratonsillar virus detection.
Figure S3. Age‐adjusted heatmap of intratonsillar gene‐to‐gene correlations in all study patients.
Table S1. Health questionnaire.
Table S2. Primer sequences for cytokines or transcription factors.
Table S3. Virus etiology of nasopharyngeal aspirate and intratonsillar samples.
Table S4. The comparison of tonsil vs. nasopharyngeal virus detections.
Table S5. Intratonsillar transcription factor and cytokine expressions.
Table S6. The univariable associations between atopic characteristics and intratonsillar cytokine expressions.
Table S7. The univariable association between atopic characteristics and intratonsillar transcription factor expressions.
Table S8. The association between nasopharyngeal and intratonsillar virus detections and intratonsillar cytokine expressions.
Table S9. The association between nasopharyngeal and intratonsillar virus detection and transcription factor expressions.
Table S10. Comparison of gene‐to‐gene correlations between virus‐positive (intratonsillar and/or NPS positive) and virus‐negative (intratonsillar and NPS negative) subjects.
Table S11. The comparison of gene‐to‐gene correlations between allergic and nonallergic subjects.
Jartti T, Palomares O, Waris M, Tastan O, Nieminen R, Puhakka T, Rückert B, Aab A, Vuorinen T, Allander T, Vahlberg T, Ruuskanen O, Akdis M, Akdis CA. Distinct regulation of tonsillar immune response in virus infection. Allergy 2014; 69: 658–667.
Edited by: Hans‐Uwe Simon
References
- 1. Tan WC, Xiang X, Qiu D, Ng TP, Lam SF, Hegele RG. Epidemiology of respiratory viruses in patients hospitalized with near‐fatal asthma, acute exacerbations of asthma, or chronic obstructive pulmonary disease. Am J Med 2003;115:272–277. [DOI] [PubMed] [Google Scholar]
- 2. Grissell TV, Powell H, Shafren DR, Boyle MJ, Hensley MJ, Jones PD et al. Interleukin‐10 gene expression in acute virus‐induced asthma. Am J Respir Crit Care Med 2005;172:433–439. [DOI] [PubMed] [Google Scholar]
- 3. Allander T, Jartti T, Gupta S, Niesters HG, Lehtinen P, Osterback R et al. Human bocavirus and acute wheezing in children. Clin Infect Dis 2007;44:904–910. [DOI] [PMC free article] [PubMed] [Google Scholar]
- 4. Jackson DJ, Gangnon RE, Evans MD, Roberg KA, Anderson EL, Pappas TE et al. Wheezing rhinovirus illnesses in early life predict asthma development in high‐risk children. Am J Respir Crit Care Med 2008;178:667–672. [DOI] [PMC free article] [PubMed] [Google Scholar]
- 5. Lukkarinen M, Lukkarinen H, Lehtinen P, Vuorinen T, Ruuskanen O, Jartti T. Prednisolone reduces recurrent wheezing after first rhinovirus wheeze: a 7‐year follow‐up. Pediatr Allergy Immunol 2013;24:237–243. [DOI] [PMC free article] [PubMed] [Google Scholar]
- 6. Sigurs N, Aljassim F, Kjellman B, Robinson PD, Sigurbergsson F, Bjarnason R et al. Asthma and allergy patterns over 18 years after severe RSV bronchiolitis in the first year of life. Thorax 2010;65:1045–1052. [DOI] [PubMed] [Google Scholar]
- 7. Krishnamoorthy N, Khare A, Oriss TB, Raundhal M, Morse C, Yarlagadda M et al. Early infection with respiratory syncytial virus impairs regulatory T cell function and increases susceptibility to allergic asthma. Nat Med 2012;18:1525–1530. [DOI] [PMC free article] [PubMed] [Google Scholar]
- 8. Yamada K, Elliott WM, Brattsand R, Valeur A, Hogg JC, Hayashi S. Molecular mechanisms of decreased steroid responsiveness induced by latent adenoviral infection in allergic lung inflammation. J Allergy Clin Immunol 2002;109:35–42. [DOI] [PubMed] [Google Scholar]
- 9. Jartti T, Söderlund‐Venermo M, Hedman K, Ruuskanen O, Mäkelä MJ. New molecular virus detection methods and their clinical value in lower respiratory tract infections in children. Paediatr Respir Rev 2013;14:38–45. [DOI] [PMC free article] [PubMed] [Google Scholar]
- 10. Message SD, Laza‐Stanca V, Mallia P, Parker HL, Zhu J, Kebadze T et al. Rhinovirus‐induced lower respiratory illness is increased in asthma and related to virus load and Th1/2 cytokine and IL‐10 production. Proc Natl Acad Sci U S A 2008;105:13562–13567. [DOI] [PMC free article] [PubMed] [Google Scholar]
- 11. Baraldo S, Contoli M, Bazzan E, Turato G, Padovani A, Marku B et al. Deficient antiviral immune responses in childhood: distinct roles of atopy and asthma. J Allergy Clin Immunol 2012;130:1307–1314. [DOI] [PubMed] [Google Scholar]
- 12. Legg JP, Hussain IR, Warner JA, Johnston SL, Warner JO. Type 1 and type 2 cytokine imbalance in acute respiratory syncytial virus bronchiolitis. Am J Respir Crit Care Med 2003;168:633–639. [DOI] [PubMed] [Google Scholar]
- 13. Lee DC, Harker JA, Tregoning JS, Atabani SF, Johansson C, Schwarze J et al. CD25+ natural regulatory T cells are critical in limiting innate and adaptive immunity and resolving disease following respiratory syncytial virus infection. J Virol 2010;84:8790–8798. [DOI] [PMC free article] [PubMed] [Google Scholar]
- 14. Palomares O, Rückert B, Jartti T, Kücüksezer UC, Puhakka T, Gomez E et al. Induction and maintenance of allergen‐specific FOXP3+ Treg cells in human tonsils as potential first‐line organs of oral tolerance. J Allergy Clin Immunol 2012;129:510–520. [DOI] [PubMed] [Google Scholar]
- 15. McClory S, Hughes T, Freud AG, Briercheck EL, Martin C, Trimboli AJ et al. Evidence for a stepwise program of extrathymic T cell development within the human tonsil. J Clin Invest 2012;122:1403–1415. [DOI] [PMC free article] [PubMed] [Google Scholar]
- 16. Akdis M, Verhagen J, Taylor A, Karamloo F, Karagiannidis C, Crameri R et al. Immune responses in healthy and allergic individuals are characterized by a fine balance between allergen‐specific T regulatory 1 and T helper 2 cells. J Exp Med 2004;199:1567–1575. [DOI] [PMC free article] [PubMed] [Google Scholar]
- 17. Meiler F, Zumkehr J, Klunker S, Rückert B, Akdis CA, Akdis M. In vivo switch to IL‐10‐secreting T regulatory cells in high dose allergen exposure. J Exp Med 2008;205:2887–2898. [DOI] [PMC free article] [PubMed] [Google Scholar]
- 18. Osterback R, Tevaluoto T, Ylinen T, Peltola V, Susi P, Hyypiä T et al. Simultaneous detection and differentiation of human rhino‐ and enteroviruses in clinical specimens by real‐time PCR with locked nucleic Acid probes. J Clin Microbiol 2013;51:3960–3967. [DOI] [PMC free article] [PubMed] [Google Scholar]
- 19. Fisher RA. On the probable error of a coefficient of correlation deduced from a small sample. Metron 1921;1:3–32. [Google Scholar]
- 20. Smoot ME, Ono K, Ruscheinski J, Wang PL, Ideker T. Cytoscape 2.8: new features for data integration and network visualization. Bioinformatics 2011;27:431–432. [DOI] [PMC free article] [PubMed] [Google Scholar]
- 21. Nold MF, Nold‐Petry CA, Zepp JA, Palmer BE, Bufler P, Dinarello CA. IL‐37 is a fundamental inhibitor of innate immunity. Nat Immunol 2010;11:1014–1022. [DOI] [PMC free article] [PubMed] [Google Scholar]
- 22. McNamee EN, Masterson JC, Jedlicka P, McManus M, Grenz A, Collins CB et al. Interleukin 37 expression protects mice from colitis. Proc Natl Acad Sci USA 2011;108:16711–16716. [DOI] [PMC free article] [PubMed] [Google Scholar]
- 23. Sakai N, Van Sweringen HL, Belizaire RM, Quillin RC, Schuster R, Blanchard J et al. Interleukin‐37 reduces liver inflammatory injury via effects on hepatocytes and non‐parenchymal cells. J Gastroenterol Hepatol 2012;27:1609–1616. [DOI] [PMC free article] [PubMed] [Google Scholar]
- 24. Sojka DK, Fowell DJ. Regulatory T cells inhibit acute IFN‐γ synthesis without blocking T‐helper cell type 1 (Th1) differentiation via a compartmentalized requirement for IL‐10. Proc Natl Acad Sci USA 2011;108:18336–18341. [DOI] [PMC free article] [PubMed] [Google Scholar]
- 25. Akdis M, Burgler S, Crameri R, Eiwegger T, Fujita H, Gomez E et al. Interleukins, from 1 to 37, and interferon‐γ: receptors, functions, and roles in diseases. J Allergy Clin Immunol 2011;127:701–721. [DOI] [PubMed] [Google Scholar]
- 26. Gern JE, Brooks GD, Meyer P, Chang A, Shen K, Evans MD et al. Bidirectional interactions between viral respiratory illnesses and cytokine responses in the first year of life. J Allergy Clin Immunol 2006;117:72–78. [DOI] [PubMed] [Google Scholar]
- 27. Lee CC, Huang HY, Chiang BL. Lentiviral‐mediated GATA‐3 RNAi decreases allergic airway inflammation and hyperresponsiveness. Mol Ther 2008;16:60–65. [DOI] [PubMed] [Google Scholar]
- 28. Campbell‐Harding G, Sawkins H, Bedke N, Holgate ST, Davies DE, Andrews AL. The innate antiviral response upregulates IL‐13 receptor α2 in bronchial fibroblasts. J Allergy Clin Immunol 2013;131:849–855. [DOI] [PubMed] [Google Scholar]
- 29. Kücüksezer UC, Palomares O, Rückert B, Jartti T, Puhakka T, Nandy A et al. Triggering of specific Toll‐like receptors and proinflammatory cytokines break allergen‐specific T cell tolerance in human tonsils and peripheral blood. J Allergy Clin Immunol 2013;131:875–885. [DOI] [PubMed] [Google Scholar]
- 30. Jartti T, Kuusipalo H, Vuorinen T, Söderlund‐Venermo M, Allander T, Waris M et al. Allergic sensitization is associated with rhinovirus‐, but not other virus‐, induced wheezing in children. Pediatr Allergy Immunol 2010;21:1008–1014. [DOI] [PMC free article] [PubMed] [Google Scholar]
- 31. Jackson DJ, Johnston SL. The role of viruses in acute exacerbations of asthma. J Allergy Clin Immunol 2010;125:1178–1187. [DOI] [PMC free article] [PubMed] [Google Scholar]
- 32. Finotto S, Neurath MF, Glickman JN, Qin S, Lehr HA, Green FH et al. Development of spontaneous airway changes consistent with human asthma in mice lacking T‐bet. Science 2002;295:336–338. [DOI] [PubMed] [Google Scholar]
- 33. Rubtsova K, Rubtsov AV, van Dyk LF, Kappler JW, Marrack P. T‐box transcription factor T‐bet, a key player in a unique type of B‐cell activation essential for effective viral clearance. Proc Natl Acad Sci USA 2013;110:E3216–E3224. [DOI] [PMC free article] [PubMed] [Google Scholar]
- 34. Fulop T, Larbi A, Wikby A, Mocchegiani E, Hirokawa K, Pawelec G. Dysregulation of T‐cell function in the elderly: scientific basis and clinical implications. Drugs Aging 2005;22:589–603. [DOI] [PubMed] [Google Scholar]
- 35. Senti G, Crameri R, Kuster D, Johansen P, Martinez‐Gomez JM, Graf N et al. Intralymphatic immunotherapy for cat allergy induces tolerance after only 3 injections. J Allergy Clin Immunol 2012;129:1290–1296. [DOI] [PubMed] [Google Scholar]
- 36. Soyer OU, Akdis M, Ring J, Behrendt H, Crameri R, Lauener R et al. Mechanisms of peripheral tolerance to allergens. Allergy 2013;68:161–170. [DOI] [PubMed] [Google Scholar]
Associated Data
This section collects any data citations, data availability statements, or supplementary materials included in this article.
Supplementary Materials
Figure S1. The correlations between age and the expressions of IFN‐α, IFN‐β, IFN‐γ, IL‐13, IL‐28, IL‐29, FOXP3, GATA3, RORC2, and TGF‐β.
Figure S2. Intratonsillar cytokine and transcription factor expression according intratonsillar virus detection.
Figure S3. Age‐adjusted heatmap of intratonsillar gene‐to‐gene correlations in all study patients.
Table S1. Health questionnaire.
Table S2. Primer sequences for cytokines or transcription factors.
Table S3. Virus etiology of nasopharyngeal aspirate and intratonsillar samples.
Table S4. The comparison of tonsil vs. nasopharyngeal virus detections.
Table S5. Intratonsillar transcription factor and cytokine expressions.
Table S6. The univariable associations between atopic characteristics and intratonsillar cytokine expressions.
Table S7. The univariable association between atopic characteristics and intratonsillar transcription factor expressions.
Table S8. The association between nasopharyngeal and intratonsillar virus detections and intratonsillar cytokine expressions.
Table S9. The association between nasopharyngeal and intratonsillar virus detection and transcription factor expressions.
Table S10. Comparison of gene‐to‐gene correlations between virus‐positive (intratonsillar and/or NPS positive) and virus‐negative (intratonsillar and NPS negative) subjects.
Table S11. The comparison of gene‐to‐gene correlations between allergic and nonallergic subjects.