Abstract
Progress in the development of protein‐immobilization strategies and methods has made protein biochips increasingly accessible. The integration of these assay and analysis platforms into biomedical and biotechnological research has substantially expanded the repertoire of methods available for proteomics and biomarker research and for drug development. This Minireview highlights selected developments in the application of protein biochips in these fields.
Keywords: biomarkers, drug discovery, protein biochips, protein microarrays, proteomics
Biochip whys and wherefores: Protein biochips are becoming increasingly accessible. But what are they currently being used for? The integration of these assay and analysis platforms into biomedical and biotechnological research has substantially expanded the repertoire of methods available for proteomics and biomarker research and drug development.
1. Introduction
Surfaces displaying immobilized proteins, commonly referred to as “protein biochips”, promise a multitude of applications, such as quick and comprehensive biomarker detection in clinical samples,1 proteome‐wide interaction screens,2 and applications in drug discovery.3 The advantages of protein biochips over traditional methods, such as ELISA, are low sample consumption and an inherent aptitude towards miniaturization. In the case of protein microarrays, which display multiple proteins simultaneously, these characteristics translate into the ability to process many thousands of samples in parallel: a feature that is particularly important for proteome‐wide analysis.
The manufacturing of protein microarrays takes advantage of the earlier success of DNA microarrays. Much of the equipment used for DNA‐microarray fabrication and analysis can also be applied to protein microarrays. However, owing to the more delicate and sensitive nature of proteins, the transition from DNA to protein microarrays is complicated and requires specially tailored protein‐immobilization methods that ensure protein integrity and functionality after immobilization.4 Protein biochips that display protein features of defined geometry require even more complicated manufacturing approaches.4 However, much progress has been made in these fields. We recently reviewed chemical strategies for generating protein biochips.4 Herein, we present applications of protein biochips in selected areas of biomedical and biotechnological research, namely, proteomic research, biomarker detection, and drug discovery.
2. Proteomics
Protein microarrays that display a large number of different proteins are an attractive bioanalytical platform with great potential for biomedical analysis and proteome research.5–7
In one of the most advanced examples of the application of protein microarrays to date, MacBeath and co‐workers investigated the phosphorylation state of ErbB‐receptor kinases with functional protein microarrays.8, 9 Epidermal growth factor receptor (EGFR), ErbB2, and ErbB3 are well‐studied members of the ErbB family and known to be potent oncogenes. ErbB4, which has not been studied in depth, is not an oncogene and has a protective role in some cancers. To elucidate the role of ErbB4, MacBeath and co‐workers first identified tyrosine phosphorylation sites on ErbB4 by using a tandem mass spectrometry approach. Subsequently, a microarray displaying 96 SH2 and 37 PTB domains (the microarray was created from aldehyde‐modified glass slides) was probed with fluorescently labeled phosphopeptides representing the identified ErbB4 phosphorylation sites. This approach enabled the construction of a quantitative interaction network for ErbB4. New interactions between ErbB4 and the DNA‐binding protein STAT1, which is believed to play a role in apoptosis, were identified (Figure 1). The authors attributed the protective role of ErbB4 in cancer to its ability to form benign heterodimers with the other ErbB receptors, thus decreasing the amount of oncogenic heterodimers of EGFR, ErbB2, and ErbB3 through a “buffering mechanism”.9
Figure 1.
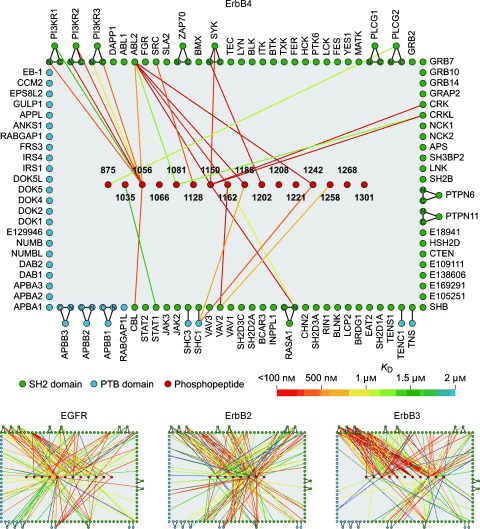
Quantitative interaction networks of tyrosine kinases associated with the ErbB family of receptors as determined by using protein microarrays displaying 96 SH2 and 37 PTB domains. SH2/PTB‐domain microarrays were probed with fluorescently labeled phosphopeptides representing tyrosine phosphorylation sites on the ErbB kinases. The microarray readout of peptide binding was based on fluorescence. The interaction networks were constructed from the quantitative interaction data obtained.9 Reprinted from reference 9 with permission from Elsevier.
Gong et al. used a functional protein microarray to profile protein–protein and protein–DNA interactions on a global level for the plant Arabidopsis thaliana.10 Starting from FAST nitrocellulose membrane slides, they constructed a microarray displaying 802 transcription factors (TFs) from Arabidopsis thaliana obtained by expression in yeast. The microarray was probed with fluorescently labeled oligonucleotides representing known binding sites of the AP2/ERF TF family. In this way, the authors confirmed known DNA–TF interactions and identified new interactions for 48 previously uncharacterized TFs of the AP2/ERF family.
In a second set of experiments, a protein microarray displaying 440 TFs was used to investigate TF binding to the so‐called evening element (EE). EE is a motif that is overrepresented in evening‐phased genes and is connected to daytime‐regulated expression. By probing the TF microarray with a fluorescently labeled EE oligonucleotide, Gong et al. identified 41 EE‐motif‐binding candidates, 11 of which had previously been found to show clock‐regulated expression. Finally, the authors probed a microarray displaying 802 TFs with biotinylated, GST‐tagged HY5 (GST=glutathione S‐transferase), a TF that is known to be a positive regulator of photomorphogenesis. Detection with fluorescently labeled streptavidin resulted in the identification of 20 reproducible interactions. In a yeast two‐hybrid assay, four interactions were confirmed out of 10 randomly chosen hits. The results suggest that HY5 binds to different proteins through different target motifs and are consistent with the function of HY5 as a key regulator of the light‐signaling network in Arabidopsis thaliana.10
The generation of whole‐proteome microarrays is technically challenging. Large numbers of functional proteins are involved and need to be isolated. To further complicate matters, whole proteomes are challenging to analyze because they represent snapshots of the complete protein repertoire of a given set of cells at a given moment in time. Not only do proteins differ in their structure, function, interactions, localization, and turnover rates, but also notably in the dynamic range of their abundance (107–108 copies in human cells, 1012 copies in plasma).11, 12 However, the advantages of using whole‐proteome protein microarrays in proteomic research, especially the ability to process thousands of samples in parallel, by far outweigh the difficulties faced in their preparation.
3. Biomarker Research
The use of protein microarrays in biomarker discovery has received particular attention from researchers in cancer medicine. A biomarker can be understood as a molecule or set of molecules linked to a defined biological state of a cell, organ, or organism; this biological state may, for example, reflect a certain disease state in cancer. The identification of biomarkers in early‐stage cancers could lead to improved therapies and survival rates of patients.13 Antibody arrays are the most commonly used protein arrays in biomarker discovery and proteomic research.1, 6, 14–20 Typically, either forward‐phase protein arrays (FPPAs) or reverse‐phase protein arrays (RPPAs) are employed (Figure 2).
Figure 2.
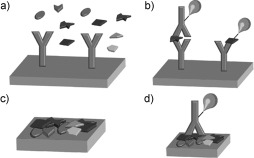
Schematic representation of forward‐phase protein arrays (FPPAs) and reverse‐phase protein arrays (RPPAs). a) In an FPPA, a specific protein of a sample that contains a variety of proteins is captured by specific antibodies immobilized in different spots on the microarray. Each array is incubated with one sample. b) Either a labeled second antibody (left) or a labeled analyte protein (right) is used for readout in an FPPA. Multiple analyte endpoints are detected for one sample. c) In an RPPA, a sample (e.g. a patient sample or a cell lysate) containing a variety of proteins is spotted in a microarray format. On each spot of the array, a different sample is immobilized. Thus, hundreds of samples are contained in one microarray. d) For detection in an RPPA, only one labeled antibody, which is specific for a certain protein, is used for signal generation and amplification. Thus, an endpoint analysis for one analyte is monitored across hundreds of samples.
In the case of FPPAs, specific antibodies immobilized in specific spots on a microarray can bind proteins from a sample, for example, human serum. Ideally, multiple proteins can be detected simultaneously on one array. The proteins are usually detected by fluorescence, through the use of either dye‐labeled secondary antibodies or labeled sample proteins.
On RPPAs, multiple samples, for example, from tissue lysates or patient sera, are immobilized directly in spots on a microarray and analyzed with a single labeled antibody that is specific for a certain protein of interest. RPPAs are particularly well‐suited for the analysis of posttranslational modifications. This approach is especially important for the analysis of protein‐signaling networks, which are often involved in cancer. Such modifications are difficult to analyze with conventional protein microarrays derived from recombinant proteins, since they frequently cannot be introduced into these proteins when the proteins are expressed in bacteria or yeast.21 Therefore, RPPAs are a promising tool for clinical diagnostics.22–24 RPPAs have the following advantages: 1) Only small sample amounts are needed; 2) the labeling of cellular protein lysates is not required; 3) quantitative detection is possible; 4) a multitude of different samples can be compared with high throughput; 5) multiplexed analysis is possible; 6) posttranslational modifications, such as phosphorylation, can be detected. However, the limitation of RPPAs is that it is only possible to detect known targets.
To investigate the performance of RPPAs, Tibes et al. used cell‐lysate samples from leukemia patients to print RPPA microarrays on FAST nitrocellulose slides and analyzed them with 22 appropriate antibodies.25 Binding was detected with secondary antibodies and fluorescence readout. The authors validated each step from RPPA‐sample preparation to readout with appropriate analysis techniques, for example, western blotting. Through this thorough comparison, they were able to demonstrate the power and reliability of RPPAs for the rapid analysis of large numbers of biomarkers.25
Large numbers of antibodies can be generated against a proteome by employing polypeptide sequences known as protein epitope signature tags (PrESTs, Figure 3).26 These sequences are produced by the heterologous expression of open reading frames (ORFs) identified in genomic studies. The PrEST peptides are spotted directly on the microarray, or antibodies against the PrEST peptides are produced by high‐throughput immunization. PrEST‐peptide microarrays can be used for the specificity profiling of antibodies.27, 28 In general, the use and applicability of antibody arrays is highly limited to the availability and quality of the antibodies. Each step of the generation and use of antibody microarrays involves quality control and validation by independent methods to avoid false‐positive or false‐negative hits and to reduce bias. Moreover, it is essential that the antibodies display sufficiently high specificity and affinity constants as well as suitable dynamic ranges. All these factors are influenced by experimental conditions. Consequently, parameters such as the immobilization conditions, pH value, temperature, and storage conditions play an important role and need to be optimized and validated to ensure reliable results from biochip experiments.
Figure 3.
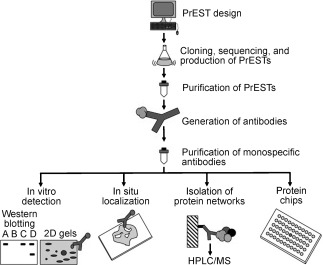
Protein epitope signature tags (PrESTs: protein sequences large enough to contain good epitopes but small enough for expression in Escherichia coli) are generated by careful computer‐assisted selection. After PrEST expression and host immunization, the obtained polyclonal antibody is purified carefully by affinity purification with the corresponding PrEST to give a high‐quality, monospecific antibody.26 Reproduced from reference 26.
Antibody microarrays have been applied successfully in cancer research, for example, by Sanchez‐Carbayo et al., who utilized antibody arrays containing 254 antibodies to distinguish patients with bladder cancer from control patients (n=95) with a correct classification rate of 93.7 %.29 Predictive information on bladder‐cancer patients was obtained on the basis of microarray data and their survival rates. Furthermore, serum proteins were identified which could possibly serve as biomarkers for classifying certain bladder‐tumor stages. The results obtained were supported by additional data from immunohistochemistry and tissue microarrays.
Hudson et al. used commercial high‐density protein microarrays (ProtoArray Human Protein Microarray v3.0 from Invitrogen) containing 5500 human proteins.30 The ORFs of the human proteins were expressed as N‐terminal GST‐fusion proteins and printed in duplicate on the nitrocellulose slides. The authors screened the sera of 30 healthy individuals and 30 individuals suffering from ovarian cancer at different tumor stages. The motivation for the study was that the most common ovarian‐cancer marker, CA‐125, is not satisfactorily predictive for patients with early‐stage disease (stages I and II). Thus, the goal of the study was to identify protein biomarkers for early disease states, as such biomarkers may later become useful for cancer therapy and prognosis based on a protein‐microarray approach. Microarray screening of the 5500 proteins revealed that 1845 were bound by autoantibodies in diseased individuals, and 1441 were bound by autoantibodies in healthy individuals. Of these proteins, 730 were bound selectively by autoantibodies in cancer patients, whereas only 326 were bound selectively in healthy individuals.
Unfortunately, no antigens or antigen combinations were identified that were bound exclusively by the sera of either all cancer patients or all healthy individuals in this study. However, 90 tumor‐associated autoantigens and two antigens associated with the healthy state could be identified by statistical methods. Four of these antigens, lamin A/C, structure‐specific recognition protein 1 (SSRP1), Ral‐binding protein 1 (RALBP1), and ZNF265, were selected from the 10 proteins which exhibited the strongest variance between diseased and healthy individuals for further validation studies. Immunoblot analysis and tissue microarrays were used for validation. Three of the four candidate biomarkers proved useful for biopsy analysis. Thus, the potential of protein microarrays for biomarker discovery was clearly demonstrated in this study. It remains to be proven, however, whether this approach is also feasible for the routine screening of sera.30
Snyder and co‐workers employed a protein‐microarray approach to identify antibodies against human severe acute respiratory syndrome (SARS) and related coronaviruses from the sera of two patient groups (>600 samples obtained from inhabitants of Canada and China) with about 90 % accuracy.31 They generated 82 GST‐fusion proteins in yeast and spotted them as reverse‐phase protein arrays on nitrocellulose slides (Schleicher & Schuell). By protein‐microarray analysis, it was possible to differentiate between SARS and HCoV‐229E, two human coronaviruses. The screening of the patient sera was validated by statistical methods and ELISA. The protein‐microarray approach was found to be at least similar in sensitivity to standard ELISA tests and even more specific. Furthermore, multiple antigens from different coronaviruses were tested simultaneously. Long‐term monitoring of serum reactivity for selected samples (Figure 4) revealed that some patients show reactive antibodies over longer periods of time (120–320 days). Thus, this study demonstrates the power of protein‐microarray‐based methods for biomedical diagnostics.31
Figure 4.
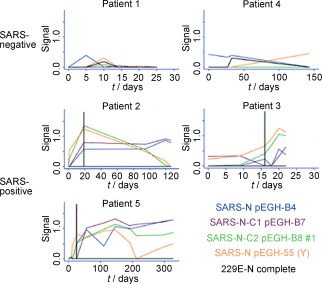
Time‐course analysis of the serum reactivity of SARS‐specific antibodies in five Canadian individuals. Top: Results for two individuals with non‐SARS respiratory disease. Bottom: Results for three SARS patients. The relative levels of antibodies against four of the SARS‐N‐protein constructs and the HCoV‐229E N protein were monitored at different times by protein‐microarray analysis. The vertical line indicates the time at which the individuals were diagnosed as SARS‐positive by biochemical assays. Reproduced with permission from reference 31 (copyright (2006) National Academy of Sciences, USA).
Anderson et al. monitored tumor antigens in breast cancer with a microarray displaying 1705 antigens constructed with nucleic‐acid‐programmed protein array (NAPPA) technology (Figure 5).32 NAPPA relies on the in situ expression of proteins through immobilized DNA templates on the chip surface. Thus, problems arising from protein isolation, purification, storage, or printing in ELISA applications should be reduced. Furthermore, multiplexing is enabled. However, the NAPPA approach is laborious and leads to “impure” protein arrays that contain DNA plasmids and capture antibodies for the generated GST proteins. Sera from breast‐cancer patients were tested for p53‐specific antibodies. The results were confirmed successfully by ELISA and western blotting.32
Figure 5.
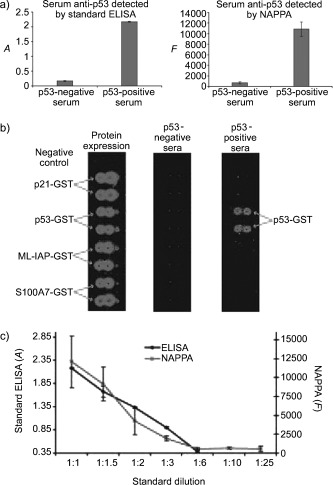
a) Comparable results were obtained in the detection of p53‐specific antibodies by ELISA or with a nucleic acid programmed protein array (NAPPA). b) NAPPA showing the successful expression of four proteins, which were detected with a labeled anti‐GST antibody. Anti‐p53 antibodies were successfully detected in p53‐positive sera with a labeled secondary antibody, whereas negative sera showed no signal. c) Comparison of the detection sensitivity of ELISA with that of NAPPA.32 Reprinted and adapted with permission from reference 32 (copyright (2008) American Chemical Society).
The selected examples described above and many other studies illustrate nicely that protein microarrays are useful tools for biomarker discovery. Future research will show whether the biomarkers discovered by this technology are sufficiently indicative and reliable to become useful tools for clinical diagnostics and pharmaceutical applications.
4. Drug Discovery
A number of in vitro methods, including affinity chromatography and protein‐display technologies, such as phage display, are used for target identification and validation.3, 33, 34 Protein microarrays are often used in combination with in vivo screens on whole‐cell models. Despite the advantages offered by biochip analyses over traditionally used affinity chromatography, examples of protein‐microarray applications in target identification are still scarce. Affinity chromatography is a time‐consuming process which is biased towards high‐abundance proteins. These proteins are prone to obscure the binding of low‐abundance proteins to the immobilized small‐molecule ligand and could thus falsify results.3 Protein microarrays do not suffer from this problem, since they display all proteins in equal amounts.3 Furthermore, they enable fast readout33 and in principle are amenable to parallel screening.3, 33, 34
In 2004, Schreiber and co‐workers reported the use of a protein microarray for target deconvolution of a small‐molecule high‐throughput screen.35 In a preliminary phenotype‐based chemical genetic suppressor assay, 16 320 small molecules were screened for their ability to rescue the cell growth of yeast cells exposed to the antiproliferative drug rapamycin. The authors identified six small‐molecule inhibitors of rapamycin (SMIR), two of which were used subsequently on yeast proteome chips to identify their respective protein targets. These arrays displayed 5800 yeast proteins, close to the entire yeast proteome, and were obtained by printing polyhistidine‐ and GST‐tagged yeast proteins on aldehyde‐ or nickel‐coated slides. Biotinylated variants of the two SMIRs were synthesized and incubated on the proteome chip. SMIR binding to proteins on the chip surface was detected with fluorescently labeled streptavidin. In this way, the authors were able to identify a new, unknown member of the target of rapamycin (TOR) signaling network.35
Besides target identification, the activity profiling of small molecules is also of considerable interest in drug discovery. Activity‐based profiling (ABP) enables the elucidation of enzyme activity in complex biological mixtures with activity‐based probes, which bind irreversibly to active enzymes and can subsequently be detected through a reporter tag.36 A combination of ABP and protein‐microarray technology enables quantitative fingerprinting of inhibitors against sets of immobilized enzymes in a high‐throughput fashion.37
Miyake and co‐workers created microarrays with six proteases of the cathepsin cysteine protease family and screened 194 small‐molecule inhibitors, including eight known cysteine protease inhibitors (Figure 6).38 In a high‐throughput competitive assay, the protease microarrays were preincubated with an inhibitor. Subsequently, a fluorescent affinity label (FAL), that is, a fluorophore‐labeled irreversible cysteine protease inhibitor, was added. The FAL competed with the preincubated inhibitor for binding to the immobilized enzymes. After a washing step, the level of residual fluorescence gave information about the binding characteristics of the preincubated inhibitor. Inhibition by all eight known cysteine protease inhibitors was found, and their inhibition profiles (fingerprints) corresponded to literature values.
Figure 6.
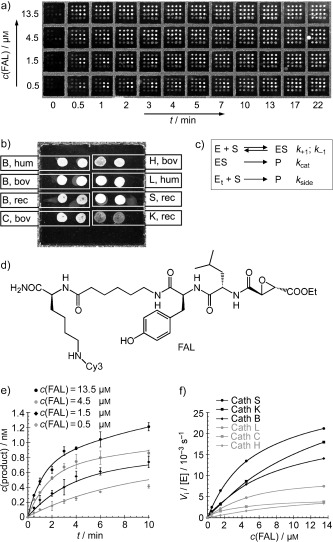
a) Fluorescence‐scanner image of a protease microarray treated with the protease inhibitor FAL at different concentrations in a time‐dependent manner. b) Fluorescent image of a subarray with cathepsin proteases spotted in duplicate (hum: human, bov: bovine, rec: recombinant; letters denote the subtype of cathepsin). c) Best‐fit Michaelis–Menten kinetics derived from the Michaelis–Menten equation for the protease microarray. Et=Etotal. d) Structure of the fluorescent affinity label (FAL). e) Data obtained from the microarray in (a) for cathepsin L at different concentrations of FAL and time points. f) Initial velocities obtained from the microarray in (a) for all proteases at different concentrations of FAL.38 Reprinted with permission from reference 38 (copyright (2005) Macmillan Publishers Ltd: Nature Biotechnology).
In a second set of experiments, Miyake and co‐workers screened cysteine protease inhibitors in a concentration‐dependent manner to obtain inhibition constants, that is, quantitative kinetic data. The inhibition constants obtained from the assay were again in agreement with known literature data.38 Yao and co‐workers optimized and extended this approach. By using a protease microarray divided into subarrays, they were able to carry out quantitative inhibitor fingerprinting on multiple proteases at the same time. These experiments gave additional information on inhibitor selectivity.39
Protein microarrays can also be used in drug discovery to determine small‐molecule–protein interactions indirectly. For example, antibody arrays can be used to determine the influence of drugs on the proteome of an organism by comparing protein‐expression levels in the presence or absence of a drug of interest.
Sokolov and Cadet applied microarray technology to investigate the correlation of protein‐expression levels with the behavioral phenotype of mice treated with methamphetamine. They were interested in identifying neuronal adaptations possibly associated with abuse of methamphetamine in humans.40 Abuse of methamphetamine is known to cause aggressive behavior in humans and in a variety of animals, such as cats, rodents, and nonhuman primates. In comparison to a control group, they found increased aggressiveness and locomotion in mice treated chronically with methamphetamine for several weeks. Protein‐expression levels were compared by using a commercially available antibody array displaying 378 monoclonal antibodies, including antibodies related to signal transduction and neurobiology. Brain tissue was removed from the mice, and proteins were extracted and labeled with fluorescent dyes before their incubation on the antibody array. Data evaluation showed a downregulation of seven proteins and an upregulation of one protein. Among these proteins were Erk2, a principal component of the mitogen‐activated protein (MAP) kinase pathway, and 14‐3‐3e, an inhibitor of protein kinase C. Together with a follow‐up kinase screen, these results hinted at involvement of the MAP kinase pathway in the behavioral change, as has also been observed in other animal models. Although further studies are required, the results clearly demonstrate the applicability of the microarray‐based approach.
Despite the advantages offered by protein microarrays, such as facile and fast high‐throughput analysis of thousands of samples in parallel, the application of protein microarrays in drug discovery has remained limited so far. Broader application, possibly as a standard technology, will probably require simpler‐to‐use and more‐robust protein‐microarray platforms than those available at present, as well as established, standardized procedures for data analysis and quality control. The advent of more‐advanced methods for the preparation of protein biochips in combination with the slow but steady improvement in the standardization of protein‐microarray protocols suggests that the use of protein biochips in drug discovery will increase.4
5. Conclusions and Outlook
The aim of this Minireview is to highlight the state of the art in the application of protein‐biochip technology. A growing number of successful examples of protein‐biochip applications have surfaced across many different research areas. There have been exciting advances in fields such as biosensor development and tissue engineering, which are not based directly on protein biochips but nevertheless require controlled protein immobilization on substrates.
Biosensors promise direct, sensitive, and rapid analysis of complex samples, such as medical samples, which are currently subjected to time‐ and material‐intensive techniques (e.g. ELISA). Thus, biosensors could revolutionize the analysis of complex samples in healthcare, medicine, and the life sciences.41 Various approaches, including methods based on nanowires, surface plasmon resonance, and microcantilevers, have shown promising results in this regard.42, 43 The research groups of Whitesides44 and Niemeyer45 independently described fabrication routes towards affordable, disposable biosensor platforms. Lieber and co‐workers demonstrated the use of nanowire‐based field‐effect transistors for the electrical detection of distinct disease‐marker proteins in clinically relevant serum samples. This approach could eventually facilitate pattern analysis of existing and emerging biomarkers for diagnosis.41, 46
Matrices with immobilized morphogenic proteins are usually used in tissue engineering as a structural support for cells in bone,47, 48 skin,49, 50 articular cartilage,51 and vascular tissue,52 and are also used in neural‐stem‐cell expansion.53 Iwata and co‐workers developed enhanced cell‐culture substrates for the selective growth of neural stem cells (NSCs) that displayed artificial dimers of epidermal growth factor, a strong activator of NSC proliferation. With their approach, they could significantly enhance cell‐growth rates relative to those observed in usual methods.54 Radisic and co‐workers successfully assembled endothelial cells in a three‐dimensional collagen scaffold by functionalizing it with vascular endothelial growth factor (VEGF) and thus demonstrated that vascularization in large three‐dimensional tissue constructs, which would be required to ensure oxygen supply, might be possible with immobilized VEGF.55
Despite the large number of successful examples of the application of protein biochips in biomedical and biotechnological research, numerous challenges remain to be tackled. Most protein biochips are currently prepared by traditional strategies, which lead to random protein orientation on the chip surface. This random arrangement can negatively influence protein activity or ligand binding as a result of steric hindrance, and can thus lead to a decrease in assay efficiency or even the falsification of assay results.34 The problem might be solved by the implementation of more‐advanced methods for the preparation of protein biochips. Many such methods have been developed over the last few years.4
The expression and purification of thousands of proteins with retention of their intrinsic activity is far from trivial.34 However, a growing number of approaches for the fast production of high‐quality proteome‐scale protein biochips are being developed for several organisms. One example is the “full‐length expression‐ready gene collection” (FLEXgene), which consists of complete‐ORF plasmid collections from various species for the simple cloning and expression of whole proteomes.56
The introduction of label‐free detection methods, such as mass spectrometry or surface plasmon resonance (SPR), will simplify microarray analysis, since interaction partners no longer need to be labeled. This feature is particularly important for large‐scale analysis based on protein biochips. Evans‐Nguyen et al. incubated a superhydrophobic, self‐assembled‐monolayer‐modified, porous gold surface displaying immobilized antibodies with plasma spiked with an antigen peptide, and after matrix application detected bound peptides directly by using MALDI.57 Campbell and Kim reviewed the promising application of SPR for the label‐free readout of protein–protein interactions on protein microarrays.58
The standardization of microarray production, application, and data analysis would improve and ensure the quality of data obtained with protein microarrays. This standardization would include subsequent confirmatory studies with independent methods to verify the findings of protein‐microarray screens.
None of these challenges is insurmountable, and much progress has been made over the last decade. We expect that protein‐biochip technology is on the verge of a breakthrough to become a standard tool in research, much as DNA‐microarray technology is today.
Biographical Information
Dirk Weinrich was born in 1980 in Berlin. He studied chemistry at the Technical University Berlin with a focus on organic chemistry, technical chemistry, and biochemistry and completed his diploma in 2005 with research on photoswitchable peptides and traceless linkers under the guidance of Karola Rück‐Braun. He is currently completing his PhD studies on protein biochips with Herbert Waldmann at the Max Planck Institute in Dortmund.
The publisher did not receive permission from the copyright owner to include this object in this version of this product. Please refer either to the publisher's own online version of this product or the printed product where one exists.
Biographical Information
Pascal Jonkheijm was born in 1978 in Vogelwaarde, The Netherlands. He completed his PhD in supramolecular chemistry at Eindhoven University of Technology in 2005 with E. W. (Bert) Meijer. He was an Alexander von Humboldt research fellow with Herbert Waldmann at the Max Planck Institute (MPI) in Dortmund until 2008, when he became a tenured group leader at the Mesa+ Institute for Nanotechnology at the University of Twente as a recipient of the Dutch VENI prize. His research interests are in supramolecular chemistry, molecular nanofabrication, and protein patterning.
The publisher did not receive permission from the copyright owner to include this object in this version of this product. Please refer either to the publisher's own online version of this product or the printed product where one exists.
Biographical Information
Christof M. Niemeyer studied chemistry at the University of Marburg and completed his PhD at the Max‐Planck‐Institut für Kohlenforschung in Mülheim/Ruhr with Manfred T. Reetz. After a postdoctoral fellowship at the Center for Advanced Biotechnology in Boston with Charles R. Cantor, he completed his habilitation at the University of Bremen and since 2002 has held the chair of Biological and Chemical Microstructuring in Dortmund. He is founder of the company Chimera Biotec, which commercializes diagnostic applications of DNA–protein conjugates.
The publisher did not receive permission from the copyright owner to include this object in this version of this product. Please refer either to the publisher's own online version of this product or the printed product where one exists.
Biographical Information
Herbert Waldmann completed his PhD in organic chemistry at the University of Mainz in 1985 with Prof. Kunz and carried out postdoctoral research with Prof. G. Whitesides at Harvard University. Following positions as Professor of Organic Chemistry at the Universities of Bonn (from 1991) and Karlsruhe (from 1993), he became Director of the MPI of Molecular Physiology Dortmund and Professor of Organic Chemistry at the University of Dortmund in 1999. His research interests lie in the study of chemical biology with small‐molecule and protein probes and microarray technology.
The publisher did not receive permission from the copyright owner to include this object in this version of this product. Please refer either to the publisher's own online version of this product or the printed product where one exists.
Acknowledgements
We thank Sabine Borgmann for her contributions to the original draft of this manuscript and Laura Koch for her support with some of the graphical illustrations. We acknowledge the many discussions with and contributions of all our former and current colleagues. The Max‐Planck‐Gesellschaft, the Technical University of Dortmund, the Fonds der Chemischen Industrie, and the Zentrum für Angewandte Chemische Genomik have supported the research in Dortmund. Pascal Jonkheijm thanks the Alexander von Humboldt‐Stiftung for a research fellowship and the Chemical Sciences Council of the Dutch Science Foundation for a VENI award.
Contributor Information
Christof M. Niemeyer, Email: christof.niemeyer@tu-dortmund.de
Herbert Waldmann, Email: herbert.waldmann@mpi-dortmund.mpg.de
References
- 1. Lee H. J., Wark A. W., Corn R. M., Analyst 2008, 133, 975–983. [DOI] [PMC free article] [PubMed] [Google Scholar]
- 2. Phizicky E., Bastiaens P. I. H., Zhu H., Snyder M., Fields S., Nature 2003, 422, 208–215. [DOI] [PubMed] [Google Scholar]
- 3. Terstappen G. C., Schlupen C., Raggiaschi R., Gaviraghi G., Nat. Rev. Drug Discovery 2007, 6, 891–903. [DOI] [PubMed] [Google Scholar]
- 4. Jonkheijm P., Weinrich D., Schroeder H., Niemeyer C. M., Waldmann H., Angew. Chem. 2008, 120, 9762–9792; [DOI] [PubMed] [Google Scholar]; Angew. Chem. Int. Ed. 2008, 47, 9618–9647. [DOI] [PubMed] [Google Scholar]
- 5. Stoll D., Templin M. F., Schrenk M., Traub P. C., Vohringer C. F., Joos T. O., Front. Biosci. 2002, 7, c13–c32. [DOI] [PubMed] [Google Scholar]
- 6. Lv L. L., Liu B. C., Expert Rev. Proteomics 2007, 4, 505–513. [DOI] [PubMed] [Google Scholar]
- 7. Stoll D., Templin M. F., Bachmann J., Joos T. O., Curr. Opin. Drug Discovery Dev. 2005, 8, 239–252. [PubMed] [Google Scholar]
- 8. Jones R. B., Gordus A., Krall J. A., MacBeath G., Nature 2006, 439, 168–174. [DOI] [PubMed] [Google Scholar]
- 9. Kaushansky A., Gordus A., Budnik B. A., Lane W. S., Rush J., MacBeath G., Chem. Biol. 2008, 15, 808–817. [DOI] [PMC free article] [PubMed] [Google Scholar]
- 10. Gong W., He K., Covington M., Dinesh‐Kumar S. P., Snyder M., Harmer S. L., Zhu Y.‐X., Deng X. W., Mol. Plant 2008, 1, 27–41. [DOI] [PMC free article] [PubMed] [Google Scholar]
- 11. Anderson N. L., Anderson N. G., Electrophoresis 1998, 19, 1853–1861. [DOI] [PubMed] [Google Scholar]
- 12. Corthals G. L., Wasinger V. C., Hochstrasser D. F., Sanchez J. C., Electrophoresis 2000, 21, 1104–1115. [DOI] [PubMed] [Google Scholar]
- 13. Lay J. O., Borgmann S., Liyanage R., Wilkins C. L., TrAC Trends Anal. Chem. 2006, 25, 1046–1056. [Google Scholar]
- 14. Wingren C., Borrebaeck C. A. K., Expert Rev. Proteomics 2004, 1, 355–364. [DOI] [PubMed] [Google Scholar]
- 15. Wingren C., Borrebaeck C. A. K., Drug Discovery Today 2007, 12, 813–819. [DOI] [PubMed] [Google Scholar]
- 16. Hober S., Uhlén M., Curr. Opin. Biotechnol. 2008, 19, 30–35. [DOI] [PubMed] [Google Scholar]
- 17. Liotta L. A., Espina V., Mehta A. I., Calvert V., Rosenblatt K., Geho D., Munson P. J., Young L., Wulfkuhle J., Petricoin E. F., Cancer Cell 2003, 3, 317–325. [DOI] [PubMed] [Google Scholar]
- 18. Lueking A., Cahill D. J., Mullner S., Drug Discovery Today 2005, 10, 789–794. [DOI] [PubMed] [Google Scholar]
- 19. Spurrier B., Honkanen P., Holway A., Kumamoto K., Terashima M., Takenoshita S., Wakabayashi G., Austin J., Nishizuka S., Biotechnol. Adv. 2008, 26, 361–369. [DOI] [PubMed] [Google Scholar]
- 20. Lv L. L., Liu B. C., Proteomics Clin. Appl. 2008, 2, 989–996. [DOI] [PubMed] [Google Scholar]
- 21. Kreutzberger J., Appl. Microbiol. Biotechnol. 2006, 70, 383–390. [DOI] [PMC free article] [PubMed] [Google Scholar]
- 22. Pollard H. B., Srivastava M., Eidelman O., Jozwik C., Rothwell S. W., Mueller G. P., Jacobowitz D. M., Darling T., Guggino W. B., Wright J., Zeitlin P. L., Paweletz C. P., Proteomics Clin. Appl. 2007, 1, 934–952. [DOI] [PubMed] [Google Scholar]
- 23. Aguilar‐Mahecha A., Hassan S., Ferrario C., Basik M., OMICS 2006, 10, 311–326. [DOI] [PubMed] [Google Scholar]
- 24. Hall D. A., Ptacek J., Snyder M., Mech. Ageing Dev. 2007, 128, 161–167. [DOI] [PMC free article] [PubMed] [Google Scholar]
- 25. Tibes R., Qiu Y. H., Lu Y., Hennessy B., Andreeff M., Mills G. B., Kornblau S. M., Mol. Cancer Ther. 2006, 5, 2512–2521. [DOI] [PubMed] [Google Scholar]
- 26. Agaton C., Uhlén M., Hober S., Electrophoresis 2004, 25, 1280–1288. [DOI] [PubMed] [Google Scholar]
- 27. Haab B. B., Proteomics 2003, 3, 2116–2122. [DOI] [PubMed] [Google Scholar]
- 28. Uhlen M., Ponten F., Mol. Cell. Proteomics 2005, 4, 384–393. [DOI] [PubMed] [Google Scholar]
- 29. Sanchez‐Carbayo M., Socci N. D., Lozano J. J., Haab B. B., Cordon‐Cardo C., Am. J. Pathol. 2006, 168, 93–103. [DOI] [PMC free article] [PubMed] [Google Scholar]
- 30. Hudson M. E., Pozdnyakova I., Haines K., Mor G., Snyder M., Proc. Natl. Acad. Sci. USA 2007, 104, 17494–17499. [DOI] [PMC free article] [PubMed] [Google Scholar]
- 31. Zhu H., Hu S. H., Jona G., Zhu X. W., Kreiswirth N., Willey B. M., Mazzulli T., Liu G. Z., Song Q. F., Chen P., Cameron M., Tyler A., Wang J., Wen J., Chen W. J., Compton S., Snyder M., Proc. Natl. Acad. Sci. USA 2006, 103, 4011–4016. [DOI] [PMC free article] [PubMed] [Google Scholar]
- 32. Anderson K. S., Ramachandran N., Wong J., Raphael J. V., Hainsworth E., Demirkan G., Cramer D., Aronzon D., Hodi F. S., Harris L., Logvinenko T., LaBaer J., J. Proteome Res. 2008, 7, 1490–1499. [DOI] [PMC free article] [PubMed] [Google Scholar]
- 33. Zhu H., Huang J., Drug Discovery Ser. 2007, 8, 261–274. [Google Scholar]
- 34. Sleno L., Emili A., Curr. Opin. Chem. Biol. 2008, 12, 46–54. [DOI] [PubMed] [Google Scholar]
- 35. Huang J., Zhu H., Haggarty S. J., Spring D. R., Hwang H., Jin F., Snyder M., Schreiber S. L., Proc. Natl. Acad. Sci. USA 2004, 101, 16594–16599. [DOI] [PMC free article] [PubMed] [Google Scholar]
- 36. Uttamchandani M., Li J., Sun H., Yao S. Q., ChemBioChem 2008, 9, 667–675. [DOI] [PubMed] [Google Scholar]
- 37. Chen G. Y. J., Uttamchandani M., Zhu Q., Wang G., Yao S. Q., ChemBioChem 2003, 4, 336–339. [DOI] [PubMed] [Google Scholar]
- 38. Funeriu D. P., Eppinger J., Denizot L., Miyake M., Miyake J., Nat. Biotechnol. 2005, 23, 622–627. [DOI] [PubMed] [Google Scholar]
- 39. Uttamchandani M., Liu K., Panicker R. C., Yao S. Q., Chem. Commun. 2007, 1518–1520. [DOI] [PubMed] [Google Scholar]
- 40. Sokolov B. P., Cadet J. L., Neuropsychopharmacology 2006, 31, 956–966. [DOI] [PubMed] [Google Scholar]
- 41. Patolsky F., Zheng G., Lieber C. M., Nat. Protoc. 2006, 1, 1711–1724. [DOI] [PubMed] [Google Scholar]
- 42. Patolsky F., Timko B. P., Zheng G., Lieber C. M., MRS Bull. 2007, 32, 142–149. [Google Scholar]
- 43. He B., Morrow T. J., Keating C. D., Curr. Opin. Chem. Biol. 2008, 12, 522–528. [DOI] [PMC free article] [PubMed] [Google Scholar]
- 44. Martinez A. W., Phillips S. T., Whitesides G. M., Proc. Natl. Acad. Sci. USA 2008, 105, 19606–19611. [DOI] [PMC free article] [PubMed] [Google Scholar]
- 45. Schroeder H., Adler M., Gerigk K., Müller‐Chorus B., Götz F., Niemeyer C. M., Anal. Chem. 2009, 81, 1275–1279. [DOI] [PubMed] [Google Scholar]
- 46. Zheng G., Patolsky F., Cui Y., Wang W. U., Lieber C. M., Nat. Biotechnol. 2005, 23, 1294–1301. [DOI] [PubMed] [Google Scholar]
- 47. Rogel M. R., Qiu H., Ameer G. A., J. Mater. Chem. 2008, 18, 4233–4241. [Google Scholar]
- 48. Stevens M. M., Mater. Today 2008, 11, 18–25. [Google Scholar]
- 49. Priya S. G., Jungvid H., Kumar A., Tissue Eng., Part B 2008, 14, 105–118. [DOI] [PubMed] [Google Scholar]
- 50. MacNeil S., Mater. Today 2008, 11, 26–35. [Google Scholar]
- 51. Wescoe K., Schugar R., Chu C., Deasy B., Cell Biochem. Biophys. 2008, 52, 85–102. [DOI] [PubMed] [Google Scholar]
- 52. Mironov V., Kasyanov V., Markwald R. R., Trends Biotechnol. 2008, 26, 338–344. [DOI] [PubMed] [Google Scholar]
- 53. Little L., Healy K. E., Schaffer D., Chem. Rev. 2008, 108, 1787–1796. [DOI] [PubMed] [Google Scholar]
- 54. Nakaji‐Hirabayashi T., Kato K., Iwata H., Bioconjugate Chem. 2009, 20, 102–110. [DOI] [PubMed] [Google Scholar]
- 55. Shen Y. H., Shoichet M. S., Radisic M., Acta Biomater. 2008, 4, 477–489. [DOI] [PubMed] [Google Scholar]
- 56. Brizuela L., Braun P., LaBaer J., Mol. Biochem. Parasitol. 2001, 118, 155–165. [DOI] [PubMed] [Google Scholar]
- 57. Evans‐Nguyen K. M., Tao S. C., Zhu H., Cotter R. J., Anal. Chem. 2008, 80, 1448–1458. [DOI] [PubMed] [Google Scholar]
- 58. Campbell C. T., Kim G., Biomaterials 2007, 28, 2380–2392. [DOI] [PubMed] [Google Scholar]


