

Abstract
Elements and quantification: A nucleic acid assay has been developed, based on an elemental labeling strategy using magnetic microparticles (MMPs), which provides quantification of multiple DNA targets. Rare‐earth elements, indium, and stable isotopes could be labeled with oligonucleotides serving as DNA probes. Quantitative analysis was then carried out using the designed systems (see picture) and elemental mass spectrometry.

Keywords: absolute quantification, DNA assay, elemental labeling, mass spectrometry, rare earth elements
Rapid, multiplex, and quantitative detection of sequence‐specific or mutated genes associated with human diseases has played a central role in modern clinical treatments of molecular diagnostics and genomics research.1 Over the past decades, several advances of novel technologies and methods have been achieved.2 There are however ever‐increasing requirements for improving analytical capabilities, in particular for signal multiplexing3 and precise quantification.4 Nowadays, among various optical approaches, the fluorescence‐based method has been mostly applied.5 As it suffers from the drawbacks of spectral overlap and multi‐wavelength excitation, which fundamentally limit the number of available fluorophores, simultaneous detection of more than ten DNA targets in a single analysis would be hardly performed even using quantum dots.6 Recently, color‐coding microparticle technologies have been developed to solve this problem by making use of an immense number of available encoding beads.7 One challenge is the accurate and precise quantification because of their polydispersity and nonbicompatibility, as they have micrometer sizes. Furthermore, the complex fabrication process may hamper their broad usability.8 Therefore, there has been interest to explore a non‐optical labeling and detecting method, which is able to simplify labeling process and provide high‐level multiplexing as well as precise determination.
An elemental labeling strategy for bioassays has been regarded as an emerging method in which large biomolecules are labeled with elemental tags and subsequently detected by elemental mass spectrometry, such as inductively coupled plasma mass spectrometry (ICP‐MS).9 Compared with other methods, it contains two inherent advantages: 1) Owing to the benefits of a large number of elements or isotopes (up to 100) potentially used as elemental tags, as well as excellent mass resolution and multi‐element detectors of ICP‐MS, high‐level multiplexed analysis can be successfully obtained without the limitation of spectral overlap;10 2) ICP‐MS has allowed isotope ratio measurement with good accuracy and precision, thus in combination with isotope dilution analysis (IDA), absolute‐quantitative measurement can be carried out as the complementary use of molecular mass spectrometry.11 In the last decade, elemental labeling bioassays have been successfully applied in the fields of enzyme‐linked immunosorbent assay (ELISA),12 quantitative protomics,13 and single‐cell biology.14 Unfortunately, the value of elemental labeling in nucleic acid analysis has not been fully understood, and there are only a few relevant studies in the previous publications.15 In our opinion, the reason might be that there has been no highly specific and efficient approaches for labeling nucleic acid with elemental tags. Another aspect might be that the current methods of absolute quantification commonly require to couple ICP‐MS with time‐ and labor‐intensive separation procedures; for example, chromatography or gel electrophoresis.16 Thus, great efforts should be taken to overcome these shortages of elemental labeling bioassays and extend its applications to quantitative nucleic acid analysis.
Herein, we report for the first time multiplex nucleic acid assays based on the elemental labeling strategy, which take advantages of DNA hybridization reactions for specific recognition, rare‐earth elements for multiplex labeling, magnetic microparticles for fast separation, and ICP‐MS for ultrasensitive detection. Importantly, both absolute and relative quantification could be performed for multiplex analysis of DNA targets. As a proof‐of‐concept study of high‐level multiplexing, 15 DNA targets associated with clinical diseases were simultaneously detected by elemental labeling tags of Y, La, Ce, Pr, Nd, Sm, Eu, Gd, Tb, Dy, Ho, Er, Tm, Yb, and Lu. The relative quantification was carried out by using internal calibration curves. Additionally, the absolute quantification with chromatography‐free hybridization isotope dilution analysis (HIDA) was developed. Taking advantage of labeling the artificially 161Dy‐enriched and 168Er‐enriched isotopes with dilution probes, two DNA targets were analyzed absolutely and simultaneously.
As shown in Scheme 1 a, the procedure of labeling sequence‐specific oligonucleotides with elemental tags involves two steps: 1) oligonucleotides, 3′ end‐functionalized with thiol (—SH) groups, were specifically derivatized with malemide groups of 1,4,7,10‐tetraazacyclododecane‐1,4,7‐tris‐aceticacid‐10‐maleimidoethylacetamide (MMA‐DOTA), a compound commonly employed for chemical labeling of proteins or peptides;17 2) rare‐earth elements (REEs) were chelated with high kinetic and thermodynamic stability (for reaction conditions (pH, mole ratio of MMA‐DOTA to DNA, time, and temperature), see the Supporting Information). As there was only one —SH group in the DNA, the stoichiometry between DNA and REE ions in REEs‐labeled DNA complexes was a 1:1 mole ratio. The distinguishing feature using REEs as elemental tags is that they have similarly chemical properties, a low background in biological samples, and high sensitivity in ICP‐MS. Importantly, DOTA‐REE chelates as labeling reagents are water‐soluble and biocompatible.
Scheme 1.

Multiplex DNA assays based on the elemental labeling strategy. a) Labeling DNA with elemental tags. The oligonucleotide with an SH group was conjugated with MMA‐DOTA, and then rare‐earth elements, stable isotopes, and indium were chelated in the macrocycle DOTA. b) Multiplex DNA assay procedures. First, DNA targets were added to the suspension array of capture‐probe functionalized magnetic microparticles (MMPs), and mixed with elemental labeling DNA probes. Subsequently, the sandwich conjugates of MMP‐DNA‐element complexes were synthesized by hybridization reactions. Then, by magnetic separation and temperature increase above the melting temperature (T m), the elemental labeling DNA probes were released to the supernatant, which was quantitatively measured by ICP‐MS.
The labeling procedures were monitored by matrix‐assisted laser desorption/ionization time‐of‐flight mass spectrometry (MALDI‐TOF‐MS). The products of each step were purified by high‐performance liquid chromatography (HPLC). Finally, the specificity of elemental labeling products was validated by ICP‐MS measurement. For instance, hepatitis A virus (HAV) target probe (the sequence is given in the Supporting Information, Table S2) was labeled with the element La. Figure 1 a showed the MALDI‐TOF‐MS results. The determined molecular weight (DW) of HAV probe was 7878.2, corresponding to the theoretical molecular weight (TW) of 7873.2; the DW of the first‐step product was 8406.9, corresponding to DNA‐DOTA complex TW of 8401.7; the DW of the second‐step product was 8541.4, corresponding to DNA‐DOTA‐La complex TW of 8537.6. The mass difference of 4–5 between the measured and theoretical molecular weight was due to the mass measurement errors of the MALDI‐TOF‐MS employed. Finally, after purification by HPLC (Figure 1 b), the product of DNA‐DOTA‐La complex was confirmed by ICP‐MS profile spectra (m/z 135 to 180) in Figure 1 c (HAV‐La). It was also confirmed that the other 13 sequence‐specific DNA probes were successfully labeled with 13 different REEs, respectively. The results of MALDI‐TOF‐MS are provided in the Supporting Information, Figure S2. By using the same protocedure, 15 REEs in total, including Y, and two stable isotopes (161Dy‐enrichment and 168Er‐enrichment), as well as indium (In), were successfully labeled with the sequence‐specific DNA probes, respectively.
Figure 1.

Characterization of rare‐earth‐labeled DNA probes. a) The MALDI‐TOF‐MS results of La‐labeled HAV probes. The determined mass of 7878.2 was from thiol‐functionalized DNA, 8406.9 from the product of DNA‐DOTA complexes, and 8541.4 from the product of DNA‐DOTA‐La complexes. b) Purity test of DNA‐DOTA‐La complexes by HPLC. The retention time was 13.55 min. c) ICP‐MS profile spectra of 14 DNA probes labeled with different REEs from La to Lu. In the determination of each purified product, the ICP‐MS scan region was from m/z 135 to 180, with a dwell time of 100 ms.
The relative quantification of multiplexed DNA assays was first investigated, and the principle is illustrated in Scheme 1 b. In the experiments, 15 DNA targets with 25–30 bases related to clinical diseases (cancer, heredopathia, and virus) and a control target for internal standard were used as the model systems. The sequences of these DNA targets and their designed capture and report probes are given in the Supporting Information, Table S2. The suspension of 2.8 μm magnetic microparticles (MMPs) was functionalized with 16 thiolated capture probes, which were complementary to one half region of the targets of interest. Then they were incubated with the mixture of DNA targets and 15 REE‐labeled report probes (HAV‐La, HBV‐Ce, HCV‐Pr, HIV‐Nd, HPV‐Sm, EV‐Eu, TP‐Gd, VV‐Tb, BA‐Dy, FT‐Ho, SRAS‐Er, BC‐Tm, AD‐Yb, SCD‐Lu, PC‐Y) as well as In‐labeled report probes (IS‐In), which were complementary to the other half region of the targets. The sandwich hybridization reactions led to the formation of MMP‐target‐element complexes. Subsequently, by using magnetic separation, the excess REEs‐labeled report probes were removed. Finally, by increasing the temperature to 95 °C, REE‐labeled report probes were allowed to be released from the MMP‐target‐element complexes to the supernatant and were measured by ICP‐MS (for experimental details, see the Supporting Information).
In this assay, the identification of each DNA target was performed by the recognition of m/z spectrum of its own labeled REEs, and the quantification was dependent on the ion sensitivity quantitatively measured by ICP‐MS. The majority of REEs had more than one stable isotope, some of which have mass spectral overlap (as shown in Figure 1 c). However, they had at least one overlap‐free isotope for the detection (the isotopes and their abundance of each REE are listed in the Supporting Information, Table S3). Thus, 15 REEs could be simultaneously detected in a single analysis. In this approach, the isotopes of 89Y, 139La, 140Ce, 141Pr, 146Nd, 147Sm, 153Eu, 158Gd, 159Tb, 163Dy, 165Ho, 166Er, 169Tm, 172Yb, and 175Lu were utilized for the simultaneous detection of 15 DNA targets without mass spectral overlap. Consequently, the amounts of DNA targets were referring to the signals of these isotopes in ICP‐MS. Figure 2 a illustrates the analytical results of 15 DNA targets with four levels of concentrations (5, 10, 15, and 20 pmol). In the spectra, each unique isotope identified one DNA target and the channel counts of isotopes increased according to the amount of DNA targets. However, different intensities had been obtained among different DNA targets with the same concentration. The reason was that the measured isotopes had the different abundance.
Figure 2.
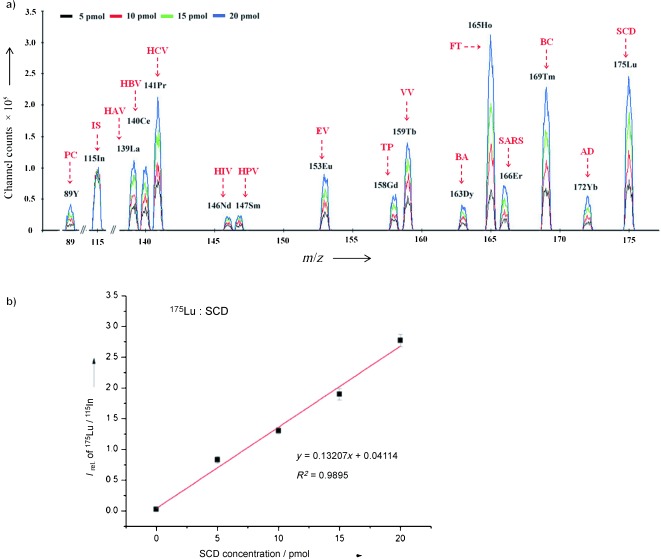
a) ICP‐MS profile spectra of 15 DNA targets with four levels of concentrations. In consideration of some mass overlaps, isotopes of REEs were chosen for the simultaneous determination, including 89Y, 139La, 140Ce, 141Pr, 146Nd, 147Sm, 153Eu, 158Gd, 159Tb, 163Dy, 165Ho, 166Er, 169Tm, 172Yb, and 175Lu. 115In was monitored as an internal standard in the experiments. Additionally, 15 clinically relevant genetic targets, respectively related to HAV, HBV, HCV, HIV, HPV, EV, TP, VV, B. anthracis, F. tularensis, SARS, coronavirus, breast cancer, prostate cancer, Alzheimer’s disease, as well as sickle cell disease, were simultaneously analyzed with four concentrations of 5, 10, 15, and 20 pmol. The internal standard target was 10 pmol. b) The internal calibration curves of relative intensities of 175Lu/115In versus the concentrations of the SCD targets (containing blank sample). For other calibration curves, see the Supporting Information, Figure S3.
In the quantification procedure by calibration curves, an internal standard (IS) target with constant concentration (10 pmol), the probe of which was labeled with the element In, was analyzed along with the samples. In each assay, the IS target was added to the sample solutions and operated under the same condition as other targets. Thus, it could account for sample losses and variation from sample preparation and separation steps, and correct the biased measurement of ICP‐MS. As a result, the calibration curves of relative intensities of REEs (corresponding to the signal ratio between REEs and In) versus the concentrations of the DNA targets had been obtained with good linearity. For example, Figure 2 b illustrates the calibration curves of 175Lu/115In versus the SCD target. The achieved detection limits of the DNA targets in this method were as low as 0.5–2 pmol. The linear range was from 0.5 to 20 pmol and could be extended by increasing the dosage of the MMPs. Moreover, as there are nearly 40 isotopes of REEs, the multiplexing capability of the proposed method could be further improved.
As mentioned above, the relative‐quantification approach was a comparative analysis and quantified the analytical data of DNA samples by calibration curves by using known amount standard nucleic acids, which were perfectly matched with the sequences of the targets. However, an absolute‐quantification bioassay, requiring no standard references relying on the targets, could directly provide the precise amount of targets.18 In recent studies, there has been no examples of sequence‐specific and multiplex DNA analysis in this type of absolute‐quantification method. To address this issue, we propose a novel method for the absolute DNA quantification by coupling isotope dilution analysis with DNA hybridization reactions. The principle is shown in Scheme 2. It can be seen that dilution probes (DPs), which were labeled with artificially enriched isotopes, could directly hybridize with the capture probes (CPs) immobilized on the MMPs regardless of DNA targets. In contrast, report probes (RPs), which were labeled with natural REEs, are coupled with CPs through the hybridization of DNA targets. For a constant amount of DPs and excess amount of RPs, the DNA targets determined the ratio of RPs/DPs (R RPs/DPs) in the hybridized complexes of CPs. R RPs/DPs could be indicated by the ratio of m 2 /m 1 (R). Therefore, by quantifying the amount of DPs, as well as measuring R in the hybridized CPs, RPs, and DPs, the amount of DNA targets could be calculated according to isotope dilution functions (see the Supporting Information).
Scheme 2.

The hybridization isotope dilution analysis (HIDA) strategy. The HIDA system was composed of four parts: capture probes, report probes, dilution probes, and DNA targets. The capture probes had two regions: the former region directly hybridized with dilution probes, and the latter region from sandwich hybridization with DNA targets and report probes. Ln was a natural rare‐earth element, while *Ln was an artificially enriched isotope. They had similar chemical and physical properties, but the isotope abundance at the mass numbers of m 1 and m 2. Isotope ratio measurement was carried out by ICP‐MS to analyze the change in the isotope ratio of m 2/m 1 resulting from the hybridization of DNA targets.
To demonstrate the feasibility of the HIDA method for multiplex DNA assay, a two‐strand system was designed as shown in Figure 3, where two sequence‐specific CPs were used for simultaneous hybridization with BA and SARS targets, respectively. The natural Dy and Er were labeled with their RPs, while 161Dy‐enriched and 168Er‐enriched isotopes were labeled with their DPs. The mass numbers of 161, 163, 166, and 168 were monitored by ICP‐MS for isotope ratio measurement, and there was no mass spectral overlap of them in the elements Dy and Er. In the experiments, 100 μL of MMPs (1–2×10⁹ beads mL−1) was first mixed with 500 pmol of BA and SRAS target CPs, allowed to react for 4 h with gentle shaking at room temperature, then washed with coupling buffer to remove unreactive CPs. After the preparation of capture‐probe‐functionalized MMPs, 200 pmol of excess BA and SRAS target RPs and a certain amount of the samples were added. Subsequently, 159.89±0.35 ng of 161Dy‐labeled DPs and 171.89±0.28 ng of 168Er‐labeled DPs, quantitatively measured by ICP‐MS previously, were spiked to the mixtures. Thereafter, DNA hybridization, sample separation, and ICP‐MS measurement were operated in a similar fashion to the relative quantification.
Figure 3.

DNA sequences and labeled elements of HIDA for BA (top) and SARS (bottom) targets. The BA report probe 3′ end was labeled with natural Dy (161, abundance of 18.91 %; 163, abundance of 24.90 %); the BA dilution probe 3′ end was labeled with 161Dy‐enriched isotope (161, abundance of 95.73 %; 163, abundance of 0.90 %). The SRAS report probe 3′ end was labeled with natural Er (166, abundance of 33.61 %; 168, abundance of 26.78 %); the SRAS dilution probe 3′ end was labeled with 168Er‐enriched isotope (166, abundance of 0.62 %; 168, abundance of 97.76 %). Each capture probe had 47 bases in which 10‐base poly A was used as the spacer in both 5′ end and middle of the oligonucleotide.
Figure 4 indicated the results of ICP‐MS profile spectra of three samples containing different concentrations of BA and SARS targets (amount increasing from 1 to 3). As a result, the signals of mass number 163 and 166 increased more remarkable than 161 and 168, with the increase of DNA targets. Original isotope ratio of 161/163 (R 161/163) in natural Dy and 161Dy‐enriched isotope were 0.76 and 106.37, respectively; the original isotope ratio of 168/166 (R 168/166) in natural Er and 168Er‐enriched isotope were 0.80 and 157.68, respectively. Compared with them, in the HIDA assays of the sample 1, 2, and 3, R 161/163 changed from 8.21±0.05, 4.18±0.04, to 2.78±0.05; and R 168/166 changed from 11.29±0.07, 5.42±0.04, to 3.20±0.05. Therefore, the DNA targets coupled RPs with CPs and resulted in the change of R RPs/DPs. Table 1 shows the results of absolute quantification of BA and SARS targets in the sample 1, 2, and 3, according to the measured isotope ratios, the amount of DPs spiked, and the isotope dilution equations (Supporting Information, Equations S1 and S2). To validate the accuracy of the HIDA method, the UV absorption spectroscopy was applied to quantify the amount of BA and SARS targets in the samples by measuring optical density in 260 nm. These results could be considered as reference values, and the results obtained by the HIDA method were in good agreement with them. The recovery was 93.7–106.5 %, which indicated that the proposed approach was an accurate method. Furthermore, the multiplexing ability of this method could be extended by simultaneously detecting more isotopes of REEs. However, as one DNA target required two isotopes of REEs for the absolute analysis, its multiplexing capability was reduced compared with the relative approach mentioned above. Furthermore, compared with species‐specific or species‐unspecific isotope dilution methods in proteomics, HIDA for DNA analysis, taking advantage of sequence‐specific hybridization reactions, led to absolute quantification without using chromatographic or electrophoretic separation techniques.
Figure 4.

ICP‐MS profile spectra of three samples (1, 2, 3). Scan regions were m/z 160.5–161.5, 162.5–163.5, 165.5–166.5, and 167.5–168.5, with a dwell time of 50 ms. The results of isotope ratios of five determinations averaged were: I 161/I 163=8.21±0.05 (1), 4.18±0.04 (2), 2.78±0.05 (3) and I 168/I 166=11.29±0.07 (1), 5.42±0.04 (2), 3.20±0.05 (3).
Table 1.
Absolute quantification analysis of two DNA targets.
|
BA Targets |
SARS Targets |
|||
|---|---|---|---|---|
|
Sample |
determined results [ng][a] |
reference results [ng][b] |
determined results [ng][a] |
reference results [ng][b] |
|
1 |
93.5±0.8 |
98.6±1.7 |
53.5±0.7 |
57.1±1.9 |
|
2 |
212.1±1.7 |
203.1±2.6 |
126.2±1.3 |
130.4±2.7 |
|
3 |
363.9±2.6 |
373.3±4.7 |
246.3±1.9 |
231.3±3.6 |
[a] Determined by the HIDA method (n=5). [b] Determined by UV absorption spectrometry at 260 nm (n=5).
In conclusion, we have demonstrated a novel elemental labeling method for the absolute and relative quantification of multiplex DNA assays. This is the first report that thiol‐functionalized DNA was covalently coupled with REEs by MMA‐DOTA, and 15 DNA targets could simultaneously be detected in a single analysis. Furthermore, the isotope dilution analysis based on hydrolization reactions was successfully achieved for absolute DNA quantification. The method features high‐level multiplexing and precise quantification for DNA analysis. It is noteworthy that because the elemental tags labeled with DNA probes are not limited to REEs, this method could be further extended in its multiplexing by the use of other elements or isotopes, such as noble and transition metals. Furthermore, in contrast to other molecular detection techniques, the signal of ICP‐MS is independent of the species and sample matrix, which would provide accurate determination in the real samples. Although this work is a proof‐of‐concept study, it could be anticipated that this method would boost the development of genetic analysis research and has potential applications in molecular diagnostics of personalized medicine. Our ongoing work will investigate the feasibility of elemental labeling strategy in the field of absolute‐quantitative PCR assay and high‐throughput multiplex DNA sequencing.
Supporting information
As a service to our authors and readers, this journal provides supporting information supplied by the authors. Such materials are peer reviewed and may be re‐organized for online delivery, but are not copy‐edited or typeset. Technical support issues arising from supporting information (other than missing files) should be addressed to the authors.
miscellaneous_information
This work was supported by the 973 Program (2013CB933800) and the National Natural Science Foundation of China (21027013; 21075075).
References
- 1.
- 1a. Collins F. S., Green E. D., Guttmacher A. E., Guyer M. S., Nature 2003, 422, 835–847; [DOI] [PubMed] [Google Scholar]
- 1b. Huys I., Matthijs G., Van Overwalle G., Nat. Rev. Genet. 2012, 13, 441–447. [DOI] [PubMed] [Google Scholar]
- 2.
- 2a. Sassolas A., Leca‐Bouvier B. D., Blum L. J., Chem. Rev. 2008, 108, 109–139; [DOI] [PubMed] [Google Scholar]
- 2b. Cutler J. I., Auyeung E., Mirkin C. A., J. Am. Chem. Soc. 2012, 134, 1376–1391. [DOI] [PubMed] [Google Scholar]
- 3.
- 3a. Wang L., O’Donoghue M. B., Tan W., Nanomedicine 2006, 1, 413–426; [DOI] [PubMed] [Google Scholar]
- 3b. Song S., Liang Z., Zhang J., Wang L., Li G., Fan C., Angew. Chem. 2009, 121, 8826–8830; [DOI] [PubMed] [Google Scholar]; Angew. Chem. Int. Ed. 2009, 48, 8670–8674; [DOI] [PubMed] [Google Scholar]
- 3c. Geissler D., Charbonniere L. J., Ziessel R. F., Butlin N. G., Loehmannsroeben H.‐G., Hildebrandt N., Angew. Chem. 2010, 122, 1438–1443; [Google Scholar]; Angew. Chem. Int. Ed. 2010, 49, 1396–1401; [DOI] [PubMed] [Google Scholar]
- 3d. Shiddiky M. J. A., Torriero A. A. J., Zeng Z., Spiccia L., Bond A. M., J. Am. Chem. Soc. 2010, 132, 10053–10063; [DOI] [PubMed] [Google Scholar]
- 3e. Browne K. A., Deheyn D. D., El‐Hiti G. A., Smith K., Weeks I., J. Am. Chem. Soc. 2011, 133, 14637–14648. [DOI] [PubMed] [Google Scholar]
- 4.
- 4a. Zentilin L., Giacca M., Nat. Protoc. 2007, 2, 2092–2104; [DOI] [PubMed] [Google Scholar]
- 4b. Durner J., Angew. Chem. 2010, 122, 1042–1068; [Google Scholar]; Angew. Chem. Int. Ed. 2010, 49, 1026–1051. [DOI] [PubMed] [Google Scholar]
- 5.
- 5a. Zheng W., He L., J. Am. Chem. Soc. 2009, 131, 3432–3433; [DOI] [PubMed] [Google Scholar]
- 5b. Yang Y., Zhao L., Trac Trends Anal. Chem. 2010, 29, 980–1003. [Google Scholar]
- 6.
- 6a. Stoeva S. I., Lee J. S., Thaxton C. S., Mirkin C. A., Angew. Chem. 2006, 118, 3381–3384; [Google Scholar]; Angew. Chem. Int. Ed. 2006, 45, 3303–3306; [DOI] [PubMed] [Google Scholar]
- 6b. Resch‐Genger U., Grabolle M., Cavaliere‐Jaricot S., Nitschke R., Nann T., Nat. Methods 2008, 5, 763–775. [DOI] [PubMed] [Google Scholar]
- 7.
- 7a. Han M. Y., Gao X. H., Su J. Z., Nie S., Nat. Biotechnol. 2001, 19, 631–635; [DOI] [PubMed] [Google Scholar]
- 7b. Dejneka M. J., Streltsov A., Pal S., Frutos A. G., Powell C. L., Yost K., Yuen P. K., Muller U., Lahiri J., Proc. Natl. Acad. Sci. USA 2003, 100, 389–393; [DOI] [PMC free article] [PubMed] [Google Scholar]
- 7c. Wilson R., Cossins A. R., Spiller D. G., Angew. Chem. 2006, 118, 6250–6263; [Google Scholar]; Angew. Chem. Int. Ed. 2006, 45, 6104–6117; [DOI] [PubMed] [Google Scholar]
- 7d. Pregibon D. C., Toner M., Doyle P. S., Science 2007, 315, 1393–1396. [DOI] [PubMed] [Google Scholar]
- 8.
- 8a. Li Y. G., Cu Y. T. H., Luo D., Nat. Biotechnol. 2005, 23, 885–889; [DOI] [PMC free article] [PubMed] [Google Scholar]
- 8b. Birtwell S., Morgan H., Integr. Biol. 2009, 1, 345–362. [DOI] [PMC free article] [PubMed] [Google Scholar]
- 9.
- 9a. Prange A., Proefrock D., J. Anal. At. Spectrom. 2008, 23, 432–459; [Google Scholar]
- 9b. Sanz‐Medel A., Montes‐Bayon M., del Rosario Fernandez de La Campa M., Encinar J. R., Bettmer J., Anal. Bioanal. Chem. 2008, 390, 3–16. [DOI] [PubMed] [Google Scholar]
- 10.
- 10a. Lou X., Zhang G., Herrera I., Kinach R., Ornatsky O., Baranov V., Nitz M., Winnik M. A., Angew. Chem. 2007, 119, 6223–6226; [DOI] [PMC free article] [PubMed] [Google Scholar]; Angew. Chem. Int. Ed. 2007, 46, 6111–6114; [DOI] [PMC free article] [PubMed] [Google Scholar]
- 10b. Ornatsky O. I., Kinach R., Bandura D. R., Lou X., Tanner S. D., Baranov V. I., Nitz M., Winnik M. A., J. Anal. At. Spectrom. 2008, 23, 463–469; [DOI] [PMC free article] [PubMed] [Google Scholar]
- 10c. Terenghi M., Elviri L., Careri M., Mangia A., Lobinski R., Anal. Chem. 2009, 81, 9440–9448; [DOI] [PubMed] [Google Scholar]
- 10d. Yan X., Yang L., Wang Q., Angew. Chem. 2011, 123, 5236–5239; [Google Scholar]; Angew. Chem. Int. Ed. 2011, 50, 5130–5133; [DOI] [PubMed] [Google Scholar]
- 10e. Giesen C., Mairinger T., Khoury L., Waentig L., Jakubowski N., Panne U., Anal. Chem. 2011, 83, 8177–8183. [DOI] [PubMed] [Google Scholar]
- 11.
- 11a. Bettmer J., Montes Bayon M., Ruiz Encinar J., Fernandez Sanchez M. L., del Rosario Fernandez de La Campa M., Sanz Medel A., J. Proteomics 2009, 72, 989–1005; [DOI] [PubMed] [Google Scholar]
- 11b. Tholey A., Schaumloeffel D., Trac Trends Anal. Chem. 2010, 29, 399–408. [Google Scholar]
- 12.
- 12a. Zhang C., Wu F. B., Zhang Y. Y., Wang X., Zhang X. R., J. Anal. At. Spectrom. 2001, 16, 1393–1396; [Google Scholar]
- 12b. Baranov V. I., Quinn Z., Bandura D. R., Tanner S. D., Anal. Chem. 2002, 74, 1629–1636; [DOI] [PubMed] [Google Scholar]
- 12c. Zhang C., Zhang Z. Y., Yu B. B., Shi J. J., Zhang X. R., Anal. Chem. 2002, 74, 96–99; [DOI] [PubMed] [Google Scholar]
- 12d. Zhang S. C., Zhang C., Xing Z., Zhang X. R., Clin. Chem. 2004, 50, 1214–1221; [DOI] [PubMed] [Google Scholar]
- 12e. Hu S., Zhang S., Hu Z., Xing Z., Zhang X., Anal. Chem. 2007, 79, 923–929; [DOI] [PubMed] [Google Scholar]
- 12f. Liu R., Liu X., Tang Y., Wu L., Hou X., Lv Y., Anal. Chem. 2011, 83, 2330–2336; [DOI] [PubMed] [Google Scholar]
- 12g. Waentig L., Jakubowski N., Hardt S., Scheler C., Roos P. H., Linscheid M. W., J. Anal. At. Spectrom. 2012, 27, 1311–1320. [Google Scholar]
- 13.
- 13a. Pereira Navaza A., Encinar J. R., Sanz‐Medel A., Angew. Chem. 2007, 119, 575–577; [DOI] [PubMed] [Google Scholar]; Angew. Chem. Int. Ed. 2007, 46, 569–571; [DOI] [PubMed] [Google Scholar]
- 13b. Liu R., Lv Y., Hou X., Yang L., Mester Z., Anal. Chem. 2012, 84, 2769–2775; [DOI] [PubMed] [Google Scholar]
- 13c. Yan X., Luo Y., Zhang Z., Li Z., Luo Q., Yang L., Zhang B., Chen H., Bai P., Wang Q., Angew. Chem. 2012, 124, 3414–3419; [DOI] [PubMed] [Google Scholar]; Angew. Chem. Int. Ed. 2012, 51, 3358–3363. [DOI] [PubMed] [Google Scholar]
- 14.
- 14a. Ornatsky O. I., Lou X., Nitz M., Schaefer S., Sheldrick W. S., Baranov V. I., Bandura D. R., Tanner S. D., Anal. Chem. 2008, 80, 2539–2547; [DOI] [PubMed] [Google Scholar]
- 14b. Bendall S. C., Simonds E. F., Qiu P., Amir E.‐a. D., Krutzik P. O., Finck R., Bruggner R. V., Melamed R., Trejo A., Ornatsky O. I., Balderas R. S., Plevritis S. K., Sachs K., Pe’er D., Tanner S. D., Nolan G. P., Science 2011, 332, 687–696. [DOI] [PMC free article] [PubMed] [Google Scholar]
- 15.
- 15a. Merkoçi A., Aldavert M., Tarrason G., Eritja R., Alegret S., Anal. Chem. 2005, 77, 6500–6503; [DOI] [PubMed] [Google Scholar]
- 15b. Kerr S. L., Sharp B., Chem. Commun. 2007, 4537–4539; [DOI] [PubMed] [Google Scholar]
- 15c. Han G., Xing Z., Dong Y., Zhang S., Zhang X., Angew. Chem. 2011, 123, 3524–3527; [Google Scholar]; Angew. Chem. Int. Ed. 2011, 50, 3462–3465. [DOI] [PubMed] [Google Scholar]
- 16.
- 16a. Rappel C., Schaumloeffel D., Anal. Chem. 2009, 81, 385–393; [DOI] [PubMed] [Google Scholar]
- 16b. Bettmer J., Anal. Bioanal. Chem. 2010, 397, 3495–3502; [DOI] [PubMed] [Google Scholar]
- 16c. Sanz‐Medel A., Anal. Bioanal. Chem. 2010, 398, 1853–1859. [DOI] [PubMed] [Google Scholar]
- 17.
- 17a. Whetstone P. A., Butlin N. G., Corneillie T. M., Meares C. F., Bioconjugate Chem. 2004, 15, 3–6; [DOI] [PubMed] [Google Scholar]
- 17b. Jakubowski N., Waentig L., Hayen H., Venkatachalam A., von Bohlen A., Roos P. H., Manz A., J. Anal. At. Spectrom. 2008, 23, 1497–1507; [Google Scholar]
- 17c. Kretschy D., Koellensperger G., Hann S., Metallomics 2011, 3, 1304–1309. [DOI] [PMC free article] [PubMed] [Google Scholar]
- 18.
- 18a. Gerber S. A., Rush J., Stemman O., Kirschner M. W., Gygi S. P., Proc. Natl. Acad. Sci. USA 2003, 100, 6940–6945; [DOI] [PMC free article] [PubMed] [Google Scholar]
- 18b. Wiese S., Reidegeld K. A., Meyer H. E., Warscheid B., Proteomics 2007, 7, 340–350; [DOI] [PubMed] [Google Scholar]
- 18c. Diez Fernández S., Sugishama N., Ruiz Encinar J., Sanz‐Medel A., Anal. Chem. 2012, 84, 5851–5857. [DOI] [PubMed] [Google Scholar]
Associated Data
This section collects any data citations, data availability statements, or supplementary materials included in this article.
Supplementary Materials
As a service to our authors and readers, this journal provides supporting information supplied by the authors. Such materials are peer reviewed and may be re‐organized for online delivery, but are not copy‐edited or typeset. Technical support issues arising from supporting information (other than missing files) should be addressed to the authors.
miscellaneous_information