Abstract
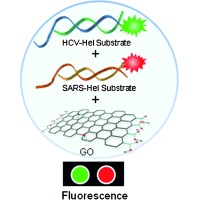
A GO‐to solution: A simple graphene oxide (GO)‐based assay to screen for selective inhibitors of a hepatitis C virus (HCV) helicase along with inhibitors of a severe acute respiratory syndrome coronavirus (SARS CoV) helicase was tested (see scheme). A single screen found five inhibitors highly selective for the HCV helicase orthologous to the SARS CoV helicase. Some of these hits were validated using the same GO‐based assay.
Keywords: biosensors, graphene oxide, high‐throughput screening, helicases, multiplex assays
Worldwide, over 170 million people have hepatitis C virus (HCV) infections.1 Chronic infection with HCV leads to liver diseases such as cirrhosis and hepatocarcinoma and is the major reason of liver transplantation.2 Currently, the standard treatment for hepatitis C relies on a combination of interferon‐α and ribavirin (an immune booster and a general inhibitor of virus replication, respectively) which is associated with serious side effects including hemolytic anaemia, depression, fatigue, flu‐like symptoms, and birth defects.3 The standard of care is frequently ineffective in clearing HCV infections and the virus often survives and thrives even under the treatment.
To develop direct‐acting antiviral agents for hepatitis C treatment, studies have been focused on the discovery of inhibitors of viral enzymes, specifically nonstructural protein 3 (NS3) serine protease and NS5B RNA‐dependent RNA polymerase (RdRp).4 Last year, new drugs for treating hepatitis C, Telaprevir (Vertex) and Boceprevir (Merck) , which are NS3 serine protease inhibitors, were approved by the U.S. Food and Drug Administration (FDA), and over 30 drug candidates targeting the same protease or NS5B RdRp are currently in clinical trials.5 Although phase III clinical trials of Telaprevir and Boceprevir showed notable increases in the cure rate, nearly every patient still suffered from at least one side effect of the new therapy.5b,c, 6 In addition, HCV has strong drug resistance due to its high mutability. Thus, further therapeutic options are urgently needed to treat HCV infections more effectively.
The C‐terminal two thirds of HCV NS3 forms a helicase, which has the ability to unwind double‐stranded DNA (dsDNA) into single‐stranded DNA (ssDNA) and is fueled by nucleoside triphosphates (NTPs) hydrolyzed by its NTPase domain.7 NS3 helicase is one of the essential enzymes of HCV along with NS3 serine protease and NS5B RdRp for processing HCV proteins and replication of HCV. Thus, the inhibition of helicase activities is an important strategy for treating HCV infections.8 However, discovery of helicase inhibitors has been much slower compared to that of other HCV drug targets.
To date, only a few classes of NS3 helicase inhibitors have been reported, partly because high‐throughput screens have yielded only a few successful hits.8a,c For example, the compounds discovered in the NIH screen based on the molecular‐beacon‐based helicase assay (MBHA) showed poor activity in cells and turned out to interfere with the assay,9a even though another MBHA screening identified compounds that inhibited RNA replication in cells.9b Therefore, there is an urgent need for new assays to measure helicase activity that are suitable for high‐throughput screens.
Herein, we developed a multiplexed helicase assay based on graphene oxide (GO) for high‐throughput screening of inhibitors of HCV NS3 helicase and severe acute respiratory syndrome coronavirus (SARS CoV) helicase. Previously, we reported a GO‐based helicase assay (GOHA), which relied on the preferential binding of ssDNA over dsDNA to the GO surface and subsequent quenching of the fluorescently labeled ssDNA by energy transfer from the dyes to the GO, and we validated the assay using SARS CoV helicase.10 Herein, we show that the GOHA can be used for measuring the activities of HCV NS3 helicase and SARS CoV helicase in a single mixed solution using two distinct DNA substrates tethered to different fluorophores, and furthermore, for multiplexed high‐throughput screening to discover highly selective small‐molecule inhibitors of these helicases (Figure 1). One round of screening the chemical library using the multiplexed GOHA (mGOHA) revealed three classes of inhibitors—specific inhibitors of HCV NS3 helicase, specific inhibitors of SARS CoV helicase, and general inhibitors of both helicases. To date, GO has been used to develop various biosensors and enzyme assays,10, 11 but concerns about the heterogeneity of the chemical structure and the physical dimensions of GO and nonspecific binding of biomolecules to GO hamper the application of GO‐based assays in high‐throughput parallel assays for drug discovery that require high robustness and reproducibility. Herein, we show that GO can be used for the discovery of potent small‐molecule drug candidates and also determine the specificity and relative effectiveness towards each helicase of each of the identified hits.
Figure 1.
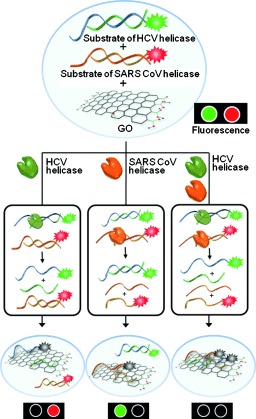
Multiplexed GOHA (mGOHA) with two different helicases acting on two distinct dsDNA substrates. Using a mixture of dsDNAs and GO, the activities of multiple helicases can be easily measured.
First, GO sheets were prepared by using a modified Hummers’ method.10, 12 The thickness of the prepared GO sheets was 0.97 nm and the width was 0.01–4 μm, which were determined by atomic force microscopy (AFM; Supporting Information, Figure S1 a). The IR spectrum of GO showed peaks at 3395, 1716, 1225, and 1079 cm−1 corresponding to O—H stretching vibration, C=O stretching vibration, C—O (epoxy) vibration, and C—O (alkoxy) vibration (Figure S1 b). The Raman spectrum of GO had strong D‐ and G‐band absorptions at 1351 and 1589 cm−1, respectively, which are characteristic for GO (Figure S1 c). Collectively, water‐dispersible GO sheets were successfully prepared.
To measure the orthogonal activity of SARS CoV and HCV NS3 helicases, either or both helicases were added to a mixture of GO and two DNA substrates—a Cy3‐labeled DNA duplex as the SARS CoV helicase substrate (Cy3‐DNA‐SH) and a Cy5‐labeled DNA duplex as the HCV NS3 helicase substrate (Cy5‐DNA‐HH; Figure S2 a).13 Fluorescence intensities corresponding to Cy3 (Ex/Em=550/570 nm) and Cy5 (Ex/Em=650/670 nm) showed little change without the addition of helicase over 60 min (Figure 2 a). The addition of SARS CoV helicase led to a dramatic decrease in fluorescence intensity for Cy3 only, while Cy5 fluorescence intensity only showed a very small change, suggesting that the Cy3‐labeled DNA duplex was mainly unwound, and subsequently, the interaction of the generated Cy3‐labeled ssDNA with GO resulted in the quenching of the Cy3 fluorescence (Figure 2 b). This data indicated that the unwinding activity of the SARS CoV helicase was specific to its corresponding DNA substrate. Conversely, the addition of HCV NS3 helicase caused a significant decrease in fluorescence intensity of Cy5, but not Cy3 (Figure 2 c). The addition of both helicases led to a decrease in both Cy3 and Cy5 fluorescence, down to zero, indicating the unwinding of both DNA duplexes by the two helicases (Figure 2 d). Fluorescent images of the reaction mixtures taken after 30 minutes of incubation showed clearly distinguishable activity for each helicase (Figure 2 e).
Figure 2.
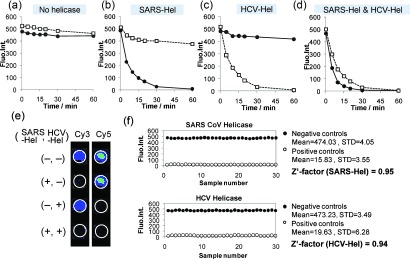
Validation of the mGOHA. Cy3 and Cy5 fluorescence intensities of a mixed solution of the two dsDNA substrates in a) the absence of helicases, b) with SARS CoV helicase, c) with HCV NS3 helicase, and d) with both helicases. a–d) Circles: Cy3‐DNA‐SH; Squares: Cy5‐DNA‐HH. e) Fluorescent images of the reaction mixtures prepared in a 96‐well plate at two different wavelengths corresponding to Cy3 and Cy5 fluorescence, after a 30 min incubation. f) The Z′‐factor was calculated for the mGOHA from 30 replicates of each control assay. STD=standard deviation.
To assess the quality of the mGOHA for screening, the Z′‐factor, a parameter widely used to evaluate the robustness and quality of screening assays,14 was determined. Generally, high‐performance assays have Z′‐factors of 0.75 or higher.15 To calculate the Z′‐factor, we ran 30 positive and 30 negative control reactions, calculated the mean (μ c+ and μ c− for the positive and negative controls, respectively) and standard deviations (σ c+ and σ c−), and used an equation shown in Figure S2b. The Z′‐factor of the mGOHA platform for SARS helicase was 0.95 and HCV helicase was 0.94, suggesting that the present GOHA is better and more robust than other established assays (Figure 2 f).
A 96‐well plate mGOHA was used to screen a 10 000 compound library to discover inhibitors of SARS CoV helicase and HCV NS3 helicase (Figure 3). A mixture of library compounds and both helicases were prepared and added to mixed solutions of Cy3‐DNA‐SH, Cy5‐DNA‐HH, and GO that were prepared separately. In the primary screen, the library compounds, helicases, and substrates were used at concentrations of 1 mm, 2 nm, and 10 nm, with a total volume of 60 μL for each mixture. After incubation for 30 minutes at 25 °C, the Cy3 and Cy5 fluorescence was measured using an IVIS fluorescence imaging system (Figure 3; Figure S3). Positive controls were performed with Cy3‐DNA‐SH and Cy5‐DNA‐HH and both helicases, in the absence of library, and negative controls were with Cy3‐DNA‐SH and Cy5‐DNA‐HH, excluding any helicases or compounds. Out of the 10 000 small molecules, 26 specific inhibitors of SARS CoV helicase and 22 of HCV NS3 helicase were found, and 24 compounds were found to inhibit both helicases (≥50 % inhibition).
Figure 3.
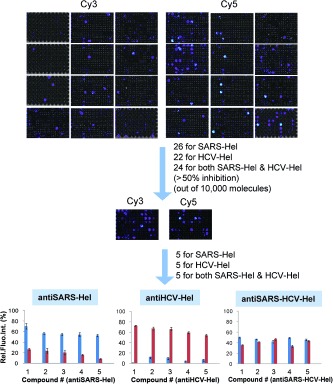
A small‐molecule screen identified three sets of inhibitors—specific for SARS CoV helicase, specific for HCV NS3 helicase, and nonspecific helicase inhibitors. Top) Representative fluorescent images from the primary screen carried out with 10 000 small molecules in 96‐well plates. Cy3 and Cy5 signals represent the inhibition of helicase activities for SARS CoV and HCV NS3, respectively. Bottom) Using the 72 compounds selected from the initial screens, a secondary screen was performed in quintuplicate revealing the top 15 inhibitors. Blue bars=SARS‐Hel; Red bars=HCV‐Hel.
We further characterized the discovered inhibitors to quantitatively evaluate their inhibitory effects towards the respective helicases. First, to increase the fidelity of the data and to eliminate false positive hits owing to poor solubility of the compounds, we performed a secondary screening in replicates of five with the selected compounds from the primary screen (72 total compounds) while carefully observing the reaction mixtures for precipitation. In the secondary screen, the selectivity towards each helicase and the degree of inhibition were comparable to the primary screen. Out of 72, 25 compounds showed severe precipitation and were excluded from the final selection. Finally, we selected the 15 most‐potent compounds including five SARS CoV helicase selective inhibitors (antiSARS‐Hel‐1–5), five HCV NS3 helicase selective inhibitors (antiHCV‐Hel‐1–5), and five inhibitors of both helicases (antiSARS‐HCV‐Hel‐1–5). The chemical formulas of the selected compounds are shown in Figure S3. Dose‐dependent inhibition of SARS CoV helicase and HCV NS3 helicase were measured with varying concentrations of inhibitor using GOHA, and the half‐maximal inhibitory concentration (IC50) was calculated (Figure 4 a). The antiSARS‐Hels and antiHCV‐Hels had IC50 values of 49.3–104.6 μm and 51.6–92.0 μm, respectively. We found that antiSARS‐HCV‐Hel‐1–5 had higher IC50 values than the selective inhibitors, ranging from 103.8 to 537.5 μm for SARs CoV helicase and from 103.5 to 441.1 μm for HCV NS3 helicase. Previously known helicase inhibitors generally exhibit IC50 values ranging from 1–1000 μm.8b We expect that a structure–activity relationship (SAR) study could further optimize these hits. The GOHA system can also be used for an SAR study. The dose‐response data and fitted IC50 curves are shown in Figure S5.
Figure 4.
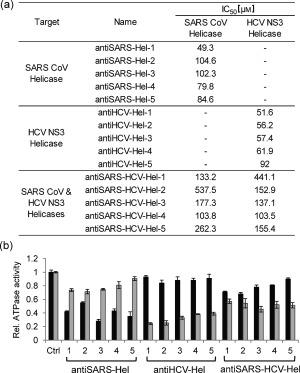
Quantitative evaluation of the 15 helicase inhibitors identified and their inhibition of the ATPase activities of the helicases. a) IC50 values of the 15 small molecules screened (chemical formulas are shown in the Supporting Information). b) ATPase activity of the helicases, measured in the presence of the inhibitors. Black bars=SARS helicase; Gray bars=HCV helicase.
We next investigated the mechanism of the inhibitory effects for the discovered compounds. First, we determined whether antiSARS‐HCV‐Hels bind to dsDNA because the low selectivity between the two types of helicases might come from nonspecific binding to dsDNA and thus, slow down the unwinding process. However, isothermal titration calorimetry (ITC) and NMR spectroscopy showed no interaction between the antiSARS‐HCV‐Hel‐1–5 and dsDNA (Figures S7–S9). We next determined whether the 15 compounds had any inhibition of the ATPase activities of the helicases (Figure 4 b). SARS‐Hel and HCV‐Hel possess an ATPase domain for the catalytic hydrolysis of ATP. We used a commercial kit to analyze the ATPase activities of both helicases in the presence of the 15 inhibitors. We found that all of the antiSARS‐Hels except for antiSARS‐Hel‐2 showed a significantly higher inhibition of the ATPase activity of SARS CoV helicase than HCV NS3 helicase; all the antiHCV‐Hels showed a much higher inhibition of ATPase activity of HCV NS3 helicase than SARS CoV helicase. AntiSARS‐HCV‐Hel‐1 and ‐2 blocked the ATPase activities of both helicases to a similar degree. The antiSARS‐HCV‐Hel‐3–5 inhibited the ATPase activity of HCV NS3 helicase more effectively than that of the SARS CoV helicase; however, the overall inhibition of antiSARS‐HCV‐Hels on the ATPase activities were not as impressive as that of the antiHCV‐Hels against the ATPase activity of HCV NS3 helicase. Inhibitors selective for each helicase could block the ATPase activity of each helicase with high selectivity. Further studies should be performed to investigate the mode of inhibition—whether the inhibitors bind to the ATP binding sites or induce conformational change by allosteric regulation.
We next measured the inhibition of HCV RNA replication by the 15 selected inhibitors in the human hepatoma cell line Huh‐7 carrying the HCV replicon RNA with luciferase as a reporter gene (Huh‐7 replicon cell).16 The replicon Huh‐7 cells were treated with the 15 inhibitors at concentrations of 0–1000 μm and then lysed, and the luminescence intensity was measured after the addition of luciferin. Separately, the cytotoxicity of each compound was measured in the same cell line using an MTT assay. Relative luciferase signal intensities over relative MTT signal intensities (Luc/MTT) were plotted versus the concentrations of the inhibitors (Figure 5; see Figure S6 for the complete data of the luciferase and MTT assays).17 Two compounds, antiHCV‐Hel‐2 and ‐3, showed a dose‐dependent decrease in the Luc/MTT values with the respective half‐maximal effective concentrations (EC50) of 188.1±32.6 and 56.8±7.4 μm, indicating that they dose‐dependently blocked HCV RNA replication in the cultured Huh‐7 cells (Figure 5 b,c). AntiHCV‐Hel‐2 and ‐3 decreased the luciferase signal by more than 90 % at 1 mm. The other antiHCV‐Hel compounds, antiSARS‐Hel‐5 and all the antiSARS‐HCV‐Hels, were highly cytotoxic showing less than 40 % cell viability at 1 mm. AntiSARS‐Hel‐1–4 showed little reduction in the luciferase signal even at 1 mm. We excluded antiHCV‐Hel‐5 because of its relatively high EC50≈400 μm. Taken together, antiHCV‐Hel‐2 and ‐3, blocked HCV RNA replication in the cells whereas all of the antiSARS‐Hels and antiSARS‐HCV‐Hels showed no appreciable inhibitory effect on HCV RNA replication in cultured cells. These results show that helicase inhibitors should be specific to the corresponding helicase to achieve an inhibitory effect in living cells. In addition, the nonselective inhibitors that moderately reduce the activity of both helicases had a relatively high cytotoxicity, indicating that those compounds should be excluded for further drug development.
Figure 5.
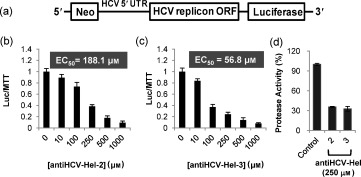
Cell‐based assay to test the inhibition of HCV RNA replication in Huh‐7 liver cells by antiHCV‐Hel‐2 and ‐3. a) A luciferase reporter system based on the expression of the HCV subgenome in Huh‐7 cells with a neomycin antibiotic resistance marker. b, c) To characterize the inhibition of HCV RNA replication in live cells, Huh‐7 liver cells were treated with inhibitors and luciferase signal intensity from the reporter shown in (a) divided by cell viability was plotted versus inhibitor concentrations (to correct for luciferase signal loss from cytotoxicity of the compounds). d) To confirm that the two inhibitors block HCV RNA replication and thus, reduce the expression of HCV enzymes, the HCV NS3 serine protease activity of the Huh‐7 cell lysates was measured following incubation with the two inhibitors.
We further investigated whether the antiHCV‐Hel‐2 and ‐3 could reduce the expression of HCV NS3 serine protease by blocking HCV RNA replication in Huh‐7 cells (Figure 5 d). The cells were first treated with 250 μm of antiHCV‐Hel‐2 and ‐3 at which the luc/MTT values were 0.39 and 0.24, respectively, and the cell viability based on the MTT assay was over 70 %. After cell lysis, the HCV NS3 serine protease activity was measured with a Förster resonance energy transfer (FRET) peptide substrate. Treatment with antiHCV‐Hel‐2 and ‐3 reduced the protease activity in the Huh‐7 cells down to 30 % of that in the untreated cells. This indicates that NS3 serine protease activity was also decreased as a result of the inhibition of HCV RNA replication in living cells by antiHCV‐Hel‐2 and ‐3.
In conclusion, we demonstrated the capability of mGOHA for assaying the activity of two helicases, HCV NS3 and SARS CoV, and applied this mGOHA to a high‐throughput inhibitor screen using a 10 000 small molecule library, which yielded drug candidate molecules. These results illustrate that mGOHA is an important screening technique for drug discovery targeting helicases. GOHA allows for more‐accurate, real‐time, quantitative monitoring of helicase activity by simply following the changes in fluorescence intensity, without requiring any additional separation steps or trapping agents. A multiplexed screen is highly advantageous not only because multiple rounds of screening are combined into one screen to reduce the overall cost and labor, but also because just one round of multiplexed screening provides information on the relative selectivity of the hit compounds towards each target helicase. Given that various GO‐based activity assays have been developed for various enzymes, including nucleases,18a methyltransferases,18 and caspases,11c the present work shows that a GO‐based assay can be used for high‐throughput screening for new inhibitors of various essential enzymes.
For the treatment of HCV infection, the addition of direct‐acting antiviral agents, like inhibitors of NS3 protease, to the standard treatment was recently approved. The addition of multiple drugs acting against independent viral targets should be more effective in controlling infection with a rapidly mutating virus. We expect that the new inhibitors of HCV NS3 helicase discovered herin could be useful as antiviral drugs for the next generation of HCV treatment, with three or more active components. In addition, we expect that GOHA can be used to evaluate helicase activities in a highly parallel manner and of helicase‐inhibitor‐based drugs for various diseases, which has been difficult without a robust helicase assay.
Supporting information
As a service to our authors and readers, this journal provides supporting information supplied by the authors. Such materials are peer reviewed and may be re‐organized for online delivery, but are not copy‐edited or typeset. Technical support issues arising from supporting information (other than missing files) should be addressed to the authors.
miscellaneous_information
This work was supported by the Basic Science Research Program (2011‐0017356 for D.‐H. M., 2009‐0092818, 2011‐0020322 for B.‐S. C. and 2010‐0019306, 2011‐0016385 for D.‐E. K.), the EPB Center (2008‐0062042), and by the Research Center Program (EM1202) of the Institute for Basic Science (D.‐H. M.) through the National Research Foundation of Korea (NRF) funded by the Korean government (MEST).
References
- 1.
- 1a. Perz J. F., Armstrong G. L., Farrington L. A., Hutin Y. J. F., Bell B. P., J. Hepatol. 2006, 45, 529; [DOI] [PubMed] [Google Scholar]
- 1b. Choo Q. L., Kuo G., Weiner A. J., Overby L. R., Bradley D. W., Houghton M., Science 1989, 244, 359; 2523562 [Google Scholar]
- 1c. De Francesco R., Migliaccio G., Nature 2005, 436, 953. [DOI] [PubMed] [Google Scholar]
- 2.
- 2a. Poynard T., Bedossa P., Opolon P., Lancet 1997, 349, 825; [DOI] [PubMed] [Google Scholar]
- 2b. Planas R., Balleste B., Alvarez M. A., Rivera M., Montoliu S., Galeras J. A., Santos J., Coll S., Morillas R. M., Sola R., J. Hepatol. 2004, 40, 823. [DOI] [PubMed] [Google Scholar]
- 3.
- 3a. Schaefer M., Schmidt F., Folwaczny C., Lorenz R., Martin G., Schindlbeck N., Heldwein W., Soyka M., Grunze H., Koenig A., Loeschke K., Hepatology 2003, 37, 443; [DOI] [PubMed] [Google Scholar]
- 3b. Kowdley K. V., J. Clin. Gastroenterol. 2005, 39, S3. [Google Scholar]
- 4.
- 4a. Meylan E., Curran J., Hofmann K., Moradpour D., Binder M., Bartenschlager R., Tschopp J., Nature 2005, 437, 1167; [DOI] [PubMed] [Google Scholar]
- 4b. Koch U., Narjes F., Infect. Disord.: Drug Targets 2006, 6, 31; [DOI] [PubMed] [Google Scholar]
- 4c. Beaulieu P. L., Curr. Opin. Invest. Drugs 2007, 8, 614. [PubMed] [Google Scholar]
- 5.
- 5a. Sherman K. E., Flamm S. L., Afdhal N. H., Nelson D. R., Sulkowski M. S., Everson G. T., Fried M. W., Adler M., Reesink H. W., Martin M., Sankoh A. J., Adda N., Kauffman R. S., George S., Wright C. I., Poordad F., N. Engl. J. Med. 2011, 365, 1014; [DOI] [PMC free article] [PubMed] [Google Scholar]
- 5b. Bacon B. R., Gordon S. C., Lawitz E., Marcellin P., Vierling J. M., Zeuzem S., Poordad F., Goodman Z. D., Sings H. L., Boparai N., Burroughs M., Brass C. A., Albrecht J. K., Esteban R., N. Engl. J. Med. 2011, 364, 1207; [DOI] [PMC free article] [PubMed] [Google Scholar]
- 5c. Poordad F., J. McCone, Jr. , Bacon B. R., Bruno S., Manns M. P., Sulkowski M. S., Jacobson I. M., Reddy K. R., Goodman Z. D., Boparai N., DiNubile M. J., Sniukiene V., Brass C. A., Albrecht J. K., Bronowicki J. P., N. Engl. J. Med. 2011, 364, 1195. [DOI] [PMC free article] [PubMed] [Google Scholar]
- 6.
- 6a. Hézode C., Forestier N., Dusheiko G., Ferenci P., Pol S., Goeser T., Bronowicki J. P., Bourliere M., Gharakhanian S., Bengtsson L., McNair L., George S., Kieffer T., Kwong A., Kauffman R. S., Alam J., Pawlotsky J. M., Zeuzem S., N. Engl. J. Med. 2009, 360, 1839; [DOI] [PubMed] [Google Scholar]
- 6b. McHutchison J. G., Manns M. P., Muir A. J., Terrault N. A., Jacobson I. M., Afdhal N. H., Heathcote E. J., Zeuzem S., Reesink H. W., Garg J., Bsharat M., George S., Kauffman R. S., Adda N., Di Bisceglie A. M., N. Engl. J. Med. 2010, 362, 1292. [DOI] [PubMed] [Google Scholar]
- 7.
- 7a. Dumont S., Cheng W., Serebrov V., Beran R. K., I. Tinoco, Jr. , Pyle A. M., Bustamante C., Nature 2006, 439, 105; [DOI] [PMC free article] [PubMed] [Google Scholar]
- 7b. Velankar S. S., Soultanas P., Dillingham M. S., Subramanya H. S., Wigley D. B., Cell 1999, 97, 75; [DOI] [PubMed] [Google Scholar]
- 7c. Kim D.‐E., Narayan M., Patel S. S., J. Mol. Biol. 2002, 321, 807; [DOI] [PubMed] [Google Scholar]
- 7d. Singleton M. R., Sawaya M. R., Ellenberger T., Wigley D. B., Cell 2002, 101, 589. [DOI] [PubMed] [Google Scholar]
- 8.
- 8a. Frick D. N., Curr. Issues Mol. Biol. 2007, 9, 1; [PMC free article] [PubMed] [Google Scholar]
- 8b. Borowski P., Niebuhr A., Schmitz H., Hosmane R. S., Bretner M., Siwecka M. A., Kulikowski T., Acta. Biochim. Pol. 2002, 49, 597; [PubMed] [Google Scholar]
- 8c. Belon C. A., Frick D. N., Future Virol. 2009, 4, 277. [DOI] [PMC free article] [PubMed] [Google Scholar]
- 9a. Mukherjee S., Hanson A. M., Shadrick W. R., Ndjomou J., Sweeney N. L., Hernandez J. J., Bartczak D., Li K., Frankowski K. J., Heck J. A., Arnold L. A., Schoenen F. J., Frick D. N., Nucleic Acids Res. 2012, 40, 8611; [DOI] [PMC free article] [PubMed] [Google Scholar]
- 9b. Li K., Frankowski K. J., Belon C. A., Neuenswander B., Ndjomou J., Hanson A. M., Shanahan M. A., Schoenen F. J., Blagg B. S. J., Aube J., Frick D. N., J. Med. Chem. 2012, 55, 3319. [DOI] [PMC free article] [PubMed] [Google Scholar]
- 10. Jang H., Kim Y.‐K., Kwon H.‐M., Yeo W.‐S., Kim D.‐E., Min D.‐H., Angew. Chem. 2010, 122, 5839; [DOI] [PMC free article] [PubMed] [Google Scholar]; Angew. Chem. Int. Ed. 2010, 49, 5703. [Google Scholar]
- 11.
- 11a. Lu C. H., Yang H. H., Zhu C. L., Chen X., Chen G. N., Angew. Chem. 2009, 121, 4879; [Google Scholar]; Angew. Chem. Int. Ed. 2009, 48, 4785; [Google Scholar]
- 11b. Lee J., Kim Y.‐K., Min D.‐H., J. Am. Chem. Soc. 2010, 132, 14714; [DOI] [PubMed] [Google Scholar]
- 11c. Wang H., Zhang Q., Chu X., Chen T., Ge J., Yu R., Angew. Chem. 2011, 123, 7203; [DOI] [PubMed] [Google Scholar]; Angew. Chem. Int. Ed. 2011, 50, 7065. [Google Scholar]
- 12. Hummers W. S., Offeman R. E., J. Am. Chem. Soc. 1958, 80, 1339. [Google Scholar]
- 13.
- 13a. Jang K. J., Lee N.‐R., Yeo W.‐S., Jeong Y.‐J., Kim D.‐E., Biochem. Biophys. Res. Commun. 2008, 366, 738; [DOI] [PMC free article] [PubMed] [Google Scholar]
- 13b. Myong S., Bruno M. M., Pyle A. N., Ha T., Science 2007, 317, 513. [DOI] [PMC free article] [PubMed] [Google Scholar]
- 14. Zhang J.‐H., Chung T. D. Y., Oldenburg K. R., J. Biomol. Screening 1999, 4, 67. [DOI] [PubMed] [Google Scholar]
- 15. Min D.‐H., Tang W.‐J., Mrksich M., Nat. Biotechnol. 2004, 22, 717. [DOI] [PubMed] [Google Scholar]
- 16.
- 16a. Pietschmann T., Lohmann V., Rutter G., Kurpanek K., Bartenschlager R., J. Virol. 2001, 75, 1252; [DOI] [PMC free article] [PubMed] [Google Scholar]
- 16b. Lohmann V., Hoffmann S., Herian U., Penin F., Bartenschlager R., J. Virol. 2003, 77, 3007. [DOI] [PMC free article] [PubMed] [Google Scholar]
- 17. Zhao H., Lin W., Kumthip K., Cheng D., Fusco D. N., Hofmann O., Jilg N., Tai A. W., Goto K., Zhang L., Hide W., Jang J. Y., Peng L. F., Chung R. T., J. Hepatol. 2012, 56, 326. [DOI] [PMC free article] [PubMed] [Google Scholar]
- 18.
- 18a. Lee J., Min D.‐H., Analyst 2012, 137, 2024; [DOI] [PubMed] [Google Scholar]
- 18b. Lee J., Kim Y.‐K., Min D.‐H., Anal. Chem. 2011, 83, 8906. [DOI] [PubMed] [Google Scholar]
Associated Data
This section collects any data citations, data availability statements, or supplementary materials included in this article.
Supplementary Materials
As a service to our authors and readers, this journal provides supporting information supplied by the authors. Such materials are peer reviewed and may be re‐organized for online delivery, but are not copy‐edited or typeset. Technical support issues arising from supporting information (other than missing files) should be addressed to the authors.
miscellaneous_information


