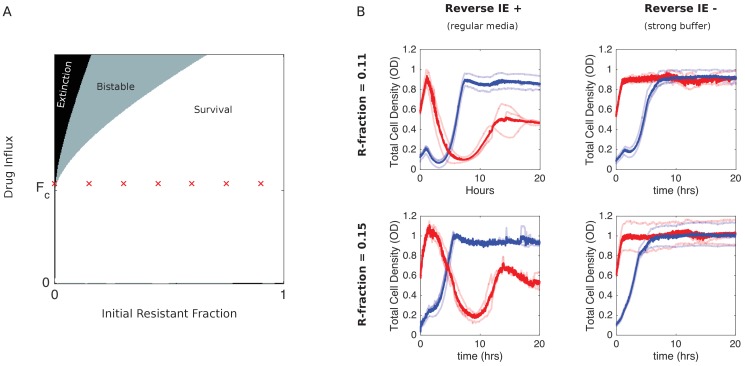
Figure 4. Eliminating reverse inoculum effect eliminates inverted bistability.
(A) Numerical phase diagram in absence of reverse inoculum effect () indicating regions of extinction (black), survival (white), and bistability (light gray; initially large population survives, small population dies). There are no regions of ‘inverted’ bistability (initially small population survives, large population dies). Red ’x’ marks fall along a line that previously traversed a region of inverted bistability in the presence of a reverse inoculum effect (Figure 3) but includes only surviving populations in its absence. is the critical influx rate above which the extinct solution (population size 0) first becomes stable; it depends on model parameters, including media refresh rate (µ), maximum kill rate of the antibiotic (), the Hill coefficient of the dose-response curve (), and the MIC of the drug-resistant population in the low-density limit where cooperation is negligible (). Specific phase diagram was calculated with same parameters as in Figure 3 except , which corresponds to the reverse inoculum effect, is set to 0. (B) Experimental time series for mixed populations starting at a total density of OD = 0.1 (blue) or OD = 0.6 (red) in regular media (left panels) or strongly buffered media (right panels). The initial populations are comprised of resistant cells at a total population fraction of 0.11 (top) and 0.15 (bottom) and for influx rate of µg/mL. Light curves are individual experiments, dark curves are means across all experiments.

