Abstract
Tuberculosis (TB) is the leading cause of death from a single infectious agent, requiring at least 6 months of multidrug treatment to achieve cure1. However, the lack of reliable data on antimicrobial pharmacokinetics (PK) at infection sites hinders efforts to optimize antimicrobial dosing and shorten TB treatments2. In this study, we applied a new tool to perform unbiased, noninvasive and multicompartment measurements of antimicrobial concentration–time profiles in humans3. Newly identified patients with rifampin-susceptible pulmonary TB were enrolled in a first-in-human study4 using dynamic [11C]rifampin (administered as a microdose) positron emission tomography (PET) and computed tomography (CT). [11C]rifampin PET–CT was safe and demonstrated spatially compartmentalized rifampin exposures in pathologically distinct TB lesions within the same patients, with low cavity wall rifampin exposures. Repeat PET–CT measurements demonstrated independent temporal evolution of rifampin exposure trajectories in different lesions within the same patients. Similar findings were recapitulated by PET–CT in experimentally infected rabbits with cavitary TB and confirmed using postmortem mass spectrometry. Integrated modeling of the PET-captured concentration–time profiles in hollow-fiber bacterial kill curve experiments provided estimates on the rifampin dosing required to achieve cure in 4 months. These data, capturing the spatial and temporal heterogeneity of intralesional drug PK, have major implications for antimicrobial drug development.
Rifampin, an essential first-line TB drug, has potent, dose-dependent sterilizing activity against Mycobacterium tuberculosis, with the area under the concentration–time curve (AUC) being the most predictive of bactericidal activity5–8. The currently recommended rifampin dose (10 mg kg−1 per day) was chosen in the 1970s based on economic necessity9. However, higher rifampin doses could be a promising approach to shorten TB treatment, and rifampin doses up to 35 mg kg−1 per day are safe in adults with pulmonary TB10. PK modeling suggests that 50 mg kg−1 of rifampin could provide even higher activity11, although the safety of this dose has not been established. Finally, antimicrobial concentrations account for the majority of variance in TB treatment outcomes (failure, relapse and death), which can be abrogated by higher rifampin concentrations12.
Effective treatment of infections depends on achieving adequate antimicrobial concentrations at infection sites, where the pathogen resides13. However, owing to the difficulties of direct tissue sampling, data on intralesional antimicrobial PK remain limited and plasma is often used as a surrogate14–16, although plasma levels might not always correlate well with levels at infection sites17. Reduced antibiotic exposures in privileged sites, such as cavitary lesions, can lead to poor performance in complex and expensive clinical trials18. Therefore, detailed intralesional concentration–time profile data are critical to support PK modeling and optimize TB regimens to shorten treatment duration2.
Mass spectrometry and matrix-assisted laser desorption ionization (MALDI) can detect drugs in infection sites and have advanced the field19,20. However, these techniques rely on accurate tissue resection, which cannot be achieved in humans except when it is planned for clinical reasons. Thus far, intralesional rifampin levels have been measured only in patients with refractory disease19,20, who are not representative of the vast majority of patients with TB21. Moreover, repeated tissue sampling is difficult in humans, and even in animals it is generally limited to a single time point. Therefore, accurate AUC measurements, or data on the longitudinal changes in antimicrobial concentrations that might occur during treatment or disease progression, are difficult to achieve with current tools. Recent data suggest that pathologically diverse TB lesions occur simultaneously at different sites within the same patient21,22. Thus, analysis of only one or a few easily accessible resected lesions might lead to sampling bias, whereas the tissue resection and subsequent processing might also introduce artifacts.
We have previously used [11C]rifampin, a chemically identical radiolabeled analog of rifampin, and PET with CT to study rifampin biodistribution in live M. tuberculosis-infected mice3 that developed caseous pulmonary TB lesions23 as well as in experimentally infected rabbits and in a patient with TB meningitis4. In the current study, 12 newly identified patients with confirmed rifampin-susceptible pulmonary TB, who received a rifampin-based multidrug treatment, were prospectively enrolled in a first-in-human study4 (Extended Data Fig. 1 and Supplementary Table 1). Dynamic [11C] rifampin PET–CT was performed after an intravenous injection of [11C]-rifampin (administered as a microdose) in accordance with US Food and Drug Administration (FDA) guidelines and used to measure rifampin concentration–time profiles in multiple compartments and organs (Fig. 1). [11C]rifampin PET–CT was safe, well tolerated and without adverse effects. Overall, 1,221 different measurements were made, of which 473 were from infected lung lesions and the remainder were from unaffected lung areas, brain, liver and the blood compartment (plasma). Upon completion of imaging, an intravenous dose of unlabeled rifampin (600 mg) was administered to each patient in lieu of the daily oral dose. Plasma rifampin and metabolite levels were measured using mass spectrometry (Supplementary Table 2) and matched well with the dose-normalized plasma [11C]rifampin PET signal, made under the assumption of PK linearity across the range of doses from the microdose to therapeutic rifampin dosing (Supplementary Fig. 1).
Fig. 1 |. First-in-human dynamic [11C]rifampin PET–CT studies in patients with TB.
Twelve patients with confirmed pulmonary TB were prospectively enrolled and imaged in accordance with FDA guidelines. a, Three-dimensional maximum-intensity projection (MIP) of [11C]rifampin PET–CT from a representative patient with TB. The CT is represented in blue, while the [11C]rifampin PET signal is represented in orange. b, A coronal CT section from the same patient demonstrates the selection of volumes of interest (VOIs) to quantify [11C]rifampin PET signal. c, Data from VOIs are represented as time–activity curves, showing that the plasma concentrations were fivefold higher than those found in cavity walls and noncavitary lesions. Data are represented as median ± interquartile range. At each time point, there were n = 2 VOIs from cavity walls, n = 4 VOIs from lesions, n = 2 VOIs from unaffected lung and n = 1 VOI from plasma.
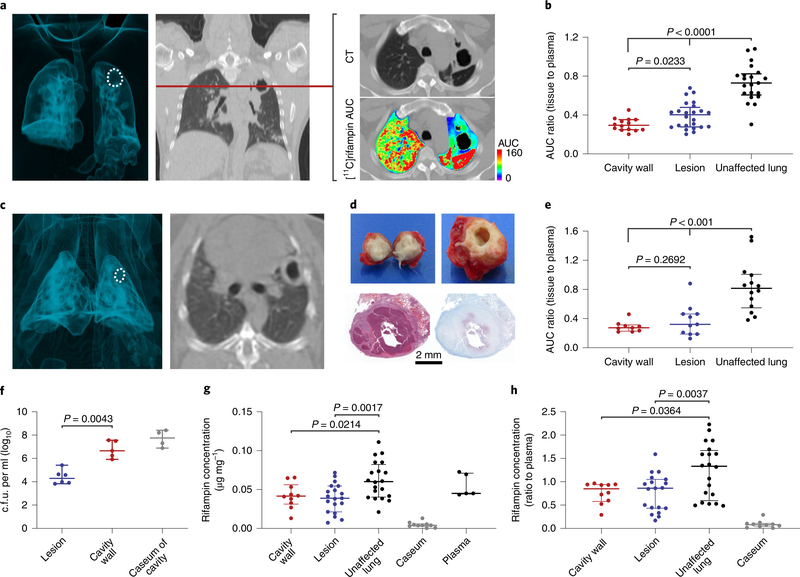
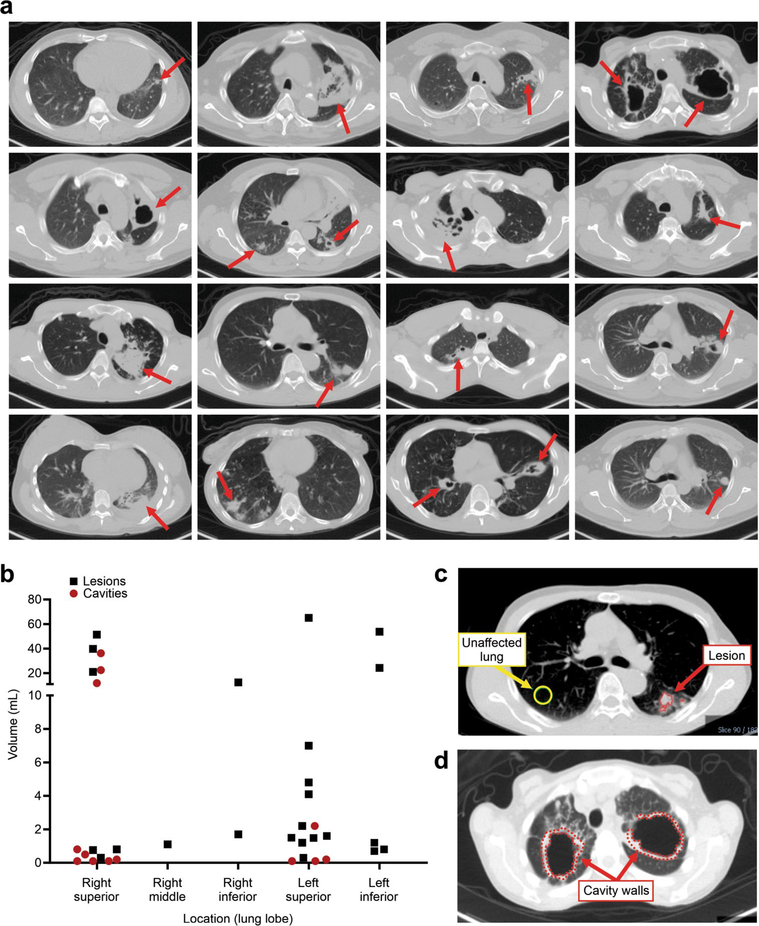
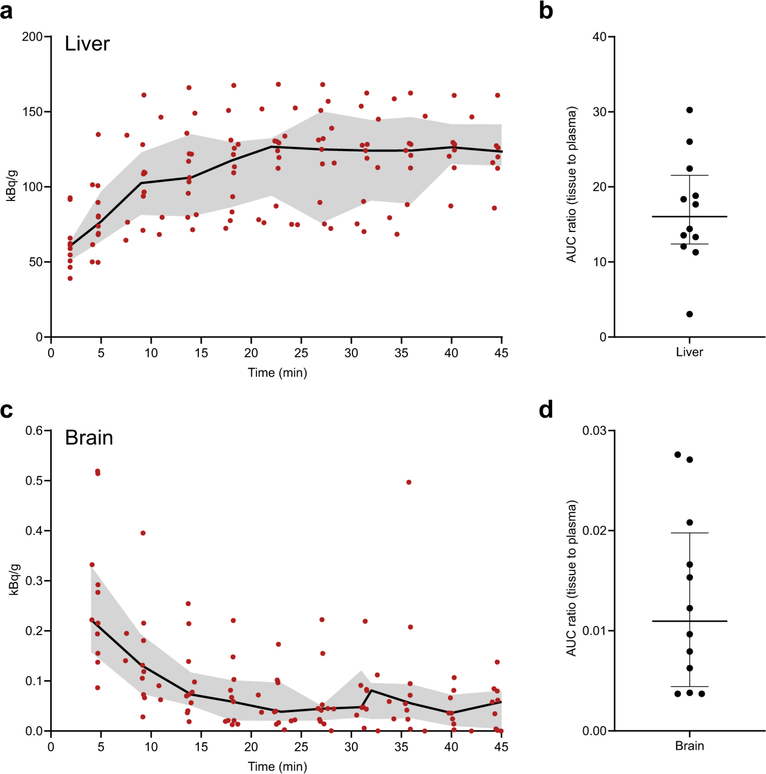
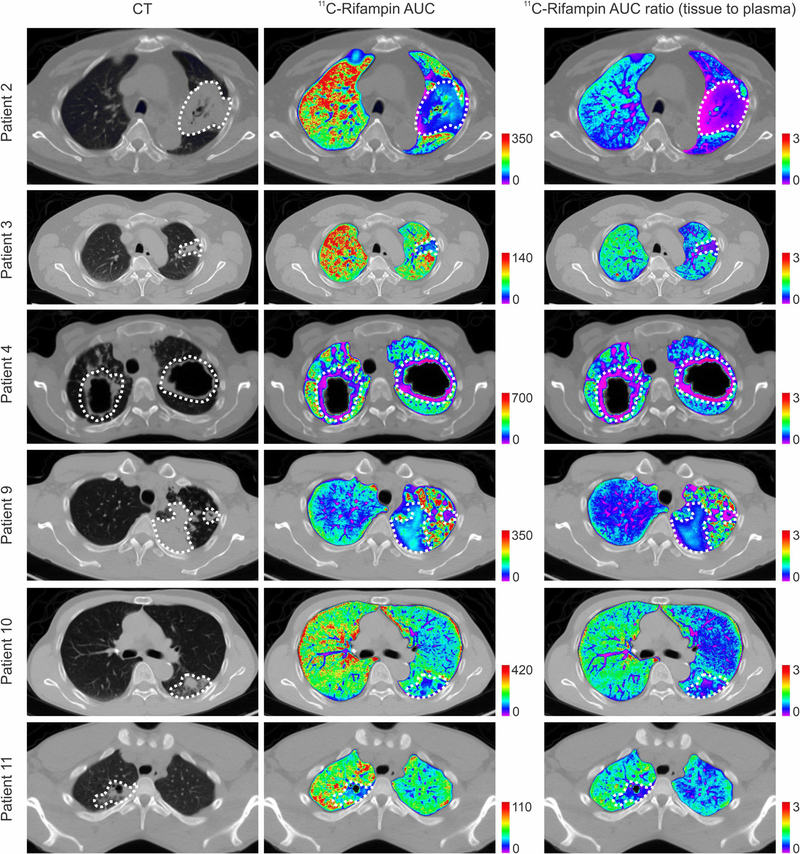
CT demonstrated heterogeneous pulmonary lesions in different lung regions of the same patient (Extended Data Fig. 2). [11C] rifampin was distributed to all parts of the body with hepatic elimination (Extended Data Fig. 3a,b). The PET data were used to calculate the tissue-to-plasma AUC ratio for each lesion (Fig. 2a). [11C]rifampin exposures in pulmonary TB lesions were low, were spatially compartmentalized and demonstrated between-patient and within-patient variability (Extended Data Fig. 4). Even though cavities have a high bacterial burden, [11C]rifampin AUC tissue-to-plasma ratios were the lowest in cavity walls (0.30 ± 0.07) compared to other TB lesions (0.39 ± 0.13; P = 0.0233) or unaffected lung (0.73 ± 0.19; P < 0.0001) (Fig. 2b). Consistent with previous literature24, [11C]rifampin exposures in brain tissues were limited (AUC ratio, 0.01 ± 0.008) (Extended Data Fig. 3c,d).
Fig. 2 |. Heterogeneity of disease and intralesional rifampin exposure.
a, A three-dimensional MIP and coronal CT section from a representative patient with cavitary TB. The cavity in the lung apex is outlined in white (left). The [11C]rifampin AUC is also shown as a heat map overlay in the selected transverse section. b, [11C]rifampin (tissue-to-plasma) AUC ratios in patients with TB (data derived from 12 patients; n = 14 cavity wall lesions, n = 24 TB lesions and n = 21 unaffected lung regions are shown) demonstrate limited [11C]rifampin exposure in lesions, with the lowest exposure noted in cavity walls, which paradoxically also have the highest bacterial burden (107–109 bacteria)26. c, A three-dimensional MIP and transverse CT section from a representative rabbit with cavitary TB. The cavity in the lung apex is outlined in white (left). d, Gross pathology, H&E staining and acid-fast bacilli histology of a necrotic pulmonary granuloma and cavity from rabbits. e, Tissue-to-plasma AUC ratios confirm the limited [11C]rifampin exposures in rabbit pulmonary lesions (data were derived from five animals; n = 9 cavity wall lesions, n = 11 TB lesions and n = 14 unaffected lung regions are shown). f, Bacterial burden, as c.f.u. per ml (log10), was high in the cavity walls of rabbit tissues (data were derived from four animals; n = 6 TB lesions, n = 5 cavity wall lesions and caseum from n = 4 different cavities). g,h, Absolute rifampin concentrations (g) and tissue-to-plasma ratios (h) measured by mass spectrometry demonstrate a trend similar to the PET data (data were derived from five animals; n = 10 cavity wall lesions, n = 19 TB lesions, n = 20 unaffected lung regions, caseum from n = 10 lesions and n = 5 plasma samples). Data are represented as median ± interquartile range. Statistical comparisons were made using a one-tailed Mann–Whitney U test (except for in f, where a two-tailed Mann–Whitney U test was used).
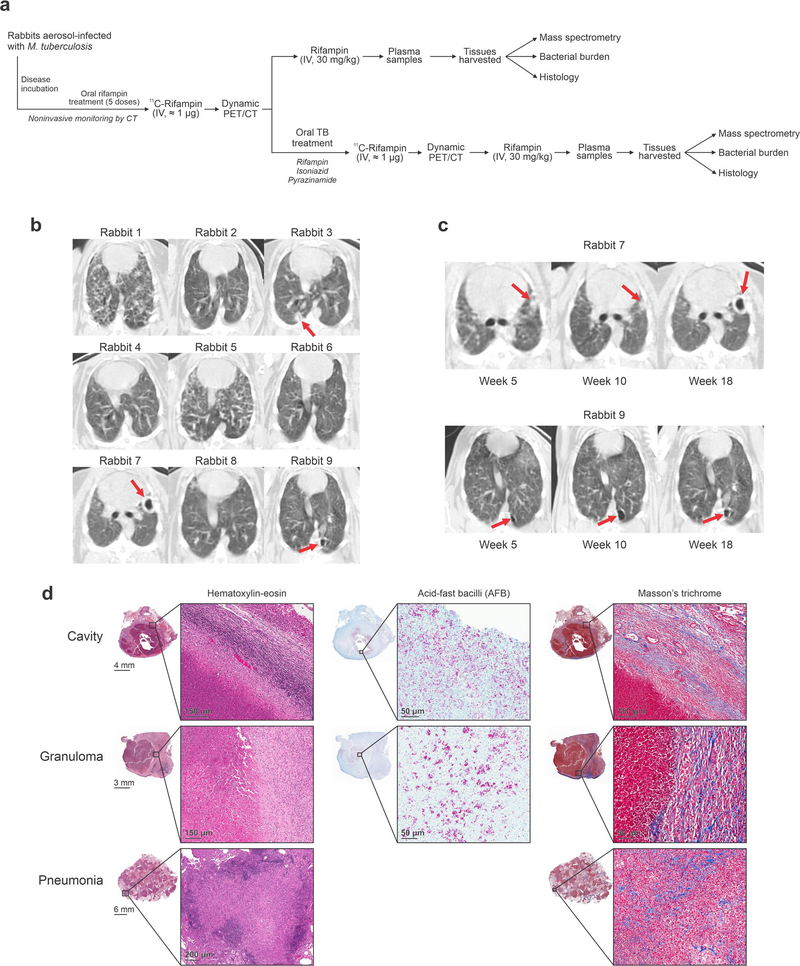
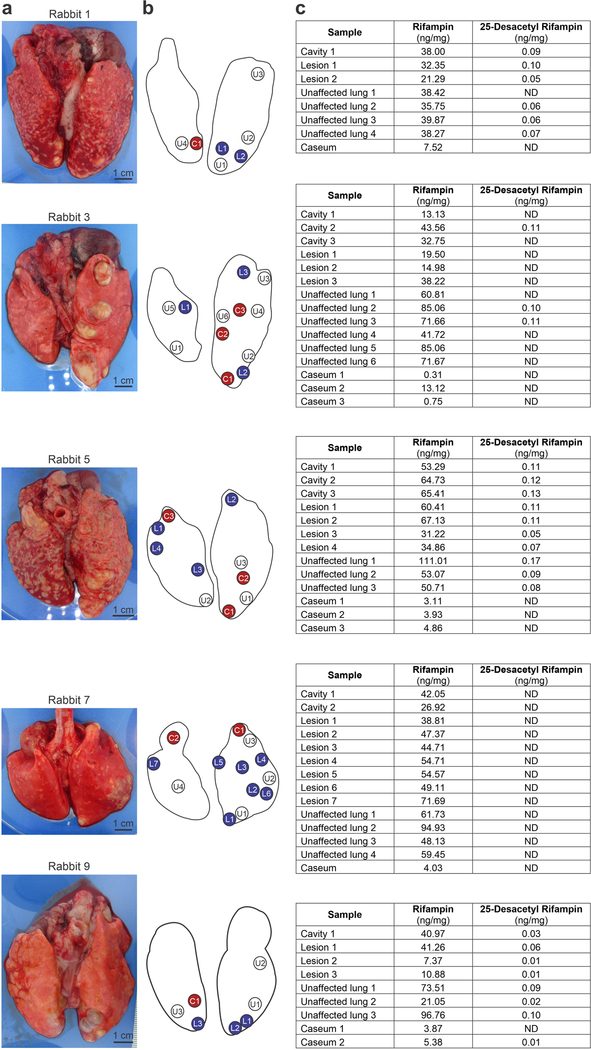
We also compared imaging and direct tissue measurements in a rabbit model of cavitary TB that closely recapitulates human disease25 (Extended Data Fig. 5). Spatial and temporal heterogeneity were noted on CT in disease progression (over 20 weeks) in these infected rabbits (Fig. 2c,d and Extended Data Fig. 5b,c). [11C] rifampin PET–CT was performed in the same animals before and after 30–50 days of multidrug treatment. A separate cohort of animals without multidrug treatment also underwent similar imaging and postmortem analyses. Overall, 972 and 64 different PET and mass spectrometry measurements, respectively (of which 504 and 39 were from infected lung lesions and the remainder were from unaffected lung areas, brain, liver or plasma), were made in these animals. Consistent with the findings from human studies, imaging demonstrated limited and spatially compartmentalized [11C] rifampin exposures in TB lesions (AUC ratio, 0.37 ± 0.22), with the lowest exposures in cavity walls (AUC ratio, 0.29 ± 0.07) (Fig. 2e and Extended Data Fig. 6). The bacterial burden in the cavity walls was more than 100-fold higher than in noncavitary lesions (6.78 ± 0.73 versus 4.40 ± 0.61 log10 colony forming units (c.f.u.); P = 0.0043; Fig. 2f). Although mass spectrometric tissue analysis was performed at a single time point and thus did not represent the AUC, both the absolute rifampin levels and tissue and plasma ratios showed a trend similar to the PET data (Fig. 2g,h and Extended Data Fig. 7). The caseum of cavities had the highest bacterial burden (7.70 ± 0.73 log10 c.f.u.), consistent with findings in patients26, but the lowest absolute rifampin concentration, highlighting the challenges of achieving sterilization in cavities and the associated risks of treatment failure, disease transmission and antimicrobial resistance in patients with cavitary TB20,27. We hypothesize that tissue necrosis and presumably the fibrotic extracellular matrix surrounding cavitary tissues limited the ability for passive diffusion and rifampin penetration into these lesions28 (Extended Data Fig. 5d).
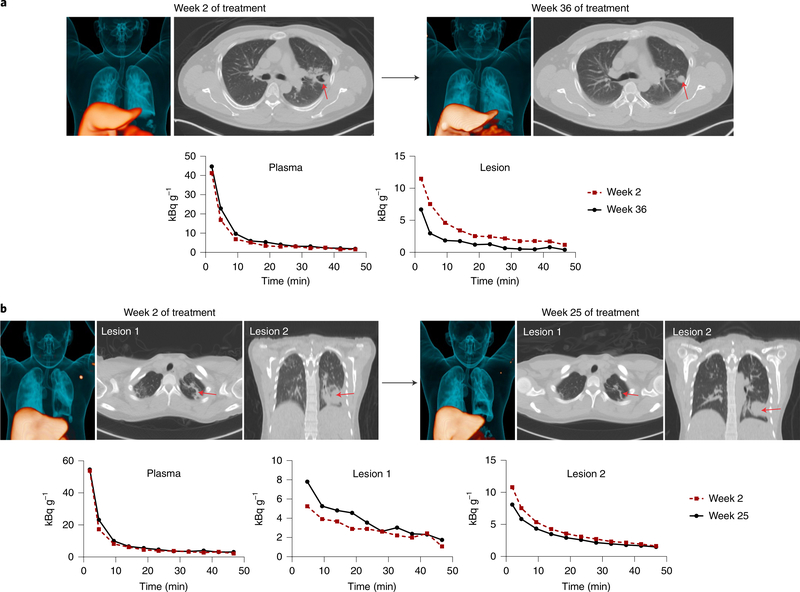
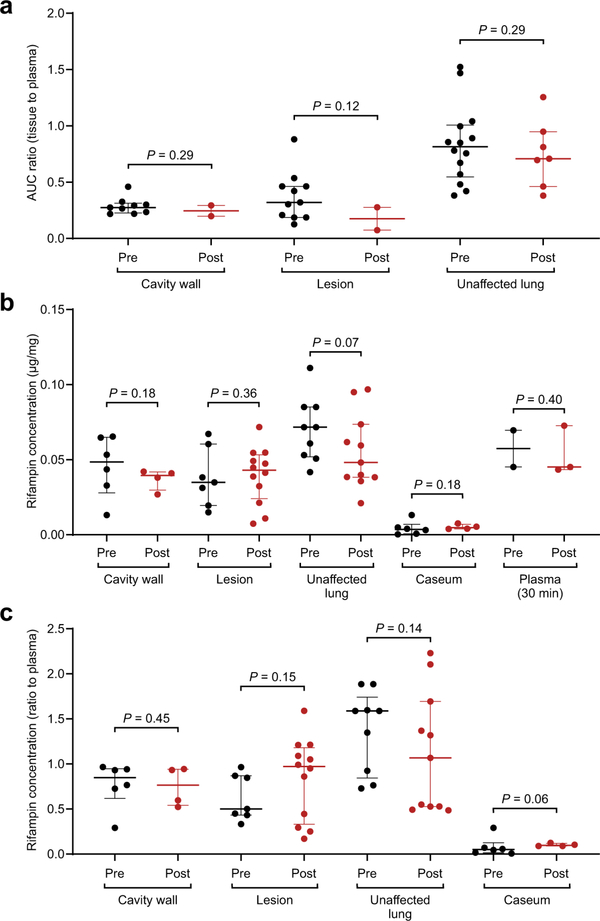
Previous studies using mass spectrometry and MALDI suggested that rifampin accumulates in caseum over multiple weeks of treatment19,29. In this study, no differences were noted in animals before and after multidrug TB treatment for [11C]rifampin PET AUC tissue-to-plasma ratios or for the absolute rifampin concentrations (and tissue-to-plasma ratios) measured for TB lesions by mass spectrometry (Extended Data Fig. 8). Rifampin is chemically unstable at 37 °C30,31, which prevents long-term in vivo accumulation. Additionally, [11C]rifampin PET–CT was also repeated in two patients after they received more than 20 weeks of rifampin-based multidrug TB treatments, which demonstrated independent temporal evolution of rifampin exposure trajectories for different lesions within the same patient (Fig. 3). Over the same time period, [11C] rifampin exposures increased in one lesion but decreased in another lesion within the same patient (Fig. 3b).
Fig. 3 |. Heterogeneous temporal changes in [11C]rifampin exposure during treatment.
a, [11C]rifampin PET–CT was performed at 2 and 36 weeks after initiation of TB treatment in a 45-year-old male patient with cavitary TB. Although no differences were noted in the plasma time–activity curves at these two time points, lower [11C]rifampin exposure was noted in the lesion at 36 weeks. b, Similar results were noted in a 26-year-old female patient with noncavitary TB who was imaged at 2 and 25 weeks after initiation of treatment. Although no difference was noted in plasma levels at these time points, lesion 1 and lesion 2 showed opposite changes in [11C]rifampin exposure. Red arrows point to the location of the selected lesions.
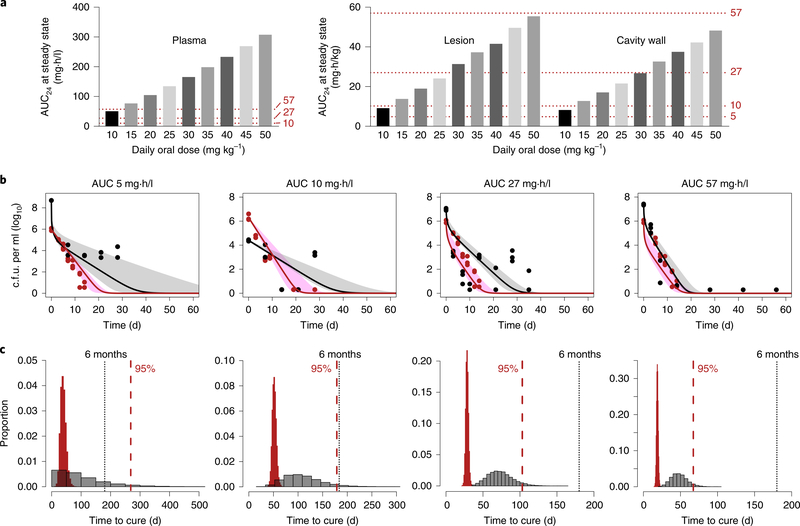
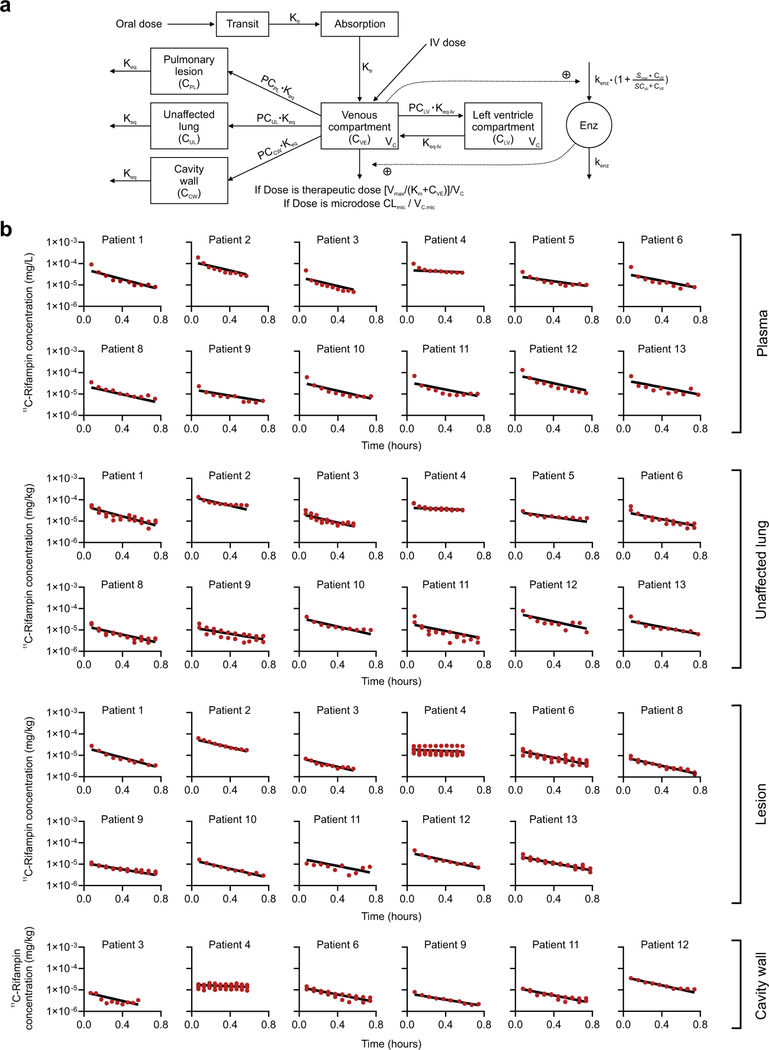
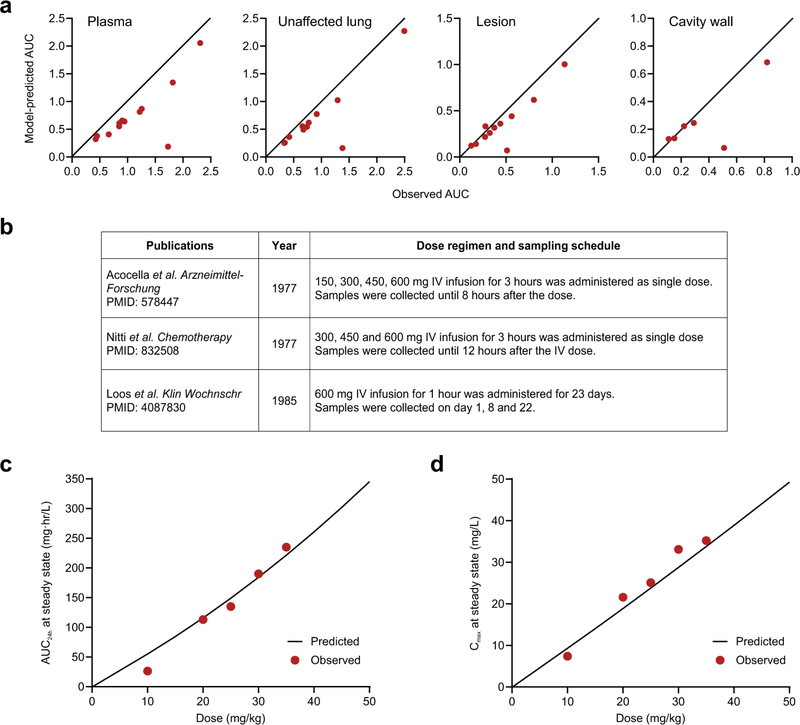
Our detailed intralesional concentration–time profiles provide a translational bridge to optimize antimicrobial dosing. Integrated PK lung biodistribution modeling of the PET-captured AUC ratios and known plasma rifampin concentrations after oral dosing were used to predict intralesional rifampin concentrations (Extended Data Fig. 9a and Supplementary Table 3). This model predicted the [11C] rifampin plasma and tissue concentrations in all patients (Extended Data Figs. 9b and 10a). The model also provided excellent predictions of steady-state plasma AUC from 0 to 24 h (AUC0–24) at different doses of oral rifampin, which matched well with the published literature (Extended Data Fig. 10c,d). Using this model, the intralesional rifampin exposure (AUC0–24 at steady state) was predicted in adults who received daily oral rifampin doses of 10–50 mg kg−1 (Fig. 4a and Supplementary Table 4). Next, we examined the effect of these predicted intralesional rifampin AUCs in the hollow-fiber model (HFS-TB)32 during multidrug TB treatment. Because rifampin AUCs achieved at infection sites drive M. tuberculosis kill kinetics (bacterial kill slopes), we examined the microbial kill trajectories of AUCs in rapidly growing (log phase) and semidormant/nonreplicating bacteria (Fig. 4b). The corresponding time-to-extinction (TTE)32, defined as the time taken to eliminate all bacteria from a patient’s lungs and equivalent to the minimum duration of treatment in the HFS-TB model, was used to estimate the time to cure in patients (Fig. 4c). With standard oral rifampin dosing (10 mg kg−1 per day), predicted intralesional AUC0–24 values of 8.8 and 7.9 mg·h/l achieved in pulmonary TB lesions and cavity walls, respectively, would provide an estimate with 95% confidence of cure after 6–9 months of treatment, with longer treatments needed for cavitary disease. Similarly, an oral rifampin dose of at least 35 mg kg−1 per day with predicted intralesional AUC0–24 > 27 mg·h/l is estimated to achieve cure in 4 months. On the basis of these estimates, even shorter TB treatments could be developed with rifampin-based oral treatment regimens using 45–50 mg kg−1 per day.
Fig. 4 |. Effect of intralesional rifampin concentrations on treatment shortening.
a, Simulated AUC0–24 at steady state after oral administration of daily doses from 10–50 mg kg−1 in plasma and lung regions based on the PK lung biodistribution model. Oral bioavailability was assumed to be 90%. b, M. tuberculosis bacterial kill curves achieved at the different rifampin AUC exposures (in combination with isoniazid and pyrazinamide) used in the hollow-fiber model (HFS-TB). The solid lines (median) represent the rapidly (red) and slowly (black) growing bacterial subpopulations, while the shaded regions represent the 95% confidence intervals. The red and black dots represent intracellular and extracellular bacteria in log phase and slow (semidormant/nonreplicating) growth phases, respectively. For these AUC studies, mg × h / kg is equivalent to mg × h / l (n = 3 HFS-TB cartridges per regimen). c, The corresponding TTE of the bacterial population in the HFS-TB model (red bars) used to predict the time to cure in patients (gray bars) is shown below each corresponding AUC exposure in b. The dotted red line represents estimates of the time after treatment initiation (in days) to achieve cure in 95% of the patients.
In this study, microgram quantities of [11C]rifampin (microdosing) were administered to each patient, and current evidence suggests that microdosing is indeed a reliable predictor of drug biodistribution at therapeutic doses33. Moreover, we also demonstrated that plasma [11C]rifampin PK in patients with TB matched well with the PK of unlabeled rifampin (600 mg) measured using mass spectrometry (Supplementary Fig. 1b). Additionally, [11C]rifampin PET findings matched with tissue rifampin levels obtained postmortem in rabbits using mass spectrometry (Fig. 2 and Extended Data Fig. 8). We also fully captured lesion-specific tissue-to-plasma AUC ratios during dynamic PET, as rifampin is known to rapidly equilibrate into tissues (half-life of ~1 min28). It was assumed that the product of the tissue-to-plasma AUC ratio (derived from PET) and direct plasma AUCs (measured using mass spectrometry in the same patient) would accurately yield lesion-specific tissue concentrations34. 11C radiolabel was introduced into rifampin such that [11C]rifampin remained chemically identical to the parent compound, and the label was retained even after metabolism to 25-desacetyl rifampin35. 25-Desacetyl rifampin levels were low in the plasma of patients with TB (5%) (Supplementary Table 2) and undetectable in most rabbit tissues (Extended Data Fig. 7) and therefore did not contribute substantially to the PET signal. This study describes a new application of PET technology, measuring antimicrobial concentration–time profiles in patients with TB, with the associated caveats of variability and interpretation. However, the inherent variability in the PET-derived dataset in the current study is similar to or lower than that of the corresponding data derived from mass spectrometry. Moreover, irrespective of the patient, cavitary lesions consistently had a lower AUC ratio than unaffected lungs and other lesion types in the same patient (Supplementary Table 5), which could subsequently be modeled accurately. Finally, although the HFS-TB model represents a promising advance, independent validation of time-to-cure results are needed.
PET imaging is available at major referral centers in developed and developing countries36,37. This enables small studies (with 10–20 patients)37 to be performed to provide detailed and unbiased data on antimicrobial biodistribution in populations of interest, without the need for invasive procedures, which is encouraged by the FDA for new drug applications. Additionally, this technology is also broadly applicable to other antimicrobials. For example, many antimicrobials contain fluorine (fluoroquinolones, oxazolidinones and pretomanid) that can be substituted with 18F or other atoms (76Br in bedaquiline38) with a range of physical half-lives. Furthermore, owing to the use of subpharmacological drug doses, the preclinical safety testing required for human use of PET tracers is simpler, allowing more rapid clinical translation39. Finally, this technology could also enable therapeutic drug monitoring and precision medicine approaches in resource-rich settings.
We present results from a dynamic [11C]rifampin PET study in newly identified patients with pulmonary TB, which are supported by data from experimentally infected rabbits with cavitary TB, to noninvasively measure intralesional rifampin concentration–time profiles. Our data demonstrate spatial compartmentalization and independent temporal evolution of rifampin exposures in pathologically distinct TB lesions within the same patients. These data have major implications for antimicrobial drug development and efforts to shorten TB treatments. Understanding of the intralesional concentration–time profile provides a bridge that allows for pharmacodynamic modeling to optimize TB treatments.
Methods
All protocols were approved by the Johns Hopkins University Biosafety, Radiation Safety, Animal Care and Use and Institutional Review Board Committees.
Clinical study design
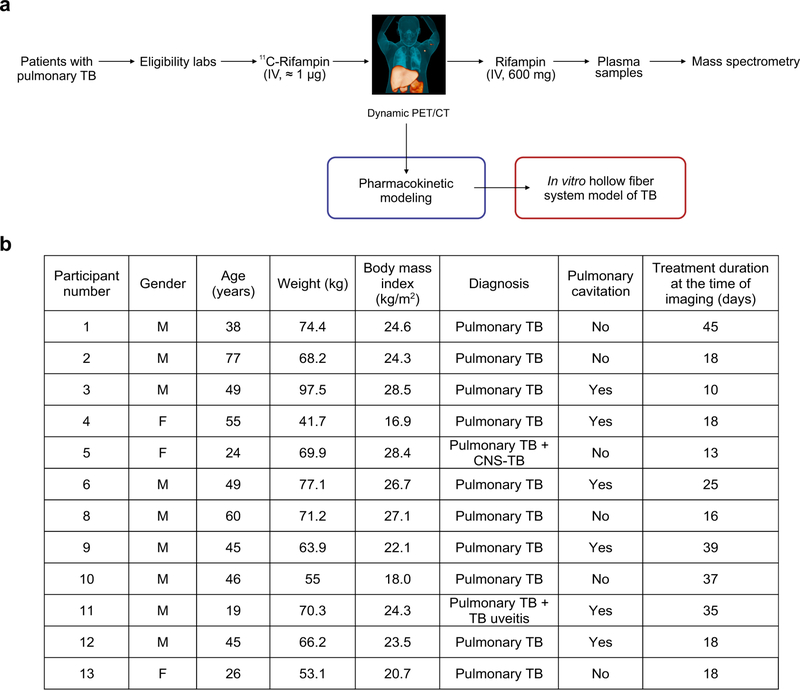
Thirteen patients with confirmed TB, receiving TB treatment (rifampin, isoniazid, pyrazinamide and ethambutol, except patient 5 who received moxifloxacin instead of ethambutol), were recruited from January 2017 to February 2019 at the Johns Hopkins Hospitals or the TB clinics at the Maryland Department of Health (Extended Data Fig. 1). Written informed consent was obtained from all patients, and deidentified PET–CT images are presented. One patient was excluded because of substantial motion artifact during PET–CT. All patients had received at least 10 d of TB treatment by the time of imaging. The eligibility criteria are outlined in Supplementary Table 1. The study team had no role in the diagnosis or clinical management of the patients. These studies were approved by the Johns Hopkins University Institutional Review Board Committee. Approval was also obtained from the Maryland Department of Health Institutional Review Board. [11C]rifampin was used and monitored according to the FDA Radioactive Drug Research Committee program guidelines for investigational drugs40. There was no external data and safety monitoring board.
Rabbit infections and treatment
Twelve female New Zealand White rabbits weighing 2.5–3.5 kg (Charles River Laboratories) were housed individually in a Biosafety Level 3 (BSL-3) facility without cross-ventilation. Each rabbit was exposed five times to an M. tuberculosis H37Rv aerosol challenge in the Madison aerosol droplet generation chamber (University of Wisconsin, Madison)25. Quantification of bacterial burden and postmortem analyses were performed as described previously3,4,25. Bacterial implantation after the aerosol challenge ranged from 4.34 to 5.59 log10 c.f.u. per ml (n = 3 animals). Rabbits were monitored noninvasively by CT (CereTom, Neurologica) over 20 weeks. Twenty weeks after infection, a subset of these rabbits received daily (5 d per week) oral administration of rifampin (30 mg kg−1, equipotent to 10 mg kg−1 in humans), isoniazid (50 mg kg−1, equipotent to ~16 mg kg−1 in humans) and pyrazinamide (125 mg kg−1, equipotent to 40 mg kg−1 in humans) for 30–50 d41.
Imaging
[11C]rifampin (specific activity, 294 ± 127 GBq μmol−1) was synthesized at the Johns Hopkins PET Radiotracer Center using Current Good Manufacturing Practices35.
Humans
On the imaging day, the morning dose of oral rifampin was not administered to the patients, although all other antibiotics and drugs were administered as recommended by their treating physician. Intravenous peripheral catheters were placed on each arm for radiotracer injection and withdrawal of blood samples. A dynamic PET–CT (Biograph mCT, Siemens) was performed for 45 min (mid-abdomen to the skull vertex) immediately after an intravenous injection of [11C]rifampin (337 ± 14 MBq)4. Thereafter, unlabeled rifampin (600 mg) was administered intravenously (in lieu of the morning oral dose), and blood samples were collected. Plasma was separated on the same day and stored for analysis by mass spectrometry.
Rabbits
Live M. tuberculosis-infected rabbits were imaged inside in-house-developed, sealed biocontainment devices compliant with BSL-3 requirements4. All rabbits received five daily oral doses of rifampin (30 mg kg−1) before the imaging studies to induce hepatic metabolism and autoinduction (Extended Data Fig. 5). Dynamic PET–CT was acquired over 60 min immediately after an intravenous (via the ear vein) injection of [11C]rifampin (24.4 ± 3.1 MBq) using the nanoScan PET–CT (Mediso USA) animal imager. Rabbits were killed 30 min after the last imaging time point, and tissues were collected for postmortem analysis4. Repeat [11C]rifampin PET–CT was also performed in the same cohort of rabbits (n = 3) at the start and end of 30–50 d of multidrug TB treatment. Subsequently, 30 mg kg−1 rifampin was administered intravenously (via the ear vein).
Image analysis
The [11C]rifampin PET data were visualized using Mirada XD 3.6 (Mirada Medical) where VOIs were manually drawn using CT as a guide and applied to the dynamic PET data3,4. For cavities, VOIs were drawn to include only the cavity wall, excluding the air in the cavities. PMOD 4.1 (PMOD Technologies) was used to generate time–activity curves for each VOI, represented as a unit of radioactivity (kBq) per ml. Tissue density (X-ray attenuation value (Hounsfield unit)) obtained by CT for each VOI42 was used to correct the corresponding PET VOIs to represent rifampin measurements per mass of tissue. Whole-blood VOIs drawn in the left heart ventricle were corrected to plasma using the individual hematocrit values from each patient. Images were visualized using OsiriX MD 11.0 DICOM Viewer (Pixmeo SARL) and VivoQuant 4.0 (Invicro) for human and rabbit data, respectively. Heat map overlays were implemented using R software (R Foundation for Statistical Computing).
Mass spectrometry
Blood samples were drawn and collected in tubes with EDTA (BD Vacutainer (human) and BD Microtainer (rabbit), Fisher Scientific) to separate plasma. Plasma and tissues were assayed using validated ultra-high-performance liquid chromatography and tandem mass spectrometry (LC–MS/MS) for rifampin and 25-desacetyl rifampin at the Infectious Diseases Pharmacokinetics Laboratory of the University of Florida (standard curves from 50.00 to 0.05 μg ml−1). The assays measured both the free and protein-bound rifampin. For rifampin, the overall validation precision was 0.59–6.51%, and the overall validation accuracy was 89–97% across 3 d of standard curves with similar accuracy for 25-desacetyl rifampin.
PK model
The model structure of a one-compartment disposition model (after oral administration) with a transit absorption compartment was used to describe rifampin PK in plasma43. Rifampin autoinduction was incorporated using an enzyme turnover model. This model was validated using digitized data from 14 studies reporting data from patients with TB (Supplementary Table 6). The mean transit time (MTT), maximal increase in the enzyme production rate (Smax), rifampin concentration at which half Smax was reached (SC50) and rate constant for first-order degradation of the enzyme pool (kenz) were fixed to the parameters reported previously4. Bioavailability was assumed to be 90%. A precondition for extrapolating plasma or tissue concentrations of a drug after administration of a microdose to drug concentrations achieved with a therapeutic dose is that drug concentrations in plasma and tissue increase proportionally with increasing drug doses administered44. The clearance (CLmic) and volume of distribution (Vc,mic) of the central compartment of [11C]rifampin microdosing were modeled separately from the therapeutic dose administered in the same patient owing to the novelty of PET imaging for rifampin PK studies. A physiologically based peripheral compartment for left ventricle plasma was established and connected to the central compartment for venous plasma, as shown in the following equation:
where, ALV is the dose amount in the left ventricle compartment, AVE is the dose amount in the central compartment, keq-lv. is the rate constant for the transfer of drug from venous blood to blood in the left ventricle compartment and PCLV is the partition coefficient for left ventricle from the central compartment.
Dose-dependent PK were observed in a clinical study that included 83 patients who received daily doses of rifampin45. The Michaelis–Menten relationship was used to characterize CL and concentration. The maximal elimination rate (Vmax) was fixed to the value reported in this clinical study45. The rifampin concentration at which elimination is half-maximal (Km) was adjusted empirically by a loglikelihood approach and thereby fixed based on the reported estimate from the same study. Our strategy for re-estimating rifampin therapeutic dose was to draw useful information from previous PK studies. Nineteen rich sampling-based mean concentration–time profiles from three previous reports (Extended Data Fig. 10b)46–48 were combined with individual data from the 12 patients with TB in our study to re-estimate Vc. Concentration–time profiles from the three previous reports were extracted manually with GetData Graph Digitizer (version 2.26).
PK lung biodistribution model
The developed plasma PK model was expanded to describe the distribution of [11C]rifampin into unaffected and affected lung regions using the [11C]rifampin concentration–time profiles obtained from the PET data. To capture the heterogeneous observed rifampin exposures in the unaffected lung (UL), the pulmonary lesion (PL) and the cavity wall (CW), three different partition coefficients (PCs) were estimated: PCUL, PCPL and PCCW. It was assumed that only unbound rifampin (0.25) in venous plasma would be able to penetrate lung tissue. Rifampin concentration in UL, PL and CW regions was described by the following differential equations:
where, CUL,CPL, CCW and CVE are the concentrations of [11C]rifampin in unaffected lung, pulmonary lesion, cavity wall and venous plasma, respectively. keq represents the rate constant for the transfer of drug from venous plasma to lung tissue and was fixed to 42 h (equivalent to an equilibration half-life of 1 min). 0.25 is the fraction of rifampin unbound in plasma. PCUL, PCPL and PCCW are the partition coefficients for the unaffected lung, pulmonary lesion and cavity wall, respectively.
Model evaluation
In the first approach, individual fitting for plasma rifampin (measured by mass spectrometry) and [11C]rifampin plasma and tissue data (measured by PET) were evaluated (Supplementary Fig. 1b and Extended Data Fig 9b). Second, our model was used to predict individual tissue-to-plasma AUC ratios, which were compared to the observed AUC ratios obtained from the PET data (Extended Data Fig. 10a). Finally, our model was used to predict the AUC from 0 to 24 h at steady state (AUC0–24,ss) with daily doses of 10, 20, 25, 30 or 35 mg of rifampin, which were compared to the data reported in the literature49.
Simulations for individual patients and high doses
On the basis of our PK lung biodistribution model, individual AUC0–24,ss values in pulmonary lesions and cavity walls were simulated using empirical Bayes estimates of individual Vc, PCUL, PCPL and PCCW derived from model estimation. Monte Carlo simulations were performed for 1,000 patients to predict rifampin exposures, AUC0–24,ss at doses of 10, 15, 20, 25, 30, 35, 40, 45 and 50 mg kg−1 once daily for 4 weeks administered orally or intravenously (over 1 h) (Supplementary Table 4).
Hollow-fiber system
Time-to-positive and c.f.u. data from HFS-TB studies where M. tuberculosis was treated with a standard dose of isoniazid (600 mg daily) and pyrazinamide (1.5 g daily) in combination with different rifampin doses to achieve AUC0–24 < 2.0, 2.7, 4.8, 10.8, 27 and 57 were analyzed6,7,32,50. HFS-TB studies were performed with three different metabolic populations of M. tuberculosis (log-phase growth, semidormant/nonreplicating under an acidic condition and intracellular M. tuberculosis) to represent the mixture of the metabolic population thought to be present in TB lesions in situ. The c.f.u. kill kinetics observed were used to compute bacteria kill rates and TTE in each HFS-TB experiment and translated to estimate the cure rates in patients with TB using morphism mapping (multistep transformations) with a matrix of transformation factors and Latin hypercube sampling, an approach that was previously validated for its accuracy in clinical forecasting of treatment shortening32. Patient-related factors, such as heterogeneity in bacterial burden, metabolic state of the bacteria, lesion type (cavities, granulomas), intra-patient PK variability and differences in bacterial minimum inhibitory concentration in patient lesions, were taken into account while estimating data derived from HFS-TB studies.
Statistical analysis
Prism 8.2 (GraphPad Software) was used for the data analysis. c.f.u. data presented on a log10 scale as median ± interquartile range were analyzed using an unpaired two-tailed Mann–Whitney U test. PET and mass spectrometry data presented on a linear scale as median ± interquartile range were compared using a single-tailed Mann–Whitney U test. PK model results were analyzed with R (v. 2.15.2) and RStudio (v. 1.2.1335). P values ≤ 0.05 were considered statistically significant.
Reporting Summary. Further information on research design is available in the Nature Research Reporting Summary linked to this article.
Data availability
All data generated or analyzed in this study are included in this article and its Supplementary Information.
Extended Data
Extended Data Fig. 1 |. Study outline and patient characteristics.
(a) Patients with pulmonary TB receiving a rifampin-based TB treatment were enrolled and 11C-rifampin PET/CT performed within 6-weeks of treatment initiation. A subset of patients (n = 2) was also imaged at least 20 weeks after starting treatment. (b) All patients were HIV negative and were receiving an oral regimen of isoniazid, rifampin, pyrazinamide, and ethambutol at the time of imaging, except for patient 5 that received moxifloxacin instead of ethambutol. Patient 7 was excluded from the study due to significant motion artifact during the 11C-rifampin PET/CT. Gender: male (M) and female (F).
Extended Data Fig. 2 |. Heterogeneous pulmonary lesions in different lung regions of TB patients.
(a) Transverse CT sections from the TB patients demonstrate the simultaneous presence of multiple pulmonary lesions. (b) TB lesions and cavities with different sizes (volumes) were noted in all lung regions, although there was a preference for the upper lung lobes. Data from all 12 patients is shown. (c and d) Using the CT as a reference, the volumes of interest (VOIs) were drawn and applied to the PET data. VOIs for unaffected lung were placed at the same location in the contralateral unaffected lung.
Extended Data Fig. 3 |. 11C-Rifampin measurements in the liver and brain of TB patients.
(a) Time-activity curve of 11C-rifampin measured in the liver of patients. (b) AUC liver to plasma ratios (c) Time-activity curve of 11C-rifampin measured in the brain of patients. (d) AUC brain to plasma ratios. The red dots represent individual measurements [n = 12 VOIs (measured at 10 time-points; total 120 VOIs per organ) corresponding to the 12 patients], with the black line and grey region representing the median and interquartile range, respectively. Tissue to plasma AUCs are represented as median and interquartile range.
Extended Data Fig. 4 |. Intrasubject heterogeneity of 11C-rifampin exposure.
11C-Rifampin area under the concentration-time curve (AUC) obtained by integrating the area under the dynamic 11C-rifampin PET time-activity curves (middle panels) as well as the AUC ratio (tissue to plasma) (right panels) from selected patients, are shown as heatmap overlays on the CT (left panels). The dotted white lines outline the lesion/cavity. Tissue density [X-ray attenuation value (Hounsfield Unit)] obtained via CT was used to correct the corresponding PET data to represent 11C-rifampin concentrations per mass of tissue.
Extended Data Fig. 5 |. The rabbit model of cavitary TB mimics human disease.
(a) Scheme describing the experiments performed in the rabbit model. (b) After aerosol infection with M. tuberculosis, the rabbits developed a heterogeneous pulmonary disease similar to humans. Transverse CT sections from rabbits at week 18 post-infection are shown. (c) Noninvasive longitudinal monitoring of disease progression using CT. Cavities/lesions are indicated with red arrows. (d) Histopathological analysis of infected-rabbit tissues demonstrates acid-fast bacilli (AFB) in the necrotic areas of the granuloma and cavity wall. Surrounding fibrosis (blue regions) can be noted with Mason’s trichrome staining. Histological analyses were repeated independently four times with similar results.
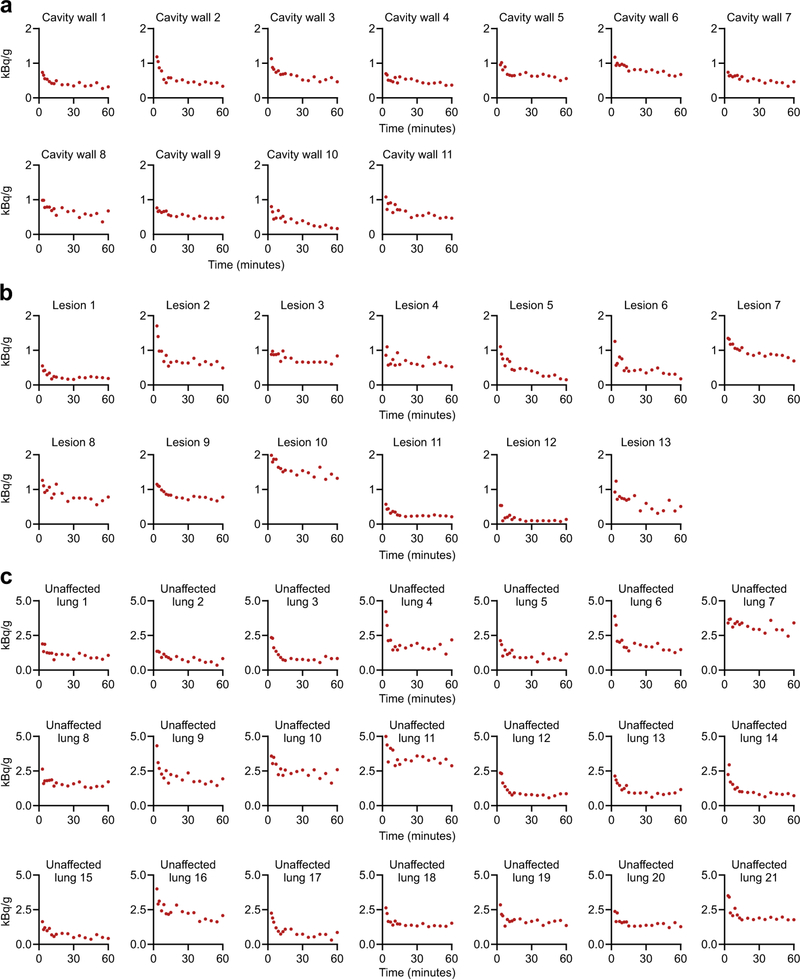
Extended Data Fig. 6 |. 11C-Rifampin PET in rabbits.
Time-activity curves for individual lesions (a) cavity walls, (b) TB lesions and (c) unaffected lung regions from M. tuberculosis-infected rabbits.
Extended Data Fig. 7 |. Direct tissue measurements of rifampin (mass spectrometry) in rabbits.
(a) Gross pathology demonstrating the M. tuberculosis-infected lungs and the (b) areas selected for quantification of rifampin by mass spectrometry. U, unaffected lung (white); L, lesion (blue); C, cavity wall (red). (c) Tissue concentrations of rifampin and its metabolite 25-desacetyl rifampin. ND, not detectable. The lung tissues from each rabbit were processed independently (n = 5 animals).
Extended Data Fig. 8 |. Rifampin concentrations in rabbit tissues before and after treatment.
All rabbits received five oral doses of rifampin prior to PET imaging to achieve steady state. No differences were identified in (a) 11C-rifampin PET AUC tissue/plasma ratios (n = 11 cavity wall lesions, 13 TB lesions, and 21 unaffected lung regions are shown), (b) absolute rifampin concentrations measured by mass spectrometry (n = 10 cavity wall lesions, 19 TB lesions, 20 unaffected lung regions, caseum from 10 lesions, and five plasma samples are shown), or (c) the tissue/plasma ratios for TB lesions using mass spectrometry quantification in animals before or after treatment (n = 10 cavity wall lesions, 19 TB lesions, 20 unaffected lung regions and caseum from 10 lesion are shown). Data represented as median ± interquartile range. Statistical comparisons performed using a one-tailed Mann-Whitney U test.
Extended Data Fig. 9 |. Pharmacokinetic lung-biodistribution model.
(a) Model schematic. Maximal elimination rate (Vmax), rifampin concentration at which the elimination is half-maximal (Km) and volume of distribution (Vc) of the central compartment of therapeutic dose, clearance (CLmic) and volume of distribution (Vc,mic) of the central compartment of the 11C-rifampin dose, partition coefficient for left ventricle (PCLV), unaffected lung (PCUL), pulmonary lesion (PCPL), cavity wall (PCCW), equilibration rate constant (Keq) between lung and venous plasma, equilibration rate constant (Keq-lv) between left ventricle and venous plasma, transit rate constant (Ktr), maximal increase in the enzyme production rate (Smax), rifampin concentration at which half the Smax is reached (SC50), and rate constant for the first-order degradation of the enzyme pool (kenz). (b) Individual fittings of observed (red dots) and model-predicted 11C-rifampin concentrations (black lines) in plasma and pulmonary tissues from all patients. Patient 7 was excluded from the study due to significant motion artifact during the 11C-rifampin PET/CT.
Extended Data Fig. 10 |. Pharmacokinetic model with observed and previously published data.
(a) Observed and model-predicted 11C-rifampin exposure AUC in plasma, unaffected lung, TB lesions and cavity walls of all patients. (b) External data digitized from these studies on TB patients receiving varying doses of intravenous rifampin were used to enrich the dataset. (c, d) Model-predicted rifampin plasma AUC24h and Cmax at steady state compared to the data previously reported by Boree et al. (Am J Respir Crit Care Med. 2015).
Supplementary Material
Acknowledgements
We thank all the patients who participated in the study. Additionally, we thank the Maryland Department of Health and Mental Hygiene for recruiting patients with TB; R. Abdallah, C. Voicu, J. Sanchez-Bautista, S. Frey and L. Shinehouse (Johns Hopkins Hospitals) for coordinating the human imaging studies; and M. Klunk for helping with the animal experiments. This work was funded by the US National Institutes of Health (grant R01-HL131829), Director’s Transformative Research Award (grant R01-EB020539) and R56-AI145435 to S.K.J.
Footnotes
Competing interests
The authors declare no competing interests.
Online content
Any methods, additional references, Nature Research reporting summaries, source data, extended data, supplementary information, acknowledgements, peer review information; details of author contributions and competing interests; and statements of data and code availability are available at https://doi.org/10.1038/s41591020–0770-2.
Additional information
Extended data is available for this paper at https://doi.org/10.1038/s41591–020-0770–2.
Supplementary information is available for this paper at https://doi.org/10.1038/s41591–020-0770–2.
Peer review information Alison Farrell was the primary editor on this article and managed its editorial process and peer review in collaboration with the rest of the editorial team.
References
- 1.World Health Organization. Global Tuberculosis Report 2019 (World Health Organization, 2019). [Google Scholar]
- 2.Reynolds J & Heysell SK Understanding pharmacokinetics to improve tuberculosis treatment outcome. Expert Opin. Drug Metab. Toxicol. 10, 813–823 (2014). [DOI] [PMC free article] [PubMed] [Google Scholar]
- 3.DeMarco VP et al. Determination of [11C]rifampin pharmacokinetics within Mycobacterium tuberculosis-infected mice by using dynamic positron emission tomography bioimaging. Antimicrob. Agents Chemother. 59, 5768–5774 (2015). [DOI] [PMC free article] [PubMed] [Google Scholar]
- 4.Tucker EW et al. Noninvasive 11C-rifampin positron emission tomography reveals drug biodistribution in tuberculous meningitis. Sci. Transl. Med 10, eaau0965 (2018). [DOI] [PMC free article] [PubMed] [Google Scholar]
- 5.Diacon AH et al. Early bactericidal activity of high-dose rifampin in patients with pulmonary tuberculosis evidenced by positive sputum smears. Antimicrob. Agents Chemother. 51, 2994–2996 (2007). [DOI] [PMC free article] [PubMed] [Google Scholar]
- 6.Chigutsa E et al. Impact of nonlinear interactions of pharmacokinetics and MICs on sputum bacillary kill rates as a marker of sterilizing effect in tuberculosis. Antimicrob. Agents Chemother. 59, 38–45 (2015). [DOI] [PMC free article] [PubMed] [Google Scholar]
- 7.Pasipanodya JG et al. Serum drug concentrations predictive of pulmonary tuberculosis outcomes. J. Infect. Dis. 208, 1464–1473 (2013). [DOI] [PMC free article] [PubMed] [Google Scholar]
- 8.Swaminathan S et al. Drug concentration thresholds predictive of therapy failure and death in children with tuberculosis: bread crumb trails in random forests. Clin. Infect. Dis. 63, S63–S74 (2016). [DOI] [PMC free article] [PubMed] [Google Scholar]
- 9.Grobbelaar M et al. Evolution of rifampicin treatment for tuberculosis. Infect. Genet. Evol. 74, 103937 (2019). [DOI] [PubMed] [Google Scholar]
- 10.Boeree MJ et al. High-dose rifampicin, moxifloxacin, and SQ109 for treating tuberculosis: a multi-arm, multi-stage randomised controlled trial. Lancet Infect. Dis 17, 39–49 (2017). [DOI] [PMC free article] [PubMed] [Google Scholar]
- 11.Svensson RJ et al. Greater early bactericidal activity at higher rifampicin doses revealed by modeling and clinical trial simulations. J. Infect. Dis. 218, 991–999 (2018). [DOI] [PubMed] [Google Scholar]
- 12.Pasipanodya JG et al. Artificial intelligence-derived 3-way concentration-dependent antagonism of gatifloxacin, pyrazinamide, and rifampicin during treatment of pulmonary tuberculosis. Clin. Infect. Dis. 67, S284–S292 (2018). [DOI] [PMC free article] [PubMed] [Google Scholar]
- 13.Ehrlich P Address in pathology on chemotherapeutics: scientific principles, methods, and results. Lancet 182, 445–451 (1913). [Google Scholar]
- 14.Velasquez GE et al. Efficacy and safety of high-dose rifampin in pulmonary tuberculosis: a randomized controlled trial. Am. J. Respir. Crit. Care Med. 198, 657–666 (2018). [DOI] [PMC free article] [PubMed] [Google Scholar]
- 15.Aarnoutse RE et al. Pharmacokinetics, tolerability, and bacteriological response of rifampin administered at 600, 900, and 1,200 milligrams daily in patients with pulmonary tuberculosis. Antimicrob. Agents Chemother. 61, e01054–17 (2017). [DOI] [PMC free article] [PubMed] [Google Scholar]
- 16.Peloquin CA et al. Pharmacokinetic evidence from the HIRIF trial to support increased doses of rifampin for tuberculosis. Antimicrob. Agents Chemother. 61, e01054–17 (2017). [DOI] [PMC free article] [PubMed] [Google Scholar]
- 17.Te Brake LHM, Boeree MJ & Aarnoutse RE Conflicting findings on an intermediate dose of rifampicin for pulmonary tuberculosis. Am. J. Respir. Crit. Care Med. 199, 1166–1167 (2019). [DOI] [PMC free article] [PubMed] [Google Scholar]
- 18.Dorman SE et al. Substitution of rifapentine for rifampin during intensive phase treatment of pulmonary tuberculosis: study 29 of the Tuberculosis Trials Consortium. J. Infect. Dis. 206, 1030–1040 (2012). [DOI] [PubMed] [Google Scholar]
- 19.Prideaux B et al. The association between sterilizing activity and drug distribution into tuberculosis lesions. Nat. Med. 21, 1223–1227 (2015). [DOI] [PMC free article] [PubMed] [Google Scholar]
- 20.Dheda K et al. Drug-penetration gradients associated with acquired drug resistance in patients with tuberculosis. Am. J. Respir. Crit. Care Med. 198, 1208–1219 (2018). [DOI] [PMC free article] [PubMed] [Google Scholar]
- 21.Hunter RL The pathogenesis of tuberculosis: the early infiltrate of post-primary (adult pulmonary) tuberculosis: a distinct disease entity. Front. Immunol 9, 2108 (2018). [DOI] [PMC free article] [PubMed] [Google Scholar]
- 22.Jain SK et al. Tuberculous meningitis: a roadmap for advancing basic and translational research. Nat. Immunol. 19, 521–525 (2018). [DOI] [PMC free article] [PubMed] [Google Scholar]
- 23.Pan H et al. Ipr1 gene mediates innate immunity to tuberculosis. Nature 434, 767–772 (2005). [DOI] [PMC free article] [PubMed] [Google Scholar]
- 24.Nau R et al. Penetration of rifampicin into the cerebrospinal fluid of adults with uninflamed meninges. J. Antimicrob. Chemother. 29, 719–724 (1992). [DOI] [PubMed] [Google Scholar]
- 25.Urbanowski ME et al. Repetitive aerosol exposure promotes cavitary tuberculosis and enables screening for targeted inhibitors of extensive lung destruction. J. Infect. Dis. 218, 53–63 (2018). [DOI] [PMC free article] [PubMed] [Google Scholar]
- 26.Canetti G Present aspects of bacterial resistance in tuberculosis. Am. Rev. Respir. Dis. 92, 687–703 (1965). [DOI] [PubMed] [Google Scholar]
- 27.Benator D et al. Rifapentine and isoniazid once a week versus rifampicin and isoniazid twice a week for treatment of drug-susceptible pulmonary tuberculosis in HIV-negative patients: a randomised clinical trial. Lancet 360, 528–534 (2002). [DOI] [PubMed] [Google Scholar]
- 28.Kjellsson MC et al. Pharmacokinetic evaluation of the penetration of antituberculosis agents in rabbit pulmonary lesions. Antimicrob. Agents Chemother. 56, 446–457 (2012). [DOI] [PMC free article] [PubMed] [Google Scholar]
- 29.Rifat D et al. Pharmacokinetics of rifapentine and rifampin in a rabbit model of tuberculosis and correlation with clinical trial data. Sci. Transl. Med. 10, eaai7786 (2018). [DOI] [PMC free article] [PubMed] [Google Scholar]
- 30.Le Guellec C, Gaudet ML, Lamanetre S & Breteau M Stability of rifampin in plasma: consequences for therapeutic monitoring and pharmacokinetic studies. Ther. Drug Monit. 19, 669–674 (1997). [DOI] [PubMed] [Google Scholar]
- 31.Samara E et al. Antibiotic stability over six weeks in aqueous solution at body temperature with and without heat treatment that mimics the curing of bone cement. Bone Joint Res. 6, 296–306 (2017). [DOI] [PMC free article] [PubMed] [Google Scholar]
- 32.Magombedze G et al. Transformation morphisms and time-to-extinction analysis that map therapy duration from preclinical models to patients with tuberculosis: translating from apples to oranges. Clin. Infect. Dis. 67, S349–S358 (2018). [DOI] [PMC free article] [PubMed] [Google Scholar]
- 33.Lappin G, Noveck R & Burt T Microdosing and drug development: past, present and future. Expert Opin. Drug Metab. Toxicol 9, 817–834 (2013). [DOI] [PMC free article] [PubMed] [Google Scholar]
- 34.Nix DE, Goodwin SD, Peloquin CA, Rotella DL & Schentag JJ Antibiotic tissue penetration and its relevance: impact of tissue penetration on infection response. Antimicrob. Agents Chemother. 35, 1953–1959 (1991). [DOI] [PMC free article] [PubMed] [Google Scholar]
- 35.Liu L et al. Radiosynthesis and bioimaging of the tuberculosis chemo-therapeutics isoniazid, rifampicin and pyrazinamide in baboons. J. Med. Chem. 53, 2882–2891 (2010). [DOI] [PMC free article] [PubMed] [Google Scholar]
- 36.Ordonez AA et al. Molecular imaging of bacterial infections: overcoming the barriers to clinical translation. Sci. Transl. Med 11, eaax8251 (2019). [DOI] [PMC free article] [PubMed] [Google Scholar]
- 37.Rubinstein LV et al. The statistics of phase 0 trials. Stat. Med. 29, 1072–1076 (2010). [DOI] [PMC free article] [PubMed] [Google Scholar]
- 38.Ordonez AA et al. Radiosynthesis and PET bioimaging of 76Br-bedaquiline in a murine model of tuberculosis. ACS Infect. Dis. 5, 1996–2020 (2019). [DOI] [PMC free article] [PubMed] [Google Scholar]
- 39.US Food and Drug Administration. Guidance for Industry, Investigators, and Reviewers: Exploratory IND Studies (US Food and Drug Administration, 2006). [Google Scholar]
- 40.US Food and Drug Administration. Guidance for Industry and Researchers: The Radioactive Drug Research Committee: Human Research Without an Investigational New Drug Application (US Food and Drug Administration, 2010). [Google Scholar]
- 41.US Food and Drug Administration. Guidance for Industry: Estimating the Maximum Safe Starting Dose in Initial Clinical Trials for Therapeutics in Adult Healthy Volunteers (Center for Drug Evaluation and Research, 2005). [Google Scholar]
- 42.Hedlund LW, Vock P & Effmann EL Evaluating lung density by computed tomography. Semin. Respir. Crit. Care Med. 5, 76–88 (1983). [Google Scholar]
- 43.Smythe W et al. A semimechanistic pharmacokinetic-enzyme turnover model for rifampin autoinduction in adult tuberculosis patients. Antimicrob. Agents Chemother. 56, 2091–2098 (2012). [DOI] [PMC free article] [PubMed] [Google Scholar]
- 44.Wagner CC & Langer O Approaches using molecular imaging technology—use of PET in clinical microdose studies. Adv. Drug Deliv. Rev. 63, 539–546 (2011). [DOI] [PMC free article] [PubMed] [Google Scholar]
- 45.Svensson RJ et al. A population pharmacokinetic model incorporating saturable pharmacokinetics and autoinduction for high rifampicin doses. Clin. Pharmacol. Ther. 103, 674–683 (2018). [DOI] [PMC free article] [PubMed] [Google Scholar]
- 46.Acocella G, Bonollo L, Mainardi M, Margaroli P & Tenconi L Serum and urine concentrations of rifampicin administered by intravenous infusion in man. Arzneimittelforschung 27, 1221–1226 (1977). [PubMed] [Google Scholar]
- 47.Nitti V, Virgilio R, Patricolo M & Iuliano A Pharmacokinetic study of intravenous rifampicin. Chemotherapy 23, 1–6 (1977). [DOI] [PubMed] [Google Scholar]
- 48.Loos U et al. Pharmacokinetics of oral and intravenous rifampicin during chronic administration. Klin. Wochenschr. 63, 1205–1211 (1985). [DOI] [PubMed] [Google Scholar]
- 49.Boeree MJ et al. A dose-ranging trial to optimize the dose of rifampin in the treatment of tuberculosis. Am. J. Respir. Crit. Care Med. 191, 1058–1065 (2015). [DOI] [PubMed] [Google Scholar]
- 50.Gumbo T, Pasipanodya JG, Romero K, Hanna D & Nuermberger E Forecasting accuracy of the hollow fiber model of tuberculosis for clinical therapeutic outcomes. Clin. Infect. Dis. 61 (Suppl. 1), S25–S31 (2015). [DOI] [PubMed] [Google Scholar]
Associated Data
This section collects any data citations, data availability statements, or supplementary materials included in this article.
Supplementary Materials
Data Availability Statement
All data generated or analyzed in this study are included in this article and its Supplementary Information.


