

Abstract
Background
Health‐related quality of life (HRQoL) has been shown to be a prognostic factor for cancer survival in randomized clinical trials and observational “real‐world” cohort studies; however, it remains unclear which HRQoL domains are the best prognosticators. The primary aims of this population‐based, observational study were to (a) investigate the association between the novel European Organisation for Research and Treatment of Cancer Quality of Life Questionnaire‐Core30 (QLQ‐C30) summary score and all‐cause mortality, adjusting for the more traditional sociodemographic and clinical prognostic factors; and (b) compare the prognostic value of the QLQ‐C30 summary score with the global quality of life (QoL) and physical functioning scales of the QLQ‐C30.
Materials and Methods
Between 2008 and 2015, patients with cancer (12 tumor types) were invited to participate in PROFILES disease‐specific registry studies (response rate, 69%). In this secondary analysis of 6,895 patients, multivariate Cox proportional hazard regression models were used to investigate the association between the QLQ‐C30 scores and all‐cause mortality.
Results
In the overall Cox regression model including sociodemographic and clinical variables, the QLQ‐C30 summary score was associated significantly with all‐cause mortality (hazard ratio [HR], 0.77; 99% confidence interval [CI], 0.71–0.82). In stratified analyses, significant associations between the summary score and all‐cause mortality were observed for colon, rectal, and prostate cancer, non‐Hodgkin lymphoma, chronic lymphocytic leukemia, and multiple myeloma. The QLQ‐C30 summary score had a stronger association with all‐cause mortality than the global QoL scale (HR, 0.82; 99% CI, 0.77–0.86) or the physical functioning scale (HR, 0.81; 95% CI, 0.77–0.85).
Conclusion
In a real‐world setting, the QLQ‐C30 summary score has a strong prognostic value for overall survival for a number of populations of patients with cancer above and beyond that provided by clinical and sociodemographic variables. The QLQ‐C30 summary score appears to have more prognostic value than the global QoL, physical functioning, or any other scale within the QLQ‐C30.
Implications for Practice
The finding that health‐related quality of life provides distinct prognostic information beyond known sociodemographic and clinical measures, not only around cancer diagnosis (baseline) but also at follow‐up, has implications for clinical practice. Implementation of cancer survivorship monitoring systems for ongoing surveillance may improve post‐treatment rehabilitation that leads to better outcomes.
Keywords: Cancer, Health‐related quality of life, Mortality, Patient‐reported outcome, Survival
Short abstract
This article reports on the association of the novel QLQ‐C30 summary score with all‐cause mortality for several cancer diagnoses and discusses the prognostic value of the summary score above and beyond that of more traditional sociodemographic and clinical prognostic factors.
Introduction
Over the course of the last decades there has been a paradigm shift in the measurement of clinical outcomes, with an increasing focus placed on the patient perspective to complement and augment health care professional reports and laboratory and imaging data 1. Patient‐reported outcomes (PROs) are defined as “any report coming directly from the patient about how they feel and function, without interpretation of the patient's response by a health care professional” 2. Patients with cancer can provide a unique perspective on their own symptom burden, functioning, and health‐related quality of life (HRQoL) 3. In oncological clinical trials and health care, PRO assessment has focused primarily on the multidimensional concept of HRQoL 4: patients’ perception of the effect of their disease and treatment on their physical, psychological, and social functioning 5.
PROs may provide health care professionals with additional data on patients’ prognosis 6. The prognostic value of PROs, and particularly HRQoL, for cancer survival has been studied extensively with clinical trial data 7, 8, 9. For example, Quinten et al. examined data of 11 different cancer types (10,108 patients) pooled from 30 clinical trials and found that, for each cancer site, at least one HRQoL domain (e.g., physical functioning in lung cancer) provided prognostic information beyond that provided by clinical (e.g., World Health Organization performance status, distant metastases) and sociodemographic characteristics (e.g., age, sex) 6. However, although clinical trial data are valuable in developing treatment guidelines and can influence clinical practice, less than 3% of the cancer population is represented in these studies, and thus these data do not necessarily reflect the prognostic value of HRQoL data in daily clinical practice 10. “Real‐world” data from large population‐based cohort studies among patients with a specific cancer diagnosis as well as heterogeneous cancer diagnoses have shown a consistent, independent association of patients’ ratings of their HRQoL with survival duration, with the relative prognostic strength of different HRQoL scales varying across cancer sites 11.
In clinical research it is often difficult to define the most important prognostic HRQoL domain. Some researchers enter all HRQoL domains simultaneously in survival analyses, without exploring relationships among closely related domains. This strategy increases the risk of multicollinearity and spurious findings due to chance 8, 12. Recently, the U.S. Food and Drug Administration (FDA) recommended the use of three well‐defined concepts proximal to a treatments’ effect on the patient: symptomatic adverse events, physical functioning and, where appropriate, a measure of the key symptoms of the disease 4. However, it remains unclear why physical functioning is being recommended as the sole functional outcome to be assessed, because this ignores the potential importance of other functional domains such as emotional and social functioning 13. As it may be difficult to prespecify which HRQoL domains are of most interest, some researchers rely on a one‐ or two‐item scale assessing overall or global quality of life (QoL) 14, 15.
Recently, an overall HRQoL summary score for the core HRQoL questionnaire of the European Organisation for Research and Treatment of Cancer (EORTC) Quality of Life Questionnaire (QLQ‐C30) has been developed 14. This summary score encompasses all symptom (e.g., fatigue, pain) and function domains (e.g., emotional and social functioning) assessed by the QLQ‐C30. A single, higher‐order HRQoL score is hypothesized to be a more meaningful and reliable measure for oncological research 14, 15. However, data on its prognostic value are lacking.
The primary aims of the present population‐based, observational study were to (a) investigate the association of the novel QLQ‐C30 summary score with all‐cause mortality for several cancer diagnoses; (b) determine the added prognostic value of the summary score above and beyond that of more traditional sociodemographic and clinical prognostic factors 16; and (c) compare the prognostic value of the QLQ‐C30 summary score with the frequently used global QoL scale and the recently advocated physical functioning scale. A secondary aim was to compare the prognostic value of the QLQ‐C30 summary score with all other scales of the QLQ‐C30.
Materials and Methods
Design and Setting
Since 2008, the PROFILES (Patient Reported Outcomes Following Initial treatment and Long‐term Evaluation of Survivorship) registry has collected PRO data from both short‐ and long‐term survivors of cancer in The Netherlands. The PROFILES registry is a large, dynamic population‐based cohort used to study the physical and psychosocial impact of cancer and its treatment 17. To date, over 20,000 individuals with 16 different cancer diagnoses have been recruited, and data collection is still ongoing. Complete and comprehensive supplemental data on sociodemographics, clinical characteristics (e.g., tumor and treatment characteristics), and survival are available for the PROFILES cohort via The Netherlands Cancer Registry (NCR) and via linkage with the Dutch municipal records database. Data from the PROFILES registry were used for the current secondary analysis.
Data Collection
A detailed description of the data collection method has been reported previously 17. In brief, all participants in PROFILES were informed about the study via a letter by their (ex‐) attending medical specialist. This letter contained either an informed consent form and a paper questionnaire or a secure link to a web‐based informed consent form and online questionnaire.
Study Sample
The current analysis comprises 12 patient samples (colon, rectal, melanoma, basal and squamous cell, endometrial, ovarian, prostate, thyroid, Hodgkin, non‐Hodgkin lymphoma, chronic lymphocytic leukemia, multiple myeloma) included in the PROFILES registry between May 2009 and April 2015. Although sample size and inclusion criteria varied across samples (related to study aim), in all study samples, the same questionnaires were collected (http://www.profilesregistry.nl) and participants were excluded if they were not able to complete a Dutch language questionnaire because of a language barrier, cognitive impairment, or advanced illness. Individuals who had died or had emigrated prior to the start of the study were excluded from the analysis. Ethical approval was obtained for all study samples separately from a local, certified medical ethics committee.
Measures
Sociodemographic and Clinical Data
Sociodemographic variables obtained from the NCR included date of birth and sex. Study‐specific questions on educational level (high, intermediate, low), partnership (yes, no) and work status (yes, no) were added to all questionnaire packages.
Clinical data obtained from the NCR included date of cancer diagnosis, tumor type and stage, and primary treatments received. Time since diagnosis at time of questionnaire invitation was categorized into 4 quartiles: 0–2 years, 2–3 years, 3–5 years, and > 5 years. Tumor type was classified according to the International Classification of Diseases for Oncology‐3 18, and disease stage was classified according to TNM 19 or Ann Arbor Code (Hodgkin lymphoma and Non‐Hodgkin lymphoma). TNM5 was used for patients diagnosed between 2002 and 2003, TNM6 was used for patients diagnosed between 2003 and 2010, and TNM7 was used for patients diagnosed from 2010 onwards. For chronic lymphocytic leukemia and multiple myeloma, stage was either not applicable or not registered. Primary treatments received (first 6 months after diagnosis) were classified into surgery, systemic therapy (chemotherapy, targeted therapy, immunotherapy), radiation therapy (including brachytherapy), hormonal therapy, no treatment or active surveillance, or unknown. Comorbidity was classified using a modified version of the Charlson Index 20 and categorized into no, one, or more than one comorbid conditions. Patients’ vital status at time of analysis and their date of death where relevant were obtained from the Dutch municipal personal records database and were last verified on February 1, 2017.
Health‐Related Quality of Life
The 30‐item EORTC QLQ‐C30 (version 3.0) was used to assess HRQoL 21. This questionnaire contains five functional scales (physical, role, cognitive, emotional, and social functioning), a global QoL scale, three symptom scales (fatigue, nausea and vomiting, and pain), and six single items (appetite loss, diarrhea, dyspnea, constipation, insomnia, financial impact). The questionnaire has a 1‐week time frame and uses a four‐point response format (“not at all,” “a little,” “quite a bit,” and “very much”), with the exception of the global QoL scale, which has a seven‐point response format. The scores were linearly transformed to a score between 0 and 100 22. For the functioning and the global QoL scales, a higher score indicates better health. For the symptoms scales, a higher score indicates more symptom burden. The QLQ‐C30 summary score is calculated as the mean of the combined 13 QLQ‐C30 scale and item scores (excluding global QoL and financial impact), with a higher score indicating a better HRQoL 14, 23. The summary score was only calculated when all of the required 13 scale and item scores were available.
Statistical Analyses
Statistical analyses were conducted using SAS version 9.4. (SAS Institute, Cary, NC). Independent sample t tests were used to assess differences in the QLQ‐C30 summary scores, global QoL, and physical functioning between patients alive and deceased at censoring date (February 1, 2017). This was done for the total study sample and per cancer type.
For the total sample and for each cancer type separately, we used Cox proportional hazard regression models to model the prognostic value of the QLQ‐C30 summary score, global QoL scale, and the physical functioning scale on survival. For all Cox proportional hazard regression models, date of invitation to participate in a PROFILES study was set as entry time and survival duration was specified as time from invitation until either death or censoring date (follow‐up time). The hazard ratios (HRs) were calculated for every 10‐point difference on the HRQoL scales, which range between 0 and 100. Time between diagnosis and invitation to participate in a study were highly variable. Thus, patients with a shorter time since diagnosis might have had a higher mortality risk compared with patients with a longer time since diagnosis. To adjust for this potential survivorship bias, a variable with the left‐truncation time (time between diagnosis and invitation to participate in the study) was added as a variable and time of diagnosis was set as entry time, for all Cox hazard regression models.
The Cox proportional hazard model assumptions for both unadjusted and adjusted analyses (known sociodemographic and clinical prognostic factors: age, sex, time from diagnosis, stage, number of comorbidities, primary treatments received, partner status, employment, educational level 16) were assessed using a graphic method. Analyses included multiple studies and cohorts and were therefore cluster adjusted for study. The proportional hazard requirement, assuming that the HR was constant over time, was visually checked using log‐log plots, and violation of the requirement was assumed when the lines were not parallel. Likelihood ratio tests to compare the models (with predictors) against the null model (model without predictors) are presented as a measure of robustness of our findings. The p value for HRs was set at .01, lowering the risk of type I errors due to multiple testing.
Cox proportional hazard regression models were also used to estimate the HRs of the other functioning and symptom scales of the QLQ‐C30 to support our decision to focus on three scales only (presented as supplemental online Appendix 1 and 2 only).
Results
Sociodemographic and Clinical Characteristics
In total, 13,993 cancer survivors were invited to participate in one of the cohort studies of the PROFILES registry. Overall, 69% (n = 9,590) of those invited completed the questionnaire, with participation rates for individual tumor type samples varying between 60% and 76%. Figure 1 presents the flow chart.
Figure 1.
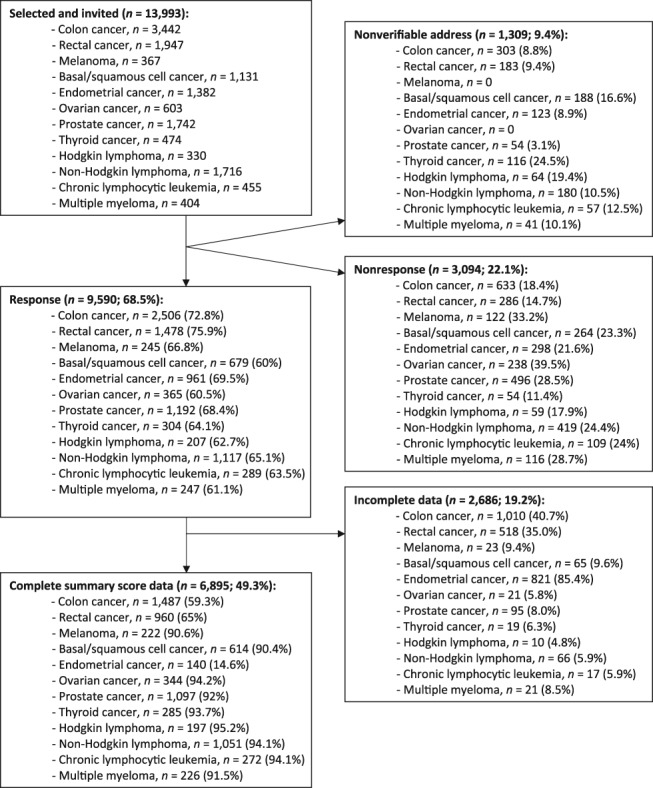
Flow‐chart.
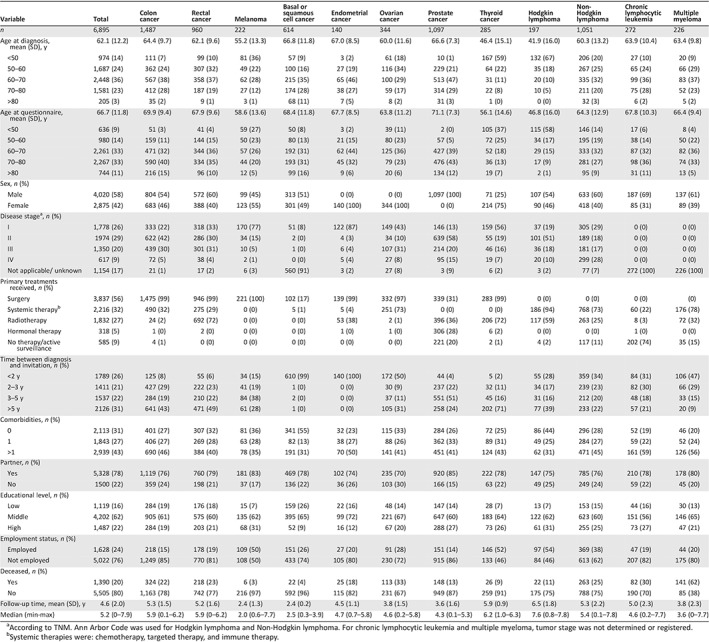
Compared with nonparticipants, participants were more likely to be in the 60–70 year age bracket, were more often male, were more likely to have received active treatment, had fewer comorbidities, and were more likely to have been invited to complete a questionnaire in the period 2–3 years after diagnosis 24. In total, 2,686 (28%) participants were excluded from analyses because of incomplete EORTC‐C30 scale and item scores, which made it impossible to calculate the QLQ‐C30 summary score. Sociodemographic and clinical characteristics of study participants are presented in Table 1.
Table 1.
Sociodemographic and clinical characteristics of study participants
| Variable | Total | Colon cancer | Rectal cancer | Melanoma | Basal or squamous cell cancer | Endometrial cancer | Ovarian cancer | Prostate cancer | Thyroid cancer | Hodgkin lymphoma | Non‐Hodgkin lymphoma | Chronic lymphocytic leukemia | Multiple myeloma |
|---|---|---|---|---|---|---|---|---|---|---|---|---|---|
| n | 6,895 | 1,487 | 960 | 222 | 614 | 140 | 344 | 1,097 | 285 | 197 | 1,051 | 272 | 226 |
| Age at diagnosis, mean (SD), y | 62.1 (12.2) | 64.4 (9.7) | 62.1 (9.6) | 55.2 (13.3) | 66.8 (11.8) | 67.0 (8.5) | 60.0 (11.6) | 66.6 (7.3) | 46.4 (15.1) | 41.9 (16.0) | 60.3 (13.2) | 63.9 (10.4) | 63.4 (9.8) |
| <50 | 974 (14) | 111 (7) | 99 (10) | 81 (36) | 57 (9) | 3 (2) | 61 (18) | 10 (1) | 167 (59) | 132 (67) | 206 (20) | 27 (10) | 20 (9) |
| 50–60 | 1,687 (24) | 362 (24) | 307 (32) | 49 (22) | 100 (16) | 27 (19) | 116 (34) | 229 (21) | 64 (22) | 35 (18) | 267 (25) | 65 (24) | 66 (29) |
| 60–70 | 2,448 (36) | 567 (38) | 358 (37) | 62 (28) | 215 (35) | 65 (46) | 100 (29) | 513 (47) | 31 (11) | 20 (10) | 335 (32) | 99 (36) | 83 (37) |
| 70–80 | 1,581 (23) | 412 (28) | 187 (19) | 27 (12) | 174 (28) | 38 (27) | 59 (17) | 314 (29) | 22 (8) | 10 (5) | 211 (20) | 75 (28) | 52 (23) |
| >80 | 205 (3) | 35 (2) | 9 (1) | 3 (1) | 68 (11) | 7 (5) | 8 (2) | 31 (3) | 1 (0) | 0 (0) | 32 (3) | 6 (2) | 5 (2) |
| Age at questionnaire, mean (SD), y | 66.7 (11.8) | 69.9 (9.4) | 67.9 (9.6) | 58.6 (13.6) | 68.4 (11.8) | 67.7 (8.5) | 63.8 (11.2) | 71.1 (7.3) | 56.1 (14.6) | 46.8 (16.0) | 64.3 (12.9) | 67.8 (10.3) | 66.4 (9.4) |
| <50 | 636 (9) | 51 (3) | 41 (4) | 59 (27) | 50 (8) | 3 (2) | 39 (11) | 2 (0) | 105 (37) | 115 (58) | 146 (14) | 17 (6) | 8 (4) |
| 50–60 | 980 (14) | 159 (11) | 144 (15) | 50 (23) | 80 (13) | 21 (15) | 80 (23) | 57 (5) | 72 (25) | 34 (17) | 195 (19) | 38 (14) | 50 (22) |
| 60–70 | 2,261 (33) | 471 (32) | 344 (36) | 57 (26) | 192 (31) | 62 (44) | 125 (36) | 427 (39) | 52 (18) | 29 (15) | 333 (32) | 87 (32) | 82 (36) |
| 70–80 | 2,267 (33) | 590 (40) | 334 (35) | 44 (20) | 193 (31) | 45 (32) | 79 (23) | 476 (43) | 36 (13) | 17 (9) | 281 (27) | 98 (36) | 74 (33) |
| >80 | 744 (11) | 216 (15) | 96 (10) | 12 (5) | 99 (16) | 9 (6) | 20 (6) | 134 (12) | 19 (7) | 2 (1) | 95 (9) | 31 (11) | 13 (5) |
| Sex, n (%) | |||||||||||||
| Male | 4,020 (58) | 804 (54) | 572 (60) | 99 (45) | 313 (51) | 0 (0) | 0 (0) | 1,097 (100) | 71 (25) | 107 (54) | 633 (60) | 187 (69) | 137 (61) |
| Female | 2,875 (42) | 683 (46) | 388 (40) | 123 (55) | 301 (49) | 140 (100) | 344 (100) | 0 (0) | 214 (75) | 90 (46) | 418 (40) | 85 (31) | 89 (39) |
| Disease stagea, n (%) | |||||||||||||
| I | 1,778 (26) | 333 (22) | 318 (33) | 170 (77) | 51 (8) | 122 (87) | 149 (43) | 146 (13) | 159 (56) | 37 (19) | 305 (29) | 0 (0) | 0 (0) |
| II | 1974 (29) | 622 (42) | 286 (30) | 34 (15) | 2 (0) | 4 (3) | 34 (10) | 639 (58) | 55 (19) | 101 (51) | 189 (18) | 0 (0) | 0 (0) |
| III | 1,350 (20) | 439 (30) | 301 (31) | 10 (5) | 1 (0) | 6 (4) | 107 (31) | 214 (20) | 46 (16) | 36 (18) | 181 (17) | 0 (0) | 0 (0) |
| IV | 617 (9) | 72 (5) | 38 (4) | 2 (1) | 0 (0) | 5 (4) | 27 (8) | 95 (15) | 19 (7) | 20 (10) | 299 (28) | 0 (0) | 0 (0) |
| Not applicable/ unknown | 1,154 (17) | 21 (1) | 17 (2) | 6 (3) | 560 (91) | 3 (2) | 27 (8) | 3 (9) | 6 (2) | 3 (2) | 77 (7) | 272 (100) | 226 (100) |
| Primary treatments received, n (%) | |||||||||||||
| Surgery | 3,837 (56) | 1,475 (99) | 946 (99) | 221 (100) | 102 (17) | 139 (99) | 332 (97) | 339 (31) | 283 (99) | 0 (0) | 0 (0) | 0 (0) | (0) |
| Systemic therapyb | 2,216 (32) | 490 (32) | 275 (29) | 0 (0) | 5 (1) | 5 (4) | 251 (73) | 0 (0) | 0 (0) | 186 (94) | 768 (73) | 60 (22) | 176 (78) |
| Radiotherapy | 1,832 (27) | 24 (2) | 692 (72) | 0 (0) | 0 (0) | 53 (38) | 2 (1) | 396 (36) | 206 (72) | 117 (59) | 263 (25) | 8 (3) | 72 (32) |
| Hormonal therapy | 318 (5) | 1 (0) | 2 (0) | 0 (0) | 0 (0) | 1 (0) | 1 (0) | 306 (28) | 6 (2) | 0 (0) | 0 (0) | 1 (0) | 0 (0) |
| No therapy/active surveillance | 585 (9) | 4 (1) | 0 (0) | 0 (0) | 0 (0) | 0 (0) | 0 (0) | 221 (20) | 2 (1) | 4 (2) | 117 (11) | 202 (74) | 35 (15) |
| Time between diagnosis and invitation, n (%) | |||||||||||||
| <2 y | 1789 (26) | 125 (8) | 55 (6) | 34 (15) | 610 (99) | 140 (100) | 172 (50) | 44 (4) | 5 (2) | 55 (28) | 359 (34) | 84 (31) | 106 (47) |
| 2–3 y | 1411 (21) | 427 (29) | 222 (23) | 41 (19) | 1 (0) | 0 (0) | 30 (9) | 237 (22) | 32 (11) | 34 (17) | 239 (23) | 82 (30) | 66 (29) |
| 3–5 y | 1537 (22) | 284 (19) | 210 (22) | 84 (38) | 2 (0) | 0 (0) | 37 (11) | 551 (51) | 45 (16) | 31 (16) | 212 (20) | 48 (18) | 33 (15) |
| >5 y | 2126 (31) | 641 (43) | 471 (49) | 61 (28) | 1 (0) | 0 (0) | 105 (31) | 258 (24) | 202 (71) | 77 (39) | 233 (22) | 57 (21) | 20 (9) |
| Comorbidities, n (%) | |||||||||||||
| 0 | 2,113 (31) | 401 (27) | 307 (32) | 81 (36) | 341 (55) | 32 (23) | 115 (33) | 284 (26) | 72 (25) | 86 (44) | 296 (28) | 52 (19) | 46 (20) |
| 1 | 1,843 (27) | 406 (27) | 269 (28) | 63 (28) | 82 (13) | 38 (27) | 88 (26) | 362 (33) | 89 (31) | 49 (25) | 284 (27) | 59 (22) | 52 (24) |
| >1 | 2,939 (43) | 690 (46) | 384 (40) | 78 (35) | 191 (31) | 70 (50) | 141 (41) | 451 (41) | 124 (43) | 62 (31) | 471 (45) | 161 (59) | 126 (56) |
| Partner, n (%) | |||||||||||||
| Yes | 5,328 (78) | 1,119 (76) | 760 (79) | 181 (83) | 469 (78) | 102 (74) | 235 (70) | 920 (85) | 222 (78) | 147 (75) | 785 (76) | 210 (78) | 178 (80) |
| No | 1500 (22) | 359 (24) | 198 (21) | 37 (17) | 136 (22) | 36 (26) | 103 (30) | 166 (15) | 63 (22) | 49 (25) | 249 (24) | 59 (22) | 45 (20) |
| Educational level, n (%) | |||||||||||||
| Low | 1,119 (16) | 284 (19) | 176 (18) | 15 (7) | 159 (26) | 22 (16) | 48 (14) | 147 (14) | 28 (7) | 13 (7) | 153 (15) | 44 (16) | 30 (13) |
| Middle | 4,202 (62) | 905 (61) | 575 (60) | 135 (62) | 395 (65) | 99 (72) | 221 (67) | 647 (60) | 183 (64) | 122 (62) | 623 (60) | 151 (56) | 146 (65) |
| High | 1,487 (22) | 284 (19) | 203 (21) | 68 (31) | 52 (9) | 16 (12) | 67 (20) | 288 (27) | 73 (26) | 61 (31) | 255 (25) | 73 (27) | 47 (21) |
| Employment status, n (%) | |||||||||||||
| Employed | 1,628 (24) | 218 (15) | 178 (19) | 109 (50) | 151 (26) | 27 (20) | 91 (28) | 151 (14) | 146 (52) | 97 (54) | 369 (38) | 47 (19) | 44 (20) |
| Not employed | 5,022 (76) | 1,249 (85) | 770 (81) | 108 (50) | 433 (74) | 105 (80) | 230 (72) | 915 (86) | 133 (46) | 84 (46) | 613 (62) | 207 (82) | 175 (80) |
| Deceased, n (%) | |||||||||||||
| Yes | 1,390 (20) | 324 (22) | 218 (23) | 6 (3) | 22 (4) | 25 (18) | 113 (33) | 148 (13) | 26 (9) | 22 (11) | 263 (25) | 82 (30) | 141 (62) |
| No | 5,505 (80) | 1,163 (78) | 742 (77) | 216 (97) | 592 (96) | 115 (82) | 231 (67) | 949 (87) | 259 (91) | 175 (75) | 788 (75) | 190 (70) | 85 (38) |
| Follow‐up time, mean (SD), y | 4.6 (2.0) | 5.3 (1.5) | 5.2 (1.6) | 2.4 (1.3) | 2.4 (0.2) | 4.5 (1.1) | 3.8 (1.5) | 3.6 (1.6) | 5.9 (0.9) | 6.5 (1.8) | 5.3 (2.2) | 5.0 (2.3) | 3.8 (2.3) |
| Median (min‐max) | 5.2 (0–7.9) | 5.9 (0.1–6.2) | 5.9 (0–6.2) | 2.0 (0.6–7.7) | 2.5 (0.3–3.9) | 4.7 (0.7–5.8) | 4.6 (0.2–5.8) | 4.3 (0.1–5.3) | 6.2 (1.0–6.3) | 7.6 (0.8–7.8) | 5.4 (0.1–7.8) | 4.6 (0.2–7.7) | 3.6 (0–7.7) |
According to TNM. Ann Arbor Code was used for Hodgkin lymphoma and Non‐Hodgkin lymphoma. For chronic lymphocytic leukemia and multiple myeloma, tumor stage was not determined or registered.
Systemic therapies were: chemotherapy, targeted therapy, and immune therapy.
QLQ‐C30 Summary Score, Global QoL, and Physical Functioning: Overall and per Cancer Type
Participants with colon, rectum, basal and squamous cell, ovarian, prostate, and thyroid cancer and non‐Hodgkin lymphoma who had died had significantly lower QLQ‐C30 summary scores compared with those who were alive during follow‐up (Table 2). The same pattern was found for global QoL (except for Hodgkin lymphoma, in which those alive had significantly higher scores compared with deceased patients) and physical functioning (except for chronic lymphocytic leukemia and multiple myeloma, in which those alive had significantly higher scores compared with deceased patients). Figure 2 shows the proportions of deaths at censuring date by the score distribution of the summary score, global QoL, and physical functioning scale.
Table 2.
Overall EORTC QLQ‐C30 summary scores according to vital status at censoring date
| Tumor type | Summary score | Global QoL | Physical functioning | ||||||||||||
|---|---|---|---|---|---|---|---|---|---|---|---|---|---|---|---|
| Alive at censoring date | Deceased at censoring date | p value | Alive at censoring date | Deceased at censoring date | p value | Alive at censoring date | Deceased at censoring date | p value | |||||||
| n | Mean (SD) | n | Mean (SD) | n | Mean (SD) | n | Mean (SD) | n | Mean (SD) | n | Mean (SD) | ||||
| Total sample | 5,505 | 87.7 (12.9) | 1,390 | 79.6 (16.9) | <.01 | 5,505 | 79.8 (69.7) | 1,390 | 68.4 (21.7) | <.01 | 5,505 | 84.5 (18.2) | 1,390 | 69.8 (23.6) | <.01 |
| Colon cancer | 1,163 | 87.5 (12.5) | 324 | 80.8 (15.6) | <.01 | 1,163 | 79.7 (16.9) | 324 | 69.2 (21.6) | <.01 | 1,163 | 84.5 (18.2) | 324 | 69.4 (23.7) | <.01 |
| Rectum cancer | 742 | 87.7 (12.6) | 218 | 80.4 (16.7) | <.01 | 742 | 79.6 (17.7) | 218 | 69.3 (22.7) | <.01 | 742 | 83.5 (18.0) | 218 | 69.8 (24.8) | <.01 |
| Melanoma | 216 | 92.4 (10.0) | 6 | 85.4 (16.2) | .10 | 216 | 82.6 (17.4) | 6 | 84.7 (16.2) | .76 | 216 | 91.5 (15.6) | 6 | 90.0 (13.2) | .81 |
| Basal or squamous cell cancer | 592 | 92.6 (10.9) | 22 | 82.9 (17.0) | .03 | 592 | 82.1 (16.9) | 22 | 67.9 (22.1) | <.01 | 592 | 87.6 (18.3) | 22 | 73.0 (25.9) | <.01 |
| Endometrial cancer | 115 | 88.1 (9.3) | 25 | 88.2 (8.5) | .98 | 115 | 81.0 (14.5) | 25 | 75.7 (16.8) | .11 | 115 | 90.8 (7.7) | 25 | 90.9 (7.0) | .96 |
| Ovarian cancer | 231 | 83.4 (13.3) | 113 | 72.2 (18.1) | <.01 | 231 | 74.5 (18.2) | 113 | 62.1 (21.7) | <.01 | 231 | 79.8 (20.1) | 113 | 64.7 (22.6) | <.01 |
| Prostate cancer | 949 | 88.9 (12.4) | 148 | 80.1 (18.2) | <.01 | 949 | 79.3 (17.4) | 148 | 69.5 (21.1) | <.01 | 949 | 86.7 (17.2) | 148 | 69.5 (24.3) | <.01 |
| Thyroid cancer | 259 | 85.9 (13.8) | 26 | 78.7 (16.0) | .01 | 259 | 76.4 (19.8) | 26 | 67.3 (19.0) | .03 | 259 | 84.7 (18.2) | 26 | 67.8 (24.4) | <.01 |
| Hodgkin lymphoma | 175 | 87.2 (14.1) | 22 | 86.4 (10.9) | .79 | 175 | 79.0 (17.2) | 22 | 70.1 (17.8) | .03 | 175 | 87.6 (16.2) | 22 | 81.9 (15.5) | .12 |
| Non‐Hodgkin lymphoma | 788 | 85.5 (13.3) | 263 | 80.3 (17.9) | <.01 | 788 | 76.5 (18.2) | 263 | 69.0 (22.3) | <.01 | 788 | 81.5 (18.6) | 263 | 71.5 (22.2) | <.01 |
| Chronic lymphocytic leukemia | 190 | 86.1 (15.4) | 82 | 82.3 (15.6) | .06 | 190 | 76.5 (19.7) | 82 | 72.1 (19.5) | .10 | 190 | 84.1 (18.0) | 82 | 72.1 (22.3) | <.01 |
| Multiple myeloma | 85 | 78.8 (18.6) | 141 | 75.4 (16.7) | .15 | 85 | 68.1 (22.5) | 141 | 64.1 (22.2) | .20 | 85 | 70.8 (22.9) | 141 | 63.5 (23.4) | .02 |

Abbreviations: EORTC QLQ‐C30, European Organization for Research and Treatment of Cancer, Quality of Life Questionnaire‐Core 30; QoL, quality of life.
Figure 2.
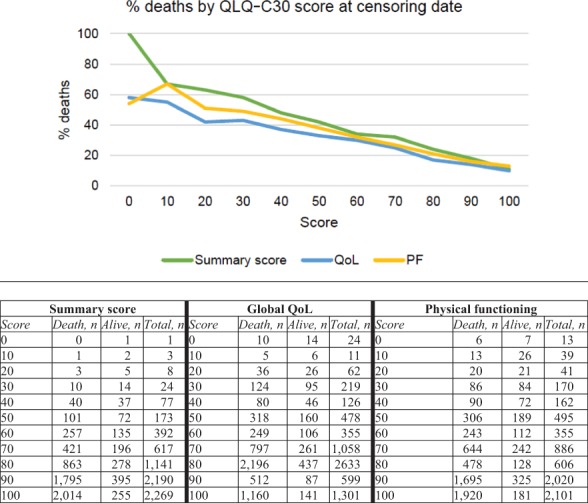
Proportions of deaths at censuring date by the score distribution of summary score, global quality of life (QoL), and physical functioning (PF) scale.
Survival Analyses
In Cox proportional hazard regression models, the QLQ‐C30 summary score was significantly associated with all‐cause mortality, and this remained statistically significant after adjusting for covariates: every 10‐point increase in HRQoL score was associated with a 23% lower risk of death.
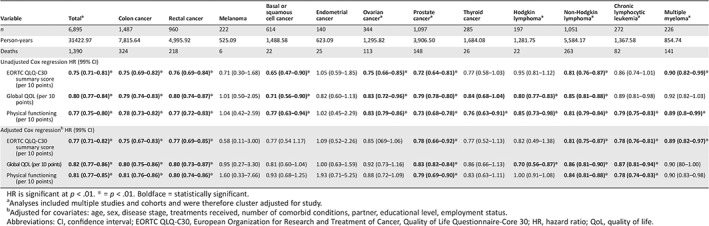
In cancer type stratified, multivariate Cox regression models, significant associations between the QLQ‐C30 summary score and all‐cause mortality were observed for colon, rectal, and prostate cancer, non‐Hodgkin lymphoma, chronic lymphocytic leukemia, and multiple myeloma (Table 3). The same pattern was found for global QoL and physical functioning, although global QoL was also significantly associated with all‐cause mortality for patients with Hodgkin lymphoma. The likelihood ratio tests of all models were statistically significant (robust) for the total group; however, in stratified analyses the likelihood tests of the global QoL (melanoma), QLQ‐C30 summary score (melanoma, Hodgkin lymphoma, endometrial cancer, thyroid cancer, chronic lymphocytic leukemia, multiple myeloma), and physical functioning scale (melanoma, Hodgkin, endometrial cancer) were not significant (Table 4).
Table 3.
Adjusted Cox regression analysis of survival for EORTC QLQ‐C30 summary score, global QoL scale and physical functioning scale
| Variable | Totala | Colon cancer | Rectal cancer | Melanoma | Basal or squamous cell cancer | Endometrial cancer | Ovarian cancera | Prostate cancera | Thyroid cancer | Hodgkin lymphomaa | Non‐Hodgkin lymphomaa | Chronic lymphocytic leukemiaa | Multiple myelomaa |
|---|---|---|---|---|---|---|---|---|---|---|---|---|---|
| n | 6,895 | 1,487 | 960 | 222 | 614 | 140 | 344 | 1,097 | 285 | 197 | 1,051 | 272 | 226 |
| Person‐years | 31422.97 | 7,815.64 | 4,995.92 | 525.09 | 1,488.58 | 623.09 | 1,295.82 | 3,906.50 | 1,684.08 | 1,281.75 | 5,584.17 | 1,367.58 | 854.74 |
| Deaths | 1,390 | 324 | 218 | 6 | 22 | 25 | 113 | 148 | 26 | 22 | 263 | 82 | 141 |
| Unadjusted Cox regression HR (99% CI) | |||||||||||||
| EORTC QLQ‐C30 summary score (per 10 points) | 0.75 (0.71–0.81)* | 0.75 (0.69–0.82)* | 0.76 (0.69–0.84)* | 0.71 (0.30–1.68) | 0.65 (0.47–0.90)* | 1.05 (0.59–1.85) | 0.75 (0.66–0.85)* | 0.72 (0.64–0.81)* | 0.77 (0.58–1.03) | 0.95 (0.81–1.12) | 0.81 (0.76–0.87)* | 0.86 (0.74–1.01) | 0.90 (0.82–0.99)* |
| Global QOL (per 10 points) | 0.80 (0.77–0.84)* | 0.79 (0.74–0.83)* | 0.80 (0.74–0.87)* | 1.01 (0.50–2.05) | 0.71 (0.56–0.90)* | 0.82 (0.60–1.13) | 0.83 (0.72–0.96)* | 0.79 (0.78–0.80)* | 0.84 (0.68–1.04) | 0.80 (0.77–0.83)* | 0.85 (0.81–0.88)* | 0.89 (0.81–0.98) | 0.92 (0.82–1.03) |
| Physical functioning (per 10 points) | 0.77 (0.75–0.80)* | 0.78 (0.73–0.82)* | 0.77 (0.72–0.83)* | 1.04 (0.42–2.59) | 0.77 (0.63–0.94)* | 1.02 (0.45–2.29) | 0.83 (0.79–0.86)* | 0.73 (0.68–0.78)* | 0.76 (0.63–0.91)* | 0.85 (0.73–0.98)* | 0.81 (0.79–0.84)* | 0.79 (0.75–0.83)* | 0.89 (0.8–0.99)* |
| Adjusted Cox regressionb HR (99% CI) | |||||||||||||
| EORTC QLQ‐C30 summary score (per 10 points) | 0.77 (0.71–0.82)* | 0.75 (0.67–0.83)* | 0.77 (0.69–0.85)* | 0.58 (0.11–3.00) | 0.77 (0.54 1.17) | 1.09 (0.52–2.26) | 0.85 (069–1.06) | 0.78 (0.66–0.92)* | 0.77 (0.52–1.13) | 0.82 (0.49–1.38) | 0.81 (0.75–0.87)* | 0.78 (0.76–0.81)* | 0.89 (0.82–0.97)* |
| Global QOL (per 10 points) | 0.82 (0.77–0.86)* | 0.80 (0.75–0.86)* | 0.80 (0.73–0.87)* | 0.95 (0.27–3.30) | 0.81 (0.60–1.04) | 1.00 (0.63–1.59) | 0.92 (0.73–1.16) | 0.83 (0.82–0.84)* | 0.86 (0.66–1.13) | 0.70 (0.56–0.87)* | 0.86 (0.81–0.90)* | 0.87 (0.81–0.94)* | 0.90 (80–1.00) |
| Physical functioning (per 10 points) | 0.81 (0.77–0.85)* | 0.81 (0.76–0.86)* | 0.80 (0.74–0.86)* | 1.60 (0.33–7.66) | 0.93 (0.68–1.25) | 1.93 (0.71–5.25) | 0.88 (0.72–1.09) | 0.79 (0.69–0.90)* | 0.83 (0.63–1.11) | 1.00 (0.91–1.08) | 0.84 (0.81–0.88)* | 0.78 (0.74–0.83)* | 0.90 (0.83–0.98) |
HR is significant at p < .01. * = p < .01. Boldface = statistically significant.
Analyses included multiple studies and cohorts and were therefore cluster adjusted for study.
Adjusted for covariates: age, sex, disease stage, treatments received, number of comorbid conditions, partner, educational level, employment status.
Abbreviations: CI, confidence interval; EORTC QLQ‐C30, European Organization for Research and Treatment of Cancer, Quality of Life Questionnaire‐Core 30; HR, hazard ratio; QoL, quality of life.
Table 4.
Likelihood ratio tests of Cox regression analyses for other EORTC QLQ‐C30 scales
| Variable | Total,a n = 6,895 | Colon cancer, n = 1,487 | Rectal cancer, n = 960 | Melanoma, n = 222 | Basal or squamous cell cancer, n = 614 | Endometrial cancer, n = 140 | Ovarian cancer,a n = 344 | Prostate cancer,a n = 1,097 | Thyroid cancer, n = 285 | Hodgkin lymphoma,a n = 197 | Non‐ Hodgkin lymphoma,a n = 1,051 | Chronic lymphocytic leukemia,a n = 272 | Multiple myeloma,a n = 226 |
|---|---|---|---|---|---|---|---|---|---|---|---|---|---|
| Unadjusted Cox regression, −2 Log likelihood ratio | |||||||||||||
| EORTC QLQ‐C30 summary score | |||||||||||||
| Full model | 21,207.7 | 4,087.3 | 2,543.5 | 42.0 | 267.4 | 232.1 | 1,052.5 | 1,807.1 | 223.0 | 182.6 | 3,146.3 | 769.6 | 1,263.5 |
| Null model | 21,504.1* | 4,147.2* | 2,586.9* | 42.9 | 276.6* | 232.2 | 1,076.6* | 1,852.6* | 227.7 | 182.7 | 3,175.3* | 774.3 | 1,268.6 |
| Global QOL | |||||||||||||
| Full model | 19,928.5 | 3,862.0 | 2,409.9 | 27.7 | 222.0 | 172.1 | 928.4 | 1,637.6 | 169.6 | 131.8 | 2,869.8 | 673.4 | 1,162.1 |
| Null model | 20,840.4* | 4,085.0* | 2,582.3* | 42.6 | 262.5* | 230.5* | 1,012.1* | 1,784.4* | 227.4* | 182.4* | 3,014.1* | 733.6* | 1,194.6* |
| Physical functioning | |||||||||||||
| Full model | 20,956.3 | 4,037.2 | 2,512.1 | 42.8 | 254.8 | 232.2 | 1,054.9 | 1,770.4 | 215.3 | 180.8 | 3,121.0 | 741.9 | 1,247.8 |
| Null model | 21,453.6* | 4,147.2* | 2,586.9* | 42.9 | 263.7* | 232.2 | 1,076.6* | 1,852.1* | 227.7* | 182.7 | 3,174.8* | 763.7* | 1,256.9* |
| Adjusted Cox regression b , −2 Log likelihood ratio | |||||||||||||
| EORTC QLQ‐C30 summary score | |||||||||||||
| Full model | 20,073.7 | 3,874.8 | 2,419.1 | 27.0 | 239.7 | 172.0 | 934.2 | 1,636.8 | 168.5 | 136.2 | 2,895.3 | 675.9 | 1,204.4 |
| Null model | 20,987.7* | 4,086.3* | 2,583.4* | 42.6 | 275.7* | 230.5* | 1,022.8* | 1,784.8* | 227.4* | 182.5* | 3,039.5* | 740.9* | 1,235.8* |
| Global QOL | |||||||||||||
| Full model | 19,928.5 | 3,862.0 | 2,409.9 | 27.7 | 222.0 | 172.1 | 928.4 | 1,637.6 | 169.6 | 131.8 | 2,869.8 | 673.4 | 1,162.1 |
| Null model | 20,840.4* | 4,085.0* | 2,582.3* | 42.6 | 262.5* | 230.5* | 1,012.1* | 1,784.4* | 227.4* | 182.4* | 3,014.1* | 733.6* | 1,194.6* |
| Physical functioning | |||||||||||||
| Full model | 19,977.3 | 3,857.4 | 2,406.9 | 27.0 | 225.9 | 169.1 | 933.9 | 1,623.4 | 168.7 | 136.9 | 2,889.0 | 667.9 | 1,190.8 |
| Null model | 20,953.5* | 4,086.3* | 2,583.4* | 42.6 | 262.8* | 230.5* | 1,022.8* | 1,784.4* | 227.4* | 182.5* | 3,039.0* | 740.9* | 1,224.2* |
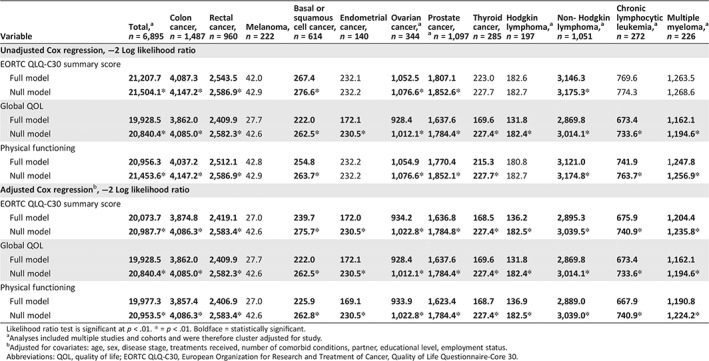
Likelihood ratio test is significant at p < .01. * = p < .01. Boldface = statistically significant.
Analyses included multiple studies and cohorts and were therefore cluster adjusted for study.
Adjusted for covariates: age, sex, disease stage, treatments received, number of comorbid conditions, partner, educational level, employment status.
Abbreviations: QOL, quality of life; EORTC QLQ‐C30, European Organization for Research and Treatment of Cancer, Quality of Life Questionnaire‐Core 30.
In adjusted multivariate Cox regression models, the overall QLQ‐C30 summary score was the strongest predictor of all‐cause mortality (HR, 0.77; p < .01) when compared with the global QoL scale (HR, 0.82; p < .01) or the physical functioning scale (HR, 0.81; p < .01; Table 3). The likelihood test of all models was statistically significant (robust) for the total group and all cancer‐specific models except for melanoma (Table 4).
Secondary analysis of the other QLQ‐C30 scales indicated that all of the functioning scales were significantly associated with all‐cause mortality, with adjusted HRs ranging from 0.86 (p < .01) for role functioning to 0.93 (p < .01) for cognitive functioning (supplemental online Appendix 1). However, these associations were only consistently found for colon, rectal (except cognitive functioning), and prostate cancer (except emotional functioning), non‐Hodgkin lymphoma, chronic lymphocytic leukemia, and multiple myeloma (except social functioning). Fatigue was the only symptom scale significantly associated with all‐cause mortality (adjusted HR, 1; p < .01) for the total group, although pain (colon and rectal cancer) and nausea and vomiting (colon, rectal, ovarian, and prostate cancer, melanoma, Hodgkin lymphoma, chronic lymphocytic leukemia) were significantly associated with all‐cause mortality in certain cancer types. The likelihood test of all adjusted models was statistically significant (robust) for the total group and all cancer specific models except for melanoma (supplemental online Appendix 2).
Discussion
Secondary analysis of data from population‐based PROFILES registry studies indicated that HRQoL was associated with all‐cause mortality in the “real‐world” of daily clinical practice, independent of established sociodemographic and clinical prognostic factors. However, the prognostic value of HRQoL was only observed in certain tumor types. All three EORTC HRQoL measures had prognostic value, although the summary score was most strongly associated with all‐cause mortality.
Our results are in line with previous studies that have reported that HRQoL is a prognostic factor in patients with solid advanced cancers with a high symptom burden, but not always in those with nonsolid tumors and early‐stage cancers 11. The three EORTC QLQ‐C30 scales assessed in this study were not significantly associated with survival among patients with melanoma or endometrial cancer (both predominantly including patients with early‐stage disease), patients with thyroid cancer with a well‐differentiated tumor, and patients with basal cell carcinoma. These patients often receive less aggressive curative treatments and have high overall survival rates. For patients with Hodgkin lymphoma, the QLQ‐C30 summary score was not prognostic; only the global QoL scale remained significant. This suggests that, for this specific patient group, self‐reported global QoL is a unique indicator of survival 25. In general, these relatively young patients had high functioning levels and low levels of symptoms, and it might therefore be that patient satisfaction or overall enjoyment of life is a more important prognostic factor. Furthermore, we did not observe a significant association between any of the three EORTC QLQ‐C30 scales and all‐cause mortality for patients with ovarian cancer. For these patients, other factors, including age and disease stage, but also emotional and social functioning specifically, were more important prognostic indicators.
Several explanations are described in the literature for the consistent link of HRQoL and survival. First, patient‐reported HRQoL might better reflect survival‐related functioning and well‐being than traditional prognostic (clinician‐reported) indicators (e.g., performance status, toxicity) 8. This may be because PRO measures, especially the EORTC summary score, are composed of different questions with more sensitive response scales that reflect distinct and unique aspects of well‐being. Recent studies have shown that clinicians miss up to half of the self‐reported subjective toxicities reported by patients with cancer 26. Second, HRQoL measures might be more sensitive to prognostically relevant lowered patient well‐being than other measures like performance status. Third, PROs also reflect individual characteristics (e.g., coping with stressful circumstances, personality, illness perceptions) that might affect the disease process. For example, some studies suggest that stress‐related adaptation processes could have physiological consequences such as alterations in cellular immune function and proinflammatory signaling during cancer survivorship, which in turn could influence disease progression 27. Finally, higher HRQoL scores are linked with more positive behaviors, such as treatment adherence and healthy lifestyles, that may affect survival.
The finding that the EORTC QLQ‐C30 summary score provides distinct prognostic information beyond known sociodemographic and clinical measures, not only around cancer diagnosis (baseline) but also at follow‐up, has implications for clinical practice and future research. Recent studies have shown that the availability of PRO data can improve symptom management, patient‐clinician communication, shared decision making, and patients’ satisfaction with care 28, 29, 30, 31. A randomized clinical trial by Basch et al. 32, 33 of 766 patients with cancer demonstrated that a simple intervention, a web‐based tool that enables patients to report their symptoms in real time and triggers alerts to clinicians, can have major benefits, including less frequent admissions to the emergency room or hospitalizations, remaining longer on chemotherapy, and longer survival. These and our findings highlight the need for routine cancer survivorship PRO monitoring systems 34. PROs reflect how cancer and its treatment affect patients, which will help to direct health care professionals to areas of concern. Early detection via routine monitoring of deterioration in functional health and symptom burden would enable timely patient‐specific supportive care interventions that may improve HRQoL and possibly survival of cancer survivors. Our findings indicate that the availability of the QLQ‐C30 summary score alongside other prognostic variables allows for a more holistic approach. When a cutoff score for the QLQ‐C30 summary score becomes available in the future, it might even be possible to use the summary score for screening purposes. However, more detailed HRQoL assessments should always be carried out in the interest of more personalized care.
To date, many studies of the prognostic value of HRQoL were based on retrospective analysis of clinical trial data. Although this is one of the best‐known methodologies to evaluate treatment outcomes, results are limited by the selected study samples (e.g., some or no comorbid conditions, good performance status, strict follow‐up and surveillance). Our study adds to the current “real‐world” evidence 11 by demonstrating that the QLQ‐C30 summary score is a significant prognostic factor for survival in specific tumor types. Moreover, our results also show that the summary score, global QoL scale, and physical functioning scale are stronger predictors of all‐cause mortality than the other functioning and symptom scales of the QLQ‐C30, although some scales are shown to be particularly relevant for specific cancer types. The use of data from the PROFILES registry provides several advantages: population‐based study samples; uniform patient recruitment procedures; use of a single, validated HRQoL measure; and availability of clinical registry data for linkage with HRQoL data.
Secondary data analysis of registry data also has some limitations. First, our study sample is a collection of separate study samples, with different inclusion criteria and sample sizes, and therefore heterogeneous with regard to years since initial cancer diagnosis. However, data collection method was similar across studies, we corrected for clustering, and we addressed possible survivorship bias by using a left‐truncated Cox regression model. Second, for most cancer types, pretreatment HRQoL data of the patients were lacking. It could be argued that pretreatment HRQoL is more likely to reflect (premorbid) disease‐specific characteristics, whereas follow‐up HRQoL reflects treatment‐specific characteristics and that changes in HRQoL over time might be more interesting than only a single measure at one time point. Third, we only had information on primary treatment, and not on treatment following recurrence or for emergent metastatic disease. Therefore, mortality estimates should be interpreted with caution. Fourth, although we corrected for a range of generic sociodemographic and clinical covariates, there is still the possibility of residual confounding by additional, condition‐specific clinical variables. We cannot rule out that HRQoL scales became significant simply because other well‐established (disease‐specific) variables (e.g., performance status) were not included in the prognostic models. However, other prognostic studies that have included performance status in the statistical models have supported the independent, prognostic value of QLQ‐C30 data 11. Finally, the sample size for some patient groups was relatively small resulting in limitations of statistical power, and some prevalent cancer types (e.g., breast cancer) were not available.
Conclusion
This population‐based study indicates that, for a number of populations of patients with cancer, a summary score reflecting different domains of HRQoL has a strong prognostic value for overall survival above and beyond that of sociodemographic and clinical variables. Furthermore, the summary score appears to have more prognostic value than the global QoL, physical functioning, or any other scale within the QLQ‐C30.
Author Contributions
Conception/design: Olga Husson, Belle H. de Rooij, Jacobien Kieffer, Simone Oerlemans, Floortje Mols, Neil K. Aaronson, Winette T.A. van der Graaf, Lonneke V. van de Poll‐Franse
Provision of study material or patients: Olga Husson, Simone Oerlemans, Floortje Mols, Lonneke V. van de Poll‐Franse
Collection and/or assembly of data: Olga Husson, Simone Oerlemans, Floortje Mols, Lonneke V. van de Poll‐Franse
Data analysis and interpretation: Olga Husson, Belle H. de Rooij, Jacobien Kieffer, Simone Oerlemans, Floortje Mols, Neil K. Aaronson, Winette T.A. van der Graaf, Lonneke V. van de Poll‐Franse
Manuscript writing: Olga Husson, Belle H. de Rooij, Jacobien Kieffer, Simone Oerlemans, Floortje Mols, Neil K. Aaronson, Winette T.A. van der Graaf, Lonneke V. van de Poll‐Franse
Final approval of manuscript: Olga Husson, Belle H. de Rooij, Jacobien Kieffer, Simone Oerlemans, Floortje Mols, Neil K. Aaronson, Winette T.A. van der Graaf, Lonneke V. van de Poll‐Franse
Disclosures
The authors indicated no financial relationships.
Supporting information
See http://www.TheOncologist.com for supplemental material available online.
Supplemental Appendices
Acknowledgments
The PROFILES registry was funded by an Investment Grant (no. 480‐08‐009) of The Netherlands Organization for Scientific Research (The Hague, The Netherlands). Dr. Olga Husson is supported by a Social Psychology Fellowship from the Dutch Cancer Society (no. KUN2015‐7527). These funding agencies had no further role in study design; in the collection, analysis, and interpretation of data; in the writing of the paper; and in the decision to submit the paper for publication.
The preliminary results of this study were presented at the annual ASCO conference 2018: http://ascopubs.org/doi/abs/10.1200/JCO.2018.36.15_suppl.10070.
Disclosures of potential conflicts of interest may be found at the end of this article.
Editor's Note: See the related article, “The EORTC QLQ‐C30 Summary Score as a Prognostic Factor for Survival of Patients with Cancer: A Commentary” by Bernd Kasper on https://doi.org/10.1634/theoncologist.2019-0749 of this issue.
References
- 1. Basch E, Spertus J, Dudley RA et al. Methods for developing patient‐reported outcome‐based performance measures (PRO‐PMs). Value Health 2015;18:493–504. [DOI] [PubMed] [Google Scholar]
- 2. U.S. Department of Health and Human Services FDA Center for Drug Evaluation and Research, U.S. Department of Health and Human Services FDA Center for Biologics Evaluation and Research, U.S. Department of Health and Human Services FDA Center for Devices and Radiological Health . Guidance for industry: Patient‐reported outcome measures: Use in medical product development to support labeling claims: Draft guidance. Health Qual Life Outcomes 2006;4:79. [DOI] [PMC free article] [PubMed] [Google Scholar]
- 3. Acquadro C, Berzon R, Dubois D et al. Incorporating the patient's perspective into drug development and communication: An ad hoc task force report of the Patient‐Reported Outcomes (PRO) Harmonization Group meeting at the Food and Drug Administration, February 16, 2001. Value Health 2003;6:522–531. [DOI] [PubMed] [Google Scholar]
- 4. Kluetz PG, Slagle A, Papadopoulos EJ et al. Focusing on core patient‐reported outcomes in cancer clinical trials: Symptomatic adverse events, physical function, and disease‐related symptoms. Clin Cancer Res 2016;22:1553–1558. [DOI] [PubMed] [Google Scholar]
- 5. Wilson IB, Cleary PD. Linking clinical variables with health‐related quality of life. A conceptual model of patient outcomes. JAMA 1995;273:59–65. [PubMed] [Google Scholar]
- 6. Quinten C, Martinelli F, Coens C et al. A global analysis of multitrial data investigating quality of life and symptoms as prognostic factors for survival in different tumor sites. Cancer 2014;120:302–311. [DOI] [PubMed] [Google Scholar]
- 7. Quinten C, Coens C, Mauer M et al. Baseline quality of life as a prognostic indicator of survival: A meta‐analysis of individual patient data from EORTC clinical trials. Lancet Oncol 2009;10:865–871. [DOI] [PubMed] [Google Scholar]
- 8. Gotay CC, Kawamoto CT, Bottomley A et al. The prognostic significance of patient‐reported outcomes in cancer clinical trials. J Clin Oncol 2008;26:1355–1363. [DOI] [PubMed] [Google Scholar]
- 9. Ediebah DE, Quinten C, Coens C et al. Quality of life as a prognostic indicator of survival: A pooled analysis of individual patient data from canadian cancer trials group clinical trials. Cancer 2018;124:3409–3416. [DOI] [PubMed] [Google Scholar]
- 10. Meyer AM, Basch E. Big data infrastructure for cancer outcomes research: Implications for the practicing oncologist. J Oncol Pract 2015;11:207–208. [DOI] [PubMed] [Google Scholar]
- 11. Montazeri A. Quality of life data as prognostic indicators of survival in cancer patients: An overview of the literature from 1982 to 2008. Health Qual Life Outcomes 2009;7:102. [DOI] [PMC free article] [PubMed] [Google Scholar]
- 12. Efficace F, Biganzoli L, Piccart M et al. Baseline health‐related quality‐of‐life data as prognostic factors in a phase III multicentre study of women with metastatic breast cancer. Eur J Cancer 2004;40:1021–1030. [DOI] [PubMed] [Google Scholar]
- 13. Groenvold M, Aaronson NK, Darlington AE et al.; EORTC Quality of Life Group. Focusing on core patient‐reported outcomes in cancer clinical trials‐letter. Clin Cancer Res 2016;22:5617. [DOI] [PubMed] [Google Scholar]
- 14. Giesinger JM, Kieffer JM, Fayers PM et al. Replication and validation of higher order models demonstrated that a summary score for the EORTC QLQ‐C30 is robust. J Clin Epidemiol 2016;69:79–88. [DOI] [PubMed] [Google Scholar]
- 15. Pagano IS, Gotay CC. Modeling quality of life in cancer patients as a unidimensional construct. Hawaii Med J 2006;65:76–80, 82–5. [PubMed] [Google Scholar]
- 16. Galvin A, Delva F, Helmer C et al. Sociodemographic, socioeconomic, and clinical determinants of survival in patients with cancer: A systematic review of the literature focused on the elderly. J Geriatr Oncol 2018;9:6–14. [DOI] [PubMed] [Google Scholar]
- 17. van de Poll‐Franse LV, Horevoorts N, van Eenbergen M et al. The Patient Reported Outcomes Following Initial treatment and Long term Evaluation of Survivorship registry: Scope, rationale and design of an infrastructure for the study of physical and psychosocial outcomes in cancer survivorship cohorts. Eur J Cancer 2011;47:2188–2194. [DOI] [PubMed] [Google Scholar]
- 18. Fritz A, Percy C, Jack A et al. International Classification of Diseases for Oncology, 3rd ed. Geneva, Switzerland: World Health Organisation, 2000. [Google Scholar]
- 19. Sobin LH, Fleming ID. TNM Classification of Malignant Tumors, fifth edition (1997) . Union Internationale Contre le Cancer and the American Joint Committee on Cancer. Cancer 1997;80:1803–1804. [DOI] [PubMed] [Google Scholar]
- 20. Charlson ME, Pompei P, Ales KL et al. A new method of classifying prognostic comorbidity in longitudinal studies: Development and validation. J Chronic Dis 1987;40:373–383. [DOI] [PubMed] [Google Scholar]
- 21. Aaronson NK, Ahmedzai S, Bergman B et al. The European Organization for Research and Treatment of Cancer QLQ‐C30: A quality‐of‐life instrument for use in international clinical trials in oncology. J Natl Cancer Inst 1993;85:365–376. [DOI] [PubMed] [Google Scholar]
- 22. Cocks K, King MT, Velikova G et al. Evidence‐based guidelines for determination of sample size and interpretation of the European Organisation for the Research and Treatment of Cancer Quality of Life Questionnaire Core 30. J Clin Oncol 2011;29:89–96. [DOI] [PubMed] [Google Scholar]
- 23. Gundy CM, Fayers PM, Groenvold M et al. Comparing higher order models for the EORTC QLQ‐C30. Qual Life Res 2012;21:1607–1617. [DOI] [PMC free article] [PubMed] [Google Scholar]
- 24. de Rooij BH, Ezendam NPM, Mols F et al. Cancer survivors not participating in observational patient‐reported outcome studies have a lower survival compared to participants: The population‐based PROFILES registry. Qual Life Res 2018;27:3313–3324. [DOI] [PMC free article] [PubMed] [Google Scholar]
- 25. Jylhä M. What is self‐rated health and why does it predict mortality? Towards a unified conceptual model. Soc Sci Med 2009;69:307–316. [DOI] [PubMed] [Google Scholar]
- 26. Di Maio M, Gallo C, Leighl NB et al. Symptomatic toxicities experienced during anticancer treatment: Agreement between patient and physician reporting in three randomized trials. J Clin Oncol 2015;33:910–915. [DOI] [PubMed] [Google Scholar]
- 27. Antoni MH. Psychosocial intervention effects on adaptation, disease course and biobehavioral processes in cancer. Brain Behav Immun 2013;30(suppl):S88–S98. [DOI] [PMC free article] [PubMed] [Google Scholar]
- 28. Valderas JM, Kotzeva A, Espallargues M et al. The impact of measuring patient‐reported outcomes in clinical practice: A systematic review of the literature. Qual Life Res 2008;17:179–193. [DOI] [PubMed] [Google Scholar]
- 29. Chen J, Ou L, Hollis SJ. A systematic review of the impact of routine collection of patient reported outcome measures on patients, providers and health organisations in an oncologic setting. BMC Health Serv Res 2013;13:211. [DOI] [PMC free article] [PubMed] [Google Scholar]
- 30. Detmar SB, Muller MJ, Schornagel JH et al. Health‐related quality‐of‐life assessments and patient‐physician communication: A randomized controlled trial. JAMA 2002;288:3027–3034. [DOI] [PubMed] [Google Scholar]
- 31. Velikova G, Booth L, Smith AB et al. Measuring quality of life in routine oncology practice improves communication and patient well‐being: A randomized controlled trial. J Clin Oncol 2004;22:714–724. [DOI] [PubMed] [Google Scholar]
- 32. Basch E, Deal AM, Dueck AC et al. Overall survival results of a trial assessing patient‐reported outcomes for symptom monitoring during routine cancer treatment. JAMA 2017;318:197–198. [DOI] [PMC free article] [PubMed] [Google Scholar]
- 33. Basch E, Deal AM, Kris MG et al. Symptom monitoring with patient‐reported outcomes during routine cancer treatment: A randomized controlled trial. J Clin Oncol 2016;34:557–565. [DOI] [PMC free article] [PubMed] [Google Scholar]
- 34. Corsini N, Fish J, Ramsey I et al. Cancer survivorship monitoring systems for the collection of patient‐reported outcomes: A systematic narrative review of international approaches. J Cancer Surviv 2017;11:486–497. [DOI] [PubMed] [Google Scholar]
Associated Data
This section collects any data citations, data availability statements, or supplementary materials included in this article.
Supplementary Materials
See http://www.TheOncologist.com for supplemental material available online.
Supplemental Appendices