

Abstract
Purpose
This study aimed to profile the characteristics of patients with colorectal cancer (CRC) with a second primary malignancy (SPM) and to identify patients with CRC at high risk of developing SPMs.
Methods
We retrospectively reviewed data on patients with CRC aged 20–79 years from the Surveillance, Epidemiology, and End Results (SEER) database. Eligible patients were categorized into only one primary malignancy and SPM cohorts. A competing‐risk model was used to quantify associations between SPM occurrence and the multiple traits of patients. Finally, a decision curve analysis (DCA) was used to evaluate the clinical usefulness of the model by calculating net benefit.
Results
A total of 179,884 patients were identified, 18,285 (10.2%) of whom developed SPMs during a maximum follow‐up of approximately 18 years. The median survival time after the second diagnosis was less than 4 years. The 3‐year, 5‐year, and 10‐year cumulative risks of developing an SPM were 3.9%, 5.9%, and 10.0%, respectively. According to the multivariable competing‐risk model, male colon cancer survivors, older in age, with a well‐differentiated tumor and localized disease, who were treated with surgery were susceptible to SPMs. The DCA yielded a wide range of risk thresholds at which the net benefits would be obtained from our proposed model.
Conclusion
CRC survivors remain at high risk of developing SPMs. Patients with a second diagnosis of cancer showed not only significantly worse survival but also higher cancer‐specific mortality. A web‐based individualized predictive tool was also provided to assist clinicians in identifying patients at high risk of developing SPMs and planning their future care management.
Implications for Practice
Colorectal cancer survivors remain at high risk of developing a second primary malignancy (SPM). This study aimed to profile the characteristics of patients with colorectal cancer with second primary malignancies and to further explore the risk factors related to the development of second primary malignancies, using a large population‐based cohort. A clinically useful competing‐risk nomogram was developed to predict the risk of SPMs based on individual clinical factors. According to the findings, older age, male sex, white or black race, localized disease, and treatment with surgery among patients with colon cancer were associated with an increased risk of developing an SPM. These findings and the proposed tool could be useful to clinicians and caregivers in the clinical counseling of patients with colorectal cancer and the development of long‐term care management.
Keywords: Colorectal cancer, Second primary malignancy, SEER, Competing‐risk model, Nomogram
Short abstract
Little is known about the factors that contribute to the development of a new malignancy among colorectal cancer survivors. This study aimed to comprehensively profile the characteristics of patients with colorectal cancer with a second primary malignancy and, further, to identify patients at high risk for developing a second primary malignancy.
Introduction
Colorectal cancer (CRC) is the third most common invasive cancer in the U.S. It was estimated that there would be 145,600 new patients with CRC in 2019 1. With the advancements in cancer treatment, increased early‐stage diagnosis, and cancer screening efforts, the mortality from CRC dropped rapidly by 53% from 1970 to 2016 1. Almost two thirds of patients with CRC survived for >5 years 2, leading to a steadily increasing number of survivors. However, long‐term negative outcomes in these survivors, including the risk of developing a second primary malignancy (SPM), have attracted interest among researchers 3, 4, 5, 6. Most of these studies, to date, have focused either on comparing the risk of developing a subsequent cancer with that of the general population 7, 8 or on describing the SPM‐related factors in survivors with certain site‐specific cancers, such as lung 9, esophageal 10, and gastric cancer 11. Less is known regarding the simultaneous effect of intrinsic factors, such as age at diagnosis, sex, race, and tumor characteristics, contributing to the development of a new malignancy among CRC survivors.
This study aimed to comprehensively profile the characteristics of patients with CRC with SPMs and to further identify patients at high risk to develop SPMs, using a large, population‐based cohort. We hypothesized that patients with CRC would experience worse survival if they developed higher order malignancies and that favorable prognostic factors related to the initial CRC might be associated with an increased risk of developing SPMs because of the fact that prolonged survival was frequently observed in those patients. We first evaluated the demographic and clinical differences between patients with CRC with only one primary malignancy (OOPM) and those with SPMs. Next, we aimed to determine the significant intrinsic factors associated with the development of SPMs. Finally, we established a web‐based evaluation system based on a competing‐risk nomogram to identify the CRC survivors who were at high risk of developing SPMs.
Materials and Methods
Data Sources
We extracted data from the most current version of the Surveillance, Epidemiology, and End Results (SEER) research database (November 2017 release) 12. The SEER program is the most authoritative and premier source of cancer statistics in the U.S., collecting demographics, tumor characteristics, and survival data from 18 population‐based cancer registries. Primary cancer site and histology were coded according to criteria in the 3rd edition of the International Classification of Diseases for Oncology (ICD‐O‐3). Patients with colon cancer were identified using ICD‐O‐3 site codes C18.0 and C18.2–C18.9, whereas patients with rectal cancer were identified using C19.9 and C20.9.
Study Population
This study involved patients who were initially diagnosed with CRC aged between 20 and 79 years. Although data were available through 2015, we included patients with CRC before 2010 to ensure a follow‐up period of at least 5 years after the initial cancer diagnosis, because the risk of developing an SPM depends on the length of the follow‐up period. Additionally, information on cancer treatment, surgery, and radiotherapy was only available from 1998, so we restricted our study cohort to patients who were diagnosed between 1998 and 2010. Moreover, only complete cases without missing values on important covariates (age, race, tumor site, grade, size, surgery, and radiation) were eligible. We subsequently excluded cases that were reported from a death certificate or autopsy, and a 2‐month latency exclusion was set to further distinguish SPMs from the simultaneous cancers. Then, we categorized the identified patients with CRC into two cohorts: the OOPM cohort and the SPM cohort. A study flowchart is presented in supplemental online Figure 1.
Definition of SPM
The SEER rules for classifying multiple primary cancers depended on the cancer site of origin, date of diagnosis, histology, tumor behavior (i.e., in situ versus invasive), and laterality of paired organs. In general, all SPMs occurring 2 or more months after the initial diagnosis were considered as separate primaries unless the medical record stated that the tumor was recurrent or metastatic 13. There were also two key variables of indicating multiple primary malignancies in SEER, “total number of in situ/malignant tumors for patient” and the “sequence number” of the multiple primary malignancies. The former could be used to identify patients with an SPM, and the latter could be used to index the sequence of multiple malignancies.
Outcome and Covariates
The study outcome was the diagnosis of an SPM after the initial diagnosis of CRC. Overall survival (OS) was defined as the time from the initial primary diagnosis to death of any cause. SPM overall survival (SPMOS) was defined as the time from the second primary diagnosis to death of any cause. Demographic covariates of interest included sex, age at initial diagnosis (<50, 50–64, 65–79), and race (white, black, and other). Tumor characteristics included initial primary site (colon, rectum), size (0–3, 3–5, 5–10, >10 cm), extent of disease (localized, regional, distant), number of lymph nodes examined (<12, ≥12), and grade (I: well differentiated, II: moderately differentiated, III: poor‐undifferentiated). Treatment related covariates included radiation therapy (Yes/No) and surgery (Yes/No).
Statistical Analysis
Comparisons of the characteristics between the OOPM and SPM cohorts were summarized with counts and frequencies and tested with chi‐square tests. Kaplan‐Meier curves and cumulative incidence plots were utilized to display the survival of the patients and the cumulative risks of developing an SPM, respectively.
Proportional Subdistribution Hazards Modeling
Failure to recognize or account for the death as a competing event and using standard Cox regression would lead to an overestimate of the incidence of the outcome over time 14. Hence, the Fine and Gray subdistribution hazards model, which connects regression coefficients to a cumulative incidence function to estimate the unbiased risks accounting for competing events 15, 16, was used to estimate the risk of developing a second tumor conditioned on the covariates of interest.
Variable Selection
Candidate covariates for predicting the risk of an SPM included sex, race, age at initial diagnosis, extent of disease, tumor site, size, grade, number of lymph nodes examined, radiation therapy, and surgery. To determine the strongest predictors in the final model, the stepwise elimination method was used, and a variable was considered for addition to or subtraction from the set of variables based on the chi‐square statistics.
Competing‐Risk Nomogram Performance and Evaluation
To provide the clinicians with a quantitative tool to predict the individual probability of developing an SPM, we built a nomogram based on a multivariate competing‐risk model. The sum of the independent factors was located on the total point axis, and a line was drawn downward to the response axes to determine the 3‐year, 5‐year, and 10‐year probabilities of developing an SPM. Moreover, low‐, moderate‐, and high‐risk patients were determined according to the quantiles of total points.
Validation of the proposed nomogram was evaluated with respect to calibration, which was performed using 200 bootstrap resamples, and the concordance index (C‐index), which measured the classification accuracy. However, C‐index does not have a direct clinical interpretation. Therefore, we also applied the decision curve analysis (DCA), a novel method to evaluate prediction models from the perspective of clinical consequences by calculating the net benefit 17. A model is clinically useful if applying it produces a larger net benefit, and it can then be used to assess the nomogram‐assisted decisions at different threshold probabilities, compared with the decisions made with the assumption that either all or none of the patients has an SPM. Statistical analyses were performed with R (https://www.r-project.org). A two‐sided p value less than .05 was considered statistically significant.
Results
A total of 179,884 patients with CRC were identified from the SEER database; of these patients, 18,285 (10.2%) developed SPMs within a median and a maximum follow‐up of 10.5 and 17.9 years, respectively, 2 months after the initial diagnosis. The characteristics of patients with CRC with and without SPMs were significantly different (Table 1). Specifically, approximately 60% of the SPM cohort patients were male and aged >65 years, and about 80% were white in race. Patients with colon cancer showed a slightly higher chance of developing an SPM than patients with rectal cancer. Poor‐undifferentiated tumors or distant extensions in the patients with CRC were associated with a decreased risk of developing an SPM, potentially as a result of a higher chance of death before developing an SPM. Of those patients with SPMs, 12% and 92.4% underwent radiotherapy and local resection, respectively. The most common sites of developing SPMs in CRC survivors were lung and bronchus, prostate, female breast, bladder, and rectum (supplemental online Fig. 2). In addition, the risk of being diagnosed with an SPM gradually increased as the number of follow‐up years increased.
Table 1.
Comparisons of characteristics between patients with colorectal cancer with only one primary malignancy and those with a second primary malignancy
| Variables | Overall, n (%) | OOPM cohort, n (%) | SPM cohort, n (%) | p value |
|---|---|---|---|---|
| Enrolled patients with CRC | 179,884 | 161,599 (89.8) | 18,285 (10.2) | |
| Age at initial diagnosis, years | <.001 | |||
| <50 | 24,556 (13.7) | 23,265 (14.4) | 1,291 (7.1) | |
| 50–64 | 67,094 (37.2) | 60,845 (37.7) | 6,249 (34.2) | |
| 65–79 | 88,234 (49.1) | 77,489 (47.9) | 10,745 (58.7) | |
| Race | <.001 | |||
| Black | 21,390 (11.9) | 19,336 (12.0) | 2,054 (11.2) | |
| White | 142,365 (79.1) | 127,522 (78.9) | 14,843 (81.2) | |
| Other | 16,129 (9.0) | 14,741 (9.1) | 1,388 (7.6) | |
| Sex | <.001 | |||
| Female | 83,742 (46.6) | 76,156 (47.1) | 7,586 (41.5) | |
| Male | 96,142 (53.4) | 85,443 (52.9) | 10,699 (58.5) | |
| Initial diagnosed site | <.001 | |||
| Colon | 129,511 (72.0) | 115,858 (71.7) | 13,653 (74.7) | |
| Rectum | 50,373 (28.0) | 45,741 (28.3) | 4,632 (25.3) | |
| Tumor size, cm | <.001 | |||
| 0–3 | 40,967 (22.8) | 36,177 (22.4) | 4,790 (26.2) | |
| 3–5 | 65,749 (36.5) | 59,096 (36.5) | 6,653 (36.4) | |
| 5–10 | 65,938 (36.7) | 59,732 (37.0) | 6,206 (33.9) | |
| >10 | 7,230 (4.0) | 6,594 (4.1) | 636 (3.5) | |
| Extent of disease | <.001 | |||
| Localized | 66,355 (36.9) | 57,632 (35.7) | 8,723 (47.7) | |
| Regional | 81,372 (45.2) | 72,858 (45.1) | 8,514 (46.6) | |
| Distant | 32,157 (17.9) | 31,109 (19.2) | 1,048 (5.7) | |
| Lymph nodes examined | <.001 | |||
| <12 | 77,138 (42.9) | 68,848 (42.6) | 8,290 (45.4) | |
| ≥12 | 102,570 (57.1) | 92,590 (57.4) | 9,980 (54.6) | |
| Tumor grade | <.001 | |||
| I | 15,583 (8.7) | 13,765 (8.5) | 1,818 (9.9) | |
| II | 127,676 (71.0) | 114,307 (70.7) | 13,369 (73.1) | |
| III | 36,625 (20.3) | 33,527 (20.8) | 3,098 (17.0) | |
| Radiation | <.001 | |||
| No | 155,211 (86.3) | 139,112 (86.1) | 16,099 (88.0) | |
| Yes | 24,673 (13.7) | 22,487 (13.9) | 2,186 (12.0) | |
| Surgery | <.001 | |||
| No surgery | 5,162 (2.9) | 4,980 (3.1) | 182 (1.0) | |
| Local/partial resection | 161,331 (89.7) | 144,436 (89.4) | 16,895 (92.4) | |
| Total resection | 13,391 (7.4) | 12,183 (7.5) | 1,208 (6.6) | |
| Length of follow‐up, years | <.001 | |||
| 5–10 | 90,545 (50.3) | 82,779 (51.2) | 7,766 (42.5) | |
| 10–15 | 75,003 (41.7) | 66,299 (41.1) | 8,704 (47.6) | |
| 15–18 | 14,336 (8.0) | 12,521 (7.7) | 1,815 (9.9) | |
| Status | <.001 | |||
| Alive | 86,327 (48.0) | 78,130 (48.3) | 8,197 (44.8) | |
| Dead | 93,557 (52.0) | 83,469 (51.7) | 10,088 (55.2) | |
| Cause of death | <.001 | |||
| First primary cancer | 60,448 (64.6) | 56,922 (68.2) | 3,526 (34.9) | |
| Multiple malignancies | 4,111 (4.4) | 0 (0.0) | 4,111 (40.7) | |
| Noncancer cause | 27,453 (29.3) | 25,109 (30.1) | 2,344 (23.3) | |
| Unknown | 1,545 (1.7) | 1,438 (1.7) | 107 (1.1) |
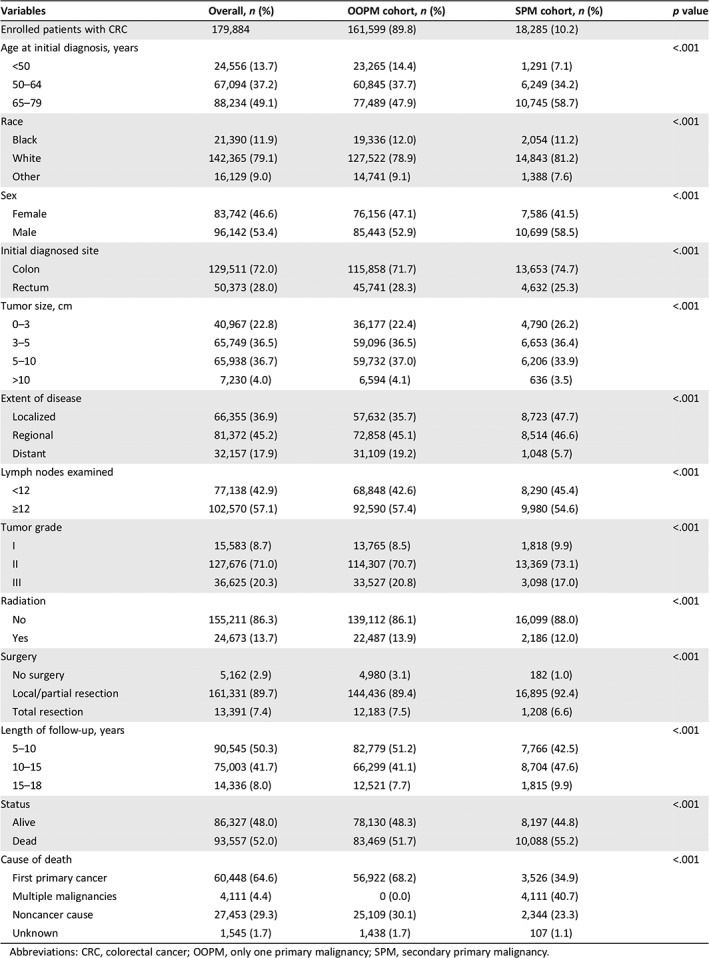
Abbreviations: CRC, colorectal cancer; OOPM, only one primary malignancy; SPM, secondary primary malignancy.
The causes of death in patients in the study cohorts are shown in Table 1 and Figure 1. Overall, 93,557 patients (52%) died, and the proportions of patients who died of cancer in the OOPM and SPM cohorts were 68.2% and 75.6%, respectively. Patients in the SPM cohort seemed more likely to die from the subsequent malignancies than from the initial CRC (40.75% vs. 34.95%).
Figure 1.
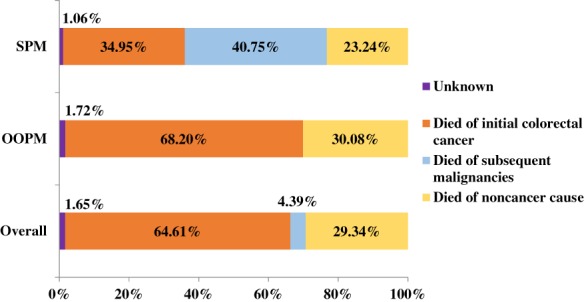
Distribution of causes of death in the two study cohorts and overall.Abbreviations: OOPM, only one primary malignancy; SPM, secondary primary malignancy.
Survival and Cumulative Incidence of Developing an SPM
The median survival times for the OOPM and SPM cohorts were 9.3 and 10.3 years, respectively. The 5‐year, 10‐year, and 15‐year OS and their 95% confidence intervals (CIs) for the OOPM versus the SPM cohort were 61.6% (61.4%–61.9%), 48.5% (48.2%–48.8%), and 38.4% (38.1%–38.8%) versus 76.3% (75.6%–76.9%), 50.9% (50.2%–51.7%), and 33.0% (32.0%–33.9%), respectively. Patients with SPMs experienced better OS in the first 10 years after diagnosis; thereafter, they had worse survival than patients with OOPM (Fig. 2A). Patients with CRC diagnosed with one more subsequent cancer showed significantly worse survival; SPMOS was only 46 months, and 5‐year and 10‐year survival rates were only 44.9% (44.1%–45.7%) and 32.3% (31.4%–33.3%), respectively. Considering death as a competing event, the overall estimates of the 3‐year, 5‐year, and 10‐year cumulative risks of developing an SPM (including the 95% CIs) were 3.9% (3.8%–4.0%), 5.9% (5.8%–6.1%), and 10.0% (9.9%–10.2%), respectively (Fig. 2B). Moreover, the observed cumulative risks among subgroups were also provided (supplemental online Table 1).
Figure 2.
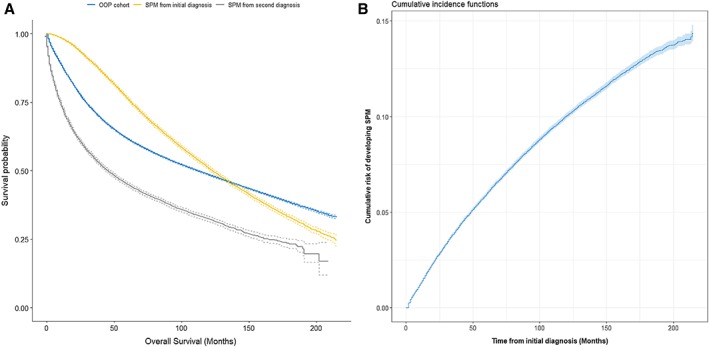
Estimates of overall survival and overall cumulative incidence of developing a second malignancy. (A): Estimates of overall survival for patients with colorectal cancer with only one primary malignancy; for patients with second primary malignancies from their initial diagnosis and from their second diagnosis. (B): Estimates of overall cumulative incidence of developing a second malignancy, taking death as a competing event.Abbreviations: OOPM, only one primary malignancy; SPM, secondary primary malignancy.
Risk Predictors for SPM After a CRC Diagnosis
Factors associated with SPM occurrence after the initial diagnosis were assessed using the Fine and Gray subdistribution hazards model. Results for the retained features after variable selection are listed in Table 2. Older age, male sex, white race, initial diagnosis of colon cancer, localized or regional stage, treatment with surgery (p < .001), and grade I or II (p < .05) were positively associated with an increased risk of developing an SPM. Furthermore, extent of disease, surgery, and age at the initial diagnosis were the three most important factors in predicting SPM risk.
Table 2.
Significant risk factors associated with the development of a second primary malignancy, estimated by the Fine and Gray subdistribution hazards model
| Factors | HR (95% CI) | χ2 | p value |
|---|---|---|---|
| Age at initial diagnosis | |||
| <50 | 1 | ||
| 50–64 | 1.68 (1.58–1.78) | 16.91 | <.001 |
| 65–79 | 2.12 (2.00–2.24) | 25.32 | <.001 |
| Race | |||
| White | 1 | ||
| Black | 1.01 (0.97–1.06) | 0.54 | .587 |
| Other | 0.88 (0.83 –0.93) | −4.63 | <.001 |
| Sex | |||
| Female | 1 | ||
| Male | 1.28 (1.24–1.32) | 16.39 | <.001 |
| Initial diagnosed site | |||
| Rectum | 1 | ||
| Colon | 1.15 (1.11–1.19) | 7.63 | <.001 |
| Extent of disease | |||
| Distant | 1 | ||
| Regional | 3.11 (2.91–3.31) | 34.36 | <.001 |
| Localized | 3.84 (3.59–4.09) | 40.42 | <.001 |
| Tumor grade | |||
| III | 1 | ||
| II | 1.08 (1.04–1.13) | 3.89 | .001 |
| I | 1.10 (1.03–1.16) | 3.05 | .002 |
| Surgery | |||
| No surgery | 1 | ||
| Local or partial resection | 1.82 (1.57–2.11) | 7.94 | <.001 |
| Total resection | 1.74 (1.49–2.04) | 6.96 | <.001 |
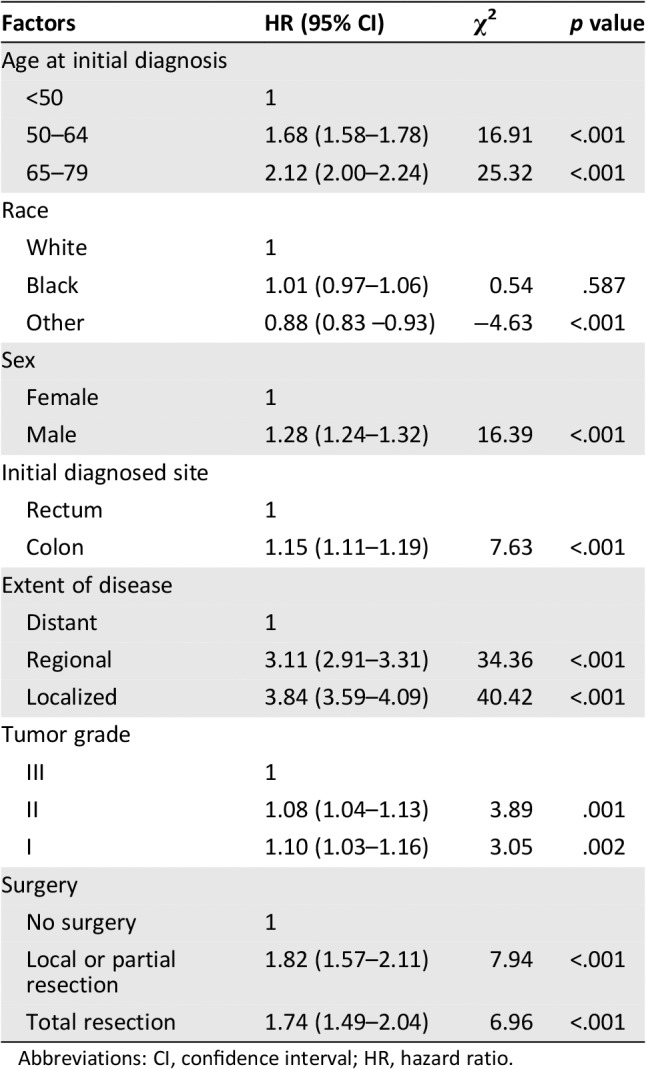
Abbreviations: CI, confidence interval; HR, hazard ratio.
Competing‐Risk Nomogram Performance, Evaluation, and Risk Stratification
A nomogram based on the competing‐risk model was developed to facilitate a simultaneous integration of the previously mentioned factors in the calculation of SPM occurrence (Fig. 3). Low‐, moderate‐, and high‐risk patients were determined according to the quantiles of the calculated total points. A significantly higher cumulated incidence was observed in the high‐risk group versus the low‐risk group (supplemental online Fig. 3). The nomogram had a bootstrap‐corrected C‐index of 63.4% and was well calibrated, as the predicted probabilities were close to the expected probabilities (supplemental online Fig. 4). To further achieve the convenience of clinical application, a web‐based evaluation system for estimating the probability of a patient's risk of developing an SPM was also developed (http://biostat.fudan.edu.cn/crc). Moreover, DCA was used to assess the clinical utility of the nomogram by calculating the net benefit. Results demonstrated that in a wide range of thresholds (1%–17%) for predicting the probability of developing SPMs, the clinical net benefit of the nomogram was larger than that in hypothetical all‐developing or nondeveloping scenarios (Fig. 4).
Figure 3.
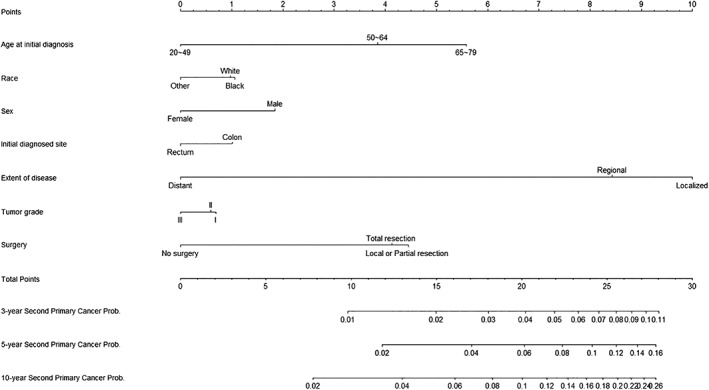
Nomogram for predicting 3‐year, 5‐year, and 10‐year probabilities of developing a second primary malignancy in patients with colorectal cancer.
Figure 4.
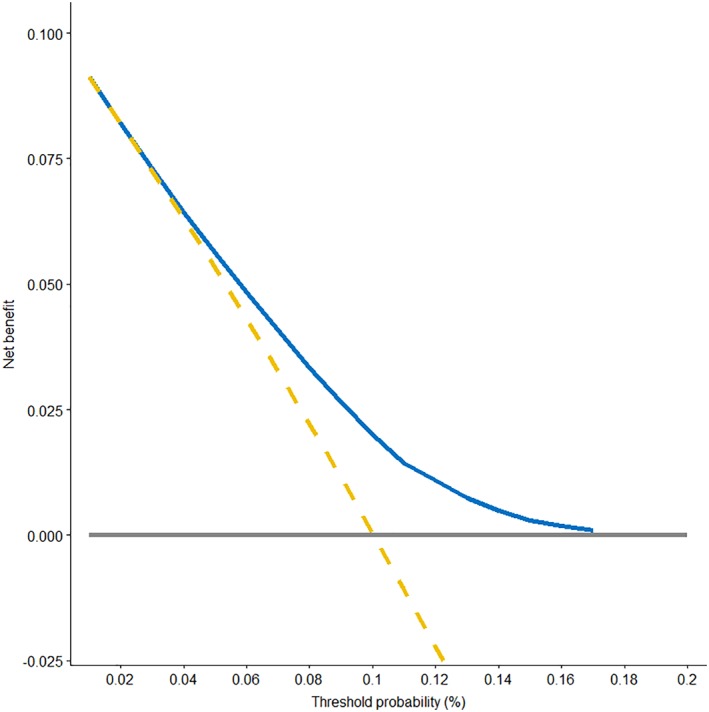
Decision curve analysis for the competing‐risk nomogram. The y‐axis represents the net benefit. The blue solid line represents the competing‐risk nomogram. The golden dashed line represents the hypothesis that all patients had secondary primary malignancies (SPMs). The gray solid line represents the hypothesis that no patients had an SPM. The x‐axis represents the threshold probability. The decision curve showed that if the threshold probability was between 1% and 17%, then using the competing‐risk nomogram to predict the probability of developing SPMs added more benefit than treating either all or no patients would have an SPM.
Discussion
The incidence of multiple malignancies has doubled from 1979 to 2009, and approximately one fifth of all new primary malignancies occurred in cancer survivors 18, 19. However, these patients were frequently excluded from most of the cancer clinical trials or observational studies, and little is known about their survival and the related factors 20, 21, 22. Thus, understanding the nature of SPMs and identifying high‐risk patients are of both clinical and public health importance. This population‐based analysis adds evidence to previous findings that CRC survivors subsequently remain at a high risk of developing an SPM 23, 24, 25, 26. The major strength of this study is avoidance of ascertainment bias in patient selection by using the latest population‐based database and, consequently, the identification of a large number of patients with CRC with SPMs. To our knowledge, this is the first and largest study to comprehensively profile the characteristics of CRC survivors and unbiasedly investigate their risk of developing an SPM, using a competing‐risk model.
Several interesting findings were demonstrated in the current study. Firstly, approximately one in ten CRC survivors developed a new malignancy within the study period of approximately 18 years. Thus, it is increasingly important to address the unique needs of cancer survivors, as this may affect their future health. In addition, this study provides further clinical and survival details on patients with CRC with SPMs. As noted, a high mortality rate was associated with multiple primary malignancies, and the rate even exceeded that of the initial cancer. This phenomenon might be explained by the fact that (a) some new malignancies, such as lung or liver cancer, were more lethal than the initial CRC; (b) patients who received prior chemo‐radiotherapy might have not responded well to a second round of systemic treatment; and (c) patients in the SPM cohort were generally older, and more‐aggressive regimens were less likely to be offered to them than to their younger counterparts. We also found that patients with SPM experienced better survival in the first 10 years after initial diagnosis and worse survival afterward compared with the patients with only CRC. The median survival time after the second diagnosis was less than 4 years. Such poorer prognosis of patients with CRC with SPMs may not only be due to higher tumor burden and presence of comorbid conditions but may also be due to higher psychological burden 27, 28. The most common sites of developing SPMs in CRC survivors were lung, prostate, and female breast; this finding might suggest for clinicians that after the treatment of initial colorectal cancer, surveillance for lung, prostate (male patients), and breast (female patients) would also be necessary especially for those high‐risk patients, and discussion by a multidisciplinary team would be preferable.
Secondly, quantifying the simultaneous effect of demographic and clinical factors associated with the development of SPMs is of growing concern for CRC survivor care and surveillance. Notably, a substantial proportion of patients die before developing an SPM, so a statistical methodology for handling competing events becomes necessary. Our multivariable analysis found that patients with CRC with SPMs tended to be older, male, white or black in race, initially diagnosed with colon cancer, and have a well‐differentiated, localized or regional disease. Older age, male sex, white or black race, and colon cancer have been linked to an increased risk of SPM previously 3, 25, 29, 30. The other independent prognostic factors, including localized or regional disease, grade I or II tumor cells, and surgery treatment, have been commonly known as factors with a good prognosis. However, our findings are not counterintuitive because on one hand, patients with CRC with good prognostic factors are more likely to have adequate time to develop an SPM. On the other hand, those “good prognostic factors” we commonly referred to are predictive of 5‐year or 10‐year OS but not sensitive to longer‐term survival, especially in patients with SPMs..5
Finally, a practical tool, called the competing‐risk nomogram, was demonstrated in our study. Currently, there has been no consensus on guidelines regarding the surveillance, continuity of care, and further management of CRC survivors. Our proposed nomogram could be useful for calculating the 3‐year, 5‐year, and 10‐year probabilities of developing an SPM in the presence of competing causes of death. Unlike most prior studies that have assessed the overall risk of developing an SPM among cancer survivors from an overall perspective 3, 30, 31, 32, our study focused on the prediction from a more accurate perspective. Patients’ risk of SPMs can be estimated if their characteristics are given. The DCA further confirmed that the nomogram yielded superior net benefit in clinical scenarios. Moreover, a web‐based predictive system, which enhanced the convenience for patients and clinicians, was provided. This proposed nomogram is an important step toward the goal of easily identifying patients who have the potential to be diagnosed with new cancers.
Our study has several limitations. First, because of the nature of the SEER data, we were not able to adjust for some well‐known cancer risk factors such as family history, chemotherapy, tumor markers, lifestyle characteristics, and other potentially important information for SPMs. However, we found statistically meaningful associations between some factors and SPM, and our model has shown the ability to stratify patients with CRC with a relatively high risk of developing an SPM. Second, SPMs could have been overestimated when metastases might be misclassified as SPMs or a 2‐month interval exclusion was not enough to distinguish an SPM from the initial simultaneous cancers. Nevertheless, strict quality control was ensured during the collection of SEER data to reduce potential misclassification 13, and a sensitive analysis with a stricter time‐interval criterion of 6 months (used by the International Agency for Research on Cancer) was also conducted, providing results that were similar to those of our study. Finally, although our proposed model was validated using the bootstrap approach, it still needs further external validation with other populations. In addition, the most vulnerable SPM sites and their time‐courses need further study to provide more comprehensive surveillance strategies for CRC survivors.
Conclusion
We developed a clinically useful competing‐risk nomogram to predict SPM risk based on individual clinical factors using a large CRC population cohort. Our study revealed that older age, male sex, white or black race, localized disease, and treatment with surgery in patients with colon cancer were associated with an increased risk of developing an SPM. Furthermore, a web‐based evaluation system based on a competing‐risk nomogram, which is convenient and user‐friendly for both clinicians and patients, has also been provided (http://biostat.fudan.edu.cn/crc). Our findings could be useful to clinicians and caregivers for the clinical counseling of patients with CRC and the development of risk‐adapted long‐term management. However, further studies on targeted surveillance and screening strategies for SPMs are needed.
Author Contributions
Conception/design: Huixun Jia, Xiaodong Sun, Zhenyu Wu
Provision of study material or patients: Huixun Jia, Qingguo Li, Zhenyu Wu
Collection and/or assembly of data: Huixun Jia, Qingguo Li, Jing Yuan, Zhenyu Wu
Data analysis and interpretation: Huixun Jia, Jing Yuan, Zhenyu Wu
Manuscript writing: Huixun Jia, Qingguo Li, Jing Yuan, Xiaodong Sun, Zhenyu Wu
Final approval of manuscript: Huixun Jia, Qingguo Li, Jing Yuan, Xiaodong Sun, Zhenyu Wu
Disclosures
The authors indicated no financial relationships.
Supporting information
See http://www.TheOncologist.com for supplemental material available online.
Supplemental Table
Supplemental Figures
Disclosures of potential conflicts of interest may be found at the end of this article.
Contributor Information
Xiaodong Sun, Email: drsunxiaodong@126.com.
Zhenyu Wu, Email: zyw@fudan.edu.cn.
References
- 1. Siegel RL, Miller KD, Jemal A. Cancer statistics, 2019. CA Cancer J Clin 2019;69:7–34. [DOI] [PubMed] [Google Scholar]
- 2. Cancer Stat Facts: Colorectal Cancer . National Cancer Institute: Surveillance, Epidemiology, and End Results Program Web site. Available at https://seer.cancer.gov/statfacts/html/colorect.html. Accessed January 9, 2020.
- 3. Donin N, Filson C, Drakaki A et al. Risk of second primary malignancies among cancer survivors in the United States, 1992 through 2008. Cancer 2016;122:3075–3086. [DOI] [PMC free article] [PubMed] [Google Scholar]
- 4. Simapivapan P, Boltong A, Hodge A. To what extent is alcohol consumption associated with breast cancer recurrence and second primary breast cancer?: A systematic review. Cancer Treat Rev 2016;50:155–167. [DOI] [PubMed] [Google Scholar]
- 5. Utada M, Ohno Y, Hori M et al. Incidence of multiple primary cancers and interval between first and second primary cancers. Cancer Sci 2014;105:890–896. [DOI] [PMC free article] [PubMed] [Google Scholar]
- 6. Travis LB, Fossa SD, Schonfeld SJ et al. Second cancers among 40,576 testicular cancer patients: Focus on long‐term survivors. J Natl Cancer Inst 2005;97:1354–1365. [DOI] [PubMed] [Google Scholar]
- 7. Adjei Boakye E, Buchanan P, Hinyard L et al. Trends in the risk and burden of second primary malignancy among survivors of smoking‐related cancers in the United States. Int J Cancer 2019;145:143–153. [DOI] [PubMed] [Google Scholar]
- 8. Travis LB. The epidemiology of second primary cancers. Cancer Epidemiol Biomarkers Prev 2006;15:2020–2026. [DOI] [PubMed] [Google Scholar]
- 9. Han SS, Rivera GA, Tammemagi MC et al. Risk stratification for second primary lung cancer. J Clin Oncol 2017;35:2893–2899. [DOI] [PMC free article] [PubMed] [Google Scholar]
- 10. Baba Y, Yoshida N, Kinoshita K et al. Clinical and prognostic features of patients with esophageal cancer and multiple primary cancers: A retrospective single‐institution study. Ann Surg 2018;267:478–483. [DOI] [PubMed] [Google Scholar]
- 11. Kim C, Chon H, Kang B et al. Prediction of metachronous multiple primary cancers following the curative resection of gastric cancer. BMC Cancer 2013;13:394. [DOI] [PMC free article] [PubMed] [Google Scholar]
- 12. Details about SEER*Stat Databases: November 2017 Submission . National Cancer Institute: Surveillance, Epidemiology, and End Results Program Web site. Available at https://seer.cancer.gov/data-software/documentation/seerstat/nov2017. Accessed February 25, 2019.
- 13. Curtis RE, Freedman DM, Ron E et al. New Malignancies Among Cancer Survivors: SEER Cancer Registries, 1973‐2000. NIH Publication no. 5‐5302. Bethesda, MD: National Cancer Institute, 2006.
- 14. Austin PC, Fine JP. Accounting for competing risks in randomized controlled trials: A review and recommendations for improvement. Stat Med 2017;36:1203–1209. [DOI] [PMC free article] [PubMed] [Google Scholar]
- 15. Austin PC, Lee DS, Fine JP. Introduction to the analysis of survival data in the presence of competing risks. Circulation 2016;133:601–609. [DOI] [PMC free article] [PubMed] [Google Scholar]
- 16. Fine JP, Gray RJ. A proportional hazards model for the subdistribution of a competing risk. J Am Stat Assoc 1999;94:496–509. [Google Scholar]
- 17. Vickers AJ, Van Calster B, Steyerberg EW. Net benefit approaches to the evaluation of prediction models, molecular markers, and diagnostic tests. BMJ 2016;352:i6. [DOI] [PMC free article] [PubMed] [Google Scholar]
- 18. Morton LM, Swerdlow AJ, Schaapveld M et al. Current knowledge and future research directions in treatment‐related second primary malignancies. EJC Suppl 2014;12:5–17. [DOI] [PMC free article] [PubMed] [Google Scholar]
- 19. Morton LM, Onel K, Curtis RE et al. The rising incidence of second cancers: Patterns of occurrence and identification of risk factors for children and adults. Am Soc Clin Oncol Educ Book 2014;e57–e67. [DOI] [PubMed] [Google Scholar]
- 20. Murphy CC, Gerber DE, Pruitt SL. Prevalence of prior cancer among persons newly diagnosed with cancer: An initial report from the Surveillance, Epidemiology, and End Results Program. JAMA Oncol 2018;4:832–836. [DOI] [PMC free article] [PubMed] [Google Scholar]
- 21. Laccetti AL, Pruitt SL, Xuan L et al. Effect of prior cancer on outcomes in advanced lung cancer: Implications for clinical trial eligibility and accrual. J Natl Cancer Inst 2015;107:djv002. [DOI] [PMC free article] [PubMed] [Google Scholar]
- 22. Gerber DE, Laccetti AL, Xuan L et al. Impact of prior cancer on eligibility for lung cancer clinical trials. J Natl Cancer Inst 2014;106:dju302. [DOI] [PMC free article] [PubMed] [Google Scholar]
- 23. Evans HS, Moller H, Robinson D et al. The risk of subsequent primary cancers after colorectal cancer in southeast England. Gut 2002;50:647–652. [DOI] [PMC free article] [PubMed] [Google Scholar]
- 24. Levi F, Randimbison L, Blanc‐Moya R et al. High constant incidence of second primary colorectal cancer. Int J Cancer 2013;132:1679–1682. [DOI] [PubMed] [Google Scholar]
- 25. Smith MJ, Smith HG, Mahar AL et al. The impact of additional malignancies in patients diagnosed with gastrointestinal stromal tumors. Int J Cancer 2016;139:1744–1751. [DOI] [PubMed] [Google Scholar]
- 26. Raj KP, Taylor TH, Wray C et al. Risk of second primary colorectal cancer among colorectal cancer cases: A population‐based analysis. J Carcinog 2011;10:6. [DOI] [PMC free article] [PubMed] [Google Scholar]
- 27. Thong MS, Mols F, Verhoeven RH et al. Multiple primary cancer survivors have poorer health status and well‐being than single primary cancer survivors: A study from the population‐based PROFILES registry. Psychooncology 2013;22:1834–1842. [DOI] [PubMed] [Google Scholar]
- 28. Belcher SM, Hausmann EA, Cohen SM et al. Examining the relationship between multiple primary cancers and psychological distress: A review of current literature. Psychooncology 2017;26:2030–2039. [DOI] [PubMed] [Google Scholar]
- 29. Park SM, Lim MK, Jung KW et al. Prediagnosis smoking, obesity, insulin resistance, and second primary cancer risk in male cancer survivors: National Health Insurance Corporation Study. J Clin Oncol 2007;25:4835–4843. [DOI] [PubMed] [Google Scholar]
- 30. Phipps AI, Chan AT, Ogino S. Anatomic subsite of primary colorectal cancer and subsequent risk and distribution of second cancers. Cancer 2013;119:3140–3147. [DOI] [PMC free article] [PubMed] [Google Scholar]
- 31. Hayat MJ, Howlader N, Reichman ME et al. Cancer statistics, trends, and multiple primary cancer analyses from the Surveillance, Epidemiology, and End Results (SEER) Program. The Oncologist 2007;12:20–37. [DOI] [PubMed] [Google Scholar]
- 32. Rombouts A, Hugen N, Elferink M et al. Incidence of second tumors after treatment with or without radiation for rectal cancer. Ann Oncol 2017;28:535–540. [DOI] [PubMed] [Google Scholar]
Associated Data
This section collects any data citations, data availability statements, or supplementary materials included in this article.
Supplementary Materials
See http://www.TheOncologist.com for supplemental material available online.
Supplemental Table
Supplemental Figures