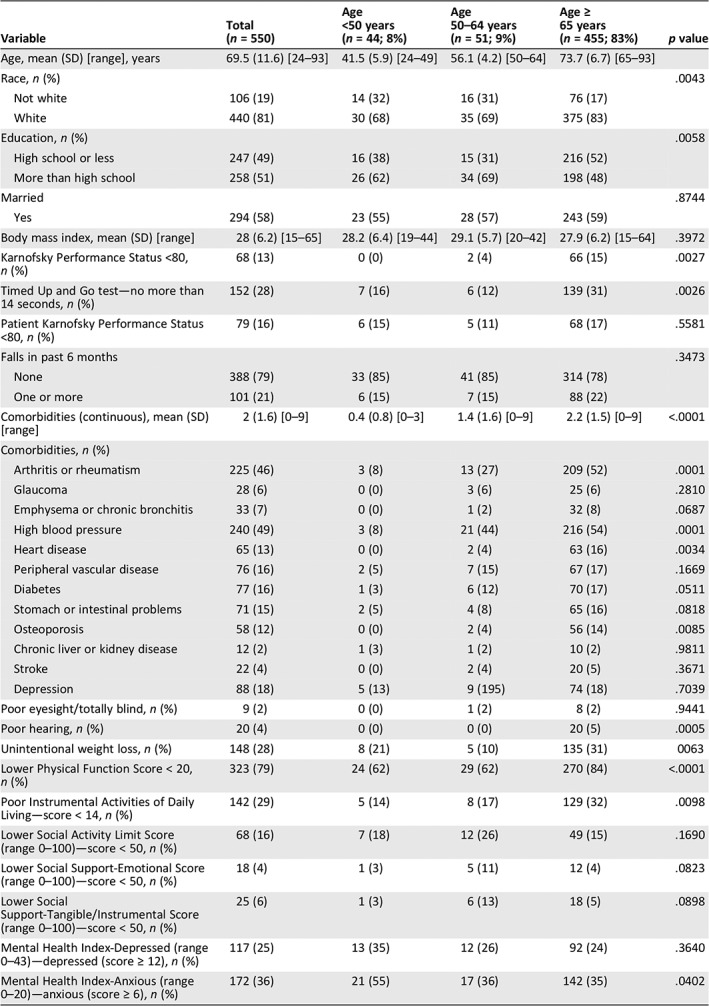
Table 1.
Study participant characteristics before chemotherapy (n = 550)
| Variable | Total (n = 550) | Age <50 years (n = 44; 8%) | Age 50–64 years (n = 51; 9%) | Age ≥ 65 years (n = 455; 83%) | p value |
|---|---|---|---|---|---|
| Age, mean (SD) [range], years | 69.5 (11.6) [24–93] | 41.5 (5.9) [24–49] | 56.1 (4.2) [50–64] | 73.7 (6.7) [65–93] | |
| Race, n (%) | .0043 | ||||
| Not white | 106 (19) | 14 (32) | 16 (31) | 76 (17) | |
| White | 440 (81) | 30 (68) | 35 (69) | 375 (83) | |
| Education, n (%) | .0058 | ||||
| High school or less | 247 (49) | 16 (38) | 15 (31) | 216 (52) | |
| More than high school | 258 (51) | 26 (62) | 34 (69) | 198 (48) | |
| Married | .8744 | ||||
| Yes | 294 (58) | 23 (55) | 28 (57) | 243 (59) | |
| Body mass index, mean (SD) [range] | 28 (6.2) [15–65] | 28.2 (6.4) [19–44] | 29.1 (5.7) [20–42] | 27.9 (6.2) [15–64] | .3972 |
| Karnofsky Performance Status <80, n (%) | 68 (13) | 0 (0) | 2 (4) | 66 (15) | .0027 |
| Timed Up and Go test—no more than 14 seconds, n (%) | 152 (28) | 7 (16) | 6 (12) | 139 (31) | .0026 |
| Patient Karnofsky Performance Status <80, n (%) | 79 (16) | 6 (15) | 5 (11) | 68 (17) | .5581 |
| Falls in past 6 months | .3473 | ||||
| None | 388 (79) | 33 (85) | 41 (85) | 314 (78) | |
| One or more | 101 (21) | 6 (15) | 7 (15) | 88 (22) | |
| Comorbidities (continuous), mean (SD) [range] | 2 (1.6) [0–9] | 0.4 (0.8) [0–3] | 1.4 (1.6) [0–9] | 2.2 (1.5) [0–9] | <.0001 |
| Comorbidities, n (%) | |||||
| Arthritis or rheumatism | 225 (46) | 3 (8) | 13 (27) | 209 (52) | .0001 |
| Glaucoma | 28 (6) | 0 (0) | 3 (6) | 25 (6) | .2810 |
| Emphysema or chronic bronchitis | 33 (7) | 0 (0) | 1 (2) | 32 (8) | .0687 |
| High blood pressure | 240 (49) | 3 (8) | 21 (44) | 216 (54) | .0001 |
| Heart disease | 65 (13) | 0 (0) | 2 (4) | 63 (16) | .0034 |
| Peripheral vascular disease | 76 (16) | 2 (5) | 7 (15) | 67 (17) | .1669 |
| Diabetes | 77 (16) | 1 (3) | 6 (12) | 70 (17) | .0511 |
| Stomach or intestinal problems | 71 (15) | 2 (5) | 4 (8) | 65 (16) | .0818 |
| Osteoporosis | 58 (12) | 0 (0) | 2 (4) | 56 (14) | .0085 |
| Chronic liver or kidney disease | 12 (2) | 1 (3) | 1 (2) | 10 (2) | .9811 |
| Stroke | 22 (4) | 0 (0) | 2 (4) | 20 (5) | .3671 |
| Depression | 88 (18) | 5 (13) | 9 (195) | 74 (18) | .7039 |
| Poor eyesight/totally blind, n (%) | 9 (2) | 0 (0) | 1 (2) | 8 (2) | .9441 |
| Poor hearing, n (%) | 20 (4) | 0 (0) | 0 (0) | 20 (5) | .0005 |
| Unintentional weight loss, n (%) | 148 (28) | 8 (21) | 5 (10) | 135 (31) | 0063 |
| Lower Physical Function Score < 20, n (%) | 323 (79) | 24 (62) | 29 (62) | 270 (84) | <.0001 |
| Poor Instrumental Activities of Daily Living—score < 14, n (%) | 142 (29) | 5 (14) | 8 (17) | 129 (32) | .0098 |
| Lower Social Activity Limit Score (range 0–100)—score < 50, n (%) | 68 (16) | 7 (18) | 12 (26) | 49 (15) | .1690 |
| Lower Social Support‐Emotional Score (range 0–100)—score < 50, n (%) | 18 (4) | 1 (3) | 5 (11) | 12 (4) | .0823 |
| Lower Social Support‐Tangible/Instrumental Score (range 0–100)—score < 50, n (%) | 25 (6) | 1 (3) | 6 (13) | 18 (5) | .0898 |
| Mental Health Index‐Depressed (range 0–43)—depressed (score ≥ 12), n (%) | 117 (25) | 13 (35) | 12 (26) | 92 (24) | .3640 |
| Mental Health Index‐Anxious (range 0–20)—anxious (score ≥ 6), n (%) | 172 (36) | 21 (55) | 17 (36) | 142 (35) | .0402 |

